Abstract - Harvard Business School Files/Manuscript_CA_March_SSRN... · Abstract We explore the...
46
1 The Impact of Corporate Social Responsibility on Investment Recommendations: Analysts’ Perceptions and Shifting Institutional Logics Ioannis Ioannou and George Serafeim Abstract We explore the impact of corporate social responsibility (CSR) ratings on sell-side analysts’ assessments of firms’ future financial performance. We suggest that when analysts perceive CSR as an agency cost, due to the prevalence of an agency logic, they produce pessimistic recommendations for firms with high CSR ratings. Moreover, we theorize that over time, the emergence of a stakeholder focus, and the gradual weakening of the agency logic, shifts the analysts’ perceptions of CSR ratings and results in increasingly less pessimistic recommendations for firms with high CSR ratings. Using a large sample of publicly traded US firms over 15 years, we confirm that in the early 1990s, analysts issue more pessimistic recommendations for firms with high CSR ratings. However, in more recent years analysts progressively assess these firms less pessimistically, and eventually they assess them optimistically. Furthermore, we find that more experienced analysts and analysts at higher-status brokerage houses are the first to shift the relation between CSR ratings and investment recommendation optimism. We find no significant link between firms’ CSR ratings and analysts’ forecast errors, indicating that learning is unlikely to account for the observed shifts in recommendations. Ioannis Ioannou is an Assistant Professor at London Business School. George Serafeim is an Assistant Professor at Harvard Business School. We are grateful to Joshua Margolis, Constantinos Markides, Markus Reitzig, Rodolphe Durand, Olga Hawn, seminar participants at the research brown bag (SE area) of the London Business School, the academic conference on Social Responsibility at University of Washington - Tacoma, the 2010 European Academy of Management Conference anonymous referees and participants, the 2010 Academy of Management Conference anonymous referees and participants and the 2010 Strategic Management Society meeting anonymous referees and participants. Ioannou acknowledges financial support from the Research and Materials Development Fund (RAMD) at the London Business School. Serafeim acknowledges financial support from the Division of Faculty and Research Development at the Harvard Business School All remaining errors are our own.
-
Upload
nguyennguyet -
Category
Documents
-
view
215 -
download
2
Transcript of Abstract - Harvard Business School Files/Manuscript_CA_March_SSRN... · Abstract We explore the...

1
The Impact of Corporate Social Responsibility on Investment Recommendations:
Analysts’ Perceptions and Shifting Institutional Logics
Ioannis Ioannou and George Serafeim
Abstract
We explore the impact of corporate social responsibility (CSR) ratings on sell-side analysts’ assessments
of firms’ future financial performance. We suggest that when analysts perceive CSR as an agency cost, due
to the prevalence of an agency logic, they produce pessimistic recommendations for firms with high CSR
ratings. Moreover, we theorize that over time, the emergence of a stakeholder focus, and the gradual
weakening of the agency logic, shifts the analysts’ perceptions of CSR ratings and results in increasingly
less pessimistic recommendations for firms with high CSR ratings. Using a large sample of publicly traded
US firms over 15 years, we confirm that in the early 1990s, analysts issue more pessimistic
recommendations for firms with high CSR ratings. However, in more recent years analysts progressively
assess these firms less pessimistically, and eventually they assess them optimistically. Furthermore, we find
that more experienced analysts and analysts at higher-status brokerage houses are the first to shift the
relation between CSR ratings and investment recommendation optimism. We find no significant link
between firms’ CSR ratings and analysts’ forecast errors, indicating that learning is unlikely to account for
the observed shifts in recommendations.
Ioannis Ioannou is an Assistant Professor at London Business School. George Serafeim is an Assistant Professor at
Harvard Business School. We are grateful to Joshua Margolis, Constantinos Markides, Markus Reitzig, Rodolphe
Durand, Olga Hawn, seminar participants at the research brown bag (SE area) of the London Business School, the
academic conference on Social Responsibility at University of Washington - Tacoma, the 2010 European Academy
of Management Conference anonymous referees and participants, the 2010 Academy of Management Conference
anonymous referees and participants and the 2010 Strategic Management Society meeting anonymous referees and
participants. Ioannou acknowledges financial support from the Research and Materials Development Fund (RAMD)
at the London Business School. Serafeim acknowledges financial support from the Division of Faculty and Research
Development at the Harvard Business School All remaining errors are our own.

2
INTRODUCTION
In recent years, a growing number of companies are adopting various corporate social responsibility
(CSR) initiatives - the voluntary incorporation of social and environmental issues into a company’s business
model and operations (European Commission 2001) – in an attempt to meet the needs and expectations of
a range of stakeholders, including but not confined to the company’s shareholders. Meanwhile, numerous
information intermediaries have been established to gather and make publicly available information about
these CSR initiatives – what is termed as “CSR ratings” or “CSR scores” – thus rating and ranking
corporations across several dimensions of environmental, social, and corporate governance performance.
Not only information intermediaries, but also a number of voluntary reporting standards have emerged to
enable these information intermediaries to standardize the way they disclose their CSR ratings. Therefore,
CSR scores have increasingly become more credible but also more easily comparable across industries and
geographies. The adoption and implementation of CSR policies as well as the availability of CSR scores,
has in fact generated a growing interest by financial markets, and investment analysts in particular (Eccles,
Krzus & Serafeim 2011). Accordingly, given the pivotal role that financial markets play in the allocation
of scarce capital resources and in the derivation of a company’s market value, understanding whether and
in what ways these markets assess a firm’s CSR scores is critical. In this article, and in order to explore this
issue, we follow extensive prior research in adopting a sociological approach towards the processes and
mechanisms associated with the assessment of corporate policies by financial markets (Zuckerman, 1999;
Cetina & Bruegger, 2002; MacKenzie, 2003; Zajac & Westphal, 2004; Lok, 2010).
Specifically, we adopt a social constructionist view of financial markets and explore how the
weakening of the prevalent agency logic, due to the emergence of a stakeholder orientation, is associated
with a shift in the way analysts respond to CSR ratings over a 15-year time horizon. Our theory derives
from a neo-institutional perspective which argues that organizational policies achieve legitimacy to the
extent that they are consistent with prevailing institutional logics or ‘historically-variant sets of
assumptions, beliefs, values, and rules by which individuals … interpret organizational reality and what

3
constitutes appropriate behavior’ (Thornton & Ocasio (1999): p.805; see also Zajac & Westphal (2004):
p.433). We posit that within an institutional context whereby CSR initiatives are perceived as serving
managerial objectives (i.e. an agency cost) rather than serving shareholders’ interests (Atkinson &
Galaskiewicz, 1988; Galaskiewicz, 1997), analysts’ reactions in the form of investment recommendations
will be more pessimistic the higher the CSR scores of the focal company are. Subsequently, we argue for a
gradual weakening of this agency-based institutional logic through the emergence of a stakeholder
orientation. Within this emerging perspective, CSR increasingly becomes more legitimate in the eyes of
both shareholders and analysts, and is consequently perceived as a set of activities that companies should
undertake as insurance-like protection for the relationship-based intangible assets (Godfrey, 2005) or even
as activities that may positively contribute towards profitability (Margolis, Elfenbein, & Walsh, 2007).
Therefore, we posit that in later time periods, companies with higher CSR scores will be associated with
increasingly less pessimistic analysts’ recommendations, and eventually, they may even be associated with
optimistic recommendations.
Relatedly, prior articles have explored how a shift in the prevalent institutional logic may lead to
changes in the interpretation of a particular corporate policy. For example, Zajac et al. (2004) show that the
market’s reaction to stock repurchase plans changes as the prevalent logic shifts: while under a “corporate
logic” the market reacts positively to stock repurchase plans, under an agency logic it reacts negatively
towards the very same plans. Similarly, a series of articles by Thornton and co-authors focused on the
publishing industry show that a shift from an “editorial” logic to a “market” logic results in changes in
executive succession, organizational structure and even acquisition targets (Thornton & Ocasio, 1999;
Thornton, 2001, 2002). Importantly, scholars have also explored the reactions and evaluations of market
intermediaries, observers and external third parties when companies adopt strategies consistent with or even
in contrast to the prevailing or shifting institutional logic (e.g. Polos, Hannan, & Carroll, 2002; Hannan,
Polos, & Carroll, 2004; Durand, Rao, & Monin, 2007; Philippe & Durand, 2011).

4
In this article, we theoretically argue and empirically test for the link between the weakening of the
agency logic through the emergence of a stakeholder orientation, and investment analysts’
recommendations for firms with high CSR scores, using a large sample of publicly traded US firms for the
period 1993 to 2007. Specifically, using consensus (mean) analyst recommendation in the focal firm-year
as the dependent variable, and a composite CSR strengths score constructed with data from Kinder,
Lyndenberg and Domini (KLD) as the independent variable of interest, we find that in the early 1990s,
analysts issue more pessimistic recommendations for firms with high CSR scores. Over time and leading
to 2007, analysts issue increasingly less pessimistic and eventually, optimistic recommendations for firms
with higher CSR scores. In addition, we argue that more experienced analysts as well as higher-status
brokerage houses are more likely to be the first to shift their reactions towards less pessimistic (more
optimistic) recommendations for such firms. We therefore develop and provide evidence for a more
nuanced understanding of the sociological processes associated with the perceptions and assessments of
firms with high CSR scores by analysts during times of change in the prevailing institutional logic.
With our work we make some other key contributions. First, we contribute to the literature that
explores the sociological mechanisms through which corporate policies are perceived and interpreted by
the financial markets (Zuckerman, 1999; Zajac & Westphal, 2004); more specifically, we contribute to the
sub-stream of literature that explores the role of intermediaries during periods when the prevailing logic
shifts (Polos et al., 2002; Hannan et al., 2004; Durand et al., 2007; Philippe & Durand, 2011). Second, to
the best of our knowledge, this article is the first to explore both theoretically and empirically, the role of
investment analysts and the processes that affect their reactions in the context of CSR ratings. Importantly,
it is the first one to empirically document the emergence of a new logic (i.e. a stakeholder orientation) that
appears to be weakening the dominant logic (i.e. agency) of the last forty or so years in financial markets.
We also contribute to the literature stream within CSR that seeks to understand the link between CSR and
the derivation of firm value in financial markets (e.g. Lee & Faff, 2009; El Ghoul, Guedhami, Kwok et al.,
2011; Goss & Roberts, 2011; Cheng, Ioannou, & Serafeim, 2014). Third, our article is linked to the recent

5
literature in strategy that explores analysts’ reactions as firms respond to radical technological change as
well as how these reactions affect firms’ subsequent responses (Benner, 2007, 2010; Benner &
Ranganathan, 2012). To the extent that analysts’ reactions may develop into institutional pressures, the
evidence we provide here hints towards the pressure that financial markets will be exerting on companies
to adopt more CSR policies in the future. Whereas most of the prior work on social construction of capital
markets has focused on issues of governance (e.g. stock repurchase plans, or incentives provision), our
work broadens the theoretical scope of social construction theory to argue that in addition to corporate
governance issues, social construction may intrinsically affect the perception and evaluation by analysts of
social and environmental initiatives that companies implement. Similarly, whereas the strategy literature to
date has explored analysts’ reactions to predominantly financial metrics or radical technological
innovations, our article broadens the scope of this literature as well, by exploring the impact of non-financial
metrics on investment recommendations. Finally, since CSR is generally regarded as a set of policies
adopted by corporations to meet the demands and expectations of multiple stakeholders, our article explores
how a shifting logic affects the perception and evaluation of such firm policies by a key stakeholder and
social actor in the capital markets, namely sell-side analysts.
THEORY AND HYPOTHESES
From Agency to Stakeholder Logics of CSR
Numerous articles have documented the emergence and institutionalization of the agency logic of corporate
control according to which a corporation is regarded as merely a nexus of contractual arrangements between
individuals (Jensen & Meckling, 1976; Williamson & Winter, 1993; Zajac & Westphal, 2004). Thus,
managers are assumed to be fungible agents of shareholders who are likely to pursue corporate actions that
advance their own personal interests at the expense of shareholder value (e.g. Fama & Jensen, 1983b, 1983a;
Useem, 1993; Davis & Thompson, 1994; Westphal & Zajac, 1995; Useem, 1996; Zajac & Westphal, 2004).
According to Zajac & Westphal (2004) and other scholars, such strong agency assumptions resulted in the
surfacing of a different model of economic resource allocation termed as “investor capitalism.” Assuming

6
that a firm is simply a set of contracts and that managerial action results in significant agency costs, the
“investor capitalism” model postulates that the capital allocation process is better left to investors rather
than managers (p. 436). Thus, contrary to existing dominant beliefs under a “corporate” logic, managers
and executives were no longer regarded as “professionals with unique strategic knowledge that is required
for efficient allocation of corporate resources” (Zajac & Westphal, 2004: 436). As expected, a number of
corporate policies were viewed and interpreted through the lens of this agency logic. For example, Zajac &
Westphal (1995) show that in the mid-to-late 1980s, executive incentive plans were justified as a
mechanism to align managerial and shareholder interests rather than a mechanism to attract and retain
scarce executive talent. Moreover, Zajac & Westphal (2004) show that due to the switch to the agency
logic, stock market reactions to repurchase plan adoptions shifted from negative to positive over time.
In the accounting and finance literature numerous articles provide evidence that investment
analysts’ expectations of a focal company’s future growth and performance are in fact a good proxy for the
expectations of the company’s own shareholders (Fried & Givoly, 1982; O’Brien, 1988; Abarbanell, Lanen,
& Verrecchia, 1995). More generally, these sell-side analysts are employed by brokerage houses and
research firms, they track the performance of a specific set of firms over time, and they generate and publish
two main products: forecasts of future earnings as well as investment recommendations that clients buy,
sell, or hold their shares in the stocks of these firms. The same literature provides ample evidence that
market participants extensively use these products, and documents their significant influence over stock
prices and trading volumes (Stickel, 1995; Womack, 1996; Francis & Soffer, 1997; Barber, Lehavy,
McNichols et al., 2001). From a sociological perspective, Zuckerman (1999) notes that “analysts serve as
“surrogate investors” (cf. Hirsch (1972)) in that their recommendations and forecasts significantly affect
investor appetite for a firm’s shares. Indeed, while analysts often disagree amongst themselves on a firm’s

7
prospects (Kandel & Pearson, 1995), certain currents of opinion, especially when voiced by prominent
analysts, significantly influence prices.”1 (p.1408)
Starting in the early 1990s, investment analysts started to witness the growing interest of companies
in adopting CSR programs, and began to explore publicly available CSR ratings and rankings provided by
third parties. For example, Paine (2003) reports the results from two early surveys of investors regarding
the broader domain of CSR and ethics: in the first one, a survey of US investors in 1993, 72% claimed to
consider a company’s ethics when deciding whether to invest in its stock.2 Importantly, a second survey
conducted in 1994 found that 26% of investors said that a company’s business practices and ethics were
extremely important to their investment decisions.3 Paine (2003) then concludes that “whether or not
investors themselves [were] are directly concerned about corporate conduct, they recognize[d] that others’
concerns can translate into financial consequences for the companies they invest in”.
However, early interpretations of CSR within the investor community appear to have been heavily
based on arguments that served as precursors to the subsequent formalization of agency theory: noticeably,
Nobel laureate Milton Friedman famously contended in 1970 in the New York Times Magazine that “the
social responsibility of the firm is to increase its profits” (Friedman, 1970) and even earlier, in his seminal
1962 book, he stated that “few trends could so thoroughly undermine the very foundations of our free
society as the acceptance by corporate officials of a social responsibility other than to make as much money
for their stockholders as possible”(p.133) (Friedman, 1962). In fact, Freeman et al. (2010) note: “Milton
1Relatedly Cohen et al. (2010) note “that sell-side analysts have an incentive to produce unbiased forecasts and recommendations
for investors only if they are compensated for such behavior. Due to a lack of data on direct compensation, the literature generally
tests this idea by linking analyst behavior to measures of implicit incentives or career concerns. Stickel (1992) finds that highly
rated “All-American” analysts (who are typically better compensated than other analysts) are more accurate earnings forecasters
than other analysts, suggesting that accuracy is rewarded. Similarly, Mikhail, Walther, and Willis (1999) document that poor
relative performance leads to job turnover.”
2According to Paine (2003), Corporate Ethics in America is a research study commissioned by the Society of Consumer Affairs
Professionals in Business Foundation and conducted by the Gallup Organization (Arlington, VA.: SOCAP Foundation, 1993),
pp.15-16
3Results of the survey conducted by the Council on Foundations and Walker Information in 1994 and are noted in Walker
Information, Measurements, vol. 7, no. 4 (Indianapolis, Ind.: Walker Information, 1998), p.2.

8
Friedman’s writings on social responsibility and the purpose of the firm have become canonical. Indeed,
much of the writing within finance, economics, and management for the past twenty-five years assumes not
only that his views – about why firms exist and to whom manages have obligations – are correct, but also
that existing US law is built upon them (Donaldson & Preston, 1995; Marens & Wicks, 1999)” (p.202).
Although such socially legitimate critiques of CSR-type policies predated the formal introduction and
institutionalization of agency theory, it is apparent that to a considerable extent, they may well be viewed
as precursors to agency theory itself. Indeed, as Lee (2008) notes, opponents of CSR during the 1960s and
1970s argued for segregated roles of economic and political actors and therefore, they advocated that social
problems should be left to politicians and civil society to deal with (p. 56). Thus, they perceived economic
and social goals to be separate and typically in conflict.4 In a similar spirit, later studies by Dewatripont,
Jewitt & Tirole (1999) argued that CSR may weaken managerial accountability and Atkinson &
Galaskiewicz (1988) focused on one aspect of CSR – namely, charitable giving – and showed that firms
with high levels of CEO ownership give less generously to charities than firms with low levels of CEO
ownership. They interpret this finding as evidence of better alignment between CEO and shareholder
incentives when CEO ownership is higher.5
Influenced by the overarching agency logic, analysts and investors interpreted CSR as meeting the
expectations of non-shareholding stakeholders, and in the process destroying shareholder wealth (i.e. they
perceived CSR merely as a transfer payment). This is not to imply of course, that advocates of CSR did not
exist during this time (see for example early works by (Andrews, 1971; Steiner, 1971; Davis, 1973; Sethi,
4 We note that such views already contained important commonalities with the agency logic, even though they also contained some
differences. For example, the business community regarded social responsibility as bad for business in the 1960s and early 1970s,
yet this is a view that does not necessarily require that managers are self-maximizing at the expense the shareholders (as the
formalized agency theory would predict). We thank an anonymous reviewer for pointing this out to us.
5 Overall though, empirical work at the time found mixed results regarding the existence of agency costs. For example, (Navarro,
1988) finds that charitable contributions can be profit maximizing if they act as a kind of advertising expense or a quasi-fringe
benefit for employees. Also, in a follow-up article, (Galaskiewicz, 1997) finds mixed support for agency theory; a large outside
shareholder has no impact on contributions. If agency costs were present, a large outside shareholder would exercise more control
over management and therefore lower charitable contributions.

9
1975; Carroll, 1979). Nonetheless, the institutionalization of the agency logic as documented in the
literature, not only gave stronger social legitimacy to prior arguments against CSR-type policies but also,
it appears to have dominated analysts’ and investors’ perceptions and interpretations of both CSR as well
as several other corporate policies (Useem, 1993; Davis & Thompson, 1994; Westphal & Zajac, 1994;
Useem, 1996; Zajac & Westphal, 2004). Against this background, we posit that in the early 1990s under
the prevalence of the agency logic, the perceptions of the investment community for firms that undertook
CSR were predominantly unfavorable, and therefore we predict that sell-side analysts’ recommendations
were more pessimistic towards firms with higher CSR scores.
Moreover, we argue that the subsequent gradual emergence and institutionalization of what has
been termed as the “Business Case for CSR” (Margolis et al., 2007) and the collective realization that CSR
may be an insurance-like protection for the relationship-based intangible assets of a company (Godfrey,
2005) or a risk-mitigation strategy, have weakened the agency logic by bringing to the forefront a wider
stakeholder focus. Therefore, we suggest that after the early 1990s, analysts’ perceptions and interpretations
of CSR will be affected by this shift in logics and hence, their recommendations will become less
unfavorable, and may even become favorable towards firms with high CSR ratings. Next, we present
several compelling reasons for why the interpretation of CSR through an agency logic is gradually
weakened by the emergence of a stakeholder orientation.
First, in many countries around the world, and especially in Europe, the socially responsible
investing (SRI) movement has been gaining significant momentum within the analyst and investor
communities, and it increasingly constitutes a non-negligible part of the global financial market. While
developing into its modern form, the SRI shifted away from an emphasis on ethics and towards the
incorporation of environmental, social and governance factors (i.e. CSR ratings) into investment decisions.
This type of integration became an investment strategy aimed at improving the risk-return profile of the
SRI portfolios but also, one that explicitly seeks to outperform the market rather than simply articulate an

10
ethical stance on behalf of its investors (Sparkes & Cowton, 2004)6. Paine (2003) estimates that if one
accounts for assets in all socially screened portfolios “the sector grew at a compound annualized rate of
74% between 1995 and 1999, compared to a rate of 25% for all mutual fund assets” to reach a total of $1.5
trillion under management by 1999 (compared to $16.3 trillion of total assets under management). She also
notes that throughout the 1990s, a number of mainstream brokerage firms launched funds and other
products to appeal to this sector, including Merrill Lunch, Smith Barney, Vanguard, UBS and Credit Suisse.
It is estimated that by 2015, global SRI will reach $26.5 trillion assets under management, representing
over 15% of the global total (Booz & Company 2012).
Reflecting the increasing penetration and institutionalization of the SRI wave in the analyst and
investor community, in 2003 the UNEP Finance Initiative (UNEP FI) found that “agreement [among
analysts] that environmental, social and corporate governance issues affect long-term shareholder value…
[and] in some cases those effects may be profound”. Two years later, in 2006, the UN launched the
Principles for Responsible Investing (UN PRI) mainstreaming SRI and coined the definition of
“Responsible Investors” as those investors who incorporate environmental, social and governance factors
into their investment process.7 Relatedly, Sparkes, and Cowton (2004) perform a comprehensive review of
the SRI literature and conclude that SRI “has become an investment philosophy adopted by a growing
proportion of large investment institutions” and that “this shift in SRI from margin to mainstream and the
position in which institutional investors find themselves is leading to a new form of SRI shareholder
pressure” (p.45, emphasis added). By the mid-2000s, even the language within the analyst and investor
6 Indicatively, we note that by 2007, mutual funds that integrated CSR ratings in their capital allocation decisions had assets under
management of more than $2.5 and $2 trillion dollars in the United States and Europe respectively. Similarly, socially conscious
funds in Canada, Japan and Australia held $500, $100 and $64 billion, respectively. In the last ten years, assets under management
of socially responsible investors grew considerably: funds in the United States, United Kingdom and Canada grew by $400, $600,
and $400 billion respectively, between 2001 and 2007. We calculated these numbers from information provided by national and
international organizations that track socially conscious funds, such as Eurosif, Social Investment Forum, Responsible Investment
Association Australasia, Social Responsible Organization, and SRI funds in Asia.
7 By April 2012, the UN PRI Global Network included more than 1,000 signatories with assets under management of approximately
$35 trillion. United Nations Principles for Responsible Investment, Annual Report 2012, (http://www.unpri.org/viewer/?file=wp-
content/uploads/Annualreport20121.pdf)
11
community began to shift: environmental, social and governance issues were now being jointly labeled as
“corporate sustainability”, rather than merely issues of CSR. This new terminology drew attention to the
fact that in addition to perpetual profitability (i.e. sustainable shareholder returns), corporations had to be
sustainable, and indeed thrive within their broader social and environmental context.
Another important milestone in the US was the establishment of a pressure group under the name
of “Ceres”, as early as 1989, by a group of North American investors whose goal was to leverage the
collective power of its investors to encourage both companies as well as capital markets to incorporate
environmental issues into their day-to-day decision-making. By now, Ceres represents one of the world’s
strongest investment groups with over 60 institutional investors managing over $4 trillion in assets.
Meanwhile, sustainability indices that emerged at stock exchanges around the world also captured the
attention of analysts and investors and reflected the further institutionalization of CSR. In 1999 for
example, the Dow Jones Sustainability Index was formed to evaluate the sustainability performance of the
largest 2,500 companies listed on the Dow Jones Global Total Stock Market Index. Several other indices
followed suit amongst which the most prominent were the FTSE4GOOD index, Ethibel, Domini 400 Social
Index, Vanguard Calvert Social Index Fund and the Corporate Governance Quotient (CGQ). Such
developments reflected and even reinforced the weakening of the prevalent agency logic, since CSR was
much less likely to be interpreted by the analyst community as an agency cost but rather, CSR was seen as
a means through which to address stakeholder needs and expectations.
Several key innovations in the governance and disclosure process of companies also reinforced a
broader stakeholder focus: the number of environmental and social issues that were the subject of
shareholder resolutions in the US increased significantly (Glac, 2010; Carroll, Lipartito, Post et al., 2012)
and these resolutions were increasingly becoming more successful (Mathiasen, Mell, & Gallimore, 2012).
Paine (2003) notes that by the year 2000, 242 out of a total 820 proposals submitted as part of the proxy
process in the US, were directly related to issues of the “environment, equal employment, and international
labor and human rights issues”. From 2008 through the first half of 2010, more than 200 institutional

12
investors and money managers, collectively controlling a total of at least $1.5 trillion in assets, filed or co-
filed shareholder resolutions on environmental, social and governance issues. Moreover, a new C-level
executive position was established at many companies around the world (e.g. AT&T, Blackstone, BT, Dow
Chemical, Nestle, SAP, Siemens, Unilever, among many others) to oversee sustainability-related issues.
Thus, CSR was no longer a peripheral issue (e.g. philanthropy) but rather, it increasingly became a core
strategic issue and a potential driver of innovation and long-term performance (Lubin & Esty, 2010; Kiron,
Kruschwitz, Haanaes et al., 2012). At the same time, the exponential growth of sustainability reporting as
well as its current transition to integrated reporting reflected the critical need to communicate such issues
to the analysts and markets.8
In sum, the above trends jointly point at an emerging shift in institutional logics within the analyst
community and the financial markets towards a stakeholder orientation and therefore, a re-interpretation of
CSR as a legitimate part of corporate strategy, minimizing operational risks and even contributing positively
towards long-term financial performance. Concurrently, stakeholder theory (Freeman, 1984; Freeman,
Harrison, & Wicks, 2007; Freeman et al., 2010) highlighted how critical it is for managers to integrate in
their decision-making process the interests and expectations of a broad and diverse set of stakeholders,
rather than to focus exclusively on the corporation’s shareholders as previously supported by the agency
logic. In fact, prior studies argue that ties with key stakeholders may mitigate the likelihood of negative
regulatory, legislative or fiscal action (Freeman, 1984; Berman, Wicks, Kotha et al., 1999; Hillman &
Keim, 2001), attract socially conscious consumers (Hillman & Keim, 2001), attract financial resources from
socially responsive investors (Kapstein, 2001), enhance access to finance (Ioannou & Serafeim, 2013) or
help poorly performing firms to recover from disadvantageous positions more quickly (Choi & Wang,
2009). In addition, stakeholder theory argues that CSR may lead to better performance by protecting and
enhancing corporate reputation (Fombrun & Shanley, 1990; Fombrun, 2005; Freeman et al., 2007).
8 For example, while only 26 firms issued a sustainability report in 1992, this number grew to 5,162 by 2010 (Eccles et al., 2011).
Concurrently, national governments and stock exchanges have promoted sustainability reporting by adopting laws and regulations
that specifically mandate this form of disclosure (Ioannou & Serafeim, 2012).

13
Empirically, numerous academic articles to date have sought to uncover the link between CSR and
financial performance (e.g. McWilliams & Siegel, 2000; Rowley & Berman, 2000; Hillman & Keim, 2001;
Margolis & Walsh, 2003; Orlitzky, Schmidt, & Rynes, 2003; Barnett & Salomon, 2006) albeit, without
directly exploring the perception of CSR by investment analysts. A comprehensive meta-analysis of this
stream of work by Margolis et al. (2007) finds a small positive yet significant impact of CSR on
profitability. The most recent article by Eccles et al. (2013) uses a matched sample methodology and finds
that sustainable organizations – defined as those organizations that voluntarily integrate social and
environmental issues into their strategy and business models – outperform their lower sustainability peers
over an 18 year horizon, both in stock market as well as operational performance.
Similarly, a long stream of literature explores the link between environmental performance
specifically, and financial performance (e.g. Russo & Fouts, 1997; King & Lenox, 2001; King & Lenox,
2002) while several literature reviews (Sharma & Starik, 2002; Etzion, 2007; Ambec & Lanoie, 2008;
Dixon-Fowler, Slater, Johnson et al., 2013) support the general finding of a positive relationship between
environmental and financial performance. In particular, the main arguments in these studies are that positive
environmental performance may represent a focus on innovation and operational efficiency (e.g. Porter &
Van der Linde, 1995), reflect superior organizational or management capabilities (e.g. Aragón-Correa,
1998), enhance a company’s legitimacy (e.g. Hart, 1995), and may empower the firm to meet the needs of
diverse stakeholders (e.g. Edward Freeman & Evan, 1991). Consequently, these academic findings jointly
provide solid justification and perhaps additional legitimization within the investment community for
interpreting and assessing corporate engagement with CSR through a stakeholder lens. Summarizing all of
the above discussion then, we formulate the following hypothesis:
Hypothesis 1: Over time, sell-side analysts’ recommendations will be less pessimistic for firms with
high CSR scores.
Although this trend may be traced, on average, across all analysts, it is also worth exploring how
heterogeneity within the analyst community itself, in conjunction with the weakening of the agency logic,

14
is associated with a potential shift in their investment recommendations over time. Exploring this
heterogeneity also provides a more nuanced understanding of the underlying sociological processes that
affect the derivation of firm value in financial markets during times of change in the overarching logic. On
the one hand, if one adheres to a strict version of the efficient market hypothesis, none of the analyst
attributes should matter: the potential advantages of any capital market participant are immediately
eliminated through the exploitation of arbitrage opportunities (for an overview see Sheffrin (1996)). Fama
(1965) for example, argues that analyst forecasts and recommendations are inconsequential for investors
and therefore, analysts should disappear, if the theory is right.
In this article on the other hand, we concur with existing literature arguing that there is at least a
“loose, socially mediated link” (Podolny, 1993) between an analyst’s experience and status and the quality
of her investment recommendations, similar to what has been suggested in other settings (e.g. Posner
(1990) on judges; (Schwartz, 1987; Fine, 1996) on politicians; (Lang & Lang, 1988; Kapsis, 1989) on
artists; Phillips & Zuckerman (2001) on analysts). In particular, prior work (Stickel, 1992; Sinha, Brown,
& Das, 1997; Clement, 1999) has documented systematic and time-persistent differences in analysts’
earnings forecast accuracy, and some articles have explained why this occurs by linking analyst
performance to observable analyst heterogeneity. Indicatively, Clement (1999) finds that a focal analyst’s
forecast accuracy is “positively associated with general and firm-specific forecasting experience and
employer size, and negatively associated with the number of firms and industries followed by the analyst”
(p.287).
Following this line of work, we regard analyst experience as a key variable for understanding the
heterogeneity across the analyst population in terms of their perceptions and associated investment
recommendations. Focusing on analyst experience is also consistent with the presence of a Matthew effect
in that higher-status actors (i.e. more experienced and therefore, more successful analysts) are likely to be
more protected for infringing norms than lower-status actors (Podolny, 1993; Rao, 1994; Durand et al.,
2007); therefore, they are more likely to switch behaviour to conform to an alternative emerging

15
institutional logic, that potentially weakens a previously established one. Empirically, work by Phillips and
Zuckerman (2001) shows that higher-status actors – in their case, Silicon Valley law firms and analysts –
are more likely to defy prevailing norms and role prescriptions, since they enjoy a higher degree of security
in their role incumbency. Indeed, Phillips and Zuckerman (2001) even postulate a U-shaped relationship
between status and conformity, arguing that low-status actors may feel free to defy accepted practice and
are also likely to deviate from expected norms since they have little to lose and are excluded regardless of
their actions (p. 380).
However, Hong et al. (2000) empirically document that analysts with less experience (equivalently,
lower status) are more likely to exhibit herding behavior (i.e. to conform), and thus, they are more likely to
be terminated due to inaccurate forecasts. In our context, fewer years of experience and resulting herding
behavior would therefore be associated with a higher likelihood of conforming to the prevailing agency
logic, and therefore a lower likelihood of shifting towards more optimistic recommendations when a new
logic in the form of a stakeholder orientation begins to emerge. Relatedly, Mikhail et al. (2003) find that
analysts who have more firm-specific forecasting experience generate more accurate forecasts and
positively affect the degree of information reflected in a firm’s market price. Consequently, we expect that
analysts with the most experience will be the first to switch from unfavorable to favorable assessments of
CSR scores over time whereas, given the findings of Hong et al. (2000), we would not expect to observe
deviations for the lowest-status analysts due to the higher likelihood of herding. In sum, we posit that the
most experienced analysts – equivalently, highest status – are more likely to defy the norms imposed by an
agency logic and consequently, they are more likely to be the first to issue more favourable
recommendations for firms with high CSR scores, reflecting the emergence of an institutional focus on
stakeholders. Thus, we formulate the following hypothesis:
Hypothesis 2: Over time, analysts with more experience are the first to become less pessimistic
towards firms with high CSR scores.
16
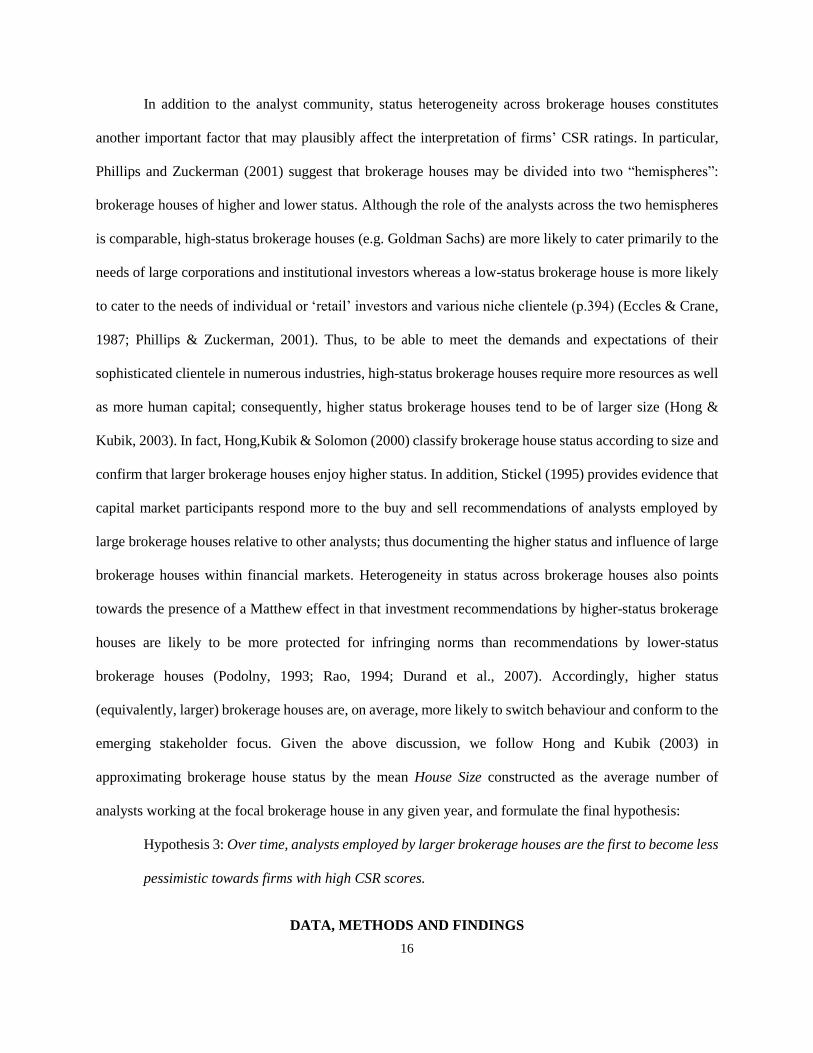
In addition to the analyst community, status heterogeneity across brokerage houses constitutes
another important factor that may plausibly affect the interpretation of firms’ CSR ratings. In particular,
Phillips and Zuckerman (2001) suggest that brokerage houses may be divided into two “hemispheres”:
brokerage houses of higher and lower status. Although the role of the analysts across the two hemispheres
is comparable, high-status brokerage houses (e.g. Goldman Sachs) are more likely to cater primarily to the
needs of large corporations and institutional investors whereas a low-status brokerage house is more likely
to cater to the needs of individual or ‘retail’ investors and various niche clientele (p.394) (Eccles & Crane,
1987; Phillips & Zuckerman, 2001). Thus, to be able to meet the demands and expectations of their
sophisticated clientele in numerous industries, high-status brokerage houses require more resources as well
as more human capital; consequently, higher status brokerage houses tend to be of larger size (Hong &
Kubik, 2003). In fact, Hong,Kubik & Solomon (2000) classify brokerage house status according to size and
confirm that larger brokerage houses enjoy higher status. In addition, Stickel (1995) provides evidence that
capital market participants respond more to the buy and sell recommendations of analysts employed by
large brokerage houses relative to other analysts; thus documenting the higher status and influence of large
brokerage houses within financial markets. Heterogeneity in status across brokerage houses also points
towards the presence of a Matthew effect in that investment recommendations by higher-status brokerage
houses are likely to be more protected for infringing norms than recommendations by lower-status
brokerage houses (Podolny, 1993; Rao, 1994; Durand et al., 2007). Accordingly, higher status
(equivalently, larger) brokerage houses are, on average, more likely to switch behaviour and conform to the
emerging stakeholder focus. Given the above discussion, we follow Hong and Kubik (2003) in
approximating brokerage house status by the mean House Size constructed as the average number of
analysts working at the focal brokerage house in any given year, and formulate the final hypothesis:
Hypothesis 3: Over time, analysts employed by larger brokerage houses are the first to become less
pessimistic towards firms with high CSR scores.
DATA, METHODS AND FINDINGS

17
We build our sample by combining several databases. We collect CSR scores from KLD, analysts’
recommendations from I/B/E/S, stock market data from CRSP and accounting data from COMPUSTAT.
The resulting sample includes a total of 16,064 observations with available data for all variables for the
period 1993 to 2007. Although the KLD database starts in 1992, we dropped data for the first year due to
the lack of I/B/E/S data that are only available after 1992. The sample increases over time and by 2007 we
have data for 2,311 US companies. Across all years, 3,580 unique companies are included in the sample.
We start with the firms in the KLD dataset and drop firms for one of three reasons: a) analysts’
recommendations were not available or forecast errors could not be calculated based on data from I/B/E/S
or b) stock market data were not available via CRSP or c) accounting data were not available through
COMPUSTAT.
Analytically, the model that we estimate at the firm-year level of analysis is:
meanrecit = β1 totstrit + β2 Xit+ β3Yit-1 + δ Zi +εit (1)
where, β1 is the coefficient of interest, Xit is a vector of control variables for firm i in year t including Total
Relative CSR Concerns, Number of Analysts, Mean House Size, and Long-term Forecast Error; Yit-1 is a
vector of (lagged) control variables for firm i in year t-1 including Market Value (size), Market Adjusted
Returns, Intangibles, Return-on-Assets, Earnings-to-Price-ratio, Book-to-Market Ratio and Capital
Expenditure; and Zi is a vector of fixed effects to capture constant effects of firm and year.
We use the consensus (i.e. mean) investment recommendation (Mean Analysts’ Recommendation)
for each firm i in the month of March of year t as the dependent variable of our empirical specifications
(meanrecit). The I/B/E/S database records analysts’ investment recommendations on a five-point scale with
1 indicating a “strong buy” recommendation and a 5 indicating a “sell” recommendation. We invert this
scale so that more favorable recommendations take a higher value. This variable is constructed by I/B/E/S
and reported in the consensus files. Essentially, for a given firm in the focal year, I/B/E/S first collects all
published analyst recommendations (in our case, for the month of March) and then constructs an equally
weighted average. Accordingly, for the focal firm in the focal year, our dependent variable is the average

18
of all the investment recommendations published by the analysts that follow the firm. I/B/E/S reports
consensus recommendations on the third Friday of each month and we select the March dataset in each year
to ensure that analysts have had enough time to obtain and analyze the firm-level CSR scores. We fit panel
data models that incorporate firm and year fixed effects exploiting within firm variation, and controlling
for time-invariant unobservable firm attributes.
In recent years, CSR scores provided by KLD have been widely used in the academic literature
(e.g. Graves & Waddock, 1994; Turban & Greening, 1997; Fisman, Heal, & Nair, 2005; Mattingly &
Berman, 2006; Godfrey, Merrill, & Hansen, 2009) and have in fact contributed towards the high
proliferation of CSR-related articles (Margolis et al., 2007).9 In our work, we use the KLD STATS
product.10 KLD provides CSR scores annually over the course of 15 years, making it an excellent data
resource for exploring longitudinal CSR research questions. Researchers at KLD review the company’s
public documents, including the annual report, the company website, corporate social responsibility
reporting, and other stakeholders’ and data sources. Company ratings represent a snapshot of the firm’s
CSR profile at calendar year end. KLD researchers also monitor media sources for developing issues on a
daily basis. The KLD STATS dataset is compiled around the beginning of every year (i.e. January) and it
is typically available in spreadsheets for distribution at the latest by early February. As we mention above,
to allow enough time for analysts to review these scores, we consider analyst recommendations for the
month of March (i.e. the month after the release of the KLD scores).11. Their historical ratings data set is
9 Studies have shown that this dataset exhibits robust construct validity around its underlying measures (e.g., (Scharfman, 1996;
Szwajkowski & Figlewicz, 1999; Mattingly & Berman, 2006)). More recently, however scholars have raised criticisms around
aspects of the dataset. For example, (Chatterji, Levine, & Toffel, 2009) find “little evidence that KLD’s environmental strengths
predicted any of the environmental outcomes” they analysed (p.162) although stating that “KLD environmental ratings do a
reasonable job of aggregating past environmental performance” and that “the single KLD net environmental score (environmental
strengths ratings minus environmental concerns ratings) and KLD’s total environmental concerns ratings helped predict future
pollution levels, the value and number of subsequent regulatory penalties, and whether firms eventually reported any major spills
(p.162).
10 For a detailed description of the various screens and criteria included in KLD STATS the interested reader can have a look at
KLD’s website at (www.kld.com) and more information about the specific database product we use at
(http://www.kld.com/research/stats/index.html)
11 In unreported results, and as a robustness check, we have also rerun our specifications using the April recommendations, allowing
more time for the analysts to review the CSR scores, with virtually no changes in our findings.

19
designed primarily as a binary system. For each strength (i.e. a positive screen) or concern (i.e. a negative
screen) rating applied to a company, KLD includes a "1" indicating the presence of that screen/criterion
and a "0" indicating its absence. In total, six issue areas are included: a) Community, b) Corporate
Governance, c) Diversity, d) Employee Relations, e) Product and f) Environmental Issues.
One issue faced by scholars that have used the KLD database in the past is how to construct a
composite CSR measure. In other words, how to assign weights to the six issue areas covered in the
database. Some articles have utilized differential category weights based on either (subjective) academic
opinions about category importance (Graves & Waddock, 1994; Waddock & Graves, 1997) or have used
the analytic hierarchy process to derive weights (Ruf, Muralidhar, & Paul, 1993). To date however, the
literature has not identified a theoretically derived ranking of importance for the various stakeholder groups
and issues to serve as a guide for empirical work. In fact, (Mitchell, Agle, & Wood, 1997) argue that finding
such a universal ranking is not even theoretically possible. In this paper, we follow the convention
established by Waddock and Graves (1997) and Sharfman (1996), followed by Hillman & Keim (2001)
and Waldman,Siegel & Javidan (2006) among many others, in developing a composite CSR score by
assigning equal importance (and thus equal weights) to the different issue areas of the KLD database. In
particular, Total CSR Strengths (totstrit) is the equally-weighted sum of KLD’s positive screens, classified
as “strengths”, for firm i in year t adjusted by the mean of strengths averaged across all firms in the sample
in year t to take into account firm entry into the KLD panel. In doing so, we also account for the trending
of CSR ratings within our sample. 12
Similarly, we construct Total CSR Concerns as a control variable, by deriving an equally-weighted
sum of KLD’s negative screens, classified as “concerns” for each firm in each year of our sample. By
distinguishing between CSR strengths and concerns, we follow several recent articles (e.g. Strike, Gao, &
Bansal, 2006; Kacperczyk, 2009; Bear, Rahman, & Post, 2010) in arguing that CSR and CSiR (Corporate
12 We also used another specification, where we averaged across firms within the same industry in the same year with virtually no
impact on our results.

20
Social Irresponsibility) are two theoretically separate and distinct constructs and should be treated as such
empirically. Indicatively, Godfrey et al. (2009) argue that the qualitative choice of engagement in CSR is
distinct from incurring negative fines or penalties, which they label as “negative social impacts”. Whereas
few prior articles have constructed a single CSR score by subtracting total concerns from total strengths
(e.g. Slater & Dixon-Fowler, 2009; Manner, 2010), we do not adopt this approach in our empirical analysis
because the theoretical rationale that we developed pertains specifically to the strategic choice of
corporations to engage in positive CSR (in order to meet stakeholder expectations) and how such policies
are interpreted and evaluated by investment analysts. Equivalently, we consider such a single measure of
CSR to be problematic since it is merging together fundamentally different and perhaps conflicting
underlying mechanisms: “doing good” is theoretically and strategically different from “doing no harm”.
We include several other control variables identified in prior literature as determinants of firm
performance and/or influencing investment recommendations. Following a number of prior articles (e.g.
Zuckerman, 1999) we control for the total number of analysts (Number of Analysts) who follow the firm in
the focal year; similar to the case of critics in other markets (Shrum, 1996; Eliashberg & Shugan, 1997),
the extent of analyst attention, as opposed to the specialization of their coverage, has been shown to affect
firm value (Zuckerman, 1999). We obtain one recommendation per analyst per firm in the focal year
therefore the number of analysts is the same as the number of investment recommendations for the focal
firm in the focal year. The natural logarithm of Market Value of equity is a proxy for firm size and is also
lagged by one year. Analysts might issue more favorable recommendations for larger firms since trading in
these firms generates more trading commissions and these firms are more likely to generate investment
banking business. The two revenues are the primary source of analyst compensation thereby incentivizing
analysts to be more optimistic about these companies. Market-adjusted return is the one-year lagged stock
return for the company over a fiscal year minus the stock return on the value-weighted index. We expect
better performing stocks to have more positive recommendations reflecting the tendency of analysts to
chase stock returns (Jegadeesh, Kim, Krische et al., 2004). Moreover, we include two control variables to

21
account for analysts’ characteristics: a) Mean House Size calculated as the average number of employees
for all the brokerage houses that employ an investment analyst who follows the focal firm, thus proxying
for the availability of resources that the analyst has at her disposal to perform her research (Clement, 1999)
and b) Long Term Forecast Error measuring the average long-term forecast error of the investment analysts
that follow the focal firm and which captures the mean analyst ability in terms of how accurately they can
predict a firm’s long-term performance (e.g. Mikhail, Walther, & Willis, 1997; Hong et al., 2000; Clement
& Tse, 2005; Loh & Mian, 2006). We adopt the standard methodology in the literature whereby the long-
term forecast error is defined and calculated as the realized long-term growth in earnings minus the analysts'
forecast of long-term growth in earnings. According to I/B/E/S, long-term growth forecasts are received
directly from contributing analysts, and are not calculated by I/B/E/S. It generally represents an expected
annual increase in operating earnings over the company’s next full business cycle. These forecasts typically
refer to a period of between three to five years.
We also include several time-varying firm characteristics that might influence analyst
recommendations and that control for the performance implications of other strategic actions of the firm.
First, we include two valuation ratios, (one-year lagged) earnings over price (Earnings-to-price ratio) and
(one-year lagged) shareholder’s book value over market value of equity (Book-to-market ratio). We expect
that all else equal, analysts will issue more favorable recommendations for firms with higher valuation
ratios (Jegadeesh et al., 2004). Second, we include controls for the profitability of the firm measured as
one-year lagged Return-on-assets (ROA), one-year lagged percentage of assets that are Intangibles, and
Capital expenditures as percentage of total assets. The latter two variables identify firms that grow either
by acquisitions or by investing in capital projects. We expect positive coefficients on all three variables
(Jegadeesh et al., 2004). Finally, we estimate the model by including year and firm fixed effects (Zi). We
cluster standard errors at the company level to mitigate serial correlation within a firm. We highlight here
that the panel data design of our regression analysis coupled with the firm and year fixed effects, allows us
to condition on the within-firm changes over time instead of the between-firm variation. This is particularly

22
relevant and important for testing our theory where estimation of the coefficients of interest is based on
longitudinal variation.
Descriptive Statistics
Table 1 panel A presents summary statistics for the variables used in our analysis. On average, a
firm in our sample has one CSR strength. However, considerable variation exists since the sample includes
firms with zero all the way to 15 CSR strengths; the standard deviation is approximately 1.5. The summary
statistics also show that our sample includes mainly large firms who are followed by several analysts; on
average there are about 11 investment recommendations per firm. Fourteen percent of the assets of the
average company are intangibles and the average company is profitable (mean ROA=8.2%). Moreover,
Table 1 panel B provides additional descriptive statistics pertaining to the analysts’ recommendations
included in the sample. Specifically, the second column of the panel presents the average number of years
of firm-specific experience that an analyst has in any given year. The rest of the columns report this average
broken down by type of recommendation (whereby, 1 = “strong buy” and 5 = “strong sell”). We note an
upward trend in the data due to the passing of time and thus, the accumulation of analyst experience, and
also due to the increased number of unique firms covered in the sample across years.
--------------------------------
Insert Table 1 about here
--------------------------------
Table 2 presents pair-wise correlations between the variables used in our empirical analysis. Total
CSR Strengths is negatively correlated with Mean Analyst Recommendation, indicating that on average,
across years and across firms, the analysts in our sample were unfavorable towards CSR ratings. In terms
of our control variables, Firm size and Number of Analysts have a strong positive correlation with Total
CSR Strengths as we would expect. Interestingly, the two controls for analyst ability, Mean House Size and
Long-term Forecast Error, are significantly negatively correlated with our dependent variable. Our
theoretical arguments however, are longitudinal in nature, and therefore the subsequent multivariate
analysis directly tests our hypotheses.

23
--------------------------------
Insert Table 2 about here
--------------------------------
Results
In table 3 panel B we present the main findings of estimating equation (1) on the full sample. In
particular, the first column of table 3 panel B estimates this equation on the first bundle of years that includes
observations for the period 1993-1996; each subsequent column adds an additional year to the data (i.e. the
second column estimates equation (1) for the period 1993-1997, the third, 1993-1998 and so forth).
Accordingly, the last column presents estimation results for equation (1) for the entire period 1993 – 2007
covered in our sample. The independent variable of interest is Total CSR Strengths. We estimate the model
on these different bundles of years to detect how the relation changes over time. Hypothesis 1 therefore
predicts that the coefficient on Total CSR Strengths would initially be negative and increasingly less
negative (or eventually positive). The estimates confirm this prediction. Graphically, figure 1 depicts the
estimated coefficient on Total CSR Strengths and shows that as time goes by analysts’ reactions to CSR
scores become increasingly less unfavorable, and eventually become favorable.
It is important to note that the number of unique firms increases across the columns of table 3 panel
B because KLD progressively expanded their coverage over our sample period. However, it is unlikely that
these changes would affect the findings since the specifications include firm fixed effects, and therefore the
coefficients are estimated from within firm variance over time rather than cross-sectional variation.
Nevertheless, we proceed to construct a relatively more balanced panel by limiting our sample to only
include firms that were present for at least 10 years of the sample period (i.e. two thirds of the time) –
obtaining 295 firms for 1993-1996, and ranging from 318 to 356 for the remaining time periods. We report
these findings as table 3 panel A, and since the estimates are qualitatively similar between panel A and
panel B, we consider panel A as our main results.
Moreover, we note that as expected, in the last couple of columns of table 3, panel A the coefficient
on Total CSR Strengths becomes statistically insignificant. The insignificance emerges because over time,

24
the underlying pooled data confounds the shifting perception of CSR scores by investment analysts; this
particularly applies for the columns where we pool data for the entire period 1993-2007 covered in our
sample. Finally, we note that the coefficient on Total CSR Concerns remains predominantly insignificant
across specifications, and does not follow any discernible pattern over time. This implies, as we suggest in
our theoretical development section, that the shifting institutional logic from an agency to a stakeholder
perspective is much more likely to affect pro-active CSR initiatives that are undertaken to meet the needs
and expectations of a wider range of stakeholder and are therefore perceived as potentially mitigating risks
or even generating firm value. On the other hand, investment analysts would unfavorably assess CSR
shortfalls and failures, whether these are perceived as an agency cost or as value-destructing activities. The
directionality of this argument appears to be supported in table 3 panel B: whenever statistically significant,
the coefficient on Total CSR Concerns is in fact negative.
--------------------------------------
Insert Table 3
---------------------------------------
Hypothesis 2 argues that more experienced analysts are more likely to be the first to switch from
unfavorable to favorable evaluations of firms with high CSR scores. Based on the full sample, we calculate
analyst experience as the total number of years that the focal analyst has followed the focal firm. Panel A
of table 4 replicates the models of table 3 (panel B) but confines the sample to the top two quartiles of
analyst experience whereas Panel B confines the sample to the bottom two quartiles of analyst experience.
Confirming hypothesis 2, the estimated coefficients indicate that the more experienced analysts issue more
favorable recommendations (equivalently, less unfavorable) over time and by the end of our sample period
(last three columns of table 4, panel A) their evaluations of firms with high CSR strengths become
significantly positive. In contrast, for the bottom two quartiles of analyst experience, assessment of CSR
scores remains unfavorable for the entire 1993 – 2007 period, although the estimated coefficient does
become somewhat less unfavorable over time. Graphically, figure 2 plots the estimated coefficients for the
top two and the bottom two quartiles of analyst experience, and shows that not only do the more experienced

25
analysts switch first to favorable recommendations but also, that they more rapidly adjust their
recommendations (i.e. the curve for the top two quartiles appears steeper than the one for the bottom two
quartiles of analyst experience). Similarly, table 5 tests hypothesis 3 according to which analysts employed
by larger brokerage houses are more likely to be the first to switch from unfavorable to favorable
evaluations of firms with high CSR scores. Accordingly, panels A and B replicate the models of table 3 but
this time the sample is confined to the top two and bottom two quartiles of the mean House Size,
respectively. Consistent with our hypothesis, we find that analysts employed by larger brokerage houses
are more likely to switch to favorable evaluations of firms with high CSR scores, over time.
--------------------------------------
Insert Tables 4 and 5 about here
---------------------------------------
Alternative Explanation: Learning by Analysts
A plausible alternative explanation for the findings presented here is that, over time, analysts learn
to evaluate CSR ratings by better understanding how CSR may contribute towards risk mitigation or value
creation. If this were indeed the case, analysts would be relatively pessimistic about the future profitability
of firms with high CSR scores and relatively optimistic about the future profitability of firms with low CSR
scores during the early periods of our sample. This underlying learning argument then, may plausibly
generate the pattern that we observe in the findings without the need to account for a potential shift in the
prevailing institutional logic (thus, generating a spurious correlation in table 3). A plethora of both
theoretical and empirical articles (e.g. Mikhail et al., 1997; Hong et al., 2000; Clement & Tse, 2005; Loh
& Mian, 2006) model analysts’ learning using Analyst Forecast Error; we follow this tradition here as well.
The main idea behind this metric is that if analysts are learning how to better evaluate a focal CSR policy
over time, then their earnings forecasts will increasingly become more accurate. In other words, we would
expect CSR scores to be significantly associated with forecast errors in the initial period of our sample and,
as analysts learn, we expect this significant association to diminish and eventually be eliminated. Panel A
of table 6 replicates the specifications of table 3 but uses Analyst Forecast Error as the dependent variable.

26
Because forecast errors increase with forecast horizon, we introduce a control variable for horizon in our
specifications as well. We find no statistically significant association between CSR scores and forecast error
for any specification across the two tables, suggesting that for the context and time period of our sample,
learning by analysts does not appear to be an alternative explanation for the estimated empirical pattern of
table 3.
--------------------------------
Insert Table 6 about here
--------------------------------
DISCUSSION AND CONCLUSION
We explore the sociological processes that affect the evaluation of firms with high CSR scores by
sell-side investment analysts in the US, over a period of 15 years. We argue and find empirical evidence
that a weakening of the prevailing logic – the agency logic – and the gradual emergence of a stakeholder
focus, leads to an initial unfavorable and a subsequent more favorable evaluation of firms with high CSR
scores by investment analysts. Whereas under an agency logic CSR was typically interpreted as an activity
that primarily generated managerial returns or satisfied managerial aspirations to the detriment of corporate
profitability (i.e. an agency cost), under a stakeholder logic, CSR is conceptualized as a set of corporate
policies essential to corporate standing that does not penalize a firm’s financial performance and may even
generate financial value in the long-run. Our article provides insights into the assessment of firms with high
CSR ratings, and suggests that firms may adopt CSR without being penalized by a key third party in the
financial markets, namely sell-side analysts.
As mentioned at the outset of this article, an emerging strand of literature has focused on the
relationship between CSR and financial markets but without explicitly taking into account the sociological
processes that affect the assessment of firms’ CSR ratings. According to extensive prior literature, in
financial markets such sociological processes have a direct and measurable impact on firm value (Phillips
& Zuckerman, 2001; Zajac & Westphal, 2004) making this an important gap that needs to be addressed.
Such sociological processes are particularly relevant for the domain of CSR where stakeholder expectations

27
and external assessments by third parties are especially salient. With this paper we begin to fill this gap in
our understanding by introducing the idea that the prevailing agency logic was weakened by the gradual
emergence of a stakeholder orientation within the analyst and investor community.
The findings of this article also provide support to the institutional perspective that focuses on how
financial markets perceive and assess policies such as those related to CSR. The theoretical arguments, as
well as the empirical evidence presented here provide additional support for the influence of historical
change on the dominant belief system or institutional logic of key market actors. Furthermore, we are able
to provide evidence that market actors who possess more experience or enjoy higher status are more likely
to be the first to adjust their assessments based on this new and emergent logic. We therefore contribute to
the sociological research that focuses on understanding the macro-historical and institutional changes in the
context, to the literature that focuses on the micro-social dynamics of financial markets (Abolafia, 1996;
Westphal & Zajac, 1998; Zuckerman, 1999) and to the more recent literature exploring the inputs to the
social estimation process that drives stock market valuation (Zajac & Westphal, 2004).
Our work also closely relates to a recent stream of work in management (Benner, 2007, 2010;
Benner & Ranganathan, 2012) that explores the reactions of investment analysts to the adoption of specific
firm strategies during times of radical technological change. In fact, these articles find that such reactions
exert pressures on firms and significantly affect their subsequent adoption of strategies. Given that in this
article we find an increasingly less unfavorable assessment of CSR ratings by analysts, especially by those
of higher experience and higher status, exploring how this shift in institutional logics will affect the
subsequent adoption of CSR by firms becomes an interesting avenue of future research. It would also be
important to understand the specific mechanisms through which such pressures are exerted on firms and
which firms are more likely to respond to them and in what ways. For example, some firms may increasingly
engage in CSR by ceremonially conforming to such pressures – in the form of symbolic actions – whereas
others may realize the value-creating potential and accordingly adopt a range of substantive CSR actions.

28
Whereas most of the prior work on social construction of capital markets (Zuckerman, 1999; Zajac
& Westphal, 2004) has focused on issues of governance (e.g. stock repurchase plans, or incentives
provision), our work here broadens the theoretical scope of social construction theory to argue that in
addition to governance issues, social construction may intrinsically affect analysts’ perceptions and
evaluations of social and environmental initiatives adopted by companies. Similarly, whereas the strategy
literature to date has explored analysts’ reactions to predominantly financial metrics or radical technological
innovations, our article expands the scope of this literature as well, by exploring the impact of non-financial
metrics on investment recommendations. Therefore, since CSR is considered as a set of policies adopted
by corporations to meet the needs and expectations of multiple stakeholders, our study is essentially
exploring how a shifting logic affects the perception and evaluation of firms’ actions aimed at numerous
and diverse stakeholders by a key social actor in the capital markets, namely sell-side analysts. Relatedly,
we note that a fruitful avenue of future research is to develop more nuanced theory and a deeper
understanding of the changing perceptions of analysts with regards to each of these stakeholders, as opposed
to exploring CSR as one multi-dimensional construct.
Finally, whereas in the existing finance literature herding behavior has typically been linked to
financial metrics (or, equivalently, instrumental outcomes), in this article we suggest that herding behavior
may also extend to domains beyond the financial, to include environmental, social and broader CSR issues.
Moreover, by exploring the heterogeneity across analysts and across brokerage houses, our article develops
a more nuanced understanding of how a shifting institutional logic affects different analysts and brokerage
houses differentially. Thus, to the best of our knowledge, our study is the first one to integrate across the
CSR and herding and finance literatures to shed new light on a phenomenon that is increasingly gaining
momentum in capital markets.
Limitations and Future Research
Despite its contributions, this article is not without its limitations; here, we highlight a few. The first, relates
to the potentially changing nature of the underlying policies captured by our CSR measures. If these policies

29
are themselves changing then the observed shift in sell-side analysts’ recommendations can be partly
attributed to such a change rather than the claimed change in the institutional logic. However, we consider
this to be rather unlikely given that the policies included in our CSR measures remain stable over time. For
example, diversity in the workforce, recycling of materials, and community engagement were captured and
quantified in the same way throughout our sample period. Moreover, there were no redefinitions of the
underlying constructs used in our analysis during our sample period. The second caveat relates to the
changing characteristics of the sell-side analyst profession itself. If sell-side analysts exhibit fundamentally
different individual characteristics over time, in terms of gender, educational background, social class, to
name a few, then these changing attributes could partly explain the changing assessment of CSR scores.
However, prior work that has explored ties formed across analysts based on common educational
backgrounds Cohen et al. (2010) does not appear to detect or argue for any such shifts over this time period
within the analyst profession. Undoubtedly, the ideal empirical test would have been to use a sample of
investment recommendations from a fixed set of sell-side analysts whom we would be able to follow for
over 15 years and who would issue recommendations for the same firms. However, such long tenures are
relatively rare and unusual within the sell-side analyst profession precluding us from being able to conduct
this type of analysis. Thus, by not including analyst fixed effects, our current analysis derives estimates not
from within-analyst variation, but rather from within-firm variation over time (since we include instead
firm fixed effects). Nevertheless, we are unaware of any other existing evidence that the employee base of
the sell-side analyst profession has changed systematically over the time period we study, thus making it
less likely that this issue could affect our findings. Similarly, we cannot include fixed effects at the
brokerage house level; instead, we include a control variable for mean house size across the analysts that
follow a focal firm in each year. Therefore, a potential systematic change in ideology or house culture
attributed to the institutional logic shift affecting the brokerage houses that follow a focal firm during the
years of our analysis, may introduce a bias in our findings. However, to the extent that this potential bias is

30
idiosyncratic to a focal firm and the brokerage houses that follow it, then this issue is accounted for by our
inclusion of firm fixed effects.
The weakening of the previously dominant agency logic that we document here appears to have
been taking place in the US over a 15-year horizon. A fruitful avenue for future research would be to
investigate how this change in institutional logic affected the speed with which the interpretation and
assessment of CSR changed by sell-side analysts in other countries. We know, for example, that some
countries, including Sweden, France, the UK, Canada, and South Africa have instituted more progressive
policies favoring the adoption of CSR by companies, potentially accelerating the institutional logic shift.
Accordingly, future work may seek to understand the institutional processes and characteristics that affect
the speed of change in assessment for the CSR context in particular, but also more broadly. In our article
we document positive but relatively small associations between investment recommendations and CSR
strengths in more recent years. Therefore, subsequent articles may explore the conditions and the extent to
which analysts reward proactive CSR with even more favorable recommendations. It could be that in other
countries or under different conditions, analysts reward firms with high CSR strengths with larger increases
in investment recommendation optimism, indicating perhaps more salient and prevalent institutional logics.
Relatedly, future research could explore whether, to what extent and why specific CSR dimensions and
policies are more or less likely to be associated with favorable analysts’ recommendations. This issue also
links to the work by Delmas, Etzion & Narn-Birch (2013) who suggest that composite measures might be
misrepresentative of the underlying process and outcome dimensions of environmental (or social)
performance. Accordingly, in unreported analysis, rather than using a composite CSR score as our
dependent variable, we used separate variables corresponding to the KLD categories associated with a)
Community, b) Corporate Governance, c) Diversity, d) Employee Relations, and e) Environmental f)
Product issues to estimate the main specifications of table 3. Keeping in mind the lack of theoretical
guidance regarding the relative weight and importance of specific CSR dimensions, this preliminary
empirical investigation finds that a) environmental issues are beginning to be perceived more positively in

31
recent years by analysts, perhaps indicating their value creating potential and b) issues of diversity (or
broader social issues) are beginning to be perceived less negatively, perhaps reflecting their risk mitigation
potential. To further explore this issue for our sample, we reproduced the specifications of table 6 using
these six KLD categories rather than the composite CSR score as our independent variables, and we did not
detect any differential learning by analysts (i.e. no significant correlation with forecast errors) across issue
areas. Without a doubt, both theoretically as well as empirically, a lot more needs to be done in the future
to understand the more nuanced mechanisms at work regarding how CSR categories and policies are
perceived and evaluated by analysts as well as other social actors within public equity markets.
Moreover, we note that although we argue for the broader weakening of the agency logic, we do
not argue for the complete emergence of an alternative logic (i.e. a complete paradigm shift). In this sense,
we are not able to detect a threshold of adoption effect (Delmas & Montes-Sancho, 2011) because arguably
in the relation between CSR perceptions and financial markets, this threshold has not yet materialized.
Undoubtedly though, this is another avenue for follow up research.
Finally, as we discuss in our hypotheses development section, a myriad of factors contributed to
the weakening of the agency logic including mandatory and voluntary reporting, NGO activity, academic
research, increasing consumer awareness, proactive corporate leadership, and socially responsible
investments. Future research could try to determine which of these elements were particularly influential in
this shift and through which specific mechanisms. It could be that a combination of these factors was
necessary and sufficient for a change in institutional logic; or that all of them combined generated the effects
we document here. Future research may also explore whether a tipping point may emerge that would
eventually led to the replacement of the agency logic by the stakeholder logic. Understanding this process
is particularly important at a time when even the public debate focuses on redefining the role of the
corporation in society and an era in which new systems of resource allocation in the global economy – such
as Sustainable Capitalism suggested by Generation investment co-founders Al Gore and David Blood – are
slowly but steadily gaining traction around the world.

32
Table 1 Panel A: Summary statistics (16,064 obs.)
Variable Mean Std. Dev. Min Max
Mean Analyst Recommendation 3.652 0.520 1.000 5.000
Total CSR Strengths 1.055 1.481 0.000 15.705
Total CSR Concerns 1.014 1.079 0.000 12.405
Number of Analysts 10.707 7.067 1.000 47.000
Mean House Size 64.047 36.638 1.000 353.000
Long-Term Forecast Error 0.005 0.033 -0.446 0.500
Market Value (Size) 14.476 1.467 11.302 19.325
Market Adjusted Return 0.037 0.402 -0.860 3.207
Intangibles 0.139 0.175 0.000 0.767
Return on assets 0.082 0.111 -0.573 0.416
Earnings-to-price ratio 0.029 0.093 -1.537 0.197
Book-to-market ratio 0.438 0.281 -0.254 3.201
Capital Expenditure 0.049 0.054 0.000 0.355
Table 1 Panel B:
Average years of firm-specific analyst experience by year and type of recommendation (16,064 obs.)
Year Average # Type of Recommendation
of years of firm-
specific exp. 1 2 3 4 5
1993 1.43 1.49 1.46 1.40 1.38 1.52
1994 1.79 2.13 1.78 1.75 1.80 1.77
1995 2.05 2.43 1.84 2.03 2.06 2.07
1996 2.21 2.73 2.42 2.29 2.16 2.10
1997 2.24 2.27 2.38 2.26 2.25 2.19
1998 2.35 2.22 3.02 2.41 2.36 2.25
1999 2.45 2.50 2.93 2.49 2.45 2.40
2000 2.40 2.95 2.47 2.35 2.39 2.48
2001 2.34 2.32 2.40 2.27 2.41 2.35
2002 2.48 2.47 2.73 2.49 2.49 2.32
2003 2.39 2.51 2.75 2.45 2.34 2.21
2004 2.42 2.75 2.70 2.43 2.34 2.35
2005 2.45 2.61 2.68 2.51 2.43 2.23
2006 2.49 2.77 2.84 2.53 2.40 2.37
2007 2.48 2.74 2.53 2.47 2.28 2.66

33
Table 2: Pairwise correlation coefficients with significance level (16,064 obs.)
(1) (2) (3) (4) (5) (6) (7) (8) (9) (10) (11) (12)
1 Mean Analyst Recommendation 1.000
2 Total CSR Strengths -0.043 1.000
0.000
3 Total CSR Concerns -0.040 0.370 1.000
0.000 0.000
4 Number of Analysts 0.017 0.338 0.286 1.000
0.030 0.000 0.000
5 Mean House Size -0.050 0.091 0.145 0.206 1.000
0.000 0.000 0.000 0.000
6 Long-term Forecast Error -0.048 -0.017 -0.013 -0.068 -0.015 1.000
0.000 0.028 0.091 0.000 0.064
7 Market Value (Size) 0.051 0.454 0.442 0.731 0.359 -0.086 1.000
0.000 0.000 0.000 0.000 0.000 0.000
8 Market Adjusted Return 0.172 -0.025 0.005 -0.024 0.028 -0.124 0.056 1.000
0.000 0.001 0.512 0.003 0.000 0.000 0.000
9 Intangibles 0.056 -0.029 0.007 -0.009 0.056 0.001 0.013 -0.045 1.000
0.000 0.000 0.355 0.274 0.000 0.910 0.097 0.000
10 Return on assets 0.075 0.068 0.021 0.145 0.089 -0.088 0.281 0.102 0.086 1.000
0.000 0.000 0.008 0.000 0.000 0.000 0.000 0.000 0.000
11 Earnings-to-price ratio 0.061 0.035 0.013 0.030 0.028 -0.161 0.166 0.093 -0.040 0.450 1.000
0.000 0.000 0.097 0.000 0.001 0.000 0.000 0.000 0.000 0.000
12 Book-to-market ratio -0.213 -0.077 -0.003 -0.184 0.009 0.198 -0.221 -0.180 -0.012 -0.217 -0.014 1.000
0.000 0.000 0.756 0.000 0.262 0.000 0.000 0.000 0.125 0.000 0.076
13 Capital Expenditure 0.089 -0.032 0.024 0.120 0.008 -0.003 0.036 0.006 -0.177 0.164 0.009 -0.104
0.000 0.000 0.002 0.000 0.301 0.740 0.000 0.479 0.000 0.000 0.277 0.000

34
Table 3 – Panel A: OLS regression analysis - Impact on mean analysts’ recommendations, adding years (Balanced Sample)
Time Period
1993-96 1993-97 1993-98 1993-99 1993-00 1993-01 1993-02 1993-03 1993-04 1993-05 1993-06 1993-07
Dependent Variable meanrec meanrec meanrec meanrec meanrec meanrec meanrec meanrec meanrec meanrec meanrec meanrec
Total CSR Strengths -0.074*** -0.064*** -0.050** -0.038** -0.033* -0.016 -0.016 0.001 0.005 0.001 0.002 0.002
(0.026) (0.024) (0.020) (0.019) (0.018) (0.014) (0.014) (0.011) (0.011) (0.009) (0.009) (0.007)
Total CSR Concerns -0.023 -0.019 -0.001 -0.001 -0.001 0.004 0.004 0.001 -0.005 -0.004 -0.002 -0.001
(0.020) (0.017) (0.015) (0.014) (0.014) (0.012) (0.013) (0.012) (0.011) (0.010) (0.010) (0.009)
Number of Analysts 0.001 -0.003 -0.001 -0.000 -0.004 -0.005* -0.006** -0.005* -0.004* -0.005** -0.005** -0.006**
(0.005) (0.004) (0.004) (0.003) (0.003) (0.003) (0.003) (0.003) (0.003) (0.002) (0.002) (0.002)
Mean House size -0.000 -0.001 0.000 -0.000 -0.000 -0.000 -0.000* -0.001** -0.001** -0.001*** -0.001*** -0.001***
(0.000) (0.000) (0.000) (0.000) (0.000) (0.000) (0.000) (0.000) (0.000) (0.000) (0.000) (0.000)
Long Term Forecast Error 0.016 -0.569 -0.445 -0.527 0.162 0.719* -0.020 -0.196 -0.228 -0.035 -0.022 -0.150
(1.338) (1.337) (0.932) (0.635) (0.498) (0.432) (0.557) (0.583) (0.541) (0.526) (0.418) (0.424)
Market Value (Size) 0.303*** 0.265*** 0.143*** 0.064* 0.097*** 0.117*** 0.128*** 0.121*** 0.113*** 0.109*** 0.115*** 0.121***
(0.082) (0.060) (0.047) (0.038) (0.035) (0.033) (0.031) (0.029) (0.027) (0.027) (0.026) (0.025)
Market Adjusted Return 0.136*** 0.142*** 0.139*** 0.100*** 0.142*** 0.145*** 0.158*** 0.181*** 0.187*** 0.178*** 0.172*** 0.180***
(0.043) (0.034) (0.031) (0.021) (0.018) (0.017) (0.017) (0.019) (0.019) (0.019) (0.018) (0.018)
Intangibles 0.143 0.085 0.230 0.256 0.183 0.166 0.251** 0.280** 0.244* 0.279** 0.286** 0.340***
(0.289) (0.205) (0.172) (0.160) (0.150) (0.134) (0.123) (0.127) (0.126) (0.122) (0.114) (0.108)
Return on Assets 0.436 0.451 0.633* 0.878** 1.245*** 1.002*** 0.845*** 0.654*** 0.528** 0.528** 0.507** 0.430**
(0.474) (0.413) (0.349) (0.341) (0.295) (0.255) (0.239) (0.240) (0.233) (0.225) (0.219) (0.206)
Earnings-to-price ratio 0.076 0.079 -0.017 0.172 -0.267 -0.284* -0.053 0.065 0.155 0.151 0.227** 0.166*
(0.337) (0.292) (0.257) (0.232) (0.174) (0.149) (0.107) (0.106) (0.109) (0.105) (0.111) (0.088)
Book-to-Market ratio -0.474*** -0.427*** -0.550*** -0.655*** -0.363*** -0.338*** -0.310*** -0.321*** -0.325*** -0.331*** -0.332*** -0.340***
(0.146) (0.116) (0.095) (0.083) (0.055) (0.052) (0.051) (0.052) (0.049) (0.047) (0.046) (0.045)
Capital Expenditure 0.105 0.325 0.327 0.283 0.376 0.577* 0.481 0.497* 0.457 0.348 0.381 0.592**
(0.623) (0.514) (0.440) (0.358) (0.352) (0.333) (0.328) (0.294) (0.290) (0.303) (0.290) (0.295)
Constant -0.634 -0.154 1.714** 2.877*** 2.379*** 2.004*** 1.847*** 1.687*** 1.816*** 2.164*** 1.779*** 1.997***
(1.207) (0.915) (0.705) (0.572) (0.539) (0.486) (0.478) (0.449) (0.426) (0.396) (0.422) (0.374)
Firm Fixed Effects Yes Yes Yes Yes Yes Yes Yes Yes Yes Yes Yes Yes
Year Fixed Effects Yes Yes Yes Yes Yes Yes Yes Yes Yes Yes Yes Yes
Observations 1,065 1,374 1,714 2,054 2,382 2,727 3,065 3,404 3,737 4,056 4,361 4,644
R-squared 0.170 0.166 0.171 0.258 0.251 0.227 0.304 0.302 0.296 0.279 0.276 0.273
Number of Unique Firms 295 318 352 354 355 355 355 355 356 356 356 356

35
Table 3 – Panel B: OLS regression analysis - Impact on mean analysts’ recommendations, adding years (Full Sample)
Time Period
1993-96 1993-97 1993-98 1993-99 1993-00 1993-01 1993-02 1993-03 1993-04 1993-05 1993-06 1993-07
Dependent Variable meanrec meanrec meanrec meanrec meanrec meanrec meanrec meanrec meanrec meanrec meanrec meanrec
Total CSR Strengths -0.083*** -0.078*** -0.065*** -0.051*** -0.044*** -0.027** -0.026** 0.001 0.002 0.004 0.005 0.004
0.022 0.021 0.018 0.017 0.016 0.013 0.013 0.009 0.008 0.007 0.006 0.006
Total CSR Concerns -0.004 -0.004 0.002 0.001 0.003 0.007 0.005 0.001 -0.011 -0.013* -0.012* -0.010
0.018 0.015 0.014 0.013 0.012 0.011 0.011 0.010 0.008 0.007 0.007 0.007
Number of Analysts 0.002 -0.001 0.001 0.001 -0.003 -0.004* -0.006*** -0.005** -0.005*** -0.007*** -0.006*** -0.008***
0.005 0.004 0.003 0.003 0.003 0.002 0.002 0.002 0.002 0.002 0.002 0.001
Mean House size 0.000 0.000 0.000 0.000 0.000 0.000 -0.000* -0.000** -0.000* -0.000** -0.000*** -0.000***
0.000 0.000 0.000 0.000 0.000 0.000 0.000 0.000 0.000 0.000 0.000 0.000
Long Term Forecast Error -0.224 -0.089 0.431 0.330 0.441 0.762** 0.340 0.405 0.138 -0.029 -0.022 -0.017
0.789 0.767 0.658 0.605 0.388 0.349 0.331 0.308 0.227 0.199 0.155 0.139
Market Value (Size) 0.320*** 0.239*** 0.121*** 0.048 0.091*** 0.113*** 0.152*** 0.162*** 0.167*** 0.153*** 0.163*** 0.152***
0.066 0.052 0.043 0.035 0.031 0.030 0.027 0.024 0.022 0.020 0.018 0.016
Market Adjusted Return 0.176*** 0.184*** 0.183*** 0.131*** 0.153*** 0.156*** 0.164*** 0.164*** 0.146*** 0.119*** 0.108*** 0.111***
0.037 0.032 0.029 0.021 0.017 0.016 0.015 0.016 0.013 0.012 0.011 0.010
Intangibles 0.128 0.192 0.238 0.265* 0.168 0.097 0.101 0.157 0.199** 0.186** 0.147** 0.212***
0.227 0.173 0.152 0.141 0.133 0.122 0.104 0.100 0.090 0.081 0.073 0.065
Return on Assets 0.455 0.505 0.608** 0.933*** 1.152*** 0.850*** 0.497*** 0.380** 0.397*** 0.377*** 0.271** 0.282***
0.370 0.326 0.280 0.284 0.241 0.205 0.173 0.166 0.138 0.120 0.108 0.103
Earnings-to-price ratio 0.142 0.160 0.041 0.066 -0.206 -0.191 0.123 0.129** 0.152** 0.168*** 0.239*** 0.195***
0.188 0.180 0.166 0.155 0.133 0.117 0.079 0.065 0.060 0.059 0.059 0.046
Book-to-Market ratio -0.431*** -0.439*** -0.546*** -0.644*** -0.391*** -0.378*** -0.313*** -0.310*** -0.308*** -0.348*** -0.337*** -0.357***
0.106 0.093 0.081 0.073 0.051 0.048 0.043 0.041 0.037 0.036 0.033 0.029
Capital Expenditure -0.117 0.246 0.231 0.310 0.327 0.485* 0.488* 0.364 0.327 0.234 0.310 0.262
0.477 0.407 0.361 0.310 0.301 0.282 0.270 0.245 0.224 0.209 0.191 0.173
Constant -0.929 0.313 2.070*** 3.380*** 2.389*** 2.122*** 1.629*** 1.185*** 1.514*** 1.777*** 1.661*** 1.846***
0.982 0.767 0.657 0.544 0.460 0.436 0.410 0.365 0.302 0.286 0.249 0.224
Firm Fixed Effects Yes Yes Yes Yes Yes Yes Yes Yes Yes Yes Yes Yes
Year Fixed Effects Yes Yes Yes Yes Yes Yes Yes Yes Yes Yes Yes Yes
Observations 1,467 1,855 2,260 2,682 3,132 3,982 4,871 6,967 9,194 11,496 13,753 16,064
R-squared 0.189 0.174 0.176 0.246 0.247 0.235 0.351 0.331 0.274 0.224 0.2 0.181
Number of Unique Firms 427 460 509 560 617 1,014 1,149 2,320 2,725 3,040 3,291 3,580

36
Table 4, Panel A: OLS regression analysis - Impact on mean analysts’ recommendations for top two quartiles of analyst experience
Time Period
1993-96 1993-97 1993-98 1993-99 1993-00 1993-01 1993-02 1993-03 1993-04 1993-05 1993-06 1993-07
Dependent Variable meanrec meanrec meanrec meanrec meanrec meanrec meanrec meanrec meanrec meanrec meanrec meanrec
Total CSR Strengths -0.071*** -0.067*** -0.055*** -0.047*** -0.040** -0.017 -0.012 0.011 0.013 0.015** 0.015** 0.014**
0.024 0.022 0.019 0.018 0.016 0.013 0.013 0.009 0.008 0.007 0.006 0.006
Total CSR Concerns -0.029 -0.018 -0.011 -0.012 -0.010 -0.005 -0.003 -0.003 -0.015* -0.017** -0.016** -0.017**
0.020 0.017 0.015 0.014 0.013 0.011 0.012 0.010 0.009 0.008 0.007 0.007
Number of Analysts 0.005 0.000 0.001 -0.001 -0.004 -0.005** -0.008*** -0.005** -0.005** -0.006*** -0.006*** -0.007***
0.005 0.004 0.004 0.003 0.003 0.003 0.002 0.002 0.002 0.002 0.002 0.002
Mean House size 0.000 0.000 0.000 0.000 0.000 -0.000* 0.000 -0.000* -0.000* -0.000** -0.000*** -0.000***
0.001 0.000 0.000 0.000 0.000 0.000 0.000 0.000 0.000 0.000 0.000 0.000
Long Term Forecast Error 1.006 0.171 0.603 0.223 0.358 0.847** 0.272 0.336 0.284 0.024 -0.006 0.028
1.318 1.063 0.777 0.794 0.384 0.350 0.354 0.328 0.241 0.215 0.170 0.155
Market Value (Size) 0.378*** 0.279*** 0.134*** 0.069* 0.114*** 0.136*** 0.177*** 0.184*** 0.178*** 0.163*** 0.172*** 0.159***
0.070 0.055 0.045 0.037 0.034 0.032 0.028 0.025 0.023 0.022 0.020 0.018
Market Adjusted Return 0.150*** 0.175*** 0.175*** 0.124*** 0.156*** 0.157*** 0.164*** 0.160*** 0.145*** 0.121*** 0.112*** 0.116***
0.042 0.036 0.033 0.023 0.018 0.018 0.016 0.016 0.014 0.012 0.012 0.012
Intangibles 0.056 0.186 0.309* 0.333** 0.260* 0.161 0.117 0.163 0.217** 0.250*** 0.212** 0.272***
0.263 0.186 0.170 0.161 0.149 0.137 0.113 0.109 0.100 0.089 0.083 0.078
Return on Assets 0.126 0.255 0.447 0.630** 0.967*** 0.673*** 0.297* 0.175 0.204 0.244* 0.221* 0.204*
0.431 0.366 0.288 0.280 0.238 0.209 0.172 0.165 0.145 0.132 0.123 0.113
Earnings-to-price ratio -0.086 -0.052 -0.068 0.095 -0.159 -0.136 0.142* 0.147** 0.188*** 0.183*** 0.250*** 0.200***
0.309 0.254 0.225 0.204 0.162 0.139 0.082 0.069 0.062 0.060 0.063 0.051
Book-to-Market ratio -0.531*** -0.556*** -0.626*** -0.691*** -0.375*** -0.379*** -0.309*** -0.311*** -0.309*** -0.339*** -0.331*** -0.349***
0.132 0.108 0.087 0.078 0.055 0.052 0.039 0.037 0.036 0.036 0.034 0.031
Capital Expenditure -0.206 0.149 0.269 0.317 0.418 0.505 0.561* 0.505* 0.290 0.215 0.296 0.345*
0.641 0.495 0.432 0.371 0.356 0.321 0.306 0.266 0.242 0.233 0.209 0.195
Constant -1.776* -0.389 1.890*** 2.881*** 2.140*** 1.838*** 1.235*** 0.809** 1.351*** 1.191*** 1.486*** 1.655***
1.043 0.850 0.686 0.556 0.534 0.479 0.429 0.374 0.323 0.330 0.287 0.260
Firm Fixed Effects Yes Yes Yes Yes Yes Yes Yes Yes Yes Yes Yes Yes
Year Fixed Effects Yes Yes Yes Yes Yes Yes Yes Yes Yes Yes Yes Yes
Observations 1,034 1,336 1,669 2,032 2,420 3,133 3,896 5,393 6,861 8,304 9,673 10,998
R-squared 0.22 0.209 0.202 0.276 0.273 0.261 0.395 0.372 0.319 0.272 0.25 0.228
Number of Unique Firms 289 310 352 398 445 768 877 1,583 1,711 1,809 1,866 1,932

37
Table 4, Panel B: OLS regression analysis - Impact on mean analysts’ recommendations for bottom two quartiles of analyst experience
Time Period
1993-96 1993-97 1993-98 1993-99 1993-00 1993-01 1993-02 1993-03 1993-04 1993-05 1993-06 1993-07
Dependent Variable meanrec meanrec meanrec meanrec meanrec meanrec meanrec meanrec meanrec meanrec meanrec meanrec
Total CSR Strengths -0.100** -0.119** -0.100* -0.060 -0.053 -0.060 -0.080** -0.043 -0.051* -0.045** -0.034* -0.036**
0.050 0.052 0.053 0.051 0.050 0.041 0.040 0.031 0.029 0.022 0.018 0.017
Total CSR Concerns 0.068* 0.046 0.056 0.060* 0.065** 0.075** 0.062* 0.047 0.027 0.020 0.021 0.032*
0.036 0.033 0.035 0.035 0.032 0.029 0.034 0.032 0.026 0.021 0.020 0.018
Number of Analysts -0.001 0.000 0.001 0.003 0.000 0.000 -0.004 -0.007 -0.010** -0.013*** -0.009** -0.011***
0.010 0.009 0.008 0.008 0.007 0.006 0.005 0.005 0.005 0.004 0.004 0.003
Mean House size -0.001 -0.001** 0.000 0.000 0.000 0.000 0.000 0.000 0.000 0.000 0.000 0.000
0.001 0.001 0.001 0.001 0.000 0.000 0.000 0.000 0.000 0.000 0.000 0.000
Long Term Forecast Error -0.619 -0.377 0.131 0.251 0.520 0.561 0.567 0.698 -0.248 -0.145 -0.033 -0.078
1.004 1.051 1.017 0.975 0.840 0.798 0.783 0.781 0.533 0.457 0.352 0.271
Market Value (Size) 0.227 0.140 0.085 -0.005 0.041 0.068 0.108* 0.131** 0.197*** 0.179*** 0.175*** 0.166***
0.156 0.133 0.110 0.077 0.064 0.060 0.064 0.064 0.056 0.046 0.039 0.033
Market Adjusted Return 0.250*** 0.216*** 0.210*** 0.159*** 0.135*** 0.153*** 0.158*** 0.177*** 0.147*** 0.116*** 0.103*** 0.103***
0.077 0.069 0.066 0.058 0.044 0.041 0.041 0.049 0.034 0.029 0.023 0.021
Intangibles 0.044 0.080 -0.006 -0.030 -0.200 -0.167 0.063 0.227 0.147 -0.013 -0.049 0.054
0.384 0.392 0.328 0.307 0.298 0.265 0.248 0.213 0.191 0.171 0.144 0.114
Return on Assets 1.115 1.160* 1.177 1.954*** 1.789*** 1.537*** 1.375*** 1.293*** 1.141*** 0.811*** 0.426* 0.418**
0.790 0.682 0.717 0.742 0.663 0.543 0.473 0.459 0.331 0.262 0.219 0.199
Earnings-to-price ratio 0.195 0.291 0.040 -0.153 -0.414 -0.391 -0.197 -0.134 -0.141 0.029 0.131 0.184*
0.273 0.282 0.277 0.266 0.251 0.239 0.218 0.207 0.208 0.180 0.162 0.111
Book-to-Market ratio -0.203 -0.148 -0.300* -0.468*** -0.403*** -0.302** -0.277* -0.278* -0.283** -0.361*** -0.340*** -0.373***
0.171 0.169 0.180 0.163 0.127 0.131 0.161 0.160 0.118 0.106 0.090 0.066
Capital Expenditure 0.249 0.706 0.382 0.412 0.192 0.498 0.313 -0.196 0.512 0.418 0.374 0.122
0.704 0.697 0.673 0.550 0.555 0.551 0.526 0.572 0.535 0.450 0.418 0.339
Constant 0.435 1.612 2.338 3.561*** 3.334*** 2.952*** 2.451** 2.283** 1.311* 1.808*** 1.902*** 1.936***
2.208 1.933 1.548 1.098 0.957 0.893 0.969 0.929 0.781 0.651 0.544 0.451
Firm Fixed Effects Yes Yes Yes Yes Yes Yes Yes Yes Yes Yes Yes Yes
Year Fixed Effects Yes Yes Yes Yes Yes Yes Yes Yes Yes Yes Yes Yes
Observations 433 519 591 650 712 849 975 1,574 2,333 3,192 4,080 5,066
R-squared 0.19 0.148 0.15 0.201 0.205 0.193 0.233 0.219 0.173 0.135 0.108 0.107
Number of Unique Firms 138 150 157 162 172 246 272 737 1,014 1,231 1,425 1,648
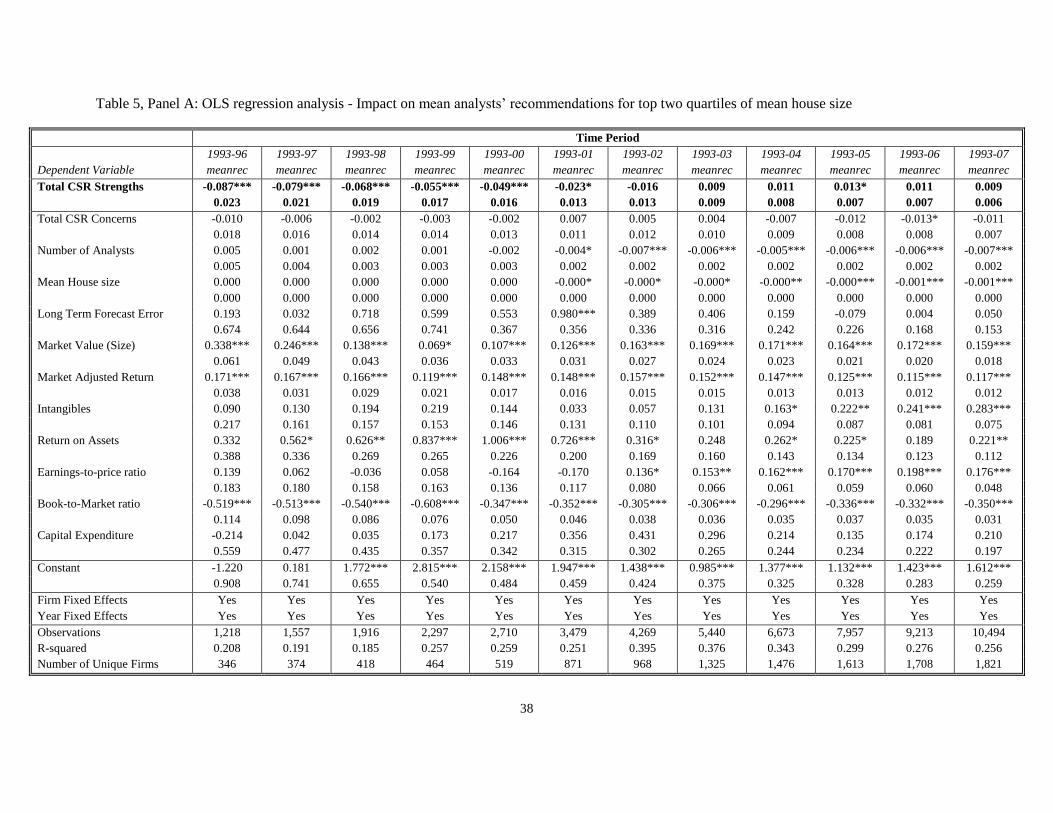
38
Table 5, Panel A: OLS regression analysis - Impact on mean analysts’ recommendations for top two quartiles of mean house size
Time Period
1993-96 1993-97 1993-98 1993-99 1993-00 1993-01 1993-02 1993-03 1993-04 1993-05 1993-06 1993-07
Dependent Variable meanrec meanrec meanrec meanrec meanrec meanrec meanrec meanrec meanrec meanrec meanrec meanrec
Total CSR Strengths -0.087*** -0.079*** -0.068*** -0.055*** -0.049*** -0.023* -0.016 0.009 0.011 0.013* 0.011 0.009
0.023 0.021 0.019 0.017 0.016 0.013 0.013 0.009 0.008 0.007 0.007 0.006
Total CSR Concerns -0.010 -0.006 -0.002 -0.003 -0.002 0.007 0.005 0.004 -0.007 -0.012 -0.013* -0.011
0.018 0.016 0.014 0.014 0.013 0.011 0.012 0.010 0.009 0.008 0.008 0.007
Number of Analysts 0.005 0.001 0.002 0.001 -0.002 -0.004* -0.007*** -0.006*** -0.005*** -0.006*** -0.006*** -0.007***
0.005 0.004 0.003 0.003 0.003 0.002 0.002 0.002 0.002 0.002 0.002 0.002
Mean House size 0.000 0.000 0.000 0.000 0.000 -0.000* -0.000* -0.000* -0.000** -0.000*** -0.001*** -0.001***
0.000 0.000 0.000 0.000 0.000 0.000 0.000 0.000 0.000 0.000 0.000 0.000
Long Term Forecast Error 0.193 0.032 0.718 0.599 0.553 0.980*** 0.389 0.406 0.159 -0.079 0.004 0.050
0.674 0.644 0.656 0.741 0.367 0.356 0.336 0.316 0.242 0.226 0.168 0.153
Market Value (Size) 0.338*** 0.246*** 0.138*** 0.069* 0.107*** 0.126*** 0.163*** 0.169*** 0.171*** 0.164*** 0.172*** 0.159***
0.061 0.049 0.043 0.036 0.033 0.031 0.027 0.024 0.023 0.021 0.020 0.018
Market Adjusted Return 0.171*** 0.167*** 0.166*** 0.119*** 0.148*** 0.148*** 0.157*** 0.152*** 0.147*** 0.125*** 0.115*** 0.117***
0.038 0.031 0.029 0.021 0.017 0.016 0.015 0.015 0.013 0.013 0.012 0.012
Intangibles 0.090 0.130 0.194 0.219 0.144 0.033 0.057 0.131 0.163* 0.222** 0.241*** 0.283***
0.217 0.161 0.157 0.153 0.146 0.131 0.110 0.101 0.094 0.087 0.081 0.075
Return on Assets 0.332 0.562* 0.626** 0.837*** 1.006*** 0.726*** 0.316* 0.248 0.262* 0.225* 0.189 0.221**
0.388 0.336 0.269 0.265 0.226 0.200 0.169 0.160 0.143 0.134 0.123 0.112
Earnings-to-price ratio 0.139 0.062 -0.036 0.058 -0.164 -0.170 0.136* 0.153** 0.162*** 0.170*** 0.198*** 0.176***
0.183 0.180 0.158 0.163 0.136 0.117 0.080 0.066 0.061 0.059 0.060 0.048
Book-to-Market ratio -0.519*** -0.513*** -0.540*** -0.608*** -0.347*** -0.352*** -0.305*** -0.306*** -0.296*** -0.336*** -0.332*** -0.350***
0.114 0.098 0.086 0.076 0.050 0.046 0.038 0.036 0.035 0.037 0.035 0.031
Capital Expenditure -0.214 0.042 0.035 0.173 0.217 0.356 0.431 0.296 0.214 0.135 0.174 0.210
0.559 0.477 0.435 0.357 0.342 0.315 0.302 0.265 0.244 0.234 0.222 0.197
Constant -1.220 0.181 1.772*** 2.815*** 2.158*** 1.947*** 1.438*** 0.985*** 1.377*** 1.132*** 1.423*** 1.612***
0.908 0.741 0.655 0.540 0.484 0.459 0.424 0.375 0.325 0.328 0.283 0.259
Firm Fixed Effects Yes Yes Yes Yes Yes Yes Yes Yes Yes Yes Yes Yes
Year Fixed Effects Yes Yes Yes Yes Yes Yes Yes Yes Yes Yes Yes Yes
Observations 1,218 1,557 1,916 2,297 2,710 3,479 4,269 5,440 6,673 7,957 9,213 10,494
R-squared 0.208 0.191 0.185 0.257 0.259 0.251 0.395 0.376 0.343 0.299 0.276 0.256
Number of Unique Firms 346 374 418 464 519 871 968 1,325 1,476 1,613 1,708 1,821

39
Table 5, Panel B: OLS regression analysis - Impact on mean analysts’ recommendations for bottom two quartiles of mean house size
Time Period
1993-96 1993-97 1993-98 1993-99 1993-00 1993-01 1993-02 1993-03 1993-04 1993-05 1993-06 1993-07
Dependent Variable meanrec meanrec meanrec meanrec meanrec meanrec meanrec meanrec meanrec meanrec meanrec meanrec
Total CSR Strengths -0.029 -0.059 -0.047 -0.023 -0.011 -0.047 -0.112*** -0.086** -0.070** -0.042** -0.022 -0.018
0.070 0.074 0.074 0.068 0.066 0.048 0.039 0.035 0.030 0.020 0.018 0.017
Total CSR Concerns 0.020 0.009 0.012 0.009 0.018 0.028 0.058 0.011 -0.014 0.010 0.012 0.010
0.067 0.064 0.058 0.052 0.052 0.046 0.044 0.042 0.027 0.020 0.019 0.019
Number of Analysts -0.012 -0.009 -0.004 -0.001 -0.004 -0.001 0.000 0.006 0.001 -0.010* -0.005 -0.013***
0.015 0.014 0.013 0.011 0.011 0.009 0.010 0.009 0.007 0.005 0.004 0.004
Mean House size -0.001 -0.001 0.001 0.001* 0.001 0.000 0.000 0.000 0.000 0.000 0.000 0.000
0.002 0.001 0.001 0.001 0.001 0.001 0.001 0.001 0.000 0.000 0.000 0.000
Long Term Forecast Error -0.841 -0.553 0.372 0.440 0.675 0.448 0.335 0.699 0.057 0.110 -0.098 -0.104
1.400 1.390 1.242 1.222 1.014 0.970 0.930 0.843 0.537 0.388 0.328 0.262
Market Value (Size) 0.375 0.269 0.086 -0.001 0.039 0.068 0.094 0.130 0.171** 0.123** 0.137*** 0.132***
0.240 0.204 0.151 0.103 0.084 0.081 0.080 0.092 0.068 0.050 0.043 0.035
Market Adjusted Return 0.198* 0.275** 0.267*** 0.184** 0.184*** 0.185** 0.186*** 0.231*** 0.146*** 0.111*** 0.097*** 0.103***
0.104 0.108 0.097 0.084 0.067 0.072 0.070 0.066 0.034 0.026 0.022 0.021
Intangibles 0.513 0.652 0.468 0.396 0.246 0.403 0.345 0.281 0.288 -0.023 -0.202 0.006
0.714 0.604 0.457 0.389 0.330 0.303 0.284 0.344 0.243 0.184 0.146 0.119
Return on Assets 0.935 0.298 0.601 1.308 1.535** 1.469** 1.570*** 1.161** 1.012*** 0.847*** 0.459** 0.405**
1.050 0.862 0.811 0.825 0.679 0.668 0.511 0.531 0.347 0.237 0.215 0.205
Earnings-to-price ratio 0.382 0.895 0.360 -0.012 -0.497 -0.402 -0.247 -0.225 -0.013 0.089 0.361** 0.287**
0.573 0.550 0.552 0.492 0.396 0.408 0.282 0.200 0.190 0.159 0.162 0.134
Book-to-Market ratio -0.133 -0.157 -0.558** -0.767*** -0.636*** -0.491** -0.357** -0.361** -0.340*** -0.367*** -0.332*** -0.361***
0.248 0.248 0.222 0.207 0.176 0.190 0.176 0.173 0.119 0.095 0.080 0.066
Capital Expenditure 0.512 1.129 0.920 0.844 0.863 1.118 0.988 0.942 0.927* 0.665 0.652* 0.367
1.150 0.868 0.720 0.697 0.688 0.721 0.663 0.707 0.552 0.472 0.368 0.338
Constant -1.438 -0.012 2.515 4.071*** 3.087*** 2.930** 2.412** 2.000 1.751* 2.498*** 2.373*** 2.524***
3.234 2.703 2.012 1.437 1.150 1.182 1.102 1.230 0.903 0.677 0.583 0.482
Firm Fixed Effects Yes Yes Yes Yes Yes Yes Yes Yes Yes Yes Yes Yes
Year Fixed Effects Yes Yes Yes Yes Yes Yes Yes Yes Yes Yes Yes Yes
Observations 249 298 344 385 422 503 602 1,527 2,521 3,539 4,540 5,570
R-squared 0.184 0.161 0.179 0.239 0.239 0.219 0.212 0.196 0.129 0.098 0.088 0.083
Number of Unique Firms 81 86 91 96 98 143 181 995 1,249 1,427 1,583 1,759

40
Table 6: OLS regression analysis - Impact of CSR on analysts’ forecast error, adding years
Time Period
1993-96 1993-97 1993-98 1993-99 1993-00 1993-01 1993-02 1993-03 1993-04 1993-05 1993-06 1993-07
Dependent Variable
Forc.
Error.
Forc.
Error.
Forc.
Error.
Forc.
Error.
Forc.
Error.
Forc.
Error.
Forc.
Error.
Forc.
Error.
Forc.
Error.
Forc.
Error.
Forc.
Error.
Forc.
Error.
Total CSR Strengths -0.001 -0.001 0.000 0.000 0.000 0.000 0.000 0.000 0.000 0.000 0.000 0.000
0.001 0.001 0.001 0.001 0.001 0.001 0.001 0.000 0.000 0.000 0.000 0.000
Total CSR Concerns 0.001 0.001 0.000 0.000 0.000 0.001 0.001 0.000 0.000 0.000 0.000 0.000
0.001 0.001 0.001 0.001 0.001 0.001 0.001 0.000 0.000 0.000 0.000 0.000
Horizon Control 0.014 -0.014 0.005 -0.007 0.011 0.009 0.011 0.007 -0.006 0.003 -0.012 0.011
0.032 0.024 0.024 0.018 0.019 0.018 0.014 0.011 0.010 0.011 0.013 0.015
Number of Analysts 0.000 0.000 0.000 0.000 0.000 0.000 0.000 0.000 0.000 0.000 0.000 0.000
0.000 0.000 0.000 0.000 0.000 0.000 0.000 0.000 0.000 0.000 0.000 0.000
Market Value (Size) 0.015** 0.009** 0.010*** 0.007*** 0.004* 0.003 0.003 0.003 0.001 0.002 0.004** 0.003*
0.007 0.004 0.003 0.002 0.002 0.002 0.003 0.003 0.002 0.002 0.002 0.002
Market Adjusted Return -0.006 -0.005** -0.006*** -0.006*** -0.003** -0.002** -0.002** -0.002 -0.001 -0.001 -0.002** -0.002***
0.004 0.003 0.002 0.002 0.001 0.001 0.001 0.001 0.001 0.001 0.001 0.001
Intangibles -0.010 -0.006 -0.010 -0.006 -0.004 -0.006 -0.004 -0.004 -0.004 -0.006* -0.012*** -0.018***
0.010 0.007 0.007 0.007 0.007 0.005 0.006 0.004 0.004 0.003 0.003 0.005
Return on Assets 0.027 0.036 0.028 0.003 -0.004 -0.010 -0.014 -0.009 -0.006 0.000 -0.003 -0.017*
0.040 0.031 0.023 0.023 0.019 0.016 0.015 0.013 0.010 0.009 0.008 0.010
Book-to-Market ratio 0.037* 0.028* 0.026** 0.015* 0.017* 0.017** 0.014* 0.013** 0.009* 0.013*** 0.020*** 0.030***
0.020 0.016 0.012 0.009 0.009 0.008 0.007 0.006 0.005 0.004 0.004 0.005
Capital Expenditure -0.020 0.015 0.013 0.011 0.042* 0.043* 0.052*** 0.037** 0.016 0.018 0.017 0.008
0.039 0.028 0.025 0.023 0.023 0.022 0.020 0.016 0.013 0.012 0.011 0.011
Constant -0.307* -0.082 -0.182 -0.071 -0.114 -0.092 -0.100 -0.075 0.012 -0.043 0.001 -0.093
0.185 0.126 0.125 0.090 0.106 0.102 0.089 0.066 0.061 0.060 0.067 0.078
Firm Fixed Effects Yes Yes Yes Yes Yes Yes Yes Yes Yes Yes Yes Yes
Year Fixed Effects Yes Yes Yes Yes Yes Yes Yes Yes Yes Yes Yes Yes
Observations 1,542 1,939 2,358 2,802 3,280 4,136 5,042 7,287 9,661 12,079 14,446 16,880
R-squared 0.065 0.056 0.063 0.043 0.053 0.052 0.034 0.027 0.015 0.017 0.028 0.069
Number of Unique Firms 436 467 519 569 627 1,024 1,162 2,458 2,832 3,130 3,382 3,681

41
Figure 1: Estimated coefficients on CSR strengths (Table 3, Panel B)
Figure 2: Estimated coefficients on CSR strengths for high and low legitimacy analysts (table 4)
-0.1
-0.08
-0.06
-0.04
-0.02
0
0.02
-0.14
-0.12
-0.1
-0.08
-0.06
-0.04
-0.02
0
0.02
19
93
-96
19
93
-97
19
93
-98
19
93
-99
19
93
-00
19
93
-01
19
93
-02
19
93
-03
19
93
-04
19
93
-05
19
93
-06
19
93
-07
Top Qrt Btm Qrt

42
REFERENCES
Booz & Company 2012. Responsible Investing: a Paradigm Shift. From Niche to Mainstream. (May 7th,
2013.
European Commission 2001. Promoting a European Framework for Corporate Social Responsibilities. In
Green Paper. Office for Official Publications of the European Communities: Brussels, Belgium.
Abarbanell JS, Lanen WN, Verrecchia RE. 1995. Analysts' forecasts as proxies for investor beliefs in
empirical research. Journal of Accounting and Economics 20(1): 31-60.
Abolafia MY. 1996. Hyper-rational gaming. Journal of Contemporary Ethnography 25(2): 226-250.
Ambec S, Lanoie P. 2008. Does It Pay to Be Green? A Systematic Overview. Academy of Management
Perspectives 22(4): 45-62.
Andrews K. 1971. The Concept of Corporate Strategy. Dow-Jones Irwin: Homewood, Illinois.
Aragón-Correa JA. 1998. Strategic proactivity and firm approach to the natural environment. Academy of
management Journal 41(5): 556-567.
Atkinson L, Galaskiewicz J. 1988. Stock ownership and company contributions to charity. Administrative
Science Quarterly: 82-100.
Barber B, Lehavy R, McNichols M, Trueman B. 2001. Can investors profit from the prophets? Security
analyst recommendations and stock returns. The Journal of Finance 56(2): 531-563.
Barnett ML, Salomon RM. 2006. Beyond dichotomy: the curvilinear relationship between social
responsibility and financial performance. Strategic Management Journal 27(11): 1101-1122.
Bear S, Rahman N, Post C. 2010. The impact of board diversity and gender composition on corporate
social responsibility and firm reputation. Journal of Business Ethics 97(2): 207-221.
Benner MJ. 2007. The Incumbent Disound: Stock Market Categories and Response to Radical
Technological Change. Academy of Management Review 32(3): 703-720.
Benner MJ. 2010. Securities Analysts and Incumbent Response to Radical Technological Change:
Evidence from Digital Photography and Internet Telephony. Organization Science 21(1): 42-62.
Benner MJ, Ranganathan R. 2012. Offsetting illegitimacy? How pressures from securities analysts
influence incumbents in the face of new technologies. Academy of Management Journal 55(1): 213-233.
Berman SL, Wicks AC, Kotha S, Jones TM. 1999. Does Stakeholder Orientation Matter? The Relationship
between Stakeholder Management Models and Firm Financial Performance. The Academy of Management Journal
42(5): 488-506.
Carroll AB. 1979. A Three-Dimensional Conceptual Model of Corporate Performance. The Academy of
Management Review 4(4): 497-505.
Carroll AB, Lipartito KJ, Post JE, Werhane PH. 2012. Corporate Responsibility: The American
Experience. Cambridge University Press.
Cetina KK, Bruegger U. 2002. Global Microstructures: The Virtual Societies of Financial Markets1.
American Journal of Sociology 107(4): 905-950.
Chatterji AK, Levine DI, Toffel MW. 2009. How well do social ratings actually measure corporate social
responsibility? Journal of Economics & Management Strategy 18(1): 125-169.
Cheng B, Ioannou I, Serafeim G. 2014. Corporate social responsibility and access to finance. Strategic
Management Journal 35(1): 1-23.
Choi J, Wang HL. 2009. Stakeholder Relations and the Persistence of Corporate Financial Performance.
Strategic Management Journal 30(8): 895-907.
Clement MB. 1999. Analyst forecast accuracy: Do ability, resources, and portfolio complexity matter?
Journal of Accounting and Economics 27(3): 285-303.
Clement MB, Tse SY. 2005. Financial analyst characteristics and herding behavior in forecasting. The
Journal of Finance 60(1): 307-341.
Cohen L, Frazzini A, Malloy C. 2010. Sell‐Side School Ties. The Journal of Finance 65(4): 1409-1437.
Davis GF, Thompson TA. 1994. A social movement perspective on corporate control. Administrative
Science Quarterly: 141-173.
Davis K. 1973. The case for and against business assumption of social responsibilities. Academy of
Management Journal 16(2): 312-322.
Delmas MA, Etzion D, Nairn-Birch N. 2013. Triangulating Environmental Performance: What Do
Corporate Social Responsibility Ratings Really Capture? The Academy of Management Perspectives 27(3): 255-267.
43
Delmas MA, Montes-Sancho MJ. 2011. US state policies for renewable energy: Context and effectiveness.
Energy Policy 39(5): 2273-2288.
Dewatripont M, Jewitt I, Tirole J. 1999. The economics of career concerns, part I: Comparing information
structures. The Review of Economic Studies 66(1): 183-198.
Dixon-Fowler HR, Slater DJ, Johnson JL, Ellstrand AE, Romi AM. 2013. Beyond “Does it Pay to be
Green?” A Meta-Analysis of Moderators of the CEP–CFP Relationship. Journal of business ethics 112(2): 353-366.
Donaldson T, Preston LE. 1995. The Stakeholder Theory of the Corporation: Concepts, Evidence, and
Implications. Academy of Management Review 20(1): 65-91.
Durand R, Rao H, Monin P. 2007. Code and conduct in French cuisine: Impact of code changes on external
evaluations. Strategic Management Journal 28(5): 455-472.
Eccles R, Ioannou I, Serafeim G. 2013. The Impact of a Corporate Sustainability on Organizational
Processes and Performance. HBS Working Paper Series 11-016.
Eccles RG, Crane DB. 1987. Managing through networks in investment banking. California Management
Review 30(1): 176-195.
Eccles RG, Krzus MP, Serafeim G. 2011. Market Interest in Nonfinancial Information. Journal of Applied
Corporate Finance 23(4): 113-127.
Edward Freeman R, Evan WM. 1991. Corporate governance: A stakeholder interpretation. Journal of
Behavioral Economics 19(4): 337-359.
El Ghoul S, Guedhami O, Kwok CC, Mishra DR. 2011. Does corporate social responsibility affect the cost
of capital? Journal of Banking & Finance 35(9): 2388-2406.
Eliashberg J, Shugan SM. 1997. Film critics: Influencers or predictors? The Journal of Marketing: 68-78.
Etzion D. 2007. Research on organizations and the natural environment, 1992-present: A review. Journal
of Management 33(4): 637-664.
Fama EF. 1965. The behavior of stock-market prices. The journal of Business 38(1): 34-105.
Fama EF, Jensen MC. 1983a. Agency problems and residual claims. Journal of law and Economics 26(2):
327-349.
Fama EF, Jensen MC. 1983b. Separation of ownership and control. Journal of law and Economics 26(2):
301-325.
Fine GA. 1996. Reputational entrepreneurs and the memory of incompetence: Melting supporters, partisan
warriors, and images of President Harding. American Journal of Sociology: 1159-1193.
Fisman R, Heal G, Nair VB. 2005. Corporate social responsibility: Doing well by doing good, SSRN
working paper http://ssrn.com/abstract=813286.
Fombrun C. 2005. Building corporate reputation through CSR initiatives: evolving standards. Corporate
Reputation Review 8(1): 7-11.
Fombrun C, Shanley M. 1990. What's in a name? Reputation building and corporate strategy. Academy of
management Journal: 233-258.
Francis J, Soffer L. 1997. The relative informativeness of analysts' stock recommendations and earnings
forecast revisions. Journal of Accounting Research 35(2): 193-211.
Freeman R. 1984. Strategic Management: A stakeholder perspective. Piman: Boston, MA.
Freeman RE, Harrison JS, Wicks AC. 2007. Managing for stakeholders: survival, reputation, and success.
Yale Univ Press: New Haven, CT.
Freeman RE, Harrison JS, Wicks AC, Parmar BL, De Colle S. 2010. Stakeholder theory: The state of the
art. Cambridge University Press.
Fried D, Givoly D. 1982. Financial analysts’ forecasts of earnings: a better surrogate for market
expectations. Journal of Accounting and Economics 4(2): 85-107.
Friedman M. 1962. Capitalism and freedom. University of Chicago press.
Friedman M. 1970. The social responsibility of business is to increase its profits. New York Times
Magazine 32(13): 122-126.
Galaskiewicz J. 1997. An urban grants economy revisited: Corporate charitable contributions in the Twin
Cities, 1979-81, 1987-89. Administrative Science Quarterly: 445-471.
Glac K. 2010. The Influence of Shareholders on Corporate Social Responsibility, Working Paper,
University of St. Thomas.
Godfrey PC. 2005. The relationship Between Corporate Philanthropy and Shareholder Wealth: A Risk
Management Perspective Academy of Management Review 30(4): 777-798.

44
Godfrey PC, Merrill CB, Hansen JM. 2009. The relationship between corporate social responsibility and
shareholder value: an empirical test of the risk management hypothesis. Strategic Management Journal 30(4): 425-
445.
Goss A, Roberts GS. 2011. The impact of corporate social responsibility on the cost of bank loans. Journal
of Banking & Finance 35(7): 1794-1810.
Graves SB, Waddock SA. 1994. Institutional owners and corporate social performance. The Academy of
Management Journal 37(4): 1034-1046.
Hannan MT, Polos L, Carroll GR. 2004. The evolution of inertia. Industrial and Corporate Change 13(1):
213-242.
Hart SL. 1995. A Natural-Resource-Based View of the Firm. The Academy of Management Review 20(4):
986-1014.
Hillman AJ, Keim GD. 2001. Shareholder Value, Stakeholder Management, and Social Issues: What's the
Bottom Line? Strategic Management Journal 22(2): 125-139.
Hirsch PM. 1972. Processing fads and fashions: An organization-set analysis of cultural industry systems.
American journal of sociology: 639-659.
Hong H, Kubik JD. 2003. Analyzing the analysts: Career concerns and biased earnings forecasts. The
Journal of Finance 58(1): 313-351.
Hong H, Kubik JD, Solomon A. 2000. Security analysts' career concerns and herding of earnings forecasts.
The Rand Journal of Economics: 121-144.
Ioannou I, Serafeim G. 2012. The Consequences of Mandatory Corporate Sustainability Reporting.
Harvard Business School Research Working Paper No. 11-100
Jegadeesh N, Kim J, Krische SD, Lee C. 2004. Analyzing the analysts: When do recommendations add
value? The Journal of Finance 59(3): 1083-1124.
Jensen MC, Meckling WH. 1976. Theory of the firm: managerial behavior, agency costs and ownership
structure. Journal of Financial Economics 3(4): 305-360.
Kacperczyk A. 2009. With greater power comes greater responsibility? takeover protection and corporate
attention to stakeholders. Strategic Management Journal 30(3): 261-285.
Kandel E, Pearson ND. 1995. Differential interpretation of public signals and trade in speculative markets.
Journal of Political Economy: 831-872.
Kapsis RE. 1989. Reputation Building and the Film Art World. The Sociological Quarterly 30(1): 15-35.
Kapstein EB. 2001. The corporate ethics crusade. Foreign Affairs 80(5): 105-119.
King A, Lenox M. 2002. Exploring the locus of profitable pollution reduction. Management Science 48(2):
289-299.
King AA, Lenox MJ. 2001. Does it really pay to be green? An empirical study of firm environmental and
financial performance: An empirical study of firm environmental and financial performance. Journal of Industrial
Ecology 5(1): 105-116.
Kiron D, Kruschwitz N, Haanaes K, VELKEN IVS. 2012. Sustainability nears a tipping point. MIT Sloan
Management Review 53(2): 69-74.
Lang GE, Lang K. 1988. Recognition and renown: The survival of artistic reputation. American Journal of
Sociology: 79-109.
Lee DD, Faff RW. 2009. Corporate sustainability performance and idiosyncratic risk: a global perspective.
Financial Review 44(2): 213-237.
Lee MDP. 2008. A review of the theories of corporate social responsibility: Its evolutionary path and the
road ahead. International journal of management reviews 10(1): 53-73.
Loh RK, Mian GM. 2006. Do accurate earnings forecasts facilitate superior investment recommendations?
Journal of Financial Economics 80(2): 455-483.
Lok J. 2010. Institutional logics as identity projects. Academy of Management Journal 53(6): 1305-1335.
Lubin DA, Esty DC. 2010. The sustainability imperative. Harvard Business Review 88(5): 42-50.
MacKenzie D. 2003. Long-Term Capital Management and the sociology of arbitrage. Economy and Society
32(3): 349-380.
Manner MH. 2010. The impact of CEO characteristics on corporate social performance. Journal of
Business Ethics 93(1): 53-72.
Marens R, Wicks A. 1999. Getting real: Stakeholder theory, managerial practice, and the general
irrelevance of fiduciary duties owed to shareholders. Business Ethics Quarterly: 273-293.

45
Margolis JD, Elfenbein HA, Walsh JP. 2007. Does it pay to be good? A meta-analysis and redirection of
research on the relationship between corporate social and financial performance. In Working Paper. Ann Arbor.
Margolis JD, Walsh JP. 2003. Misery Loves Companies: Rethinking Social Initiatives by Business.
Administrative Science Quarterly 48(2): 268-305.
Mathiasen C, Mell E, Gallimore A. 2012. U.S. Proxy Season Review: Environmental & Social Issues.
Institutional Shareholder Services Inc.
Mattingly JE, Berman SL. 2006. Measurement of corporate social action discovering taxonomy in the
Kinder Lydenburg Domini ratings data. Business & Society 45(1): 20-46.
McWilliams A, Siegel D. 2000. Corporate Social Responsibility and Financial Performance: Correlation or
Misspecification? Strategic Management Journal 21(5): 603-609.
Mikhail MB, Walther BR, Willis RH. 1997. Do security analysts improve their performance with
experience? Journal of Accounting Research 35: 131-157.
Mikhail MB, Walther BR, Willis RH. 1999. Does forecast accuracy matter to security analysts? The
Accounting Review 74(2): 185-200.
Mikhail MB, Walther BR, Willis RH. 2003. The effect of experience on security analyst underreaction.
Journal of Accounting and Economics 35(1): 101-116.
Mitchell RK, Agle BR, Wood DJ. 1997. Toward a Theory of Stakeholder Identification and Salience:
Defining the Principle of Who and What Really Counts. The Academy of Management Review 22(4): 853-886.
Navarro P. 1988. Why do corporations give to charity? The Journal of Business 61(1): 65-93.
O’Brien P. 1988. Analysts’ forecasts as earnings expectations. Journal of Accounting and Economics
10(1): 53-83.
Orlitzky M, Schmidt FL, Rynes SL. 2003. Corporate Social and Financial Performance: A Meta-Analysis.
Organization Studies 24(3): 403-441.
Paine LS. 2003. Value shift: Why companies must merge social and financial imperatives to achieve
superior performance. McGraw-Hill New York.
Philippe D, Durand R. 2011. The impact of norm-conforming behaviors on firm reputation. Strategic
Management Journal 32(9): 969-993.
Phillips DJ, Zuckerman EW. 2001. Middle-Status Conformity: Theoretical Restatement and Empirical
Demonstration in Two Markets. American Journal of Sociology 107(2): 379-429.
Podolny JM. 1993. A status-based model of market competition. American Journal of Sociology: 829-872.
Polos L, Hannan MT, Carroll GR. 2002. Foundations of a theory of social forms. Industrial and Corporate
Change 11(1): 85-115.
Porter ME, Van der Linde C. 1995. Toward a new conception of the environment-competitiveness
relationship. The journal of economic perspectives 9(4): 97-118.
Posner RA. 1990. The problems of jurisprudence. Harvard University Press: Cambridge, MA.
Rao H. 1994. The Social Construction of Reputation: Certification Contests, Legitimation, and the Survival
of Organizations in the American Automobile Industry: 1895-1912. Strategic Management Journal 15(S1): 29-44.
Rowley T, Berman S. 2000. A Brand New Brand of Corporate Social Performance. Business Society 39(4):
397-418.
Ruf B, Muralidhar K, Paul K. 1993. Eight dimensions of corporate social performance: Determination of
relative importance using the analytic hierarchy process. Academy of Management Best Paper Proceedings 52: 326-
330.
Russo MV, Fouts PA. 1997. A resource-based perspective on corporate environmental performance and
profitability. Academy of management Journal 40(3): 534-559.
Scharfman M. 1996. The construct validity of the Kinder, Lydenburg and Domini social performance
ratings data. Journal of Business Ethics 15(3): 287-296.
Schwartz B. 1987. George Washington: The making of an American symbol. Free Press New York: New
York, NY.
Sethi SP. 1975. Dimensions of corporate social performance: an analytical framework for measurement and
evaluation. California Management Review 17: 58-64.
Sharfman M. 1996. The construct validity of the Kinder, Lydenberg & Domini social performance ratings
data. Journal of Business Ethics 15(3): 287-296.
Sharma S, Starik M. 2002. Research in corporate sustainability: the evolving theory and practice of
organizations in the natural environment. Edward Elgar Publishing.
Sheffrin SM. 1996. Rational expectations. Cambridge University Press: Cambridge, MA.

46
Shrum W. 1996. Fringe and fortune: The role of critics in high and popular art. Princeton University
Press: Princeton, NJ.
Sinha P, Brown LD, Das S. 1997. A Re-examination of Financial Analysts' Differential Earnings Forecast
Accuracy. Contemporary Accounting Research 14(1): 1-42.
Slater DJ, Dixon-Fowler HR. 2009. CEO international assignment experience and corporate social
performance. Journal of Business Ethics 89(3): 473-489.
Sparkes R, Cowton CJ. 2004. The maturing of socially responsible investment: a review of the developing
link with corporate social responsibility. Journal of Business Ethics 52(1): 45-57.
Steiner GY. 1971. The state of welfare. Brookings Institution Press.
Stickel SE. 1992. Reputation and performance among security analysts. The Journal of Finance 47(5):
1811-1836.
Stickel SE. 1995. The anatomy of the performance of buy and sell recommendations. Financial Analysts
Journal 51(5): 25-39.
Strike VM, Gao J, Bansal P. 2006. Being good while being bad: Social responsibility and the international
diversification of US firms. Journal of International Business Studies 37(6): 850-862.
Szwajkowski E, Figlewicz RE. 1999. Evaluating corporate performance: a comparison of the Fortune
reputation survey and the Socrates social rating database. Journal of Managerial Issues: 137-154.
Thornton PH. 2001. Personal versus market logics of control: A historically contingent theory of the risk of
acquisition. Organization Science 12(3): 294-311.
Thornton PH. 2002. The rise of the corporation in a craft industry: Conflict and conformity in institutional
logics. Academy of Management Journal: 81-101.
Thornton PH, Ocasio W. 1999. Institutional logics and the historical contingency of power in
organizations: Executive succession in the higher education publishing industry, 1958-1990 1. American Journal of
Sociology 105(3): 801-843.
Turban DB, Greening DW. 1997. Corporate social performance and organizational attractiveness to
prospective employees. The Academy of Management Journal 40(3): 658-672.
Useem M. 1993. Executive defense: Shareholder power and corporate reorganization. Cambridge, Mass.:
Harvard University Press.
Useem M. 1996. Investor capitalism: How money managers are changing the face of corporate America.
Basic Books: Arizona.
Waddock SA, Graves SB. 1997. The Corporate Social Performance-Financial Performance Link. Strategic
Management Journal 18(4): 303-319.
Waldman DA, Siegel DS, Javidan M. 2006. Components of CEO Transformational Leadership and
Corporate Social Responsibility. Journal of Management Studies 43(8): 1703-1725.
Westphal JD, Zajac EJ. 1994. Substance and Symbolism in CEOs' Long-Term Incentive Plans.
Administrative Science Quarterly 39(3): 367-390.
Westphal JD, Zajac EJ. 1995. Who shall govern? CEO/board power, demographic similarity, and new
director selection. Administrative Science Quarterly: 60-83.
Westphal JD, Zajac EJ. 1998. The Symbolic Management of Stockholders: Corporate Governance Reforms
and Shareholder Reactions. Administrative Science Quarterly 43(1): 127-153.
Williamson OE, Winter SG. 1993. The nature of the firm: origins, evolution, and development. Oxford
University Press.
Womack KL. 1996. Do brokerage analysts' recommendations have investment value? The Journal of
Finance 51(1): 137-167.
Zajac EJ, Westphal JD. 2004. The social construction of market value: Institutionalization and learning
perspectives on stock market reactions. American Sociological Review 69(3): 433-457.
Zuckerman EW. 1999. The Categorical Imperative: Securities Analysts and the Illegitimacy Discount. The
American Journal of Sociology 104(5): 1398-1438.