17 session 2 fey - example sensitivity analysis
20
Thomas Fey 30.03.2017 Sensitivity analysis for energy rating: Linearity, T-coefficient and AOI dependence of a reference solar cell National Metrology Institute a
-
Upload
sandia-national-laboratories-energy-climate-renewables -
Category
Technology
-
view
11 -
download
0
Transcript of 17 session 2 fey - example sensitivity analysis
Thomas Fey 30.03.2017
Sensitivity analysis for energy rating:Linearity, T-coefficient and AOI dependence
of a reference solar cell
National Metrology Institute
a

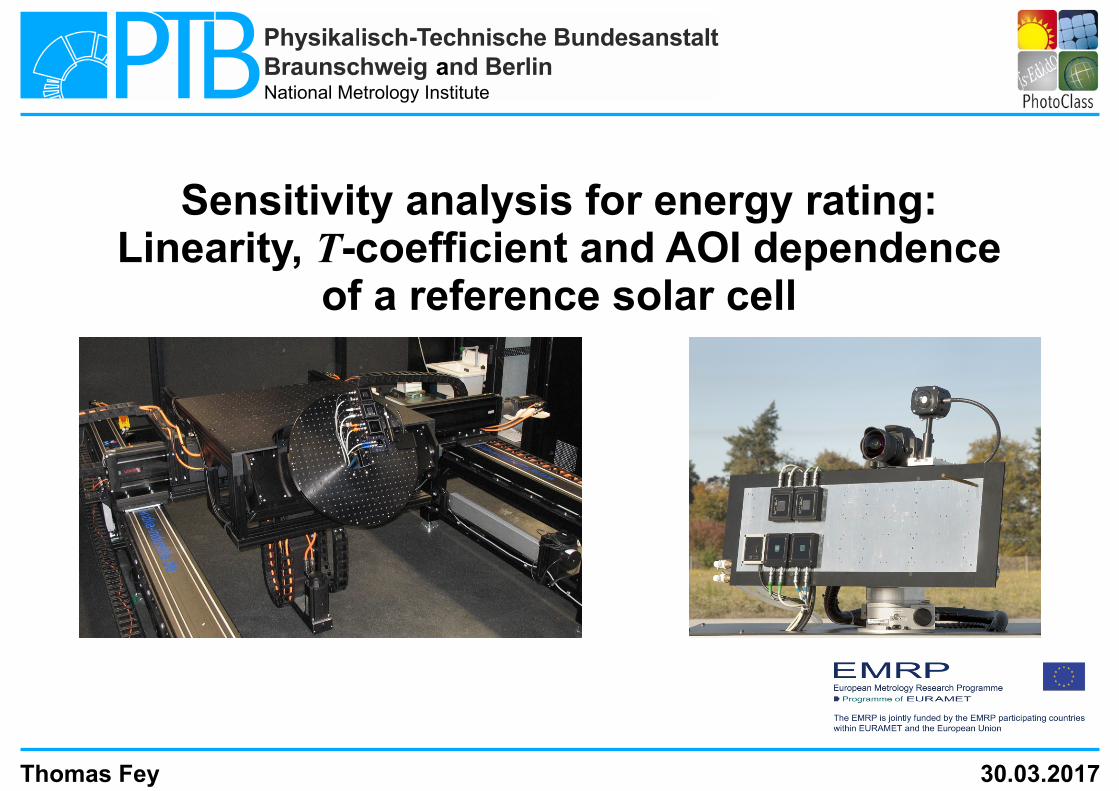
Standard Test Conditions (STC): Solar cell temperature, T = 25 °C•
-2 Irradiance, E = 1000 W m• Reference solar spectrum AM 1.5•
(IEC 60904-3)
Laboratory
Motivation
Thomas Fey 1
Bruce W Forgan, WMO RAV Metrology WorkshopMelbourne, November 2011Australian GovermentBureau of Meteorology
Standard Test Conditions (STC): Solar cell temperature, T = 25 °C•
-2 Irradiance, E = 1000 W m• Reference solar spectrum AM 1.5•
(IEC 60904-3)
Laboratory
Motivation
Reality: Temperatures up to 75 °C•
-2 Irradiance less than 1000 W m• AMx, direct + diffuse•
IEC 61853
Application
Thomas Fey 2
Bruce W Forgan, WMO RAV Metrology WorkshopMelbourne, November 2011Australian GovermentBureau of Meteorology
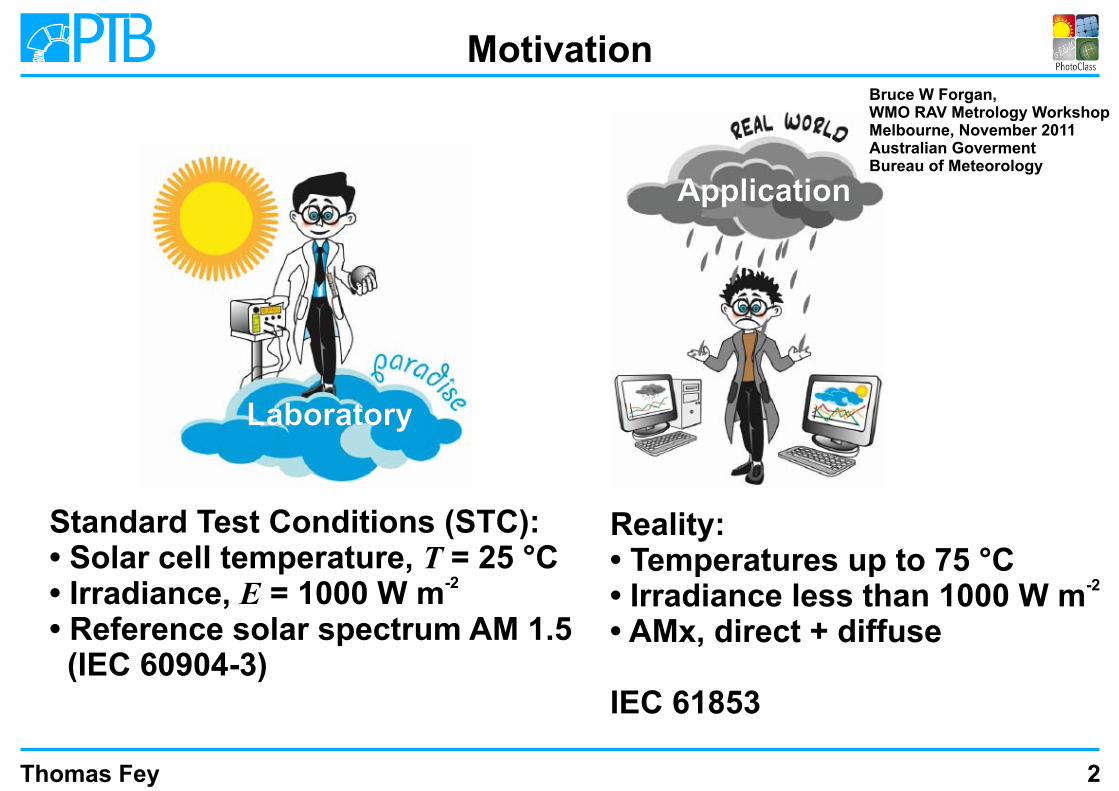
State of the Art
Thomas Fey 3
400 600 800 1000 12000
0.5
1.0
1.5
λ / nm
-2-1
E / W
m n
m
AM1.5 spectra
-1
s / m
A W
m²
λ / nm400 600 800 1000 1200
Spectral responsivity
Spectral and integral measurement methods
I = ∫ · ds(λ) E(λ) λ
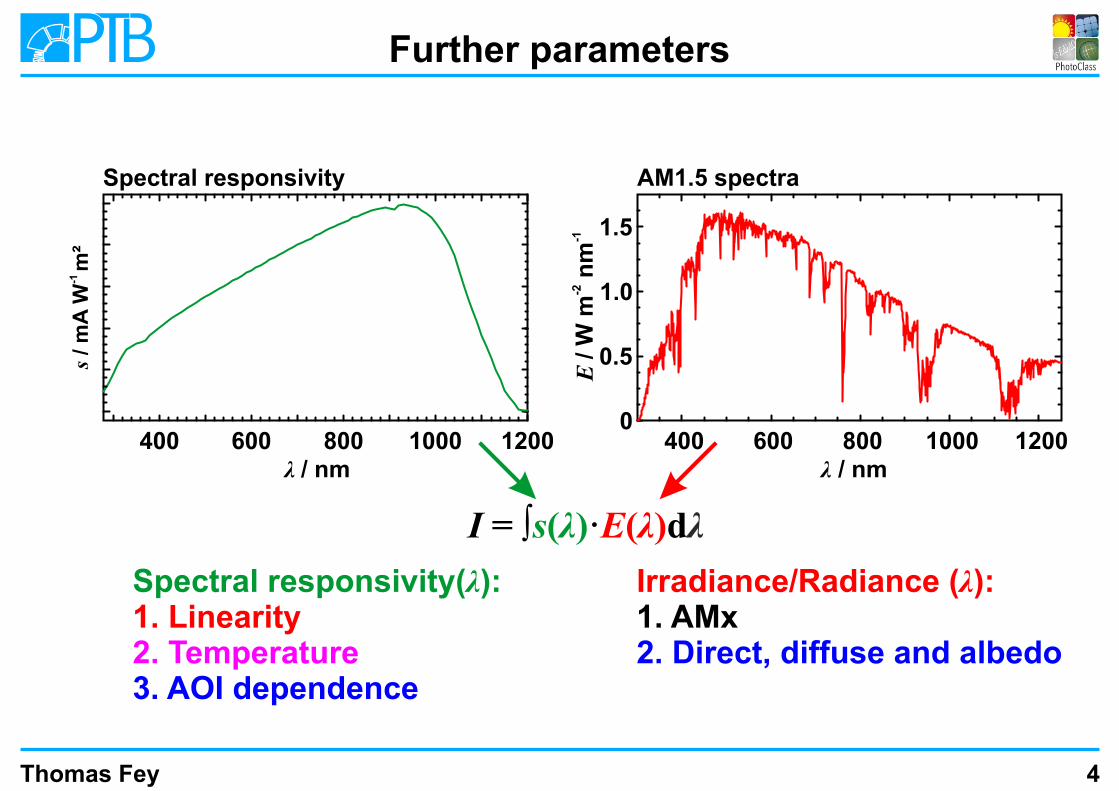
Further parameters
Thomas Fey 4
400 600 800 1000 12000
0.5
1.0
1.5
λ / nm
-2-1
E / W
m n
m
AM1.5 spectra
-1
s / m
A W
m²
λ / nm400 600 800 1000 1200
Spectral responsivity
I = ∫ · ds(λ) E(λ) λ
Spectral responsivity(λ):1. Linearity2. Temperature3. AOI dependence
Irradiance/Radiance (λ):1. AMx2. Direct, diffuse and albedo
New approach
Thomas Fey 5
400 600 800 1000 12000
0.5
1.0
1.5
λ / nm
-2-1
E / W
m n
m
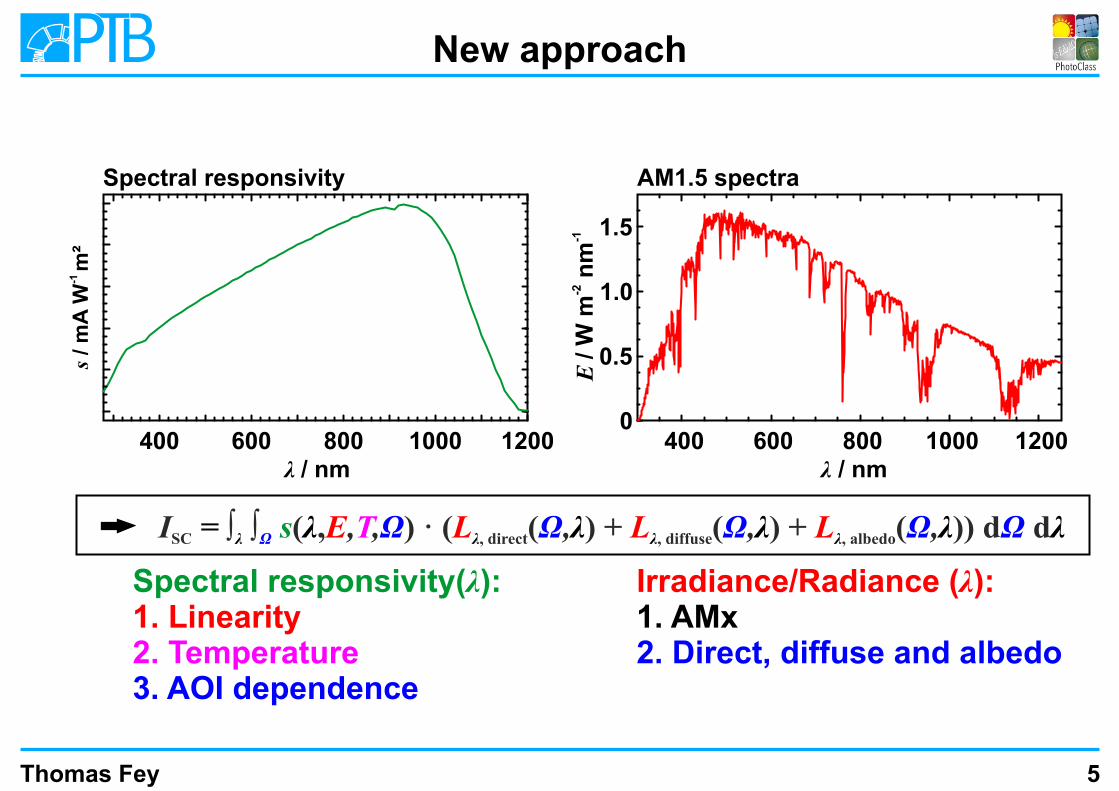
AM1.5 spectra
-1
s / m
A W
m²
λ / nm400 600 800 1000 1200
Spectral responsivity
= λ λ λ λ λλ λ λ λI ∫ ∫ ( , , , ) · ( ( , ) + ( , ) + ( , )) d d SC , direct , diffuse , albedoΩ Ω Ω Ω ΩΩ s E L L LT
Spectral responsivity(λ):1. Linearity2. Temperature3. AOI dependence
Irradiance/Radiance (λ):1. AMx2. Direct, diffuse and albedo
1200400 600 800 1000
-12
s / m
A W
m
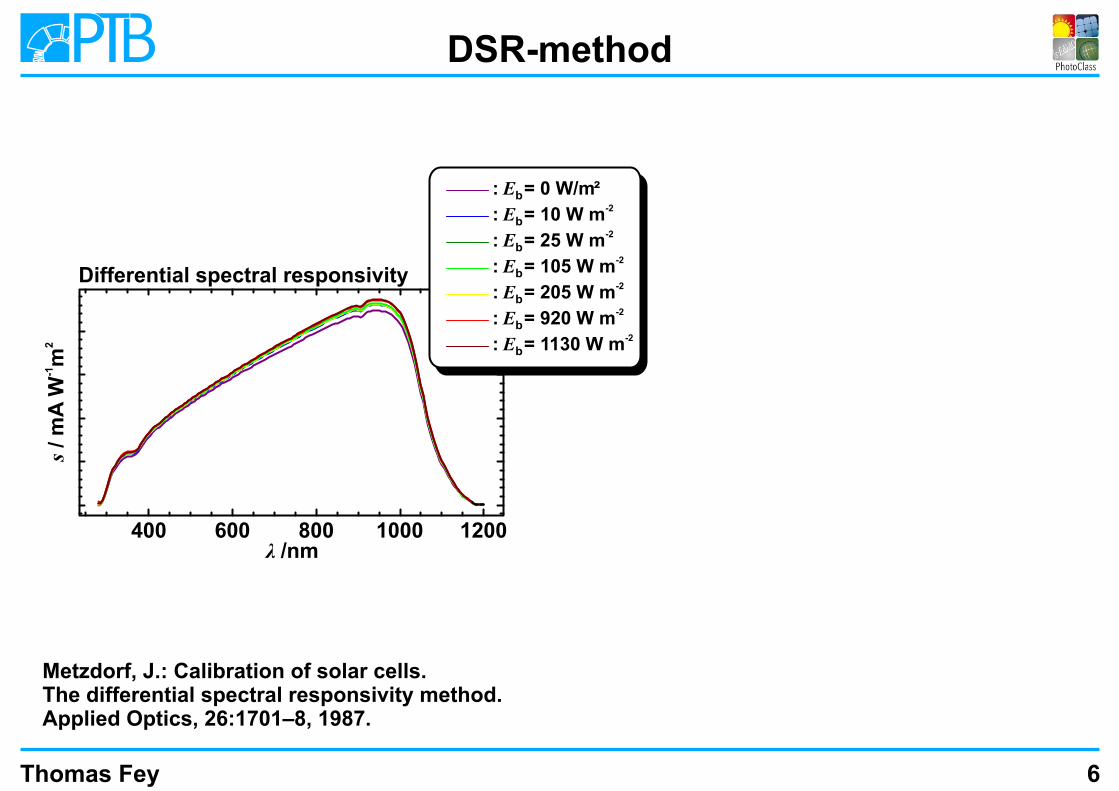
Differential spectral responsivity
λ /nm
DSR-method
Thomas Fey 6
Metzdorf, J.: Calibration of solar cells. The differential spectral responsivity method. Applied Optics, 26:1701–8, 1987.
:
Eb
=
0
W/m²
:
Eb
=
-210 W m
:
Eb
=
-225 W m :
Eb
=
-2105 W m
: Eb = -2
205 W m
: Eb
= -2920 W m
:
Eb
=
-21130 W m
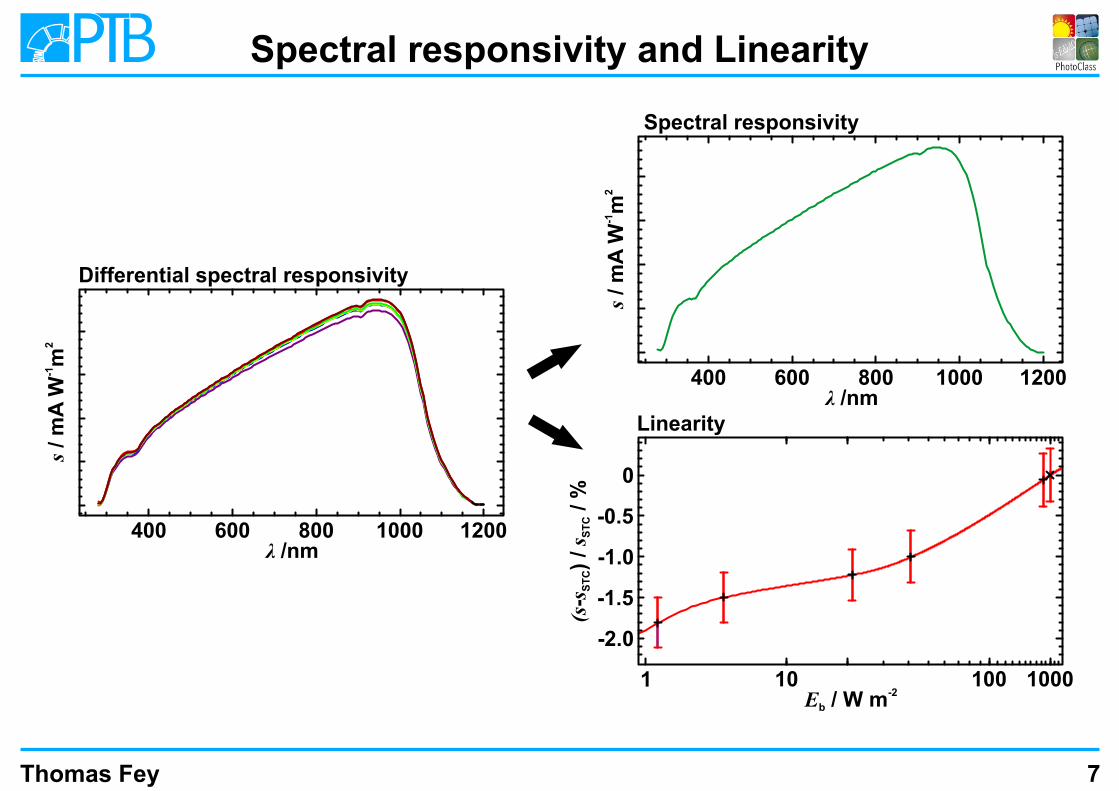
Spectral responsivity and Linearity
Thomas Fey 7
1200400 600 800 1000
-12
s / m
A W
m
Differential spectral responsivity
λ /nm
-2E / W mb
100101 1000
Linearity
-1.5
0
-0.5
-1.0(s
-s s
ST
CS
TC
) /
/ %
-2.0
1200400 600 800 1000
-12
s / m
A W
m
Spectral responsivity
λ /nm
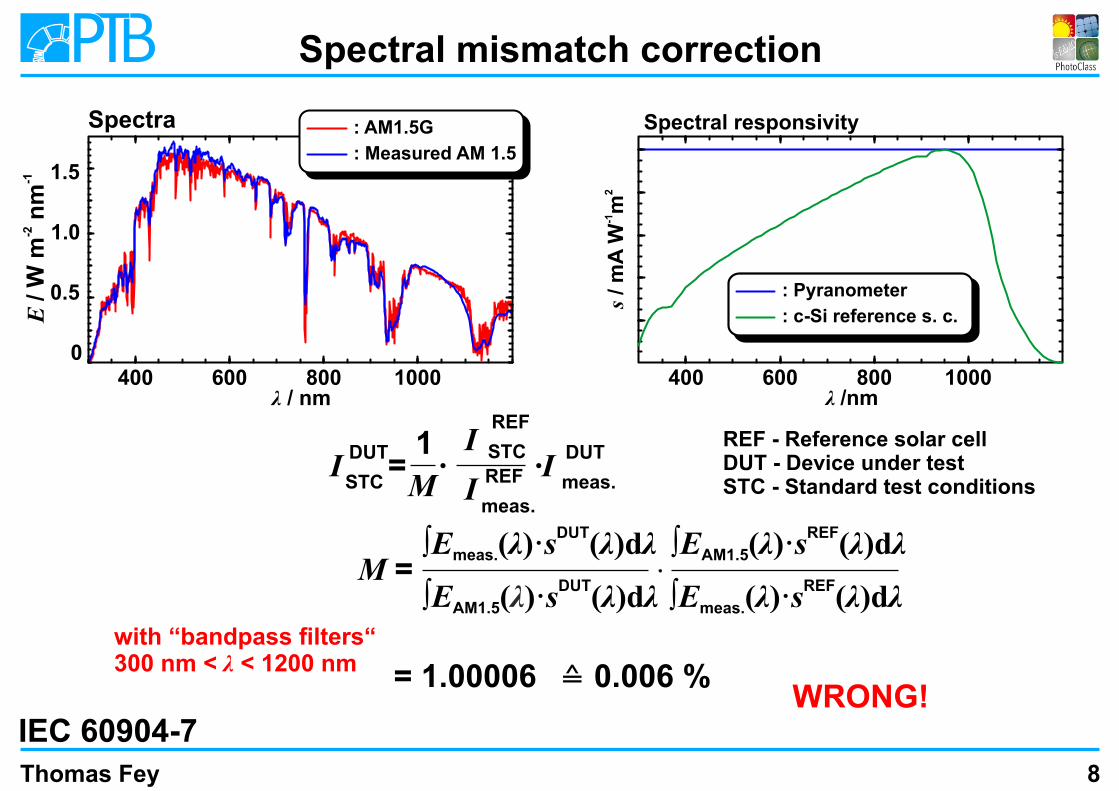
: Pyranometer
: c-Si reference s. c.
Spectral mismatch correction
Thomas Fey 8
400 600 800 1000
-12
s / m
A W
m
Spectral responsivity
λ /nm400 600 800 1000
λ / nm
Spectra
REF - Reference solar cellDUT - Device under testSTC - Standard test conditions
M =
= 1.00006
DUT∫E ( )·s (λ)dλAM1.5 λ REF
∫E (λ)·s (λ)dλmeas.
DUT∫E (λ)·s (λ)dλmeas.
REF∫E (λ)·s (λ)dλAM1.5
I = · ·IDUT
STC
REF
STC
REF
meas.
DUT
meas.
I
IM
1
IEC 60904-7
with “bandpass filters“300 nm < λ < 1200 nm
WRONG!
0
0.5
1.0
1.5
-2-1
E / W
m n
m
≙ 0.006 %
: AM1.5G
: Measured AM 1.5

Spectral mismatch correction
Thomas Fey 9
REF - Reference solar cellDUT - Device under testSTC - Standard test conditions
M =
= 0.986
DUT∫E ( )·s (λ)dλAM1.5 λ REF
∫E (λ)·s (λ)dλmeas.
DUT∫E (λ)·s (λ)dλmeas.
REF∫E (λ)·s (λ)dλAM1.5
I = · ·IDUT
STC
REF
STC
REF
meas.
DUT
meas.
I
IM
1
full spectral range
20001000
-12
s / m
A W
m
Spectral responsivity
λ /nm1000 2000 3000
0.5
1.0
1.5
λ / nm
-2-1
E / W
m n
m
Spectra
: AM1.5G
: Measured AM 1.5
IEC 60904-7
: Pyranometer
: c-Si reference s. c.
≙ 1.4 %
3000
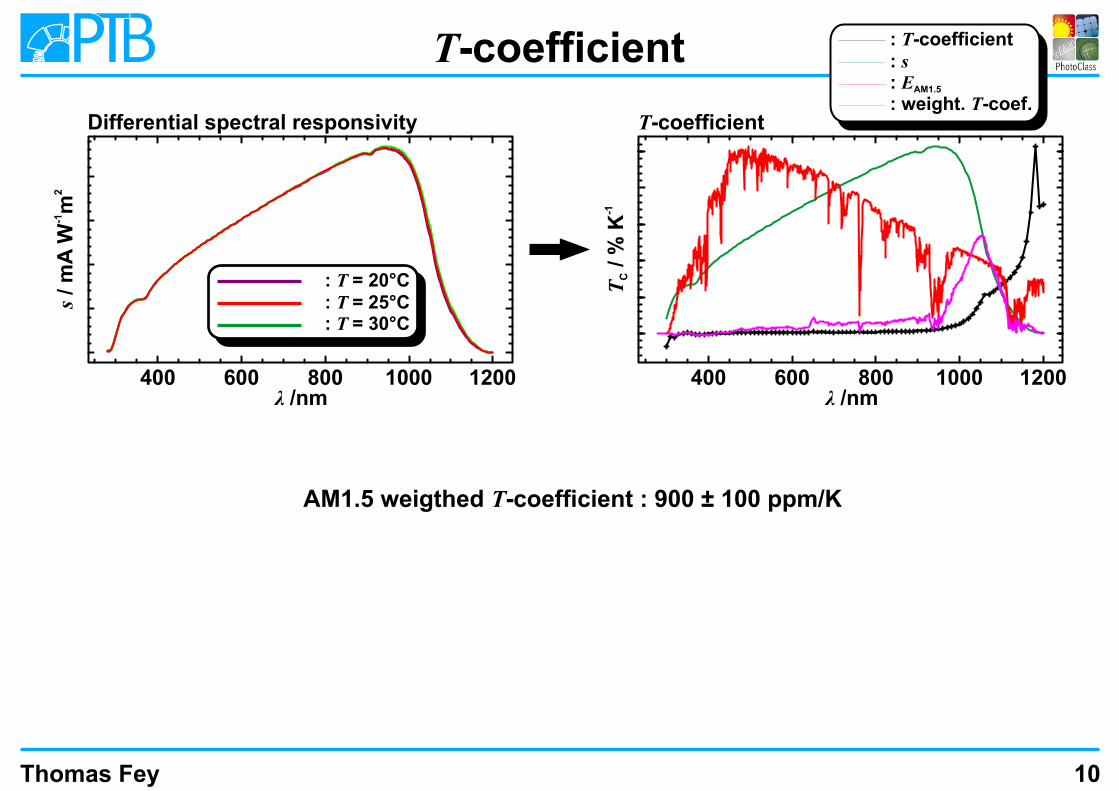
T-coefficient
Thomas Fey 10
1200400 600 800 1000
-12
s / m
A W
m
Differential spectral responsivity
λ /nm
: T = 20°C
: T = 25°C
: T = 30°C
1200400 600 800 1000
-1T
/ %
KC
T-coefficient
λ /nm
: T-coefficient
: s
: EAM1.5
: weight. T-coef.
AM1.5 weigthed T-coefficient : 900 ± 100 ppm/K
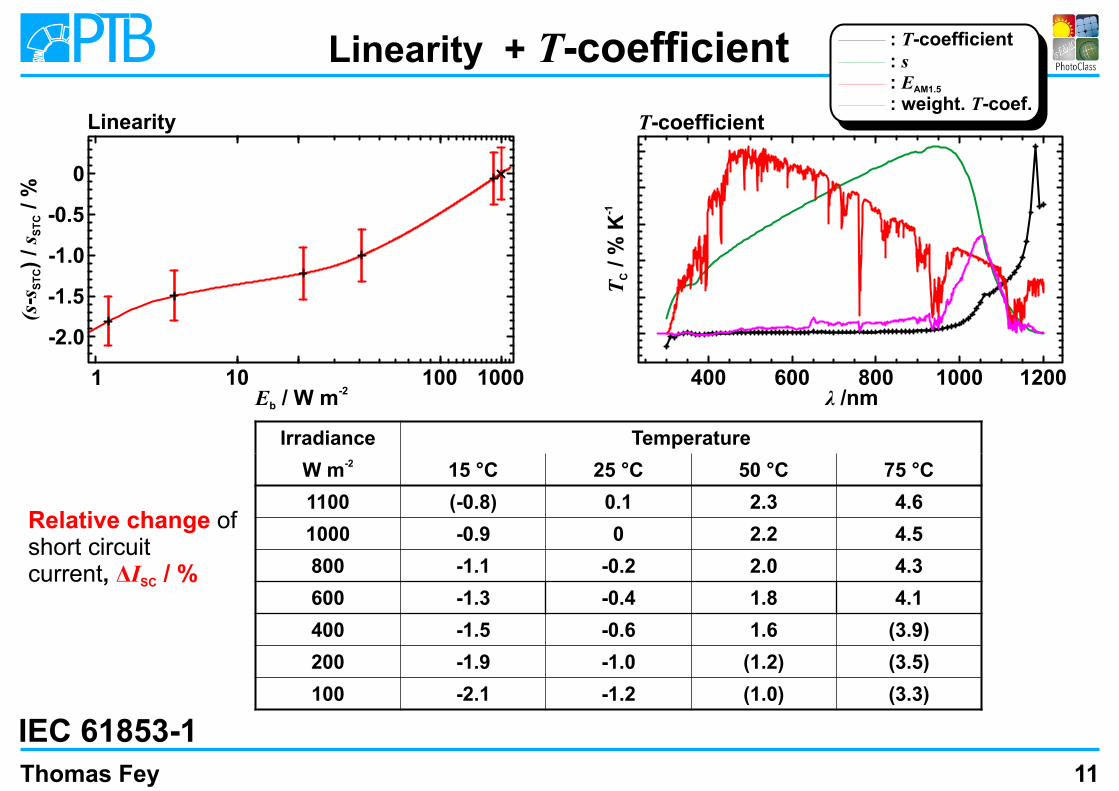
Linearity + T-coefficient
Thomas Fey
-2E / W mb
100101 1000
Linearity
-1.5
0
-0.5
-1.0
(s-s
sS
TC
ST
C)
/ / %
-2.0
Irradiance Temperature-2W m 15 °C 25 °C 50 °C 75 °C
1100 (-0.8) 0.1 2.3 4.6
1000 -0.9 0 2.2 4.5
800 -1.1 -0.2 2.0 4.3
600 -1.3 -0.4 1.8 4.1
400 -1.5 -0.6 1.6 (3.9)
200 -1.9 -1.0 (1.2) (3.5)
100 -2.1 -1.2 (1.0) (3.3)
1200400 600 800 1000
-1T
/ %
KC
T-coefficient
λ /nm
Relative change ofshort circuit current, ΔI / %SC
11
IEC 61853-1
: T-coefficient
: s
: EAM1.5
: weight. T-coef.
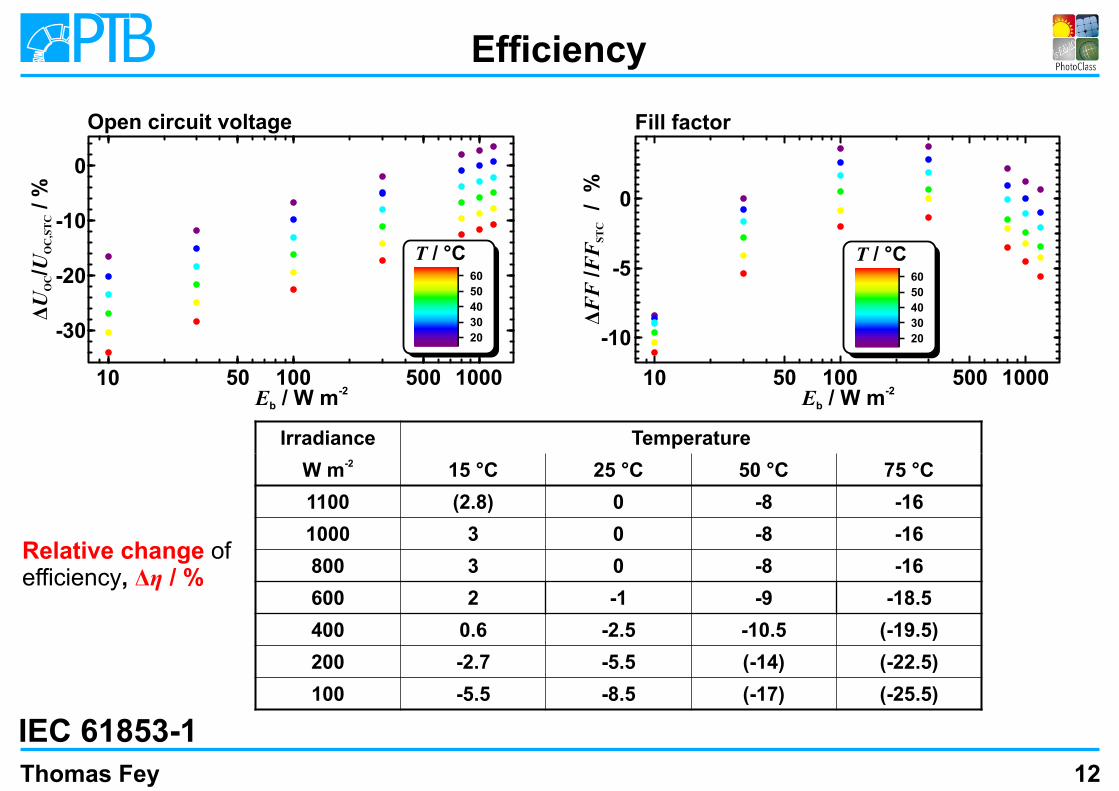
Efficiency
Thomas Fey 12
-2E / W mb
1005010 1000
Open circuit voltage
-20
0
-10
ΔU
/U / %
OC
OC
,ST
C
-30
Irradiance Temperature-2W m 15 °C 25 °C 50 °C 75 °C
1100 (2.8) 0 -8 -16
1000 3 0 -8 -16
800 3 0 -8 -16
600 2 -1 -9 -18.5
400 0.6 -2.5 -10.5 (-19.5)
200 -2.7 -5.5 (-14) (-22.5)
100 -5.5 -8.5 (-17) (-25.5)
Fill factor
Relative change ofefficiency, Δη / %
500
0
-5
-10
-2E / W mb
1005010 1000500
ΔF
F /
FF
/ %
ST
C
T / °C
20
30
40
50
60
T / °C
20
30
40
50
60
IEC 61853-1
Thomas Fey 13
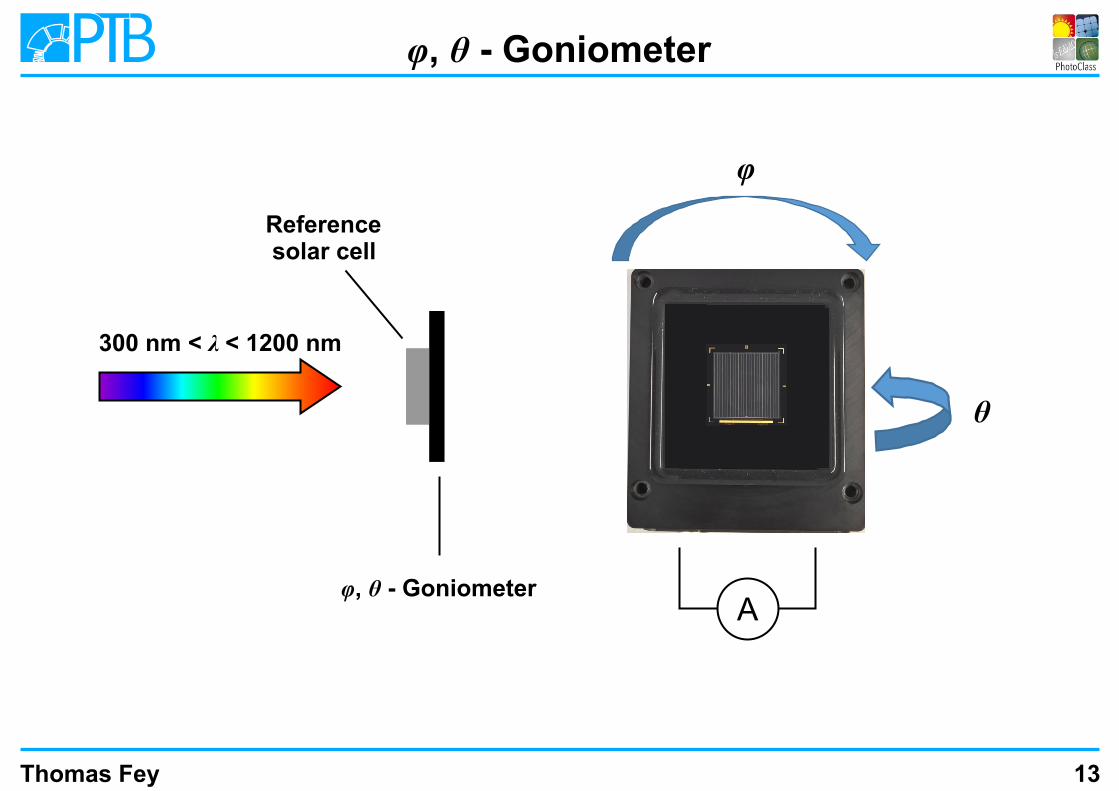
φ, θ - Goniometer
φ
θ
Reference solar cell
φ, θ - GoniometerA
300 nm < λ < 1200 nm

Thomas Fey
Spectral angular response
0 20 60 80θ / °40
Dev
iati
on f
rom
cos
ine
/ % 0
-5
-15
-20
-10
0 20 60 80θ / °40
Dev
iati
on f
rom
cos
ine
/ %
0
-5
-15
-20
-10
5
-25
-30
AM1.5 + s weighted spectral angular responseSpectral angular response
λ / nm
400
600
800
1000
-25
-30
14
Thomas Fey 15
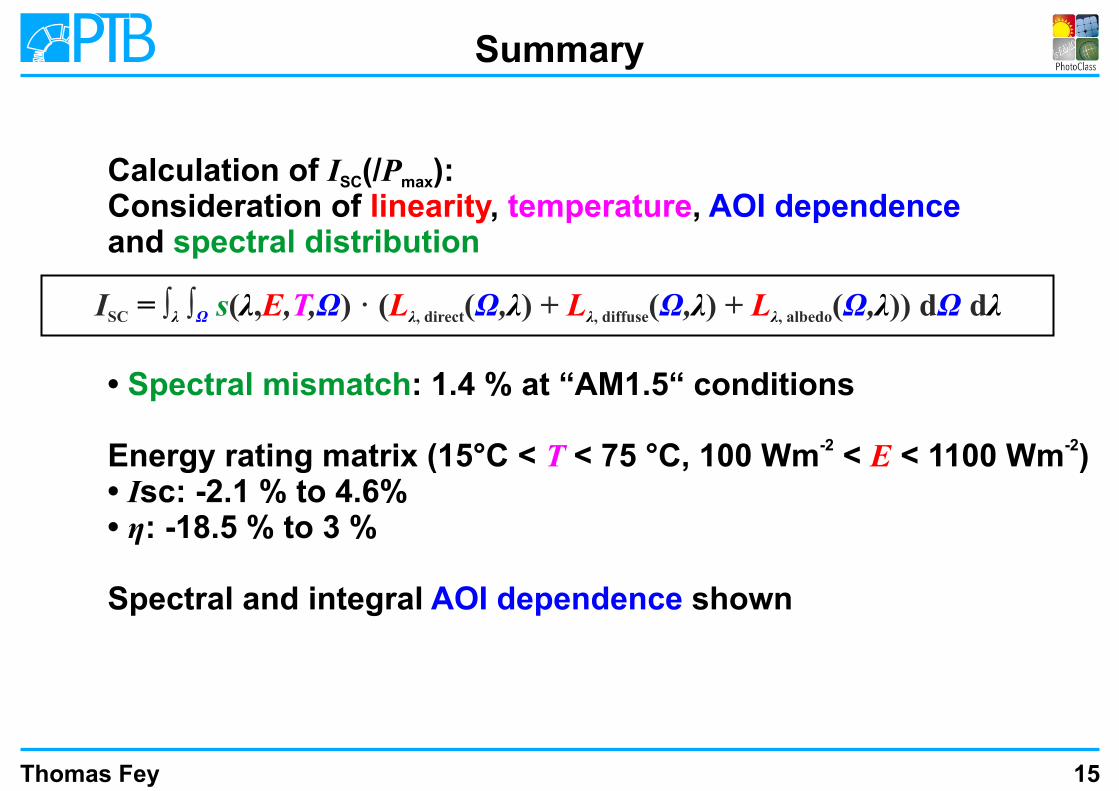
Summary
Calculation of I (/P ): SC max
Consideration of , , linearity temperature AOI dependenceand spectral distribution
• : 1.4 % at “AM1.5“ conditionsSpectral mismatch
-2 -2Energy rating matrix (15°C < < 75 °C, 100 Wm < < 1100 Wm )T E• Isc: -2.1 % to 4.6%• η: -18.5 % to 3 %
Spectral and integral shownAOI dependence
= λ λ λ λ λλ λ λ λI ∫ ∫ ( , , , ) · ( ( , ) + ( , ) + ( , )) d d SC , direct , diffuse , albedoΩ Ω Ω Ω ΩΩ s E L L LT
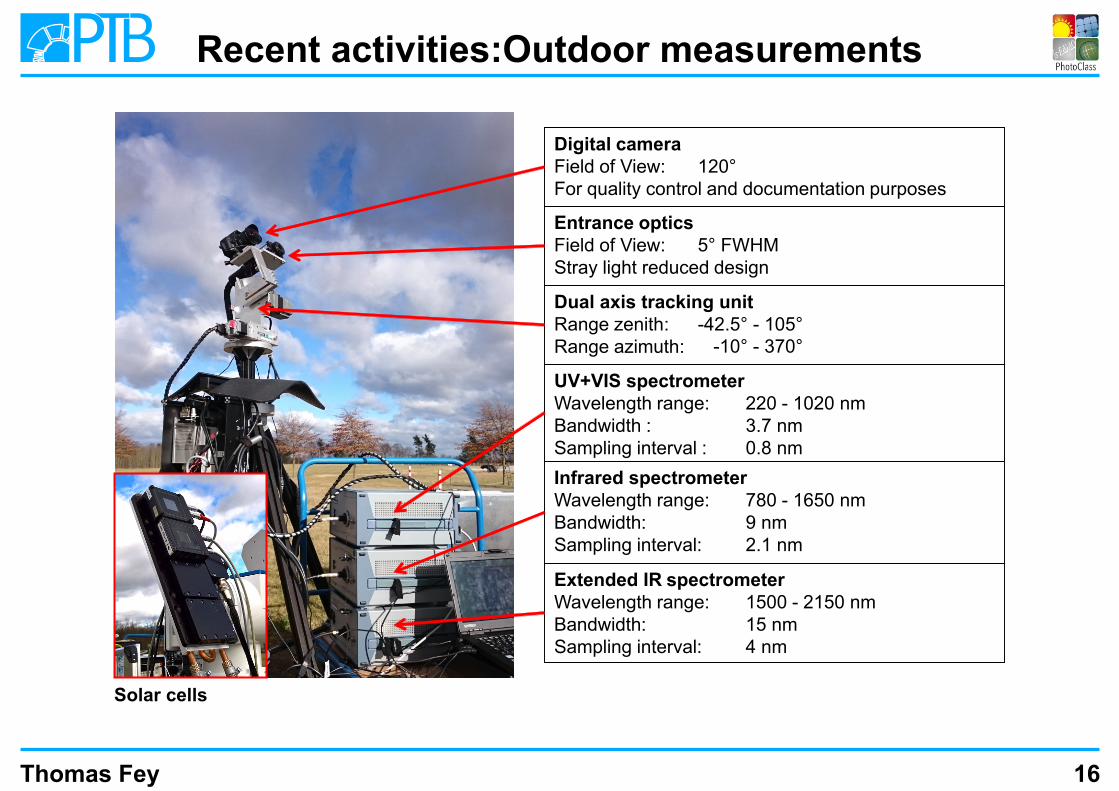
UV+VIS spectrometer Wavelength range: 220 - 1020 nmBandwidth : 3.7 nmSampling interval : 0.8 nm
Infrared spectrometer Wavelength range: 780 - 1650 nmBandwidth: 9 nmSampling interval: 2.1 nm
Extended IR spectrometerWavelength range: 1500 - 2150 nmBandwidth: 15 nmSampling interval: 4 nm
Entrance opticsField of View: 5° FWHMStray light reduced design
Digital cameraField of View: 120°For quality control and documentation purposes
Dual axis tracking unitRange zenith: -42.5° - 105°Range azimuth:
Recent activities:Outdoor measurements
Thomas Fey 16
Solar cells
-10° - 370°
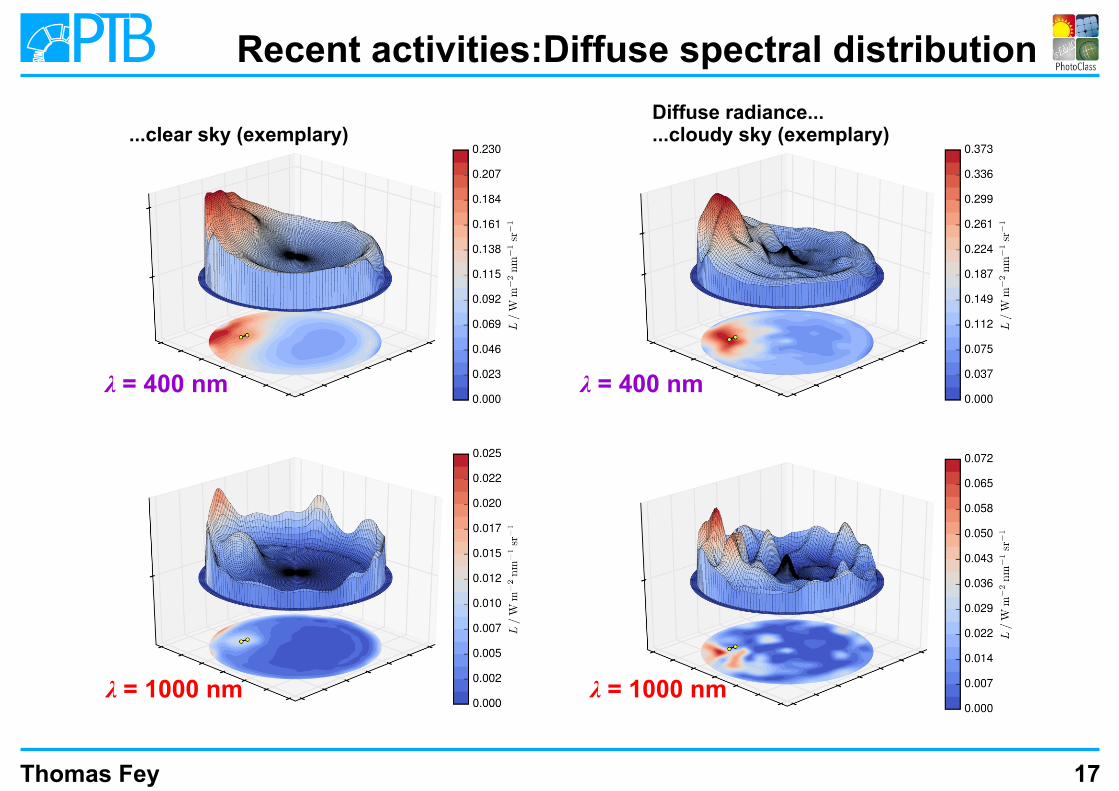
λ = 400 nm
λ = 1000 nm
...clear sky (exemplary)
λ = 1000 nm
λ = 400 nm
Diffuse radiance......cloudy sky (exemplary)
Thomas Fey 17
Recent activities:Diffuse spectral distribution
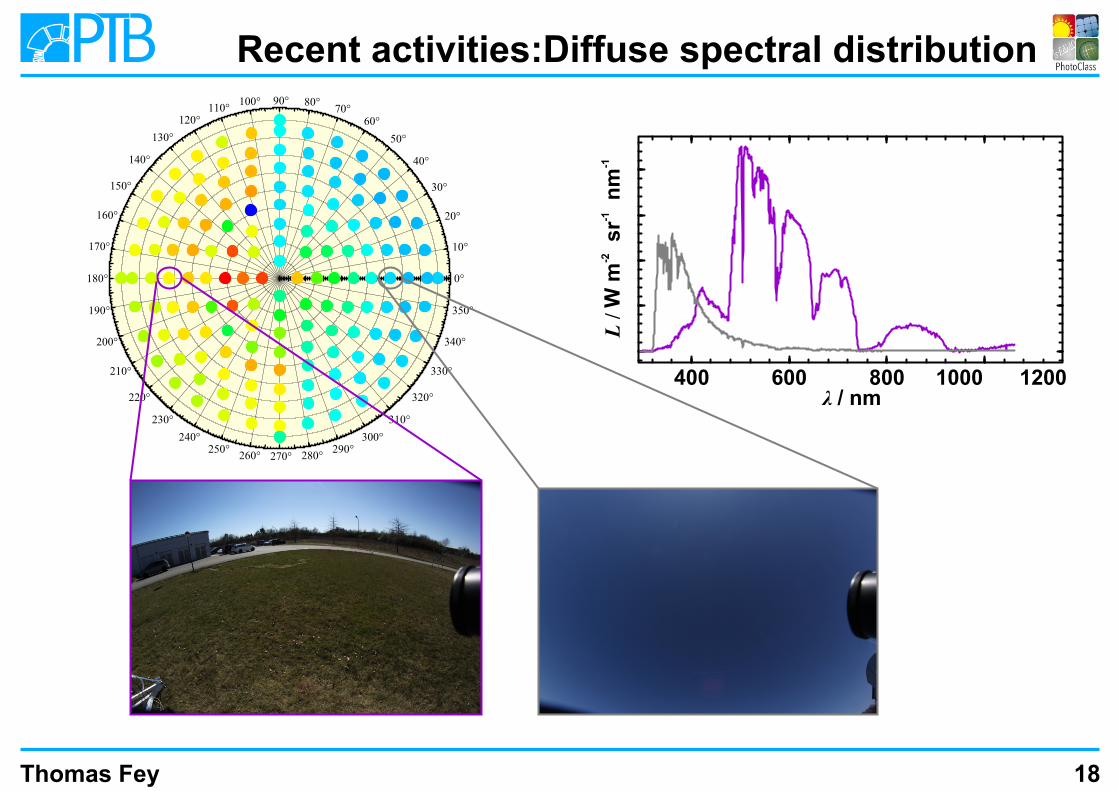
Thomas Fey 18
Recent activities:Diffuse spectral distribution
-2-1
-1L
/ W
m sr
n
m
1200400 600 800 1000λ / nm
0°
10°
20°
30°
40°
50°
60°
70°
80°
90°
100°
110°
120°
130°
140°
150°
160°
170°
180°
190°
200°
210°
220°
230°
240° 250°
260° 270° 280° 290° 300°
310°
320°
330°
340°
350°
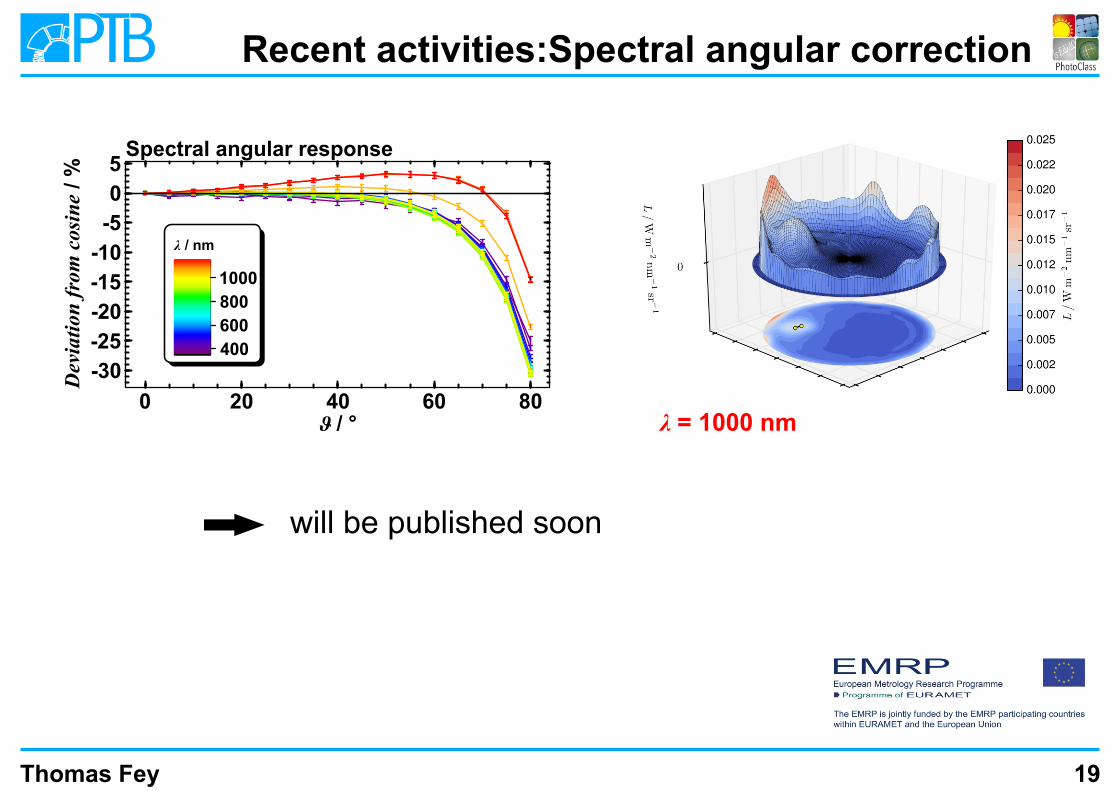
Recent activities:Spectral angular correction
Thomas Fey 19
0 20 60 80ϑ / °40
Dev
iati
on f
rom
cos
ine
/ %
0
-5
-15
-20
-10
5
-25
-30
Spectral angular response
λ / nm
400
600
800
1000
λ = 1000 nm
will be published soon