
1. Provide further justification for the assertion that ...
94
68 Dickens Street Napier 4110 T: 027 307 4185 (Stella) T: 021 0270 4461 (Rowena) T: 021 511 833 (Janeen) www.sageplanning.co.nz 1 | P age 9 November 2017 Our File Ref: HDC17001 Hawke’s Bay Regional Council Private Bag 6006 NAPIER 4142 Attention: Greg Shirras, Consents Planner Dear Greg, Clifton Revetment (CL17034C & Others) - Response to Request for Further Information We refer to your letter (dated 30 August 2017) requesting further information in relation to the resource consent application (CL17034C & Others) by Hastings District Council (the Applicant) to construct and maintain a coastal protection structure within Coastal Hazard Zone 1 and the Coastal Marine Area, and provide the following response on behalf of the Applicant. Existing Environment 1. Provide further justification for the assertion that the reef does not erode at any noticeable rate. The reef at the western end of Clifton Beach has been a feature in historical aerial photographs and plays an important role in aligning the main beach. This reef is a firm structural feature as it is resistant to frequent abrasion from gravel transport and significant wave energy. 2. Provide an updated assessment and description of erosion patterns at the site, using more recent survey data. The report “Clifton Beach: Engineering Assessment”, prepared by Beca Limited (dated 17 July 2017, and attached as Appendix A to the Assessment of Environmental Effects report attached to the resource consent application) describes the erosion at HB1 over the period 1973 to 2002. The annual erosion rate was estimated at 0.7m/year. Beca advise that more recent information on HB1 from 2002 to 2017, indicates a lesser amount of erosion at about 0.4m/year. Interestingly over this period there was both accretion and erosion at the HB1 site. More recently, since 2013, the erosion rate has been about 2m/year. It is noted that verification of the longshore sediment transport model was based on the vegetation lines of rectified aerial photographs over the period 1963 to 2009. The average erosion rate at HB1 (Cell 76) was 0.69m/year. 3. Include a description and plan showing previous road locations. Attached is a series of surveys over the period 2013-2017 by Zorn Surveying. (Attachment 1). The erosion over this period varies 0.9 to 3m/year along the erosion scarp, just seaward of the access road.
Transcript of 1. Provide further justification for the assertion that ...

68 Dickens Street Napier 4110
T: 027 307 4185 (Stella) T: 021 0270 4461 (Rowena)
T: 021 511 833 (Janeen) www.sageplanning.co.nz
1 | P a g e
9 November 2017
Our File Ref: HDC17001
Hawke’s Bay Regional Council Private Bag 6006 NAPIER 4142
Attention: Greg Shirras, Consents Planner
Dear Greg,
Clifton Revetment (CL17034C & Others) - Response to Request for Further Information
We refer to your letter (dated 30 August 2017) requesting further information in relation to the resource consent application (CL17034C & Others) by Hastings District Council (the Applicant) to construct and maintain a coastal protection structure within Coastal Hazard Zone 1 and the Coastal Marine Area, and provide the following response on behalf of the Applicant.
Existing Environment
1. Provide further justification for the assertion that the reef does not erode at any noticeable rate.
The reef at the western end of Clifton Beach has been a feature in historical aerial photographs and plays an important role in aligning the main beach. This reef is a firm structural feature as it is resistant to frequent abrasion from gravel transport and significant wave energy.
2. Provide an updated assessment and description of erosion patterns at the site, using more recent survey data.
The report “Clifton Beach: Engineering Assessment”, prepared by Beca Limited (dated 17 July 2017, and attached as Appendix A to the Assessment of Environmental Effects report attached to the resource consent application) describes the erosion at HB1 over the period 1973 to 2002. The annual erosion rate was estimated at 0.7m/year. Beca advise that more recent information on HB1 from 2002 to 2017, indicates a lesser amount of erosion at about 0.4m/year. Interestingly over this period there was both accretion and erosion at the HB1 site. More recently, since 2013, the erosion rate has been about 2m/year.
It is noted that verification of the longshore sediment transport model was based on the vegetation lines of rectified aerial photographs over the period 1963 to 2009. The average erosion rate at HB1 (Cell 76) was 0.69m/year.
3. Include a description and plan showing previous road locations.
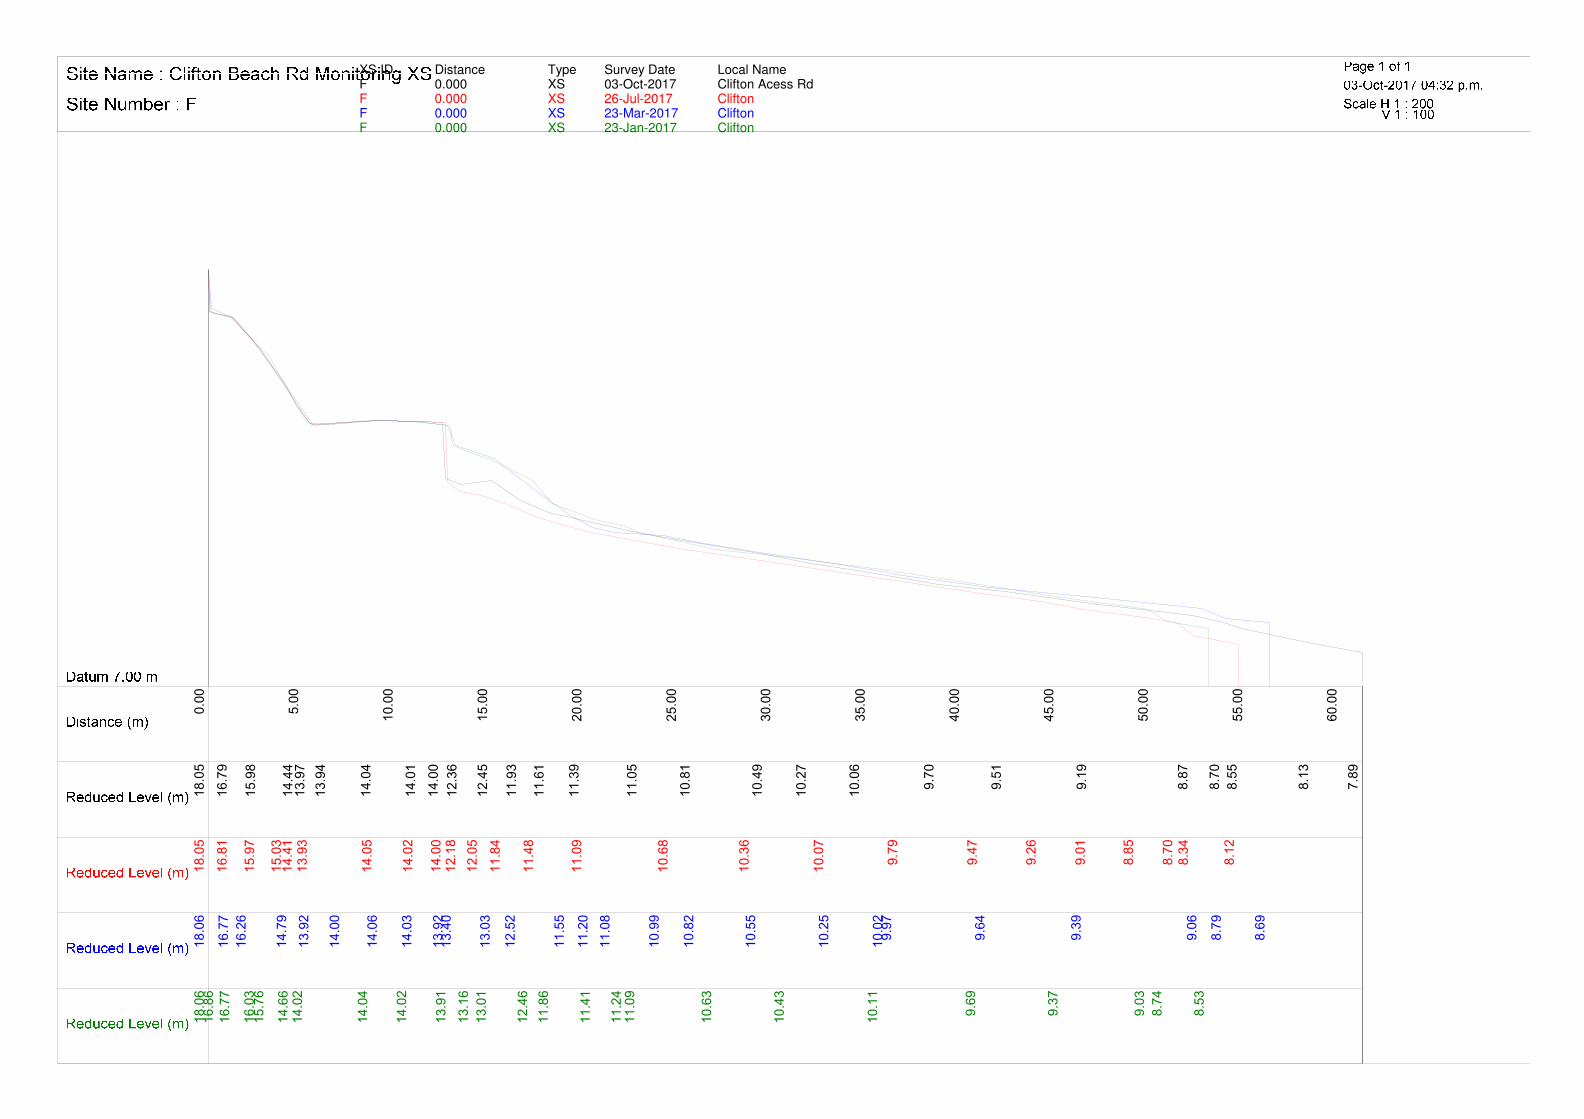
Attached is a series of surveys over the period 2013-2017 by Zorn Surveying. (Attachment 1). The erosion over this period varies 0.9 to 3m/year along the erosion scarp, just seaward of the access road.

2 | P a g e
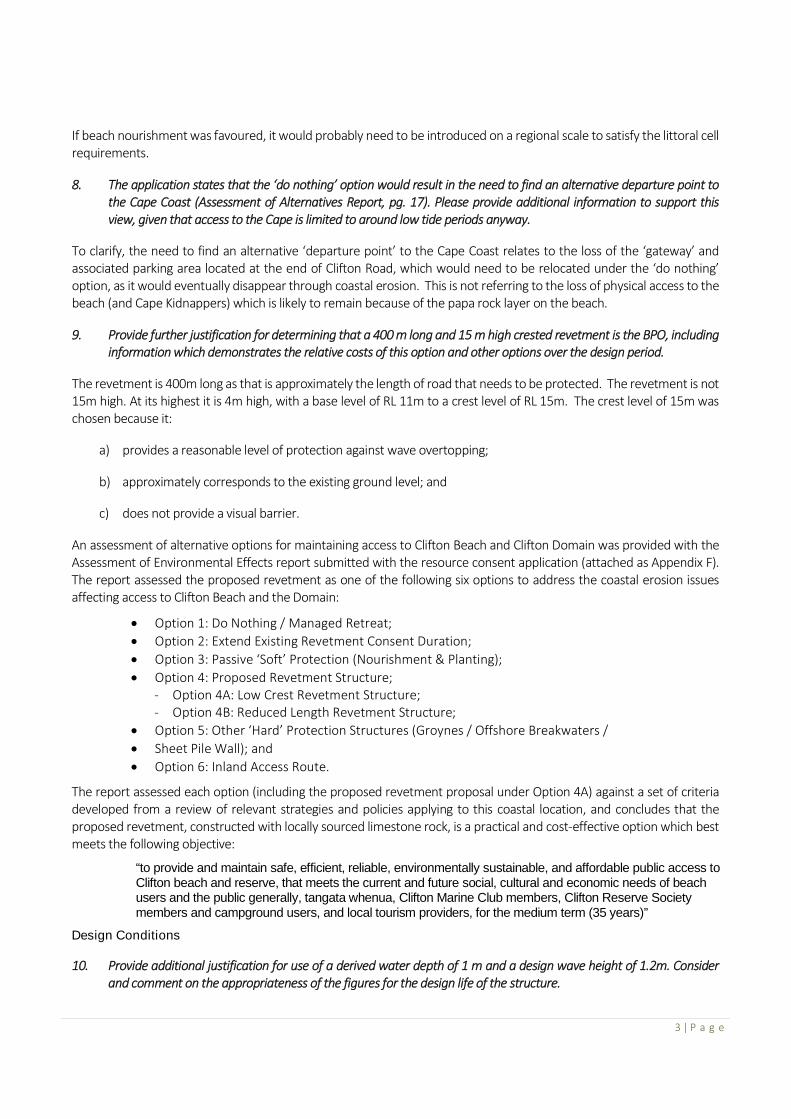
Also attached are a series of cross-sections along the existing access road. (Attachment 1)
4. Comment on the effects of the existing revetment, and use the data required to be collected under the consent for this revetment to demonstrate the scale of any effects (or lack of effects).
Based on the survey data in Attachment 1, Beca advise that it appears that an immediate cut-in, down-drift of the existing wall, is not evident. The maximum erosion is more evident some 200m from the existing revetment. This would indicate that the recent erosion adjacent to the access road is more attributable to the imbalance between sediment supply and longshore currents (due to waves) than the effects of the existing revetment.
Assessment of Alternative Options
5. Provide a more detailed assessment of the ‘do nothing’ option, include consequences and expected timeframes of this option.
A quantitative description of the ‘do nothing option’ is given in Section 3.2.1 of the Beca engineering assessment report, referred to above.
The HB1 profile indicates an erosion rate of about 0.7m/year over the years 1972-2002. The 2003/2004 Tonkin and Taylor Report1 indicated an erosion risk set back zone of 75m (with 0.2m seal level rise) till 2060 and 107m (with 0.5m sea level rise) to 2100. Given the existing erosion trend, Beca consider that erosion of the amount estimated by Tonkin and Taylor appears likely, with the consequences of loss of public and private land and infrastructure with no access to the existing camping ground.
6. There is no information presented on wave differences to demonstrate the increase in exposure risk regarding relocation of the boat ramp. Provide detail of wave heights based on SWAN modelling at the current boat ramp location and the alternative boat ramp location that was considered.
There is no alterative boat ramp as part of the proposed works. There is a concrete ramp off Clifton Road included as part of the resource consent application, to provide for easier vehicle access onto the beach, but this is not intended to be used as a boat ramp.
The boat ramp mentioned in the Evaluation of Options (Section 3.2.4) in the Beca engineering assessment report was the option to relocate the boat ramp. Beca advise that, if the Applicant was to build a new boat ramp at the western end of Clifton Beach, it is in a relatively exposed location. Given health and safety requirements for a public boat ramp some form of sheltering would likely be required, such as a breakwater. This would have an adverse effect on the longshore sediment transport and would also be expensive.
7. Provide further details on beach nourishment as alternative options to the revetment, and include estimate of volume requirements and any other reasons why this option is not considered the BPO.
Beach nourishment would entail providing an initial placement of gravel/sand material and a commitment to continued nourishment. Beca advise that the difficulty with this option would be that placement of material just to cover the project area would produce a discontinuity in the plan profile of the beach. This could be overcome by extending the initial placement over the entire beach or placing containment structures (similar to groynes) at either end of the project area. In any event, continued nourishment of the beach would be required.
There is also the residual risk that existing infrastructure would be vulnerable to erosion during extreme sea storm conditions.
1 Tonkin & Taylor, Hawke’s Bay Regional Coastal Environment Plan: Coastal Hazards. Rep. Vol. 1. (2003).
3 | P a g e
If beach nourishment was favoured, it would probably need to be introduced on a regional scale to satisfy the littoral cell requirements.
8. The application states that the ‘do nothing’ option would result in the need to find an alternative departure point to the Cape Coast (Assessment of Alternatives Report, pg. 17). Please provide additional information to support this view, given that access to the Cape is limited to around low tide periods anyway.
To clarify, the need to find an alternative ‘departure point’ to the Cape Coast relates to the loss of the ‘gateway’ and associated parking area located at the end of Clifton Road, which would need to be relocated under the ‘do nothing’ option, as it would eventually disappear through coastal erosion. This is not referring to the loss of physical access to the beach (and Cape Kidnappers) which is likely to remain because of the papa rock layer on the beach.
9. Provide further justification for determining that a 400 m long and 15 m high crested revetment is the BPO, including information which demonstrates the relative costs of this option and other options over the design period.
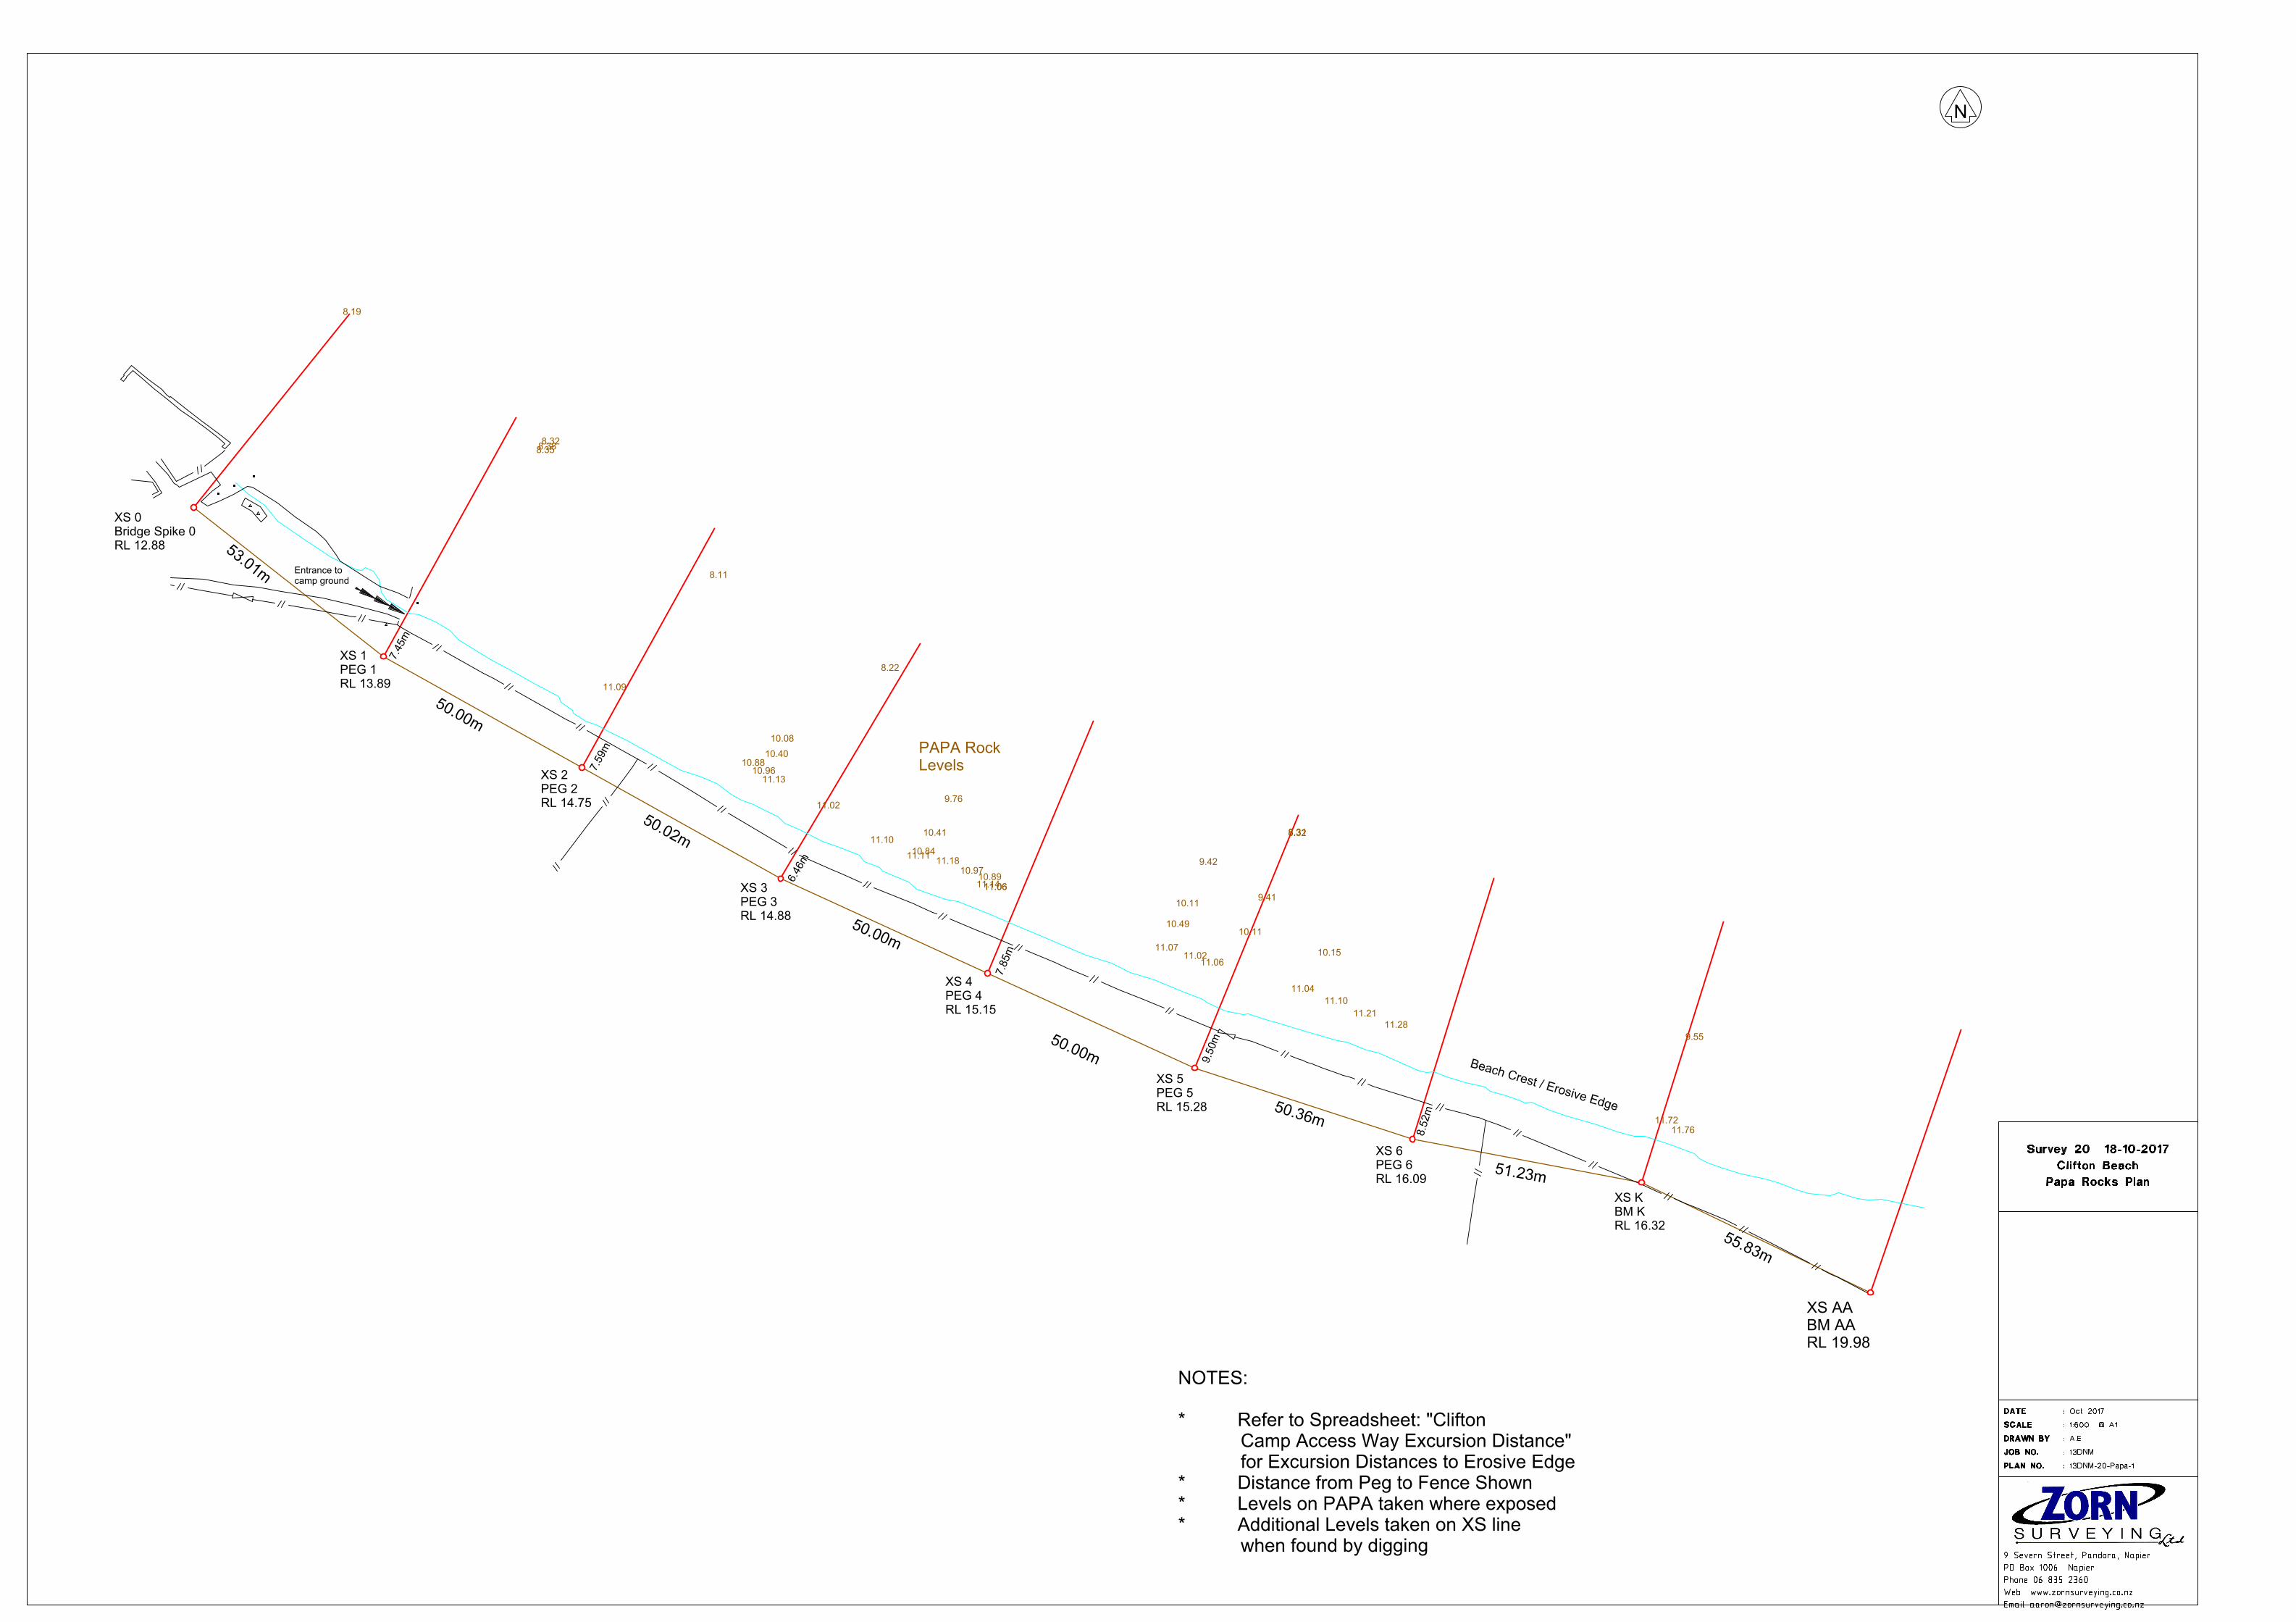
The revetment is 400m long as that is approximately the length of road that needs to be protected. The revetment is not 15m high. At its highest it is 4m high, with a base level of RL 11m to a crest level of RL 15m. The crest level of 15m was chosen because it:
a) provides a reasonable level of protection against wave overtopping;
b) approximately corresponds to the existing ground level; and
c) does not provide a visual barrier.
An assessment of alternative options for maintaining access to Clifton Beach and Clifton Domain was provided with the Assessment of Environmental Effects report submitted with the resource consent application (attached as Appendix F). The report assessed the proposed revetment as one of the following six options to address the coastal erosion issues affecting access to Clifton Beach and the Domain:
• Option 1: Do Nothing / Managed Retreat;
• Option 2: Extend Existing Revetment Consent Duration;
• Option 3: Passive ‘Soft’ Protection (Nourishment & Planting);
• Option 4: Proposed Revetment Structure; - Option 4A: Low Crest Revetment Structure; - Option 4B: Reduced Length Revetment Structure;
• Option 5: Other ‘Hard’ Protection Structures (Groynes / Offshore Breakwaters /
• Sheet Pile Wall); and
• Option 6: Inland Access Route.
The report assessed each option (including the proposed revetment proposal under Option 4A) against a set of criteria developed from a review of relevant strategies and policies applying to this coastal location, and concludes that the proposed revetment, constructed with locally sourced limestone rock, is a practical and cost-effective option which best meets the following objective:
“to provide and maintain safe, efficient, reliable, environmentally sustainable, and affordable public access to Clifton beach and reserve, that meets the current and future social, cultural and economic needs of beach users and the public generally, tangata whenua, Clifton Marine Club members, Clifton Reserve Society members and campground users, and local tourism providers, for the medium term (35 years)”
Design Conditions
10. Provide additional justification for use of a derived water depth of 1 m and a design wave height of 1.2m. Consider and comment on the appropriateness of the figures for the design life of the structure.

4 | P a g e
The design water level is taken as RL 12.0m (including RL 10.9m for MHWS, 0.8m for storm surge, and 0.3m for sea level rise over the resource consent period of 35 years). The base of the revetment will be set at RL 11.0m as this is the general level of the papa rock at the revetment toe. Where the papa rock is lower, a toe detail will be incorporated with a base level of about RL 10.7m. Therefore, where there is papa rock the water depth will be 1.0m and where there is the rock toe detail the water depth is 1.3m. Given the higher energy offshore wave climate, the revetment will be subject to frequent depth limited waves.
The site will be subject to an irregular wave field with a relatively steep beach approach gradient of 8%. With reference to the Rock Manual (2007) - Figure 4.40 - the highest significant wave height to depth ratio is 1.2, giving significant wave heights of 1.2m to 1.5m.
As the design is based on depth limited waves breaking at the toe of the structure there is no wave set-up which would affect the design water level.
It is acknowledged that larger waves will break in the near shore and reformed waves will frequently impact on the revetment structure. That condition will create wave set up at the toe of the structure but the reformed waves in an irregular wave field generally have a significant wave height to depth ratio less than for the initial breaking wave. Based on an analysis of wave attenuation through surf zone using an energy balance relationship the following results were obtained.
Off-shore significant wave height (Hs-m)
Off-shore significant wave period (Tm-s)
Design significant wave height at revetment toe (Hs-m)
5.4 10 1.1
5.0 16 1.2
Therefore, reformed waves at the revetment will be of a similar size to the adopted design wave. Because the conditions are depth limited, they will be frequently experienced.
11. Consider and comment on the ability of the chosen rock armour to withstand major storm events.
For the limestone rock (with an assumed density of 2.2t/m3) and for an irregular wave field, Beca estimate that a rock size of 900mm is required for the 1.2m significant wave height and 1100mm for the 1.3m significant wave height. Beca therefore suggests a nominal rock size of 1000mm. They did not find that the rock size was too sensitive over the range of wave periods 10 to 16s.
As stated above, the revetment will be subject to frequent depth limited waves, particularly for high tidal levels. Some damage could therefore be expected from time to time.
Beca consider that the main effect of the wave conditions on the overall performance is the use of local limestone material. It is a soft rock and will need to be regularly inspected and repairs made. This is similar to what happens at Waimarama.
It is further noted that the small section of existing revetment has a rock size of 700mm. Beca’s understanding is that this wall has been durable and intact over the recent sea storms. See attached memorandum from Council (Attachment 2).
Design Profile
12. There is a discrepancy in the design of the buried toe between the report (2 m width) and the cross-section (3 m width). Please clarify.
The toe should have width of 3 x Rock Diameter which equates to 3m.

5 | P a g e
13. It is unclear if the plan views include the 3 m rock toe on the proposed revetment footprint or what the different shadings show on the plans. Please clarify.
As discussed below, in response to Question 14, the extent of the papa rock means that the toe detail mainly comprises keying the rock revetment into the papa rock. In the revised Beca report (Attachment 4) the plan extent of the rock toe keyed into the papa rock is shown.
14. The drawings show the cross sections to the MHWS level as the existing ground level (RL 11 m) but rock shelf levels are around 9.8 m and survey plans show levels sloping seaward down to around 9 m. Please update cross sections with accurate existing profile information and the inferred extent of the rock armour to the rock shelf.
Recent survey information by Zorn surveyors (see Attachment 3) shows the papa rock levels. The rock levels at the toe of the revetment on the survey plan are consistently around RL 11.0m.
Cross-sections in the Beca report have been updated with approximate levels (see Attachment 4).
15. Consider overtopping for possible sea levels over the consent period.
Overtopping for a significant wave height (Hs) of 1.2m and wave periods of 10s to 16s is described in Section 4.2.4 of the Beca report. If the significant wave height were 1.5m for a wave period of 10s, then the overtopping rate would be 65 L/s/m which would increase to 320 L/s/m for a wave period of 16s.
Beca’s assessment indicates that for wave periods of less than 14s (and Hs<1.5m), the overtopping rate will be less than 200 L/s/m which is the damage threshold for revetment structures.
16. Comment on the degree of overtopping, and any risks this presents to public safety and measures that will be put in place to manage this risk noting the comment from T&T on the ability for waves to transmit through permeable rock armour.
In general, the backshore area is near the same level at the crest so the issue of transmission doesn’t apply over those areas. At either end of the revetment the backshore slopes down (as does the revetment) to match in with existing ground levels. Some increase in overtopping (and associated risk) will occur but cannot be designed out as there is a need to match in with the existing ground contours.
It is noted that overtopping with the revetment in place will be better than the existing situation.
Maintenance
17. The report indicates that beach nourishment may be required due to the impounded loss. Please provide details on how the volume has been determined and the proposed trigger level for instigating this measure.
The impoundment loss is based on a long-term ambient erosion rate of 0.7 m/year. The length of the revetment is 400m and the average scarp height is 3.4 m. This would yield about 950 m3/year of erodible material. The gravel component of this material was assessed as 60%, which equates to about 600 m3/year. The Coastal Processes Assessment report (attached as Appendix D to the Beca report) refers to a reduction in littoral supply of 500 m3 - 1000 m3/year which also has an allowance for sea level rise.
The trigger level for instigating beach nourishment is set out in the proposed Conditions of Consent that were submitted with the application.

6 | P a g e
18. Please clarify, with justification, if nourishment is to be conducted 6 or 12 monthly.
Ideally replenishment should be several times per year. Practically, however, this is difficult and disruptive – it is more likely to be an annual event, like on Westshore Beach. The need for replenishment will be determined by monitoring the immediate down-drift area, based on 6-monthly monitoring (and after sea storms), with the aim of placing it within 2 months of exceeding any trigger. The aim would be for any replenishment to take place in winter.
Environmental Effect on the Revetment (Beca, 2017b)
19. Please provide all relevant figures at A3 with better selection of label colour and better use be made of tabulated or graphed data.
These were emailed to Council (Greg Shirras) by Sage Planning on 16 August 2017.
Model Domains and Calibration
20. Please extend the model area to include HB2 and measure the change observed to the north of Te Awanga.
See response to Query 22. As little long-term coast line movement was identified or modelled at the western end of the model (Cell 39) it was considered that there would be no flow over effect into Te Awanga.
In order to resolve the complicated wave processes along the shoreline SWAN modelling was completed to provide varying wave conditions at approximately 100 m intervals along the shoreline. As the sediment transport modelling incorporated the detailed wave data alongshore, extending the model will not change the results for the study area.
21. Please confirm the process to derive the target shoreline values derived from Table 3.1 and 3.2. Note Cell 39 has small amounts of retreat in Table 3.1 but no retreat in Table 3.2.
Retreat rates were obtained by comparison of dune vegetation from historical aerial photographs over time. Each photograph was ortho-corrected to enable direct comparison. Rates were compiled at points of interest along the shoreline with respect to the model baseline.
Comparison of the aerial photographs show negligible movement of the shoreline at Cell 39. The measurements in Table 3.1 of the Coastal Processes Assessment Report are a maximum observed value of the surrounding shoreline. For the purposes of the modelling a 0 (zero) m target rate was adopted as that was considered more representative of the average shoreline movements in the area.
22. Please amend labelling in Figure 3.5.
Figures have been amended in the revised Beca report: 1980 vegetation line = green and the 2009 vegetation line = red.
23. Confirm if the modelling takes into account any nourishment. Include annual nourishment as proposed and confirm if this mitigates any identified effects.
To be conservative renourishment was not included in the modelling. Provision of compensatory loss due to sediment impoundment is not renourishment as down-drift erosion will continue.
Public Access
24. Please provide quantification of the reduction in access along the beach due to the installation of the revetment, including consideration of continued shoreline retreat and sea level change over the design life of the structure.

7 | P a g e
Clifton beach will continue to erode down-drift of the revetment at the rate of 0.7 - 1.0 m/year. The extent of access in front of the revetment is dependent on the level of the papa rock and the amount of up-drift littoral supply (from the Cape Kidnappers area). Only a mantle of gravel/sand exists above the papa rock.
On the assumption that the beach elevation down-drift will be the same as in front of the revetment until the papa rock is encountered, then the sand/gravel seaward of the proposed revetment will be lost within a 10 year period. Thereafter the papa rock will form the beach profile in front of the revetment. Because of the continued littoral movement of sediment, however, there will be some sand/gravel over the beach profile.
Sea level rise will not affect the papa rock beach profile.
Climate Change
25. Please provide assessment of change over 10 year increments, with sea level adjustments built in step wise as a simulation of possible future change.
See response to Query 24. There is some further discussion on the effect of sea level rise within the study area in the revised Beca report (refer to Sections 4 and 5 of the Beca report, and Sections 3.5 and 4 the Coastal Processes Assessment report in Appendix D of the Beca report).
Reclamation
26. Cross section 5 of the provided plans appears to show that the revetment and road will move seaward from the existing shoreline position upon an area of imported fill. The AEE states that the rules relating to reclamations are not relevant as no infilling of material between the revetment and the existing foreshore will be undertaken. Please consider and comment on whether consent for a reclamation is also required.
‘Reclamation’ is defined in the Regional Coastal Environment Plan as: “means the permanent infilling of a waterbody or part of a water body with sand, rock, quarry material, concrete, or other similar material, for any purpose, and includes any embankment or causeway …”.
It is confirmed that some infilling in the Cross Section 5 location will be required to match up the current scarp with the existing revetment, bearing in mind that some down-drift erosion from the existing revetment has taken place.
As such, a Discretionary Activity resource consent is also required for reclamation in this area under Rule 111 of the Regional Coastal Environment Plan. The Applicant therefore amends their proposal to include an application for reclamation.
27. Given that the construction of the revetment may result in effects on public access along the beach over time (see questions above), it is important that public access along the proposed walkway and road is available. The proposed consent conditions (Appendix G) do not appear to reflect the recommendations of the recreational planner’s report. Please confirm if it is intended that the public will be able to use the road and walkway over its full length.
The proposed access road will connect Campground No. 1, which is located within the Clifton Domain (being a public reserve), from the Clifton boat ramp, along the front of the Gordon property, to an area in front of the Clifton Café. The proposed revetment will provide long term coastal protection to preserve access along this section of Clifton beach for Camp patrons and Clifton Marine Club members, as well as the public who have access through Campground No.1 to the public boat ramp, and the public carpark and picnic area at the northern end of the campground. The proposed access road will provide for a 5.0-metre-wide multimodal access road (vehicle, walking and cycling) and an amenity planting strip and two vehicle passing bays.

8 | P a g e
As noted in Section 3.1 of the Recreation Assessment Report (provided as Appendix E to the Assessment of Environmental Effects report for the resource consent applications), Hastings District Council’s Draft Cape Coast Reserves Management Plan identifies an opportunity for providing improved public access (vehicle, cycling and walking) and parking, native biodiversity and ecology and recreational opportunities for the Clifton Domain, including the proposed access road from the end of Clifton Road to Clifton Campground No. 1. The proposed consent conditions do not include the recommendations in the Recreation Assessment Report, as it is considered that these are best provided by the Hastings District Council as part of their Reserves Management Plan.
Yours sincerely,
Janeen Kydd-Smith Principal Planner
Cc: Craig Thew, Hastings District Council
ENC: Attachment 1: Zorn Figure (18/10/17) and cross-sections (3/10/17)
Attachment 2: Memorandum from Les Glock to John on Condition of Existing Revetment (31/10/17)
Attachment 3: Zorn Figure showing papa rock levels (18/10/17)
Attachment 4: Revised Beca “Clifton Beach: Engineering Assessment” report (November 2017).

9 | P a g e
ATTACHMENT 1
Zorn Figure and Cross Sections

XS 1PEG 1RL 13.89
XS 2PEG 2RL 14.75
XS 3PEG 3RL 14.88
XS 4PEG 4RL 15.15
XS 5PEG 5RL 15.28
XS 6PEG 6RL 16.09
XS KBM KRL 16.32
XS 0Bridge Spike 0RL 12.88
XS AABM AARL 19.98
Existing Building
24-09-2014 Survey 6
12-04-2014 Survey 3
01-04-2015 Survey 9
22-06-2016 Survey 13
20-11-2013 Survey 1
18-10-2017 Survey 20
EXTENT OF COASTALPROTECTION WORKS
EXTENT OF COASTALPROTECTION WORKS
N
NOTES: * Refer to Spreadsheet: "Clifton Camp Access Way Excursion Distance" for Excursion Distances to Erosive Edge* Distance from Peg to Fence Shown
7.45
m
50.00m
7.59
m
50.02m
6.46
m
7.85
m
50.00m 9.50
m
50.36m
8.52
m
51.23m
Entrance to camp ground
50.00m
Beach Crest / Erosive Edge
55.83m
53.01m

XS ID Distance Type Survey Date Local NameAA 0.000 XS 03-Oct-2017 Clifton Acess RdAA 0.000 XS 26-Jul-2017 CliftonAA 0.000 XS 23-Mar-2017 CliftonAA 0.000 XS 23-Jan-2017 Clifton
0.0
0
5.0
0
10.0
0
15.0
0
20.0
0
25.0
0
30.0
0
35.0
0
40.0
0
45.0
0
50.0
0
55.0
0
60.0
0
17.9
5
17.9
8
17.7
6
16.9
6
15.9
9
15.5
0
15.2
6
14.7
4
14.3
0
14.3
1
14.2
5
14.0
1
13.8
9
13.8
8
14.3
3
14.3
5
14.1
8
14.1
2
13.1
3
12.1
6
11.9
3
11.7
6
11.3
2
10.9
7
10.6
1
10.2
7
9.8
8
9.6
1
9.2
3
8.8
8
8.8
2
8.3
8
8.3
3
8.5
6
8.4
0
8.1
8
17.9
3
17.7
5
16.9
0
16.1
0
15.3
2
14.3
2
14.3
0
14.2
4
14.0
2
13.8
8
13.8
7
14.3
8
14.3
7
14.1
3
13.1
7
11.8
8
11.3
3
11.0
3
10.5
2
10.0
0
9.7
4
9.3
7
9.0
5
8.7
9
8.5
9
8.3
0
8.2
5
17.9
8
17.7
1
17.1
8
16.4
6
15.6
0
14.7
7
14.2
9
14.3
0
14.2
3
14.0
3
13.9
3
13.9
1
14.3
7
14.3
9
14.1
8
13.6
9
12.5
1
11.3
3
11.1
9
10.9
3
10.5
9
10.1
8
9.9
0
9.6
2
9.3
6
9.1
3
8.6
6
8.7
6
17.9
6
17.9
8
17.7
7
17.4
4
16.9
3
14.9
7
14.5
9
14.2
9
14.3
0
14.2
8
14.1
9
14.0
1
13.9
0
14.2
3
14.2
7
14.3
8
14.3
5
14.1
6
14.1
5
12.8
8
11.6
2
11.4
8
11.3
2
11.1
6
10.6
5
10.3
3
9.9
7
9.7
5
9.5
1
9.2
5
9.0
5
8.7
8
8.7
6

XS ID Distance Type Survey Date Local NameA 0.000 XS 03-Oct-2017 Clifton Acess RdA 0.000 XS 26-Jul-2017 CliftonA 0.000 XS 23-Mar-2017 CliftonA 0.000 XS 23-Jan-2017 Clifton
0.0
0
5.0
0
10.0
0
15.0
0
20.0
0
25.0
0
30.0
0
35.0
0
40.0
0
45.0
0
50.0
0
55.0
0
60.0
0
18.8
7
17.4
8
17.0
1
16.2
7
15.7
0
15.5
2
14.9
4
14.3
0
14.2
9
14.2
4
14.0
9
14.0
7
14.3
8
14.3
1
14.2
7
12.8
4
12.3
2
12.0
6
11.8
2
11.7
7
11.6
6
11.4
4
11.2
4
11.0
5
10.6
0
10.2
8
9.9
7
9.5
8
9.2
4
8.9
7
8.7
0
8.3
6
8.2
7
8.5
6
8.2
7
18.8
8
17.4
6
17.0
0
16.2
7
15.0
1
14.3
1
14.2
5
14.0
7
14.3
7
14.2
9
12.8
3
12.3
0
12.0
5
12.7
1
11.4
3
11.1
7
10.8
8
10.7
4
10.4
4
10.0
1
9.7
2
9.4
0
9.0
8
8.9
3
8.7
4
8.6
1
8.3
1
18.8
8
17.4
9
16.5
7
14.9
3
14.3
2
14.3
1
14.2
6
14.0
1
14.3
3
14.3
8
14.3
4
13.7
3
12.7
4
12.4
9
11.2
4
10.9
9
10.6
6
10.3
1
10.1
0
9.8
0
9.5
5
9.3
0
9.1
1
8.6
7
8.7
5
18.8
8
17.5
3
17.2
8
16.8
5
14.9
8
14.3
2
14.2
8
14.1
9
14.0
7
13.9
9
14.3
4
14.4
0
14.3
6
14.2
8
13.5
7
12.5
1
11.5
2
11.3
6
11.2
3
11.0
9
10.9
1
10.6
0
10.2
5
9.9
3
9.6
1
9.3
4
9.1
5
8.9
8
8.7
3
8.7
1

XS ID Distance Type Survey Date Local NameB 0.000 XS 03-Oct-2017 Clifton Acess RdB 0.000 XS 26-Jul-2017 CliftonB 0.000 XS 23-Mar-2017 CliftonB 0.000 XS 23-Jan-2017 Clifton
0.0
0
5.0
0
10.0
0
15.0
0
20.0
0
25.0
0
30.0
0
35.0
0
40.0
0
45.0
0
50.0
0
55.0
0
60.0
0
65.0
0
18.6
3
17.4
5
17.1
2
16.9
5
15.9
2
14.9
8
14.2
9
14.2
7
14.2
3
14.0
8
13.9
9
14.1
9
14.2
8
14.1
8
12.3
7
12.1
3
12.0
5
11.7
6
11.6
4
11.2
8
11.1
0
10.8
7
10.5
3
10.2
9
10.0
1
9.7
1
9.5
0
9.2
3
8.9
9
8.8
2
8.7
5
8.6
0
8.4
0
8.2
2
8.1
5
7.9
8
18.6
4
17.3
6
16.9
4
15.8
9
15.0
3
14.2
4
14.2
7
14.2
1
13.9
7
14.2
6
14.2
1
12.6
8
12.2
6
11.8
1
11.8
6
11.7
6
10.9
3
10.6
4
10.3
1
10.0
2
9.6
9
9.3
2
9.0
3
8.7
7
8.5
7
8.4
7
8.4
8
18.6
4
17.4
3
17.0
6
16.7
8
15.8
9
15.0
3
14.2
4
14.2
9
14.2
2
14.0
1
14.3
0
14.1
6
13.6
6
12.8
5
12.6
0
12.0
7
11.3
9
11.1
8
11.0
5
10.8
4
10.5
9
10.5
0
10.2
4
10.1
3
9.6
6
9.3
1
9.1
1
8.9
4
8.7
2
8.7
9
8.7
3
18.6
4
17.4
9
17.3
5
17.0
8
16.9
6
14.9
1
14.4
3
14.2
9
14.2
5
14.2
1
14.0
3
14.2
5
14.3
0
14.2
0
13.1
0
12.9
1
12.7
0
12.5
5
12.1
1
11.6
4
11.3
0
11.2
6
11.0
0
10.8
4
10.4
5
10.1
6
9.7
5
9.4
2
9.1
2
9.0
1
8.7
0
8.5
8

XS ID Distance Type Survey Date Local NameC 0.000 XS 03-Oct-2017 Clifton Acess RdC 0.000 XS 26-Jul-2017 CliftonC 0.000 XS 23-Mar-2017 CliftonC 0.000 XS 23-Jan-2017 Clifton
0.0
0
5.0
0
10.0
0
15.0
0
20.0
0
25.0
0
30.0
0
35.0
0
40.0
0
45.0
0
50.0
0
55.0
0
60.0
0
18.4
4
17.0
8
15.9
6
14.6
9
14.0
8
14.1
9
14.1
9
14.0
9
13.9
8
14.1
3
14.2
0
14.1
7
12.6
9
12.6
8
12.4
3
12.0
9
11.9
1
11.6
9
11.5
9
11.2
4
11.0
8
10.7
9
10.4
5
9.9
9
9.5
7
9.1
6
8.7
9
8.5
4
8.4
2
8.6
0
8.5
8
8.3
6
7.9
3
18.4
5
17.1
7
16.9
5
15.7
2
14.8
6
14.0
7
14.1
9
14.1
6
13.9
7
14.1
3
14.1
3
12.3
9
12.0
6
11.4
5
11.1
6
10.9
4
10.6
8
10.2
9
10.0
1
9.8
3
9.4
9
9.1
9
8.9
2
8.8
0
8.6
7
8.3
8
8.3
2
18.4
4
17.1
0
16.6
5
14.7
2
14.0
9
14.2
4
14.0
9
14.0
2
14.2
4
14.2
0
12.8
4
12.6
1
12.3
0
11.6
8
11.1
9
11.0
5
10.8
9
10.6
7
10.4
4
10.2
3
10.0
9
9.6
9
9.4
4
9.2
9
9.1
3
8.8
1
8.8
2
18.4
4
17.2
2
17.0
7
16.7
1
16.1
1
14.9
9
14.3
3
14.0
7
14.2
0
14.2
3
14.0
7
13.9
6
14.1
0
14.2
0
14.1
8
13.0
8
12.7
5
12.5
9
12.4
9
11.7
5
11.3
6
11.1
5
11.0
1
10.6
2
10.3
4
9.9
5
9.5
3
9.2
1
9.0
6
8.8
0
8.7
5
8.6
3

XS ID Distance Type Survey Date Local NameD 0.000 XS 03-Oct-2017 Clifton Acess RdD 0.000 XS 26-Jul-2017 CliftonD 0.000 XS 23-Mar-2017 CliftonD 0.000 XS 23-Jan-2017 Clifton
0.0
0
5.0
0
10.0
0
15.0
0
20.0
0
25.0
0
30.0
0
35.0
0
40.0
0
45.0
0
50.0
0
55.0
0
60.0
0
18.2
5
16.9
0
16.1
7
15.7
2
14.5
6
13.9
6
14.0
4
14.1
2
14.0
8
13.9
1
13.8
7
12.8
7
12.5
4
12.4
9
11.7
5
11.6
0
11.4
6
11.1
2
11.0
3
11.0
6
10.8
9
10.4
3
9.9
1
9.5
4
9.2
1
8.8
0
8.3
8
8.4
3
8.6
3
8.5
8
8.2
1
7.9
8
18.2
6
16.9
0
16.4
2
15.8
5
14.6
4
13.9
3
14.0
6
14.1
2
14.0
0
13.9
0
14.0
2
13.6
7
12.4
7
12.3
5
11.9
4
11.6
6
11.3
6
10.9
5
10.5
8
10.2
6
10.0
9
9.7
5
9.3
3
9.0
1
8.8
2
8.7
4
8.4
6
8.3
9
8.4
3
8.2
9
18.2
6
16.9
0
16.4
2
14.6
5
13.9
7
14.0
9
14.1
0
13.8
6
14.1
4
13.8
8
12.9
6
12.3
7
11.7
0
11.2
2
11.0
8
10.8
7
10.6
5
10.4
7
10.2
4
10.1
2
9.7
2
9.4
6
9.2
2
9.0
7
8.8
0
8.7
7
18.2
6
16.9
2
16.2
9
15.4
6
14.9
0
14.2
6
13.9
6
14.1
0
14.1
4
14.0
5
13.8
9
14.0
1
14.1
2
13.8
4
13.2
7
12.6
7
12.5
1
11.7
6
11.3
2
11.1
1
11.0
4
10.5
6
10.2
6
9.9
0
9.5
8
9.2
6
9.0
5
8.7
7
8.5
7

XS ID Distance Type Survey Date Local NameE 0.000 XS 03-Oct-2017 Clifton Acess RdE 0.000 XS 26-Jul-2017 CliftonE 0.000 XS 23-Mar-2017 CliftonE 0.000 XS 23-Jan-2017 Clifton
0.0
0
5.0
0
10.0
0
15.0
0
20.0
0
25.0
0
30.0
0
35.0
0
40.0
0
45.0
0
50.0
0
55.0
0
60.0
0
18.1
1
16.7
8
16.4
5
15.2
1
14.7
4
14.3
3
14.0
2
14.0
9
14.0
2
13.9
3
13.1
4
12.5
2
12.4
1
11.9
1
11.6
1
11.5
1
11.2
2
11.0
3
10.9
1
10.6
6
10.3
5
10.0
4
9.6
9
9.4
1
9.1
8
9.0
1
8.8
7
8.6
1
8.5
6
8.5
1
8.2
5
8.1
9
7.8
7
18.1
2
16.7
7
15.7
2
14.7
3
14.1
0
14.0
9
13.9
7
13.8
9
12.7
6
12.2
6
12.0
8
12.0
7
11.6
4
11.3
0
11.0
0
10.6
9
10.3
1
10.0
1
9.6
5
9.3
3
9.0
2
8.8
5
8.7
7
8.5
5
8.4
1
8.3
0
18.1
2
16.7
9
16.2
0
14.5
9
13.9
7
14.1
2
14.0
3
13.9
2
13.8
0
13.5
3
12.9
7
12.4
3
11.4
1
11.2
1
11.0
5
10.9
2
10.7
1
10.4
4
10.2
9
9.9
5
9.5
4
9.3
1
9.1
2
8.8
8
8.8
8
8.7
9
18.1
2
16.9
0
16.7
6
16.0
7
14.3
5
13.9
7
14.0
1
14.0
9
13.9
4
13.8
5
13.4
5
13.5
7
13.4
4
13.0
6
12.6
4
12.5
7
11.9
4
11.6
9
11.2
8
11.1
7
11.0
6
10.9
4
10.5
6
10.2
5
9.8
2
9.5
0
9.2
1
9.0
6
8.7
5
8.5
4
XS ID Distance Type Survey Date Local NameF 0.000 XS 03-Oct-2017 Clifton Acess RdF 0.000 XS 26-Jul-2017 CliftonF 0.000 XS 23-Mar-2017 CliftonF 0.000 XS 23-Jan-2017 Clifton
0.0
0
5.0
0
10.0
0
15.0
0
20.0
0
25.0
0
30.0
0
35.0
0
40.0
0
45.0
0
50.0
0
55.0
0
60.0
0
18.0
5
16.7
9
15.9
8
14.4
4
13.9
7
13.9
4
14.0
4
14.0
1
14.0
0
12.3
6
12.4
5
11.9
3
11.6
1
11.3
9
11.0
5
10.8
1
10.4
9
10.2
7
10.0
6
9.7
0
9.5
1
9.1
9
8.8
7
8.7
0
8.5
5
8.1
3
7.8
9
18.0
5
16.8
1
15.9
7
15.0
3
14.4
1
13.9
3
14.0
5
14.0
2
14.0
0
12.1
8
12.0
5
11.8
4
11.4
8
11.0
9
10.6
8
10.3
6
10.0
7
9.7
9
9.4
7
9.2
6
9.0
1
8.8
5
8.7
0
8.3
4
8.1
2
18.0
6
16.7
7
16.2
6
14.7
9
13.9
2
14.0
0
14.0
6
14.0
3
13.9
2
13.4
0
13.0
3
12.5
2
11.5
5
11.2
0
11.0
8
10.9
9
10.8
2
10.5
5
10.2
5
10.0
2
9.9
7
9.6
4
9.3
9
9.0
6
8.7
9
8.6
9
18.0
6
16.8
6
16.7
7
16.0
3
15.7
6
14.6
6
14.0
2
14.0
4
14.0
2
13.9
1
13.1
6
13.0
1
12.4
6
11.8
6
11.4
1
11.2
4
11.0
9
10.6
3
10.4
3
10.1
1
9.6
9
9.3
7
9.0
3
8.7
4
8.5
3

XS ID Distance Type Survey Date Local NameG 0.000 XS 03-Oct-2017 Clifton Acess RdG 0.000 XS 26-Jul-2017 CliftonG 0.000 XS 23-Mar-2017 CliftonG 0.000 XS 23-Jan-2017 Clifton
0.0
0
5.0
0
10.0
0
15.0
0
20.0
0
25.0
0
30.0
0
35.0
0
40.0
0
45.0
0
50.0
0
55.0
0
17.8
3
16.4
0
15.6
0
14.6
1
13.8
4
13.9
1
13.9
7
13.9
7
12.5
3
12.4
8
12.6
5
12.2
5
11.8
6
11.3
5
11.2
3
10.9
8
10.5
6
10.2
5
9.9
5
9.5
9
9.2
0
8.9
0
8.8
1
8.3
9
8.5
2
8.4
5
8.1
5
7.9
6
17.8
3
16.4
2
15.8
3
14.8
0
14.0
5
13.8
3
13.9
2
13.9
9
14.0
1
12.1
4
11.8
8
11.7
4
11.4
0
11.1
2
10.8
8
10.6
3
10.4
1
10.1
3
9.9
1
9.5
8
9.1
7
9.0
4
8.8
4
8.7
5
8.5
1
8.4
5
8.3
8
17.8
4
16.3
1
15.8
1
14.5
7
13.8
7
13.9
9
13.9
6
13.9
8
14.0
0
13.9
2
13.0
5
12.1
9
11.6
0
11.2
5
10.9
7
10.6
5
10.2
6
10.0
4
9.9
6
9.9
2
9.5
5
9.3
1
9.1
2
8.8
4
8.7
8
17.8
4
16.3
7
16.0
4
15.5
6
14.5
6
13.8
6
13.9
6
13.9
7
13.9
2
13.8
5
13.3
3
12.5
5
12.4
0
11.6
7
11.3
6
11.2
1
10.6
8
10.3
6
10.0
2
9.5
7
9.3
0
9.0
6
8.7
7
8.7
2
8.4
7

XS ID Distance Type Survey Date Local NameH 0.000 XS 03-Oct-2017 Clifton Acess RdH 0.000 XS 26-Jul-2017 CliftonH 0.000 XS 23-Mar-2017 CliftonH 0.000 XS 23-Jan-2017 Clifton
0.0
0
5.0
0
10.0
0
15.0
0
20.0
0
25.0
0
30.0
0
35.0
0
40.0
0
45.0
0
50.0
0
55.0
0
17.9
8
16.4
1
15.8
0
14.6
6
14.1
1
13.7
8
13.8
5
13.9
7
14.0
3
12.4
2
12.5
5
12.2
9
12.1
1
11.7
0
11.3
8
10.9
3
10.4
9
10.2
3
9.8
9
9.5
2
9.1
8
8.9
2
8.8
1
8.3
4
8.0
5
7.8
8
17.9
8
16.3
8
15.8
3
14.8
8
14.2
0
13.8
1
13.8
4
13.9
4
14.0
3
12.4
4
12.2
2
11.8
8
11.7
6
11.5
7
11.3
2
11.0
6
10.6
3
10.2
6
10.0
4
9.8
1
9.5
6
9.2
6
9.1
0
8.8
9
8.7
7
8.6
9
8.3
9
8.3
6
8.0
4
8.0
0
17.9
8
16.3
8
15.8
8
14.4
4
13.8
0
13.8
7
13.9
3
13.9
1
13.7
7
13.0
8
12.3
8
11.5
3
11.1
6
10.8
5
10.4
8
10.1
3
9.9
9
9.8
9
9.5
9
9.3
2
9.1
1
8.7
8
8.6
4
17.9
8
16.5
5
16.4
3
15.6
4
14.5
6
13.9
2
13.7
6
13.8
6
13.9
1
13.9
0
13.7
6
13.7
2
13.1
6
12.5
4
12.4
7
11.8
3
11.4
6
11.2
3
10.6
4
10.3
2
10.0
4
9.6
3
9.2
8
9.0
7
8.7
2
8.4
1

XS ID Distance Type Survey Date Local NameI 0.000 XS 03-Oct-2017 Clifton Acess RdI 0.000 XS 26-Jul-2017 CliftonI 0.000 XS 23-Mar-2017 CliftonI 0.000 XS 23-Jan-2017 Clifton
0.0
0
5.0
0
10.0
0
15.0
0
20.0
0
25.0
0
30.0
0
35.0
0
40.0
0
45.0
0
50.0
0
55.0
0
17.7
5
16.3
3
15.7
1
14.6
7
13.9
1
13.7
9
13.8
5
13.8
9
13.9
7
12.4
3
12.3
1
12.0
6
11.7
9
11.5
6
11.5
2
11.4
1
11.0
7
10.6
6
10.3
4
10.1
3
9.8
3
9.4
6
9.0
3
8.7
8
8.4
2
8.3
6
8.3
8
8.3
4
8.1
2
17.7
6
16.3
4
15.8
7
14.6
4
13.9
4
13.8
0
13.8
6
13.9
8
12.4
5
12.3
3
11.7
9
11.5
6
11.1
6
10.8
8
10.4
6
10.0
2
9.8
7
9.5
9
9.4
5
9.1
4
8.9
8
8.8
5
8.7
8
8.5
0
8.2
7
8.2
3
17.7
6
16.3
5
15.8
6
14.4
4
13.8
1
13.8
4
13.8
7
13.9
8
13.2
7
12.1
2
11.7
8
11.3
0
11.1
0
10.8
6
10.5
4
10.2
0
9.9
9
9.9
2
9.8
1
9.7
5
9.5
1
9.3
0
9.1
0
8.9
0
8.7
3
8.6
8
17.7
6
16.4
5
16.3
4
15.8
6
14.6
3
13.7
7
13.8
2
13.8
5
13.9
5
13.4
0
11.8
8
11.5
9
11.2
5
11.1
0
11.0
0
10.8
3
10.4
5
10.1
6
9.8
7
9.5
4
9.2
3
9.0
7
8.7
0
8.4
9

XS ID Distance Type Survey Date Local NameJ 0.000 XS 03-Oct-2017 Clifton Acess RdJ 0.000 XS 26-Jul-2017 CliftonJ 0.000 XS 23-Mar-2017 CliftonJ 0.000 XS 23-Jan-2017 Clifton
0.0
0
5.0
0
10.0
0
15.0
0
20.0
0
25.0
0
30.0
0
35.0
0
40.0
0
45.0
0
50.0
0
55.0
0
60.0
0
17.5
9
16.3
3
15.6
3
14.5
6
13.7
4
13.7
1
13.7
8
13.9
1
14.1
3
12.3
3
12.1
8
11.7
5
11.5
1
11.4
6
11.1
7
10.9
3
10.5
5
10.2
2
9.9
6
9.6
5
9.3
2
8.9
1
8.7
5
8.4
2
8.3
7
8.5
8
8.3
2
7.9
3
17.6
0
16.3
3
15.6
9
14.6
4
13.9
0
13.7
0
13.7
6
13.8
8
13.9
5
12.1
9
12.0
1
12.0
1
11.7
5
11.3
5
11.0
1
10.6
0
10.1
9
10.0
0
9.6
3
9.2
9
9.0
4
8.7
9
8.6
1
8.4
0
8.2
7
8.2
8
17.5
7
16.3
6
15.9
0
14.4
5
13.6
6
13.7
6
13.8
3
13.7
6
12.8
9
12.8
8
12.0
5
11.5
1
11.1
6
10.8
8
10.5
0
10.0
7
9.9
8
9.7
8
9.6
5
9.3
8
9.1
7
8.9
9
8.6
7
8.6
2
17.5
7
16.3
5
16.3
2
15.6
9
14.4
8
13.6
7
13.7
5
13.7
6
13.7
3
12.8
5
12.7
0
11.7
2
11.3
7
11.1
0
10.9
7
10.5
4
10.2
0
9.9
1
9.5
4
9.2
8
9.0
9
8.6
1
8.3
8

XS ID Distance Type Survey Date Local NameK 0.000 XS 03-Oct-2017 Clifton Acess RdK 0.000 XS 26-Jul-2017 CliftonK 0.000 XS 23-Mar-2017 CliftonK 0.000 XS 23-Jan-2017 Clifton
0.0
0
5.0
0
10.0
0
15.0
0
20.0
0
25.0
0
30.0
0
35.0
0
40.0
0
45.0
0
50.0
0
55.0
0
16.3
2
16.3
0
16.2
2
15.6
5
14.5
3
13.9
0
13.8
3
13.8
8
13.6
7
13.1
1
12.2
1
11.9
7
11.7
7
11.4
7
11.2
6
10.8
5
10.5
3
10.1
5
9.7
7
9.4
3
9.1
7
8.8
8
8.7
6
8.3
8
8.5
0
8.5
3
8.2
7
7.8
5
16.3
3
16.3
1
16.2
5
15.5
7
14.7
2
13.9
0
13.8
6
13.8
3
13.6
4
12.3
1
12.0
8
11.6
9
11.3
5
10.9
6
10.7
0
10.3
0
9.9
8
9.7
8
9.4
4
9.0
9
8.9
1
8.7
8
8.4
9
8.2
1
8.1
7
16.3
5
16.3
2
16.2
4
15.8
1
14.7
3
13.9
3
13.9
1
14.0
2
14.1
8
13.8
3
13.2
8
12.1
5
11.5
0
11.2
1
11.0
8
10.7
9
10.3
2
9.9
7
9.8
7
9.7
4
9.5
2
9.2
9
9.1
0
8.7
3
8.7
0
16.3
3
16.3
1
16.2
6
15.6
0
14.6
5
13.8
7
13.8
2
13.8
7
13.9
2
13.1
7
12.8
3
11.9
6
11.6
2
11.2
8
11.0
3
10.5
7
10.2
3
9.8
1
9.4
4
9.1
7
9.0
0
8.6
9
8.4
5

XS ID Distance Type Survey Date Local NameHB1 0.000 XS 03-Oct-2017 Clifton Acess RdHB1 0.000 XS 26-Jul-2017 CLIFTON MOTOR CAMPHB1 0.000 XS 23-Mar-2017 CLIFTON MOTOR CAMPHB1 0.000 XS 23-Jan-2017 CLIFTON MOTOR CAMP
1.0
0
6.0
0
11.0
0
16.0
0
21.0
0
26.0
0
31.0
0
36.0
0
41.0
0
46.0
0
51.0
0
56.0
0
61.0
0
66.0
0
71.0
0
76.0
0
81.0
0
86.0
0
12.8
8
12.6
1
12.6
0
12.5
3
12.5
4
12.5
0
12.4
7
12.4
1
12.3
7
12.3
1
12.3
9
12.4
1
12.5
0
12.4
9
13.6
8
12.4
8
12.3
6
12.1
2
11.9
2
11.8
8
11.6
1
11.2
6
11.0
0
10.7
4
10.5
5
10.1
8
9.9
6
9.5
7
9.3
4
9.0
2
8.8
5
8.4
6
8.5
3
8.3
8
8.1
2
7.9
7
12.8
8
12.6
1
12.6
0
12.5
3
12.5
4
12.5
0
12.4
7
12.4
1
12.3
7
12.3
1
12.3
9
12.4
1
12.5
0
12.5
0
13.6
9
12.6
1
12.4
0
12.3
1
11.9
8
11.7
4
11.5
4
11.1
4
10.9
4
10.6
9
10.4
1
10.0
6
9.7
0
9.3
1
8.9
8
8.7
8
8.6
7
8.5
8
8.1
9
8.0
5
8.1
8
8.1
9
8.1
2
12.8
2
12.6
1
12.6
0
12.5
3
12.5
4
12.5
0
12.4
7
12.4
1
12.3
7
12.3
1
12.3
9
12.4
0
12.5
0
12.4
7
13.6
6
13.1
4
12.8
3
11.9
9
11.6
8
11.3
0
11.1
6
10.9
8
10.5
9
10.2
9
10.1
7
9.7
8
9.5
4
9.2
3
9.0
1
8.6
9
8.6
1
12.8
5
12.6
2
12.5
5
12.5
7
12.5
0
12.5
2
12.4
7
12.3
3
12.4
2
12.4
0
12.4
7
12.4
7
13.6
7
13.1
8
12.8
4
12.2
5
11.9
6
11.6
4
11.3
4
10.6
6
10.1
3
9.7
5
9.3
4
9.1
1
9.0
1
8.4
9
8.4
6
8.3
7

10 | P a g e
ATTACHMENT 2
Memorandum from Les Glock to John on Condition of Existing Revetment


11 | P a g e
ATTACHMENT 3
Zorn Figure showing papa rock levels
N
11.7211.76
9.5511.28
11.2111.10
11.04
10.15
10.11
9.41
8.328.31
11.0611.02
11.07
10.49
10.11
9.42
11.0611.0610.8911.14
10.9711.18
10.8411.11
10.41
9.76
11.10
11.02
8.22
10.0810.40
11.1310.96
10.88
8.11
11.09
8.358.388.32
8.19
XS 1PEG 1RL 13.89
XS 2PEG 2RL 14.75
XS 3PEG 3RL 14.88
XS 4PEG 4RL 15.15
XS 5PEG 5RL 15.28
XS 6PEG 6RL 16.09
XS KBM KRL 16.32
XS 0Bridge Spike 0RL 12.88
XS AABM AARL 19.98
NOTES: * Refer to Spreadsheet: "Clifton Camp Access Way Excursion Distance" for Excursion Distances to Erosive Edge* Distance from Peg to Fence Shown* Levels on PAPA taken where exposed* Additional Levels taken on XS line when found by digging
7.45
m
50.00m
7.59
m
50.02m
6.46
m
7.85
m
50.00m 9.50
m
50.36m
8.52
m
51.23m
Entrance to camp ground
50.00m
Beach Crest / Erosive Edge
55.83m
53.01m
PAPA RockLevels

12 | P a g e
ATTACHMENT 4
Revised Beca Engineering Assessment Report (November 2017)

Report
Clifton Beach: Engineering Assessment
Prepared for Hastings District Council
Prepared by Beca Limited
November 2017
Fisherman on Clifton Beach, Looking North, 2007. Credit Google Earth

Clifton Beach: Engineering Assessment
Beca 3 November 2017
3233367 // NZ1-14168403-31 0.31 // i
Revision History
Revision Nº Prepared By Description Date
1 Evan Walters Draft 30 June 2017
2 Evan Walters For Resource Consent 11 July 2017
3 Stephen Priestley Revised dwgs for Section 92 response 3 November 2017
Document Acceptance
Action Name Signed Date
Prepared by Evan Walters
November 2017
Reviewed by Stephen Priestley
November 2017
Approved by Stephen Priestley
November 2017
on behalf of Beca Limited
Beca 2017 (unless Beca has expressly agreed otherwise with the Client in writing).
This report has been prepared by Beca on the specific instructions of our Client. It is solely for our Client’s use for the purpose for which it is intended in accordance with the agreed scope of work. Any use or reliance by any person contrary to the above, to which Beca has not given its prior written consent, is at that person's own risk.

Clifton Beach: Engineering Assessment
Beca // 3 November 2017
3233367 // NZ1-14168403-31 0.31 // i
Executive Summary
Clifton beach, located in the southern end of New Zealand’s Hawke Bay, has been subject to long term
shoreline retreat. The shoreline retreat has encroached upon an access roadway which leads to a
campground at the road’s easternmost end. As this campsite and access road is valued by the local
community, efforts to protect it have been undertaken.
Although a short section of revetment was constructed in 2013 to protect the campsite access, it does not
protect the entire stretch of roadway. This has let the shoreline to continue eroding and threatening the
access roadway.
This report evaluates the coastal processes at Clifton and reviews various options to protect the roadway.
Hastings District Council preferred option is to extend the existing revetment by 400m to protect the coastal
roadway.
This report also presents the preliminary engineering design of the revetment. The engineering design takes
into consideration many environmental factors including a design water level, wave conditions, climate
change, and wave overtopping. The revetment will comprise 2 layers of 1.0m diameter limestone rock at a
slope of 1(vertical):2 (horizontal).
The report assesses the potential environmental effects of the revetment on the coastal processes. This is
based on modelling the wave environment and longshore sediment movement (see Appendix D). No updrift
adverse effects are likely. Although the revetment will impound approximately 600m3/year of gravel, any
down drift effects on the western end will be similar to the historical shoreline in the medium to long term. In
the short term (less than 10 years), however, the adverse effects are considered to be moderate, having
slightly more erosion than with the historical shoreline. In the medium to long term the adverse effects are
considered to be minor.
Local erosional cutting in of the downdrift coastline is likely be experienced and will potentially need to be
managed.

Clifton Beach: Engineering Assessment
Beca // 3 November 2017
3233367 // NZ1-14168403-31 0.31 // i
Contents
1 Introduction ........................................................................................................ 1
1.1 Background ...................................................................................................................................... 1
1.2 Issues ............................................................................................................................................... 2
1.3 Purpose of the Report ...................................................................................................................... 2
2 Existing Environment ........................................................................................ 2
2.1 Topography and Bathymetry ........................................................................................................... 2
2.2 Geology ............................................................................................................................................ 4
2.3 Tides and Water Levels ................................................................................................................... 4
2.4 Wave Climate .................................................................................................................................. 4
2.5 Currents ........................................................................................................................................... 6
2.6 Sediment Transport ......................................................................................................................... 6
2.7 Natural hazards ............................................................................................................................... 9
2.8 Existing Infrastructure ...................................................................................................................... 9
3 Evaluation of Options ...................................................................................... 10
3.1 Purpose of Coastal Protection Works ............................................................................................ 10
3.2 Option Descriptions ....................................................................................................................... 10
3.3 Preferred Option ............................................................................................................................ 15
4 Revetment Design ........................................................................................... 16
4.1 Description ..................................................................................................................................... 16
4.2 Design Considerations ................................................................................................................... 16
4.3 Revetment Geometry ..................................................................................................................... 17
4.4 Revetment Construction ................................................................................................................ 18
4.5 Revetment Maintenance ................................................................................................................ 18
5 Environmental Effects of Revetment ............................................................. 19
6 Conclusions ..................................................................................................... 19

Clifton Beach: Engineering Assessment
Beca // 3 November 2017
3233367 // NZ1-14168403-31 0.31 // 1
1 Introduction
1.1 Background
Clifton Beach, located in the southern end of New Zealand’s Hawke’s Bay, has been subject to long term
shoreline retreat. This shoreline retreat has encroached upon an access roadway which leads to a
campground at the road’s easternmost end. Although a small portion of this roadway was protected in 2013
by a rock revetment, the road is still in jeopardy. Its resource consent expires August 31st 2018
Clifton is the southernmost township along Hawke Bay in New Zealand. Clifton road ends at a campground
location at its easternmost point. To access the campground, an access road runs along the beach for a half
kilometer. The exact project location can be found in Figure 1.3.
The Hastings District Council (HDC) is applying to the Hawkes Bay Regional Council (HBRC) for a longer
section of permanent protection works. The existing resource consent expires August 31st 2018. These
works, covering a reach length of 400m, will provide protection to the road. This report reviews the options
and describes preliminary design of the proposed coastal protection works in order to accompany the
resource consent application.
Figure 1.1: Clifton, New Zealand, Figure 1.2: Closer up view of Clifton, demarked by the red maker red outline demarking the township limits

Clifton Beach: Engineering Assessment
Beca // 3 November 2017
3233367 // NZ1-14168403-31 0.31 // 2
Figure 1.3: Exact Project Location demarked by red markings
1.2 Issues
The shoreline at Clifton is retreating such that the road is at risk. With little room left, options have been
considered to protect the road which minimize adverse effects on the environment. Although studies have
been done in the past for the Te Awanga and Haumoana area (Komar 2014, Environmental Management
Services 2009), a study for Clifton beach has not been carried out in the past. This report represents a
specific assessment for Clifton beach.
1.3 Purpose of the Report
The Hastings District Council (HDC) is preparing a resource consent application detailing a longer section of
permanent protection works. This report considers and describes various options. From all the options
considered, HDC chose a longer revetment as the preferred option. This report specifically addresses the
coastal processes and engineering design issues and the potential adverse environmental effects on the
surrounding area. It also presents a preliminary design for a 400m revetment extension.
2 Existing Environment
2.1 Topography and Bathymetry
The land levels and water depths at Clifton beach and the surrounding area has strong relief. Due to New
Zealand’s location near the interface of two tectonic plates, vertical cliff faces and large sediment deposits
can be found throughout the region. Cape Kidnappers, a headland extending 8 kilometres eastwards, is part
of this cliff system. West of Cape Kidnappers, where the cliff faces and hills stop, is a small flat area where
Clifton was founded. Although this area is relatively flat, many reef systems extend offshore. These reef
systems can influence the local wave climate by diffracting waves around the reefs and other underwater
obstacles.

Clifton Beach: Engineering Assessment
Beca // 3 November 2017
3233367 // NZ1-14168403-31 0.31 // 3
To better understand the area, bathymetric surveys were taken. This data was obtained from the Hawke’s
Bay Regional Council. Figure 2.1 below includes the results of the bathymetric survey which extended 1km
offshore. Using SWAN (Simulating WAves Nearshore) the offshore wave climate was transformed into the
beach nearshore using the bathymetric data. This bathymetric grid is illustrated in figure 2.2.
Figure 2.1: Sidescan sonar survey offshore of Clifton Beach, elevations in meters
Figure 2.2: SWAN Model Bathymetry, showing reef systems

Clifton Beach: Engineering Assessment
Beca // 3 November 2017
3233367 // NZ1-14168403-31 0.31 // 4
In addition to the bathymetric survey, beach profile surveys dating back to 1972 have been recorded, as
discussed in section 2.6. These beach profile surveys show that the beach system has few bars with a beach
face of 8% slope in places. This slope varies along the coastline depending on reefs and proximity to the cliff
faces eastward of the project location.
2.2 Geology
The beach at Clifton is a gravel beach mainly derived from greywacke rock. Gradation curves of the
sediment can be found appended to this report. Due to the steep beach slope, the beach is reflective and
very little cross shore gravel movement is experienced. During fair weather sand accumulates on the beach,
which later disappears during inclement weather. Similarly the beach flattens during fair weather and
steepens during inclement weather.
In 1931 an earthquake caused the landform along the coast to lower by about 1.0m, however at the Clifton
beach site itself the exact lowering amount is unknown. This lowering caused the coastal system to be out of
equilibrium, probably contributing to the problems experienced today.
Below mean sea level (MSL), bedrock “Papa” rock is commonly found. This rock, forming the cliff formation,
was deposited on the sea floor about 15 million years ago. At the cliff faces, this rock can erode and is highly
susceptible to erosion and landslides during heavy rainfall (Komar, Harris, 2014).
2.3 Tides and Water Levels
Tidal levels in Hawke Bay are given in Table 1 (LINZ, 2015). Storm surges during low pressure events could raise the tide levels by some 0.2m. In extreme events, storm surges may increase tide levels by 0.8m. The local datum at RL 10.0m is at about mean sea level (MSL). Levels referred to in this report are in terms of the local datum.
Table 2.1: Tide Levels
Tide State Chart Datum (m) Local Datum (m)
HAT 2.0 11.1
MHWS 1.8 10.9
MHWN 1.5 10.6
MSL 0.9 10.0
MLWN 0.4 9.5
MLWS 0.1 9.2
LAT-Chart Datum 0.0 9.1
2.4 Wave Climate
The site is an open coast site which is exposed to swells which propagate across the Pacific Ocean as well
as wind generated waves. Hindcast wave data (MetOcean Solutions, Ltd.) was used to produce the wave
climate as illustrated in the wave roses below. The hindcast wave data covers a range of 37 years and
encompasses significant events such as cyclones and major storms in addition to routine events. This
hindcast wave data was calculated at the coordinate 177.005E, 39.630S which is 1km offshore at a depth of
4-5m relative to MSL. From the wave roses, it is evident that the majority of the waves propagate from a very
tight range between 50 and 65 degrees clockwise from North.

Clifton Beach: Engineering Assessment
Beca // 3 November 2017
3233367 // NZ1-14168403-31 0.31 // 5
For extreme wave conditions, MetOcean Solutions (2011) reported the 10 year return period significant wave
in 10m of water depth as 4.6m and the 100 year return period significant wave as 5.4m. The mean wave
period is about 10s. Although transformed from oceanic conditions, these waves represent high energy wave
conditions.
Figure 2.3: Wave Rose of Hindcast Wave Data at 177.005E, 39.630S, 5 degree bins, height in meters
Figure 2.4: Wave Rose of Hindcast Wave Data at 177.005E, 39.630S, 5 degree bins, period in seconds
Hs (m)
Tp (s)

Clifton Beach: Engineering Assessment
Beca // 3 November 2017
3233367 // NZ1-14168403-31 0.31 // 6
2.5 Currents
According to previous studies (Ridgeway, 1962) where drift-cards were used to determine currents along
Clifton, Clifton beach has a small magnitude longshore current of 0.2 knots to the west.
Figure 2.5: Nearshore Currents in Hawke Bay
2.6 Sediment Transport
In 2005, Professor Paul Komar published a report which detailed the sediment transport rates for the various
littoral cells of Hawke Bay. Clifton is located in the Haumoana littoral cell which extends from Cape
Kidnappers to the Port of Napier. Despite the 18,000m3/year sediment source from Cape Kidnappers
erosion, Komar determined that Haumoana littoral cell has a net sediment loss of 45,000m3/year. The
westerly sediment transport is primarily due to a westerly drift from incoming swells and waves from the
North-Easterly direction.

Clifton Beach: Engineering Assessment
Beca // 3 November 2017
3233367 // NZ1-14168403-31 0.31 // 7
Although anecdotal knowledge is that during calm weather sand is deposited on the beach, whereas during
storms it is transported offshore, there is very little information on the cross shore sediment transport rates at
Clifton Beach.
Beach profile data at HB1 has been periodically taken at Clifton beach since 1972. The location of this
profile, labelled below as BM1 Clifton, can be seen in Figure 2.6. Figures 2.7 and 2.8 show the results of the
beach profile monitoring. Most notably from these results, the beach profile has retreated 32m since 1972
(i.e. 0.69m/year).
Figure 2.6: HB1 (labeled BM1 Clifton) Cross section profile location, Clifton, New Zealand.
Image obtained from the Hawke’s Bay Regional Council

Clifton Beach: Engineering Assessment
Beca // 3 November 2017
3233367 // NZ1-14168403-31 0.31 // 8
Figure 2.7: HB1 Profile Surveys, 1972-1999
Figure 2.8: HB1 Profile Surveys, 1999-2002, and 1972

Clifton Beach: Engineering Assessment
Beca // 3 November 2017
3233367 // NZ1-14168403-31 0.31 // 9
Figure 2.9: HB1 Profile Statistics
2.7 Natural hazards
Clifton Beach is subject to natural hazards including sea storms, tsunamis, earthquakes, cliff/ landslides, and
flooding. Each of these natural hazards can change the physical environment. Sea storms can produce an
increased water level as high as 0.8m and displace sediment in the cross shore direction. During these
events waves overtop the coastal structures, disrupting access and vehicular traffic.
2.8 Existing Infrastructure
Over time the small settlement at Clifton has developed a carpark, beach access ramp at camp No. 1,
access road, and campsite along the coast. The condition of each of these entities varies, but has overall
fared well. A vertical wall protection structure exists to the east of the beach access ramp which produces a
high level of wave reflection, with only minor dissipation from tyres in front of the wall. This wave reflection
aids clearing of sediment from the boat ramp.
The beach between Camp No.1 and Camp No. 2 is in an erosional state. This erosion has resulted in the
relocation of the access road three times between 2009 and 2013. To protect the road and access to the
campsite, an 80m long revetment was installed in 2013. This revetment has stopped the retreating shoreline,
but is insufficient for a long term result as continued erosion is experienced along the western end of the
access road.
Camp No 1 has some existing protection from adverse sea condition due to the vertical wall at the boat
ramp, the beach, and the 80m revetment.

Clifton Beach: Engineering Assessment
Beca // 3 November 2017
3233367 // NZ1-14168403-31 0.31 // 10
3 Evaluation of Options
3.1 Purpose of Coastal Protection Works
Since shoreline retreat continues to jeopardize the existing infrastructure at Clifton Beach, implementation of
coastal protection or management options was considered necessary in order to maintain the integrity of
existing assets. Although coastal protection works will protect assets, in some cases it is more beneficial to
re-establish assets elsewhere. The following options were assessed as potential solutions to maintain
access to Clifton Beach.
3.2 Option Descriptions
3.2.1 Do nothing
In some cases, a recommendation of doing nothing can be reached on the basis of predicted future
characteristics of the coastal ecosystem. Given this area’s record of shoreline retreat dating back over more
than 40 years, the characteristics of the area are not predicted to change in the near future, and the area will
continue to erode over time. This also can be reinforced by the photos below, as well as the beach profile
survey graphs in section 2.6.
Figure 3.1: Photo, circa 1912

Clifton Beach: Engineering Assessment
Beca // 3 November 2017
3233367 // NZ1-14168403-31 0.31 // 11
Figure 3.2: Clifton beach aerial photo, 2009
The do nothing option would entail continued erosion of the beach to the road, and compliance with the
existing consent for the revetment. This consent would result in the existing revetment being removed by
August 31st 2018. According to the Coastal Processes report (2017), removal of the existing revetment would
cause erosion at the campsite’s entrance, which would later result in that beach access ramp and
campground buildings being redundant.
3.2.2 Minimum Response with Extending Consent
The Joint Coastal Strategy, initiated in 2014, is a cross-council approach to identifying and responding to
coastal hazards along the Hawke Bay coast. It is being developed in four key stages:
1. Define the Problem 2. Framework for Decisions 3. Develop Responses 4. Respond
Although stages one and two are complete, stage three is underway. Stage three involves development of coastal hazard plans for specific coastal areas to respond to the identified risks. Stage three is expected to be complete by the end of 2017. Afterwards, stage four is anticipated to be ongoing for several years.
It is possible to apply for an extension of the existing revetment’s resource consent duration beyond August
31st, 2018, until an agreed way forward in line with the Joint Coastal Strategy has been determined. Doing so
would require maintenance of the existing revetment and likely allow the erosion to further encroach on
private land where the road is unprotected.
3.2.3 Inland Road Relocation
Although extending the resource consent of the existing revetment will protect the campsite entrance, the
access roadway will soon be lost unless something is done to keep the access route open. One solution is to
relocate the road further inland, as has been done before.

Clifton Beach: Engineering Assessment
Beca // 3 November 2017
3233367 // NZ1-14168403-31 0.31 // 12
In 2003, Tonkin and Taylor released a report which included set back lines for various places along the
Hawke Bay coast. These set back lines act as recommended lines where assets should be relocated behind
to preserve their integrity. Specifically at Clifton beach, a setback of 60m was advised for the year 2060, and
a setback of 100m by 2100. See Appendix C.
However, due to the location it is difficult to reposition the road inland on its eastern side. Although it is
possible to tunnel through the cliffs to the campsite, this is a very risky and expensive option which will not be
cost effective.
Since the beach and roadway are already very close to the private property lines, any further landward
movement will breach these property lines. Figure 3.3 illustrates property lines overlain on an aerial image.
Necessary coordination and approval from the landowners will be required if this solution is chosen.
However, since the landowners have indicated to Council an unwillingness to provide further land for this
purpose in the future, beyond the small encroachment already agreed, this option would be difficult to
deploy.
Figure 3.3: Aerial Image of property lines along Clifton Road, Existing road in white, Cliff line in Green
3.2.4 Campground Relocation
Relocation of the camp No1 to an area near camp No 2 is a viable option. To have the same level of
amenity, however, the boat ramp would need to be relocated. Relocating the ramp would introduce
additional risk in Council owning and operating a boat ramp in an exposed location.
3.2.5 Managed Retreat
The 2009 report by Environmental Management Services Ltd studied the Te Awanga – Haumoana and
Clifton area of coastline. The report details a cost analysis of staged retreat options as well as construction of
a groyne field. Due to uncertainties in the performance of the groyne field along with its high costs, the report
recommends staged retreat as the better option for the area.
It is important to note that the 2009 report studied a larger area than the campsite access road. With specific
consideration of the road, if it were relocated inland there would be property issues and the difficulties of road
relocation discussed in section 3.2.3.

Clifton Beach: Engineering Assessment
Beca // 3 November 2017
3233367 // NZ1-14168403-31 0.31 // 13
3.2.6 Nourishment and Planting
This option, sometimes referred to “soft” or “passive” protection, would entail maintaining the existing beach
front by importing sediment compatible with the existing beach sediment, and placing it on the beachfront.
This sediment would increase the amount of beach width. As time goes on, the newly placed sediment would
enter the littoral system and be lost. Options like this typically have high maintenance costs, but maintain the
existing aesthetics of the area.
Dune planting is a very good option in many cases due to its aesthetics and use of natural resources to solve
coastal problems. Planting can go hand-in-hand with nourishment. It uses the roots of the plants to hold
sediment in place, potentially resisting natural erosion. This solution can extend the lifetime of a nourishment
project. Solutions like these require dunes to be constructed if there are no existing dunes. Furthermore,
dune planting requires room for the plants as well as time for the plants to establish themselves. Considering
that there is little space between the road and the water line at Clifton, there is insufficient space for this
option without acquiring private land.
Both nourishment and planting would be at risk of not providing protection during extreme sea storm
conditions.
3.2.7 Groynes and Nourishment
In the 2009 Environmental Management Services report, groynes were assessed as an option for the Clifton
to Te Awanga- Haumoana reach of coastline. Although the cost of the option over the project lifespan was
$18.5 million (2009 NPV), the analysis was for many more groynes than would be necessary to protect the
roadway. An individual groyne would cost about $1.8 million (2009 NPV) to construct, and have annual
maintenance costs of about $8,500 (2009 NPV) according to the report. It is predicted that 3-4 groynes
would effectively protect the access roadway. It is uncertain how these groynes would affect the downdrift
area.
Groyne fields, although a viable solution, do have potentially adverse aesthetic value and would reduce the
amenity value of the beach. The local community and tourist companies may well oppose the construction of
a groyne field due to the potential loss of access.
Groynes cause accumulation on the updrift side of the groyne, but encourage downdrift erosion. To minimize
the downdrift erosive effects, they are used in series. Another way to remedy the downdrift effect is to
nourish the beach between the groynes. With very little room left between the water line and the existing
roadway, nourishment between the groynes would be required. This nourishment would increase the project
costs.

Clifton Beach: Engineering Assessment
Beca // 3 November 2017
3233367 // NZ1-14168403-31 0.31 // 14
Figure 3.4: Groyne Field example, Australia
3.2.8 Offshore Breakwaters
Offshore breakwaters function by dissipating the wave energy impacting a shoreline and reducing the
longshore transport behind them. With slower transport rates, the beach sediment is able to accumulate
behind the breakwaters and widen the beach. In some cases, the beach behind the breakwater can accrete
so much that it touches the breakwater forming a tombolo. A tombolo significantly reduces the longshore
sediment transport behind the breakwater thereby depleting downdrift sediment supply.

Clifton Beach: Engineering Assessment
Beca // 3 November 2017
3233367 // NZ1-14168403-31 0.31 // 15
Figure 3.5: Offshore breakwaters example
Since breakwaters are in deeper water, they are substantial structures and costly to construct.
3.2.9 Sheet Pile Wall
Due to the space limitations at the site, a sheet pile wall could effectively protect the roadway. However, a
vertical sheet pile wall will reflect waves, providing little energy dissipation. These reflected waves have the
potential to cause adverse effects elsewhere.
3.2.10 Revetment
Revetments have been implemented in the past at Clifton to protect the roadway. The existing revetment
installed in 2013 covers a length of 80m and protects the campsite entrance and toilet block structure. This
revetment, made from local limestone, has successfully held the coastline in position. However, the
revetment’s extent has been insufficient to cover the entire reach of shoreline which is eroding to the
roadway, so a longer revetment has been considered.
There are various revetment options available. These include a short length which would minimally protect
the roadway, a long length revetment to protect the entire roadway, a buried revetment, a low crested
revetment, and a high crested revetment.
A short length revetment would only protect part of the road access way.
Buried revetments are typically covered with compatible beach sediment. The advantage of a buried
revetment is that it would preserve the aesthetic value of the beach and protect the road. However, to be
effective, the road would need to be located behind the buried wall to offer proper protection.
Low crested revetments are commonly used in benign wave climates. A crest height of at least RL 15.0m is
necessary to prevent the revetment from being damaged during storms. Furthermore, a crest height at RL
15.0m matches the existing ground level and would help key into the roadway on the landward side. A low
crested revetment, however, is subject to more overtopping and probable damage to the structure due to its
low amount of freeboard.
It is considered that a 400m long, RL 15.0m high crested revetment is required to protect the remaining
access roadway.
3.3 Preferred Option
Of all the above options, Council looked at two of the options in some detail. Option 1 was to move Camp
No1 to Camp No 2 and Option 2 was to extend the revetment. Council eventually selected the 400m long
revetment option because:
� Camp No 2 is in a flood zone and land would need to be purchased.
� A new boat ramp would need to be built at Camp No 2. This had a number of issues. Council would be
taking on extra health and safety risk for the ramp (which it doesn’t have now) and may need to build a
breakwater around it to make it safe. That would potentially affect the coast processes more than the
revetment.
� The revetment was more cost effective, overall.

Clifton Beach: Engineering Assessment
Beca // 3 November 2017
3233367 // NZ1-14168403-31 0.31 // 16
4 Revetment Design
4.1 Description
The revetment design detailed in this section would extend from the existing revetment’s western end 400m
to the west until the road turns away from the shoreline. There is a beach access ramp where the road turns
away from the shoreline. Preliminary design drawings can be found in Appendix B.
4.2 Design Considerations
4.2.1 Design Water Levels
Taking the water levels in section 2.3 into consideration and knowing that the proposed revetment structure will experience depth limited wave conditions. The design still water level of RL 12.0m is based on:
• MHWS RL 10.9m
• Storm surge 0.8m
• Sea level rise (SLR) 0.3m
4.2.2 Design Wave Conditions
The base of the wall will extend from RL 11.0m. This results in a depth of water of 1.0m and a design wave
height of 1.2m. A design mean wave period of 10s was adopted, although wave periods up to 16s were
considered.
Local limestone boulders are proposed to be used to form the revetment works. The ability of limestone boulders to resist the design wave will depend on many factors. The main factors are the rock integrity and its density, the level of acceptable damage, the revetment slope and level of permeability. Assuming a limestone boulder density of 2.2 t/m3 and a slope of 1:2 (which would be the maximum slope) it was found that:
• For a 2 layer system with an underlayer and minimal damage, the D50 would need to be about 1000mm. The underlayer would have a D50 of 400mm. With a geotextile between the native and rock material, an impermeable barrier was assumed.
• Using the Van der Meer equation for rock armour design in shallow water, the following parameters were assumed: Sd=2, P=0.1, N=3000.
• The crest level of the revetment should be set at RL 15.0m and be at least 3 D50 wide. (i.e. about 3m wide). Overtopping is discussed in Section 4.2.4. Some scouring of the road and grass areas could be expected during extreme sea storms.
• The toe of the revetment will be subject to scour and should have a buried toe with a width of twice the design wave height (i.e. about 2m). It is known that there is “papa” rock at around MSL and this has been assumed over 50% of its length. This will require a key toe detail to minimise loss of revetment rock.
• For the 80m length of rock wall in place, it is recommended that another layer of 1.0m rock be placed over the sloping revetment to improve its integrity for long term application.
• The limestone rock armour will require on-going monitoring and maintenance.
4.2.3 Climate Change Considerations
Considering the design life of the structure, an appropriate allowance for sea level rise is the 0.3m which
would cover about 30-50 years of structure life. The New Zealand Coastal Policy Statement requires

Clifton Beach: Engineering Assessment
Beca // 3 November 2017
3233367 // NZ1-14168403-31 0.31 // 17
consideration of SLR over 100 years which approximately equates to about 1.0m. The approach here is to
monitor SLR and if it exceeds 0.3m then the revetment would have another layer of rock to protect it for a
more elevated design water level and wave run-up.
4.2.4 Overtopping
The maximum allowable overtopping rate for no revetment damage is approximately 50 litres/s per metre of
revetment or 200 litres/s per metre if the crest is protected according to the UK Environment Agency (1999)
and CIRIA/CUR (2007). Given the design wave height of 1.2m, the design wave period of 10s, and the
dimensions of the proposed revetment the overtopping rate was calculated to be 44 litres/s per metre on the
seaward side of the revetment crest. For design wave period of 16s, and the dimensions of the proposed
revetment the overtopping rate was calculated to be 200 litres/s per metre. At these overtopping rates the
revetment would not be damaged.
The overtopping rate on the landward crest side would range from 4 to 15 L/s/m. CIRIA/CUR (2007) states
that this rate of overtopping would produce dangerous conditions for vehicles travelling on the road behind
the revetment. It is advised that appropriate signage be installed to advise road users about dangerous road
conditions during storms.
4.2.5 Tsunami
Power (2013) gives the 100 year and 500 year return period tsunami with wave heights of 4.2 and 7.0m
respectively. The revetment is not designed as a protection structure to guard against such tsunami.
Revetment damage can be expected in an extreme tsunami events.
Clifton is in a tsunami evacuation zone, and extreme tsunami events will be a serious civil defence issue.
4.3 Revetment Geometry
4.3.1 Spatial Extent
The spatial extent of the revetment stretches 400m from the western end of the existing revetment to where
the road turns away from the coastline in front of the Clifton Café. The revetment will roughly be parallel to
the RL 11.0m contour at its toe, and be roughly 15m wide at its typical cross section. It will key in with the
beach access ramp and road at its westernmost end.
4.3.2 Levels
To allow for the overtopping rates above, the revetment crest elevation was set to RL 15.0m. This elevation
is low enough to allow for overtopping during storms without damaging the revetment. Towards the western
end of the revetment, the crest elevation is RL 14.4m to aid the transition with the adjacent beach area.
From the crest towards the coastline, the revetment side slopes down to the toe at RL 11.0m and the existing
road lowers at a slope of 1:2. This toe is at the same approximate level as MHWS. Thus, the revetment toe
will be visible. Since the toe of the revetment will tie in with the hard Papa rock or have a buried toe, scour
effects are not anticipated.
The new concrete beach access ramp will tie into the hard papa rock at a level of RL 9.8m. It is designed so
that some beach material will wash up onto the base area of the ramp. The top of the ramp will tie in with the
road at a level of RL 13.2m. The ramp slope at 1:7 is to facilitate vehicle access.
Refer to the drawings in Appendix B for revetment and road levels which tie into existing ground levels.

Clifton Beach: Engineering Assessment
Beca // 3 November 2017
3233367 // NZ1-14168403-31 0.31 // 18
4.3.3 Rock
Limestone is readily available from nearby quarries and so it will be used to construct the revetment.
Limestone is not a durable material but has been used to construct revetments in the past. To ensure that
the wave environment will minimally dislodge the armour stone, the average rock size has been determined
to be 1m diameter. If a smaller rock size were used, displacement of the armour stone can be expected.
Additionally, the rock will be angular to facilitate interlocking and discourage armour stone from being
dislodged from the revetment. A typical armour thickness is twice the equivalent cubic diameter (CEM 2008),
hence the revetment will be 1.8m thick.
4.4 Revetment Construction
The revetment’s construction is expected to take approximately 4 months. Access to the site will be via
Clifton road. The project will require excavation of the foreshore and mudstone to form a sound base upon
which the revetment can be built. As necessary, sand may be used to form a compacted subgrade. The
excavation will take place as the tidal conditions allow.
Geotextile fabric and filter layer rock armour will then be laid on top. The rock armour will be stacked to
provide for adequate inter-locking. Rock armour placement will be done from the foreshore, however the
upper portion of the rock armour may be completed from the access road.
The revetment construction will take place progressively. The revetment will be constructed in 5-15m long
segments to minimise risk of foundation exposure.
Rock will be inspected for various factors including cleanliness, quality, size conformity, etc. at the quarry
rather than the construction site to reduce disturbances. The materials will then be transported by trucks to
the construction site and used immediately. Overall about 9000 m3 of rock required. Assuming an average
truck load of 10m3 per truck, the project will require 900 truckloads (about 15 trucks per day on average).
Lastly, it is best for the works to be completed outside of the main summer holiday period and Easter to
avoid high use periods. Works will be undertaken between the hours of 7:00am and 7:00pm, Monday to
Friday, tide permitting. All construction will be undertaken to comply with the Construction Noise Standard
NZS6803:1999 to avoid adversely affecting residents of neighbouring dwellings.
4.5 Revetment Maintenance
Although the revetment is expected to last 20 years before any significant maintenance would be necessary,
the actual design life of the structure is dependent on the level of maintenance and the frequency of
significant storms. With proper maintenance, a design life of 50 may be achievable.
Regular annual inspections as well as inspections after significant storms occurring during high tide are
recommended for the structure. These inspections may find that periodic replacement of dislodged rocks
may be necessary.
The beach may require periodic renourishment. This is due to the impoundment of about 850m3/year of
sediment which will probably be evidenced as a local down drift erosional lee effect. Of the 850m3/year
impoundment, it is estimated that 600m3/year will be impounded gravel. It is recommended that an allowance
of up to 1000m3/year be made with the actual amount determined through site monitoring.
The timing of the replenishment will be determined by 6 monthly monitoring (or after sea storms) with the aim
of placing it within two months of exceeding a threshold level. It would be preferable for replenishment to
take place in winter. This replenishment provision is mitigation for the wall and not for long term erosion.

Clifton Beach: Engineering Assessment
Beca // 3 November 2017
3233367 // NZ1-14168403-31 0.31 // 19
The renourishment material will be sourced to have a similar sized material as the existing beach gravel. It
will be delivered to site by truck and dumped on the beach. A small blade machine will then be used to
spread the material to make up the deficient caused by the downdrift erosion. Some overfilling of the
deficient should be allowed for.
5 Environmental Effects of Revetment
In general, revetments hold the shoreline at a constant point and prevent future shoreline retreat. On the
seaward side of the revetment, some scour and erosional effects could potentially be experienced. Scour
effects are expected to be minimal for this project because the revetment toe will generally tie in with the
hard Papa rock or be buried.
The revetment armour slope is designed to dissipate wave energy and minimize reflection so the wave
environment will be similar. Since the revetment runs along the shoreline, nearshore currents will also remain
unchanged.
According to the results of the coastal process modelling (Appendix D), the revetment extension will have no
effects up drift to the east due to it tying in with the existing revetment.
Due to the hardening of the coastline, the revetment will impound approximately 600m3/year of gravel, not
making it available to the littoral system. This impoundment loss will slightly increase over time due to sea
level rise.
Down drift effects on the western end will vary over time. In the short term (less than 10 years), the adverse
effects will be moderate, having slightly more erosion than the historical shoreline retreat. In the medium
term (20-30 years), the erosion rate will be similar to the historical shoreline retreat. Therefore the medium to
long term adverse effects are considered to be minor.
Although the model results don’t show an increase in the shoreline retreat, a local erosional cutting in of the
coastline will likely be experienced and potentially need to be managed.
Construction of the proposed revetment will provide a much larger level of protection for the existing
infrastructure. The revetment will locally hold the coastline stable
6 Conclusions
The environment at Clifton beach is complex due to a variety of factors including waves, tides, currents, wind
and its local geology. Over time, that environment has become conducive to an eroding shoreline which over
the years has become to a hazard to infrastructure along the beach.
Although a short revetment has been put in place to protect Camp No 1 access, its influence is insufficient to
protect the entire roadway. There are various options which can protect the rest of the roadway. Extending
the revetment is considered by Council as the best way forward.
The report assesses the potential environmental effects of the revetment on the coastal processes. This is
based on modelling the wave environment and longshore sediment movement (see Appendix D). No updrift
adverse effects are likely. Although the revetment will impound approximately 600m3/year of gravel, any
down drift effects on the western end will be similar to the historical shoreline in the medium to long term. In

Clifton Beach: Engineering Assessment
Beca // 3 November 2017
3233367 // NZ1-14168403-31 0.31 // 20
the short term (less than 10 years), however, the adverse effects are considered to be moderate, having
slightly more erosion than with the historical shoreline. In the medium to long term the adverse effects are
considered to be minor.
Local erosional cutting in of the downdrift coastline is likely be experienced and will probably need to be
managed.

Clifton Beach: Engineering Assessment
Beca // 3 November 2017
3233367 // NZ1-14168403-31 0.31 // 21
References
CIRIA/CUR, 2007, “The Rock Manual – The use of rock in hydraulic engineering”.
Komar, Paul D. and Erica Harris. HAWKE’S BAY, NEW ZEALAND: GLOBAL CLIMATE CHANGE AND
BARRIER-BEACH RESPONSES 2014.
Komar, Paul D "Summary and Discussion: Science and the Management of the Hawke's Bay Coast."
Http://www.napier.govt.nz/assets/Documents/westshore-erosion-full-07-4.pdf. N.p., n.d. Web. 28 May 2017.
Power, W, (2013) “Review of Tsunami in New Zealand”, for GNS.
Services, Environmental Management, Ltd. Te Awanga - Haumoana Coastal Erosion Review and
Recommendations 2009
"Standard port tidal levels." Land Information New Zealand (LINZ). N.p., n.d. Web. 15 May 2017.
<http://www.linz.govt.nz/sea/tides/tide-predictions/standard-port-tidal-levels>.
Tonkin & Taylor, Hawke’s Bay Regional Coastal Environment Plan: Coastal Hazards. Rep. Vol. 1. (2003)
UK Environment Agency, 1999, “Overtopping of Seawalls”.
United States Army Corps of Engineers. “Coastal Engineering Manual (CEM)." Official Publications of HQ
USACE. N.p., n.d. Web. 25 June 2017. <http://www.publications.usace.army.mil/USACE-
Publications/Engineer-Manuals

Clifton Beach: Engineering Assessment
Beca // 3 November 2017
3233367 // NZ1-14168403-31 0.31 // 22
Appendices
Appendix A
Gradation Curves
Appendix B
Engineering Drawings
Appendix C
Setback Lines
Appendix D
Coastal Processes Assessment

Clifton Beach: Engineering Assessment
Beca // 3 November 2017
3233367 // NZ1-14168403-31 0.31 // 23
Appendix A
Gradation Curves

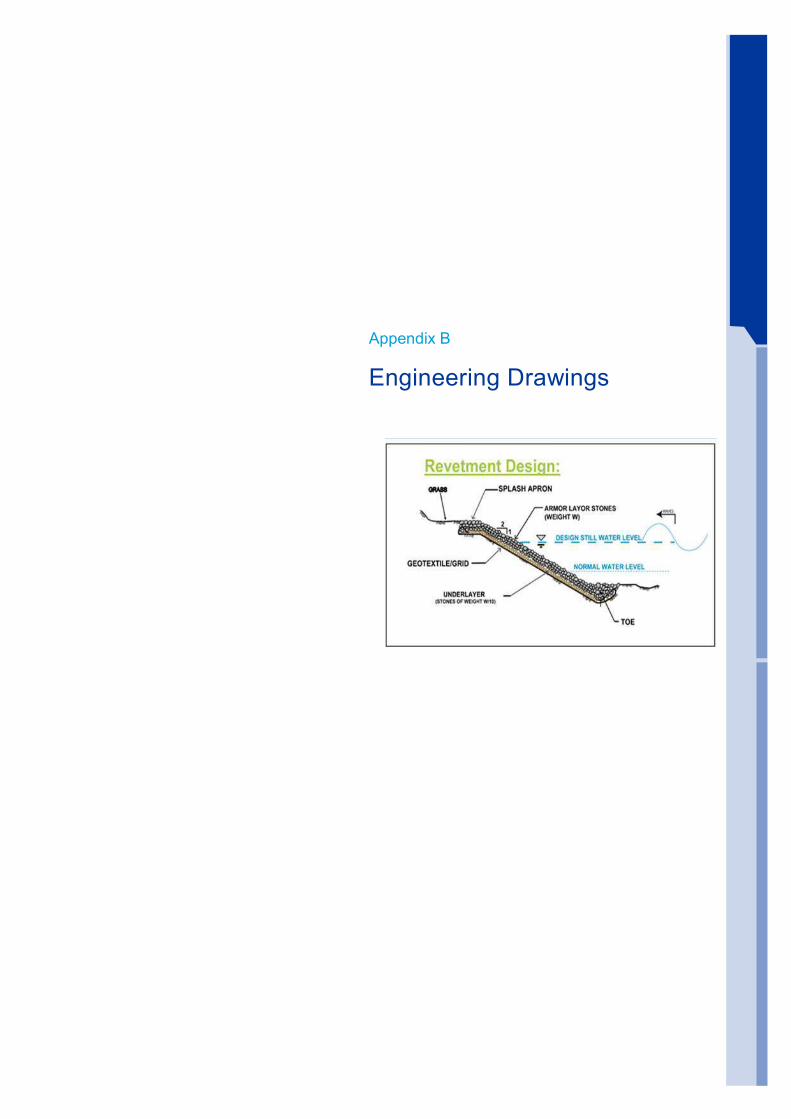
Clifton Beach: Engineering Assessment
Beca // 17 July 2017
3233367 // NZ1-14168403-30 0.30 // 24
Appendix B
Engineering Drawings

CLIFTON ROAD
7.45m
50.00m
7.59m
50.02m
6.46m
7.85m
50.00m
9.50m
50.36m
8.52m
51.23m Existing RockRetreat
Entrance tocamp ground
50.00m
Beach Crest / Erosive Edge
Survey 13 22-06-2016
PEG 1RL 13.89
PEG 2RL 14.75
PEG 3RL 14.88
PEG 4RL 15.15
PEG 5RL 15.28
PEG 6RL 16.09
BMKRL 16.32
P
P
7.45m
50.00m
7.59m
50.02m
6.46m
7.85m
50.00m
9.50m
50.36m
8.52m
51.23mExisting RockRetreat
Entrance tocamp ground
50.00m
TM
TM
TM
ExistingBuilding
Existing RockRetreat
T
9.00
9.50
10.00
10.00
9.50
9.50
10.00
10.00
10.50
10.50
10.50
10.50
11.00
11.00
11.00
11.00
11.50
11.50
11.50
11.50
12.00
12.00
12.00
12.00
12.50
12.50
12.50
12.50
13.0013.00
13.00
13.00
13.00
13.50
13.50
13.50
13.50
13.50
14.00
14.0014.00
14.00
14.00
14.50
14.50
14.50
14.50
14.50
15.00
15.00
16.5017.50
8.90
15.5017.00
8.808.70
9.20
9.30
9.20
9.10
9.40
9.40
9.10
9.40
9.60
9.30
9.60
9.40
9.30
9.90
9.609.80
9.90
9.60
9.70
9.70
9.80
9.70
9.80
10.20
9.90
9.90
10.10
10.10
10.10
10.20
10.20
10.40
10.40
10.4010.60
10.70
10.70
10.40
10.70
10.60
10.80
10.7010.60
10.9010.60
10.9010.80
11.10
10.8010.90
10.90
11.10
11.30
11.2011.40
11.10
11.30
11.10
11.60
11.60
11.20
11.70
11.90
11.40
11.40
11.6011.70
11.70
11.30
11.80
12.10
12.10
11.60
11.9011.70
12.20
12.20
12.30
12.3012.40
12.30
12.20
12.40
12.20
12.60
12.1012.80
12.30
12.70
12.40
12.70
12.40
12.90
13.20
12.60
13.10
9.50
13.10 12.80
12.90
12.8012.90
12.80
12.90
13.3012.9013.10
13.30
13.20
13.10
13.30
14.50
13.2013.30
14.50
13.30
13.20
13.20
13.10
16.00
8.60
13.70
13.40
13.30
13.40 9.20
9.30
13.6013.8013.40
13.6013.40
13.40
9.70
13.40
9.80
13.80
13.30
10.10
13.70
13.60
10.20
10.30
10.30
10.30
13.60
10.30
13.70
13.70
13.40
13.70
13.60
13.80
10.80
14.10
13.80
13.90
14.1013.80
11.20
11.20
14.20
14.10
11.30
13.90
11.40
13.9013.90
14.2014.10
11.80
11.8013.90
11.80
11.90
14.10
11.90
14.1014.20
12.10
14.20
14.1014.20
14.20
12.40
14.30
12.40
14.40
12.60
12.60
14.20
12.70
12.70
14.30
14.30
12.90
14.30
14.30
14.40
14.30
14.3014.40
14.40
14.60
14.60
14.40
14.60
14.6014.70
14.7014.60
14.80
14.80
14.70
14.80
14.90
15.10 14.90
15.2015.4015.6015.3015.1015.7015.8016.4016.1016.2015.9016.3016.6016.9017.2016.7016.8017.4017.1017.30
ww
w.b
eca.
com
ww
w.b
eca.
com
3233367-CA-K001 A
EXISTINGLAYOUT PLAN(CONTOURS)
CIVIL ENGINEERINGCLIFTON REVETMENT
NOT FOR CONSTRUCTION
FOR CLIENT REVIEW
FOR INFORMATION
NOT FOR CONSTRUCTION
A ISSUED FOR CLIENT REVIEW KWN EW SP 21.04.17No. AppdRevision By Chk Date
Drawing Originator:
DO NOT SCALE
* Refer to Revision 1 for Original Signature
Scale (A1)
Scale (A3)Reduced
Dwg Check
Dsg Verifier
Drawn
Original DesignConstruction*
Date
Approved For Client: Project:
IF IN DOUBT ASK.
Title:
Drawing No.
Discipline
Docu
ment
No.
Rev.
Drawing Plotted: 05 Jul 2017 6:40 a.m.
3233
367-
CA-K
001.D
WG
N LEGEND:EXISTING CONTOUR
PROPERTY BOUNDARIES
DATUM STATEMENT:SURVEY IS IN TERMS OF HASTINGS DISTRICT COUNCIL LOCAL DATUMRL 10.00m IS APPROXIMATELY MEAN SEA LEVEL.
TIDE STATE: CHART DATUM (m) LOCAL DATUM (m)
HATMHWSMHWN
MSLMLWNMLWS
LAT - CHART DATUM
2.01.81.50.90.40.10.0
11.110.910.610.09.59.29.1
TIDE LEVELS:
EXISTING 275mm DIA PVC CULVERT
EXISTING 300mm DIA PVC CULVERT

7.45m
50.00m
7.59m
50.02m
6.46m
7.85m
50.00m
9.50m
50.36m
8.52m
51.23m Existing RockRetreat
Entrance tocamp ground
50.00m
Beach Crest / Erosive Edge
Survey 13 22-06-2016
PEG 1RL 13.89
PEG 2RL 14.75
PEG 3RL 14.88
PEG 4RL 15.15
PEG 5RL 15.28
PEG 6RL 16.09
BMKRL 16.32
P
P
7.45m
50.00m
7.59m
50.02m
6.46m
7.85m
50.00m
9.50m
50.36m
8.52m
51.23mExisting RockRetreat
Entrance tocamp ground
50.00m
TM
TM
TM
ExistingBuilding
Existing RockRetreat
T
9.00
9.50
10.00
10.00
9.50
9.50
10.00
10.00
10.50
10.50
10.50
10.50
11.00
11.00
11.00
11.00
11.50
11.50
11.50
11.50
12.00
12.00
12.00
12.00
12.50
12.50
12.50
12.50
13.0013.00
13.00
13.00
13.00
13.50
13.50
13.50
13.50
13.50
14.00
14.0014.00
14.00
14.00
14.50
14.50
14.50
14.50
14.50
15.00
15.00
16.5017.50
8.90
15.5017.00
8.808.70
9.20
9.30
9.20
9.10
9.40
9.40
9.10
9.40
9.60
9.30
9.60
9.40
9.30
9.90
9.609.80
9.90
9.60
9.70
9.70
9.80
9.70
9.80
10.20
9.90
9.90
10.10
10.10
10.10
10.20
10.20
10.40
10.40
10.4010.60
10.70
10.70
10.40
10.70
10.60
10.80
10.7010.60
10.9010.60
10.9010.80
11.10
10.8010.90
10.90
11.10
11.30
11.2011.40
11.10
11.30
11.10
11.60
11.60
11.20
11.70
11.90
11.40
11.40
11.6011.70
11.70
11.30
11.80
12.10
12.10
11.60
11.9011.70
12.20
12.20
12.30
12.3012.40
12.30
12.20
12.40
12.20
12.60
12.1012.80
12.30
12.70
12.40
12.70
12.40
12.90
13.20
12.60
13.10
9.50
13.10 12.80
12.90
12.8012.90
12.80
12.90
13.3012.9013.10
13.30
13.20
13.10
13.30
14.50
13.2013.30
14.50
13.30
13.20
13.20
13.10
16.00
8.60
13.70
13.40
13.30
13.40 9.20
9.30
13.6013.8013.40
13.6013.40
13.40
9.70
13.40
9.80
13.80
13.30
10.10
13.70
13.60
10.20
10.30
10.30
10.30
13.60
10.30
13.70
13.70
13.40
13.70
13.60
13.80
10.80
14.10
13.80
13.90
14.1013.80
11.20
11.20
14.20
14.10
11.30
13.90
11.40
13.9013.90
14.2014.10
11.80
11.8013.90
11.80
11.90
14.10
11.90
14.1014.20
12.10
14.20
14.1014.20
14.20
12.40
14.30
12.40
14.40
12.60
12.60
14.20
12.70
12.70
14.30
14.30
12.90
14.30
14.30
14.40
14.30
14.3014.40
14.40
14.60
14.60
14.40
14.60
14.6014.70
14.7014.60
14.80
14.80
14.70
14.80
14.90
15.10 14.90
15.2015.4015.6015.3015.1015.7015.8016.4016.1016.2015.9016.3016.6016.9017.2016.7016.8017.4017.1017.30
33233367-CA-K002
43233367-CA-K003
53233367-CA-K003
63233367-CA-K003
23233367-CA-K002
13233367-CA-K002
CLIFTON ROAD
ww
w.b
eca.
com
ww
w.b
eca.
com
3233367-CA-K002 B
PROPOSEDOVERALL
LAYOUT PLAN
CIVIL ENGINEERINGCLIFTON REVETMENT1:800
-
SJP 04.04.17KWN 06.04.17SJP 13.04.17
NOT FOR CONSTRUCTION
FOR CLIENT REVIEW
FOR INFORMATION
NOT FOR CONSTRUCTION
No. AppdRevision By Chk Date
Drawing Originator:
DO NOT SCALE
* Refer to Revision 1 for Original Signature
Scale (A1)
Scale (A3)Reduced
Dwg Check
Dsg Verifier
Drawn
Original DesignConstruction*
Date
Approved For Client: Project:
IF IN DOUBT ASK.
Title:
Drawing No.
Discipline
Docu
ment
No.
Rev.
Drawing Plotted: 03 Jul 2017 1:42 p.m.
3233
367-
CA-K
002.D
WG
N
PASSING BAY.
EXISTING SLOPETO REMAIN INTACT
BUILDING TOBE REMOVED
PASSING BAY.
ROAD
PROPOSED REVETMENT
LEGEND:EXISTING CONTOUR
PROPERTY BOUNDARIES
DATUM STATEMENT:SURVEY IS IN TERMS OF HASTINGS DISTRICT COUNCIL LOCAL DATUMRL 10.00m IS APPROXIMATELY MEAN SEA LEVEL.
TIDE STATE: CHART DATUM (m) LOCAL DATUM (m)
HATMHWSMHWN
MSLMLWNMLWS
LAT - CHART DATUM
2.01.81.50.90.40.10.0
11.110.910.610.09.59.29.1
TIDE LEVELS:
A3123367-CA-K003
A ISSUED FOR CLIENT REVIEW KWN EW SP 21.04.17B BOAT RAMP AMENDED KWN EW SP 03.07.17

7.45m
50.00m
7.59m
Entrance tocamp ground
PEG 1RL 13.89
PEG 2RL 14.75
7.45m
50.00m
7.59m
Entrance tocamp ground
T
10.0010.00
9.5010.50
10.50
11.00
11.00
11.50
11.50
12.00
12.00
12.5012.50
13.0013.00
13.00
13.50
13.5013.5014.00
14.0014.0014.50
14.50
9.30
9.20
9.10
9.40
9.40
9.60
9.30
9.90
9.609.80
9.709.80
9.70
10.20
9.90
10.1010.10
10.20
10.40
10.4010.60
10.70
10.70
10.9010.60
10.9010.80
11.10
11.3011.10
11.30
11.60
11.20
11.7011.40
11.6011.7011.80
12.1012.20
12.30
12.20
12.60
12.1012.80
12.30
12.70
12.40
12.90
13.20
13.10
9.50
13.10 12.8012.90
13.3012.9013.10
13.3013.30
14.50
13.30
13.20
13.2013.40
13.30
13.40 9.20
13.6013.8013.40
13.40
13.8013.70
10.30
10.30
13.60
13.7013.40
13.70
13.60
10.80
14.1013.80
11.20
14.10
13.90
11.40
13.9013.90
11.80
11.90
11.90
14.1014.20
14.2014.20
12.40
14.30
12.60
12.70
14.30
12.90
14.30
14.4014.40
14.60
14.40
14.60
14.6014.7014.80
ww
w.b
eca.
com
ww
w.b
eca.
com
3233367-CA-K003 B
PROPOSEDLAYOUT PLAN CIVIL ENGINEERINGCLIFTON REVETMENT1:250
1:500
SJP 04.04.17KWN 06.04.17SJP 13.04.17
NOT FOR CONSTRUCTION
FOR CLIENT REVIEW
FOR INFORMATION
NOT FOR CONSTRUCTION
No. AppdRevision By Chk Date
Drawing Originator:
DO NOT SCALE
* Refer to Revision 1 for Original Signature
Scale (A1)
Scale (A3)Reduced
Dwg Check
Dsg Verifier
Drawn
Original DesignConstruction*
Date
Approved For Client: Project:
IF IN DOUBT ASK.
Title:
Drawing No.
Discipline
Docu
ment
No.
Rev.
Drawing Plotted: 03 Jul 2017 1:42 p.m.
3233
367-
CA-K
003.D
WG
N
ROAD
PROPOSED REVETMENT
LEGEND:EXISTING CONTOUR
PROPERTY BOUNDARIES
DATUM STATEMENT:SURVEY IS IN TERMS OF HASTINGS DISTRICT COUNCIL LOCAL DATUMRL 10.00m IS APPROXIMATELY MEAN SEA LEVEL.
TIDE STATE: CHART DATUM (m) LOCAL DATUM (m)
HATMHWSMHWN
MSLMLWNMLWS
LAT - CHART DATUM
2.01.81.50.90.40.10.0
11.110.910.610.09.59.29.1
TIDE LEVELS:
A ISSUED FOR CLIENT REVIEW KWN EW SP 21.04.17
EXISTING ACCESS TO CG No.2
B BOAT RAMP AMENDED KWN EW SP 03.07.17

7.45m
50.00m
7.59m
50.02m
6.46m
7.85m
Entrance tocamp ground
50.00m
PEG 1RL 13.89
PEG 2RL 14.75
PEG 3RL 14.88
PEG 4RL 15.15
7.45m
50.00m
7.59m
50.02m
6.46m
7.85m
Entrance tocamp ground
50.00m
T
10.00
10.00
9.5010.50
10.50
10.50
11.00
11.00
11.00
11.50
11.50
11.50
12.00
12.00
12.00
12.50
12.50
12.50
13.0013.00
13.00
13.00
13.50
13.50
13.50
13.50
14.00
14.0014.00
14.00
14.50
14.50
14.50
15.00
9.30
9.20
9.10
9.40
9.40
9.60
9.30
9.90
9.609.80
9.709.80
9.70
10.20
9.90
10.10
10.10
10.20
10.20
10.40
10.4010.60
10.70
10.40
10.70
10.80
10.7010.60
10.9010.60
10.9010.80
11.10
10.90
11.10
11.30
11.2011.40
11.10
11.30
11.60
11.60
11.20
11.7011.40
11.6011.70
11.30
11.8012.10
11.9011.70
12.20
12.20
12.30
12.30
12.2012.60
12.1012.80
12.30
12.70
12.40
12.40
12.90
13.20
13.10
9.50
13.10 12.80
12.9012.80
13.3012.9013.10
13.30
13.10
13.30
13.2013.30
14.50
13.30
13.20
13.2013.40
13.30
13.40 9.20
13.6013.8013.40
13.6013.40
13.40
13.8013.70
10.30
10.30
10.30
13.60
13.70
13.70
13.40
13.70
13.60
10.80
13.80
14.1013.80
11.20
14.10
13.90
11.40
13.9013.90
11.80
11.8013.90
11.90
11.90
14.1014.20
12.10
14.20
14.1014.20
14.20
12.40
14.30
12.60
12.60
12.70
12.70
14.30
12.90
14.30
14.40
14.3014.40
14.40
14.60
14.40
14.60
14.6014.70
14.7014.60
14.80
14.8015.10 14.90
JOIN
LINE
- RE
FER
3233
367-
CA-K
005
13.50
14.00
14.50
15.00
13.30
13.4013.
60
13.70
13.80
13.90
14.1014
.2014
.3014
.40
14.60 14.70 14.80 14.90
15.10
15.10 15.10
11.0011.50
12.0012.5013.00
13.5014.00
14.5015.00
11.1011.2011.3011.4011.6011.7011.8011.9012.1012.2012.3012.4012.6012.7012.8012.9013.1013.2013.3013.4013.6013.7013.8013.9014.1014.2014.3014.4014.6014.7014.8014.90
15.10
13.20
13.30
10.0010.5011.0011.5012.0012.5013.00
ww
w.b
eca.
com
ww
w.b
eca.
com
3233367-CA-K004 B
EXISTING AND PROPOSEDCONTOUR PLAN
SHEET 1 OF 2
CIVIL ENGINEERINGCLIFTON REVETMENT1:250
1:500
SJP 04.04.17KWN 06.04.17SJP 13.04.17
NOT FOR CONSTRUCTION
FOR CLIENT REVIEW
FOR INFORMATION
NOT FOR CONSTRUCTION
No. AppdRevision By Chk Date
Drawing Originator:
DO NOT SCALE
* Refer to Revision 1 for Original Signature
Scale (A1)
Scale (A3)Reduced
Dwg Check
Dsg Verifier
Drawn
Original DesignConstruction*
Date
Approved For Client: Project:
IF IN DOUBT ASK.
Title:
Drawing No.
Discipline
Docu
ment
No.
Rev.
Drawing Plotted: 03 Nov 2017 10:26 a.m.
3233
367-
CA-K
004.D
WG
N LEGEND:EXISTING CONTOUR
PROPOSED CONTOURS
A ISSUED FOR CLIENT REVIEW KWN EW SP 21.04.17B EXISTING OF GRADING REVISED KWN EW SP 03.11.17

7.85m
50.00m
9.50m
50.36m
8.52m
51.23m
PEG 4RL 15.15
PEG 5RL 15.28
PEG 6RL 16.09
BMKRL 16.32
P
P
7.85m
50.00m
9.50m
50.36m
8.52m
51.23m TM
TM
TM
9.00
9.50
9.50
10.00
10.00
10.50
10.50
11.00
11.00
11.50
11.50
12.00
12.00
12.5013.0013.5014.00
14.5014.5015.00
16.5017.50
8.90
15.5017.00
8.808.70
9.209.40
9.10
9.60
9.30
9.409.90
9.60
9.70
9.809.9010.10
10.20
10.4010.70
10.40
10.60
10.80
10.7010.6011.10
10.8010.90
10.90
11.2011.40
11.10
11.60
11.9011.4011.70
11.30
12.1011.60
11.9011.70
12.20
12.3012.40
12.40
12.20
12.7012.6012.8012.9013.20
14.50
13.10
16.00
8.60
13.70
9.30
13.40
9.70
9.80
13.30
10.10
13.60
10.20
10.30
10.30
13.80
14.10
13.90
11.20
14.20
11.30
14.2014.10
11.80
11.80
14.10
12.10
12.40
14.40
14.20
14.30
14.30
14.30
14.6014.8014.7014.9015.2015.4015.6015.3015.1015.7015.8016.4016.1016.2015.9016.3016.6016.9017.2016.7016.8017.4017.1017.30
14.50
15.00
14.20
14.20
14.30
14.40
14.60
14.70
14.80
14.90
15.10 15.10
15.10
11.00
11.50
12.00
12.50
13.00
13.50
14.00
14.50
15.00
11.1011.2011.3011.4011.6011.7011.8011.9012.1012.2012.3012.40 12.6012.7012.8012.9013.1013.2013.3013.4013.6013.7013.8013.90
14.1014.2014.3014.4014.6014.7014.8014.90
15.10
JOIN
LINE
- RE
FER
3233
367-
CA-K
004
Existing RockRetreat
Existing RockRetreat
ExistingBuilding
Existing RockRetreat
ww
w.b
eca.
com
ww
w.b
eca.
com
3233367-CA-K005 B
EXISTING AND PROPOSEDCONTOUR PLAN
SHEET 2 OF 2
CIVIL ENGINEERINGCLIFTON REVETMENT1:250
1:500
SJP 04.04.17KWN 06.04.17SJP 13.04.17
NOT FOR CONSTRUCTION
FOR CLIENT REVIEW
FOR INFORMATION
NOT FOR CONSTRUCTION
No. AppdRevision By Chk Date
Drawing Originator:
DO NOT SCALE
* Refer to Revision 1 for Original Signature
Scale (A1)
Scale (A3)Reduced
Dwg Check
Dsg Verifier
Drawn
Original DesignConstruction*
Date
Approved For Client: Project:
IF IN DOUBT ASK.
Title:
Drawing No.
Discipline
Docu
ment
No.
Rev.
Drawing Plotted: 03 Nov 2017 10:26 a.m.
3233
367-
CA-K
005.D
WG
N LEGEND:EXISTING CONTOUR
PROPOSED CONTOURS
A ISSUED FOR CLIENT REVIEW KWN EW SP 21.04.17
JOIN
LINE
- RE
FER
RIGH
T
A-
INSETSCALE 1:250
B EXISTING OF GRADING REVISED KWN EW SP 03.11.17

3.0m CREST
21
RL 14.4
RL 13.4
23233367-CA-K001
SECTIONSCALE 1:50
3.0m CREST
21
RL 15.0
LEVEL TO SUIT, (RL 13.2 TO 15.0)
33233367-CA-K001
SECTIONSCALE 1:50
2%
5.0m ROAD
EXISTING BEACH LEVEL
CARPARK ACCESS ROAD
21
APPROX. MHWS RL 11.00
7 (MAX)1
MSL RL 10.0
RL 13.20
CONCRETE SLAB KEYED INTOUNDERLYING PAPA ROCKWITH ROUGHENED SURFACE.
BEACH ACCESS RAMP APPROX. 25m LONG, 5.0m WIDE
RL 9.8
13233367-CA-K001
SECTION THROUGH RAMPSCALE 1:50
FLOWABLE FILL TO PAPA ROCK.
21
EXISTING SEAL.
MANTAIN BEACH MATERIALOVER RAMP.
EXISTING SURFACE
EXISTING PAPA ROCK LEVEL
EXISTING BEACH LEVEL
EXISTING PAPA ROCK LEVEL
APPROX. MHWS RL 11.00
ww
w.b
eca.
com
ww
w.b
eca.
com
3233367-CA-K006 B
TYPICALCROSS SECTIONS
SHEET 1 OF 2
CIVIL ENGINEERINGCLIFTON REVETMENT1:50
1:100
SJP 05.04.17KWN 05.04.17
NOT FOR CONSTRUCTION
FOR CLIENT REVIEW
FOR INFORMATION
NOT FOR CONSTRUCTION
No. AppdRevision By Chk Date
Drawing Originator:
DO NOT SCALE
* Refer to Revision 1 for Original Signature
Scale (A1)
Scale (A3)Reduced
Dwg Check
Dsg Verifier
Drawn
Original DesignConstruction*
Date
Approved For Client: Project:
IF IN DOUBT ASK.
Title:
Drawing No.
Discipline
Docu
ment
No.
Rev.
Drawing Plotted: 03 Nov 2017 10:27 a.m.
3233
367-
CA-K
006.D
WG
A ISSUED FOR CLIENT REVIEW KWN EW SP 21.04.17B ISSUED FOR CLIENT REVIEW, SECTIONS AMENDED KWN EW SP 02.11.17

43233367-CA-K001
SECTIONSCALE 1:50
3.0m CREST
21
RL 15.0
LEVEL TO SUIT, (RL 14.2 TO 15.0)
53233367-CA-K001
SECTIONSCALE 1:50
2%
5.0m MINIMUM
3.0m CREST
RL 15.0
RL 14.20
3.0m CREST
21
RL 15.0 RL 15.12%
5.0m ROAD
21
21
NEW ROAD FILLED RL 14.2 TO RL 15.0
EXISTING SLOPE TO BE MAINTAINED.
21
EXISTING REVETMENT
NEW 1.0m DIA LAYER
63233367-CA-K001
SECTIONSCALE 1:50
FILL
EXISTING BEACH LEVELAPPROX. MHWS RL 11.00
APPROX. MHWS RL 11.00
EXISTING BEACH LEVEL
EXISTING PAPA ROCK LEVEL
APPROX. MHWS RL 11.00
EXISTING BEACH LEVEL
EXISTING PAPA ROCK LEVEL
ww
w.b
eca.
com
ww
w.b
eca.
com
3233367-CA-K007 B
TYPICALCROSS SECTIONS
SHEET 2 OF 2
CIVIL ENGINEERINGCLIFTON REVETMENT1:50
1:100
SJP 05.04.17KWN 05.04.17
NOT FOR CONSTRUCTION
FOR CLIENT REVIEW
FOR INFORMATION
NOT FOR CONSTRUCTION
No. AppdRevision By Chk Date
Drawing Originator:
DO NOT SCALE
* Refer to Revision 1 for Original Signature
Scale (A1)
Scale (A3)Reduced
Dwg Check
Dsg Verifier
Drawn
Original DesignConstruction*
Date
Approved For Client: Project:
IF IN DOUBT ASK.
Title:
Drawing No.
Discipline
Docu
ment
No.
Rev.
Drawing Plotted: 03 Nov 2017 10:27 a.m.
3233
367-
CA-K
007.D
WG
A ISSUED FOR CLIENT REVIEW KWN EW SP 21.04.17B ISSUED FOR CLIENT REVIEW, SECTIONS AMENDED KWN EW SP 02.11.17

A-
ROAD \ REVETMENT INTERFACESCALE 1:50
3.0m CREST
21
2%
5.0m ROAD
//
21
VARIES(0 - 3m)
BACKSLOPE 2.0m NEW
BOU
NDAR
Y FE
NCE
EDGE BEAMS E.G. (200 x 50mm TIMBER)ROAD PAVEMENT
SERVICE TRENCH (AND PASSING BAY).
GEOTEXTILE PAPA ROCK
BEACH GRAVELS
3.0m 210.3
m
PAPA ROCK
21
B-
REVETMENT TOE DETAILPAPA ROCK BELOW REVETMENTSCALE 1:50
1/2 ARMOUR ROCKINTO PAPA ROCK
1.0m DIA LIMESTONE ARMOUR2 LAYERS (1.8m THICK).
NOTE:THERE WILL BE PLANTING TOCREST AND BACKSLOPE.
C-
REVETMENT TOE DETAIL INTO PAPA ROCKSCALE 1:50
D-
1.0m LIMESTONE ARMOUR2 LAYERS (1.8m THICK).
0.5m PLANTED
ww
w.b
eca.
com
ww
w.b
eca.
com
3233367-CA-K008 BTYPICAL DETAILS CIVIL ENGINEERINGCLIFTON REVETMENT1:50
1:100
SJP 05.04.17KWN 05.04.17
NOT FOR CONSTRUCTION
FOR CLIENT REVIEW
FOR INFORMATION
NOT FOR CONSTRUCTION
No. AppdRevision By Chk Date
Drawing Originator:
DO NOT SCALE
* Refer to Revision 1 for Original Signature
Scale (A1)
Scale (A3)Reduced
Dwg Check
Dsg Verifier
Drawn
Original DesignConstruction*
Date
Approved For Client: Project:
IF IN DOUBT ASK.
Title:
Drawing No.
Discipline
Docu
ment
No.
Rev.
Drawing Plotted: 03 Nov 2017 10:27 a.m.
3233
367-
CA-K
008.D
WG
A ISSUED FOR CLIENT REVIEW KWN EW SP 21.04.17
D-
FLUSH EDGE DETAILSCALE 1:5
FLUSH EDGE (E.G. 200 x 50 TIMBER)
ROAD PAVEMENT
GEOTEXTILE
FILL
B ISSUED FOR CLIENT REVIEW, SECTIONS AMENDED KWN EW SP 02.11.17

Clifton Beach: Engineering Assessment
Beca // 17 July 2017
3233367 // NZ1-14168403-30 0.30 // 25
Appendix C
Setback Lines


Clifton Beach: Engineering Assessment
Beca // 17 July 2017
3233367 // NZ1-14168403-30 0.30 // page 1
Appendix D
Coastal Processes Assessment

Proposal
Clifton Beach: Coastal Processes Assessment
Prepared for Hastings District Council
Prepared by Beca Limited
November 2017

Clifton Beach: Coastal Processes Assessment
Beca // 1 November 2017
3233367 // NZ1-14088674-29 0.29 // i
Revision History
Revision Nº Prepared By Description Date
0 Evan Walters Preliminary Draft 15/05/2017
1 Evan Walters For Resource Consent 11/07/2017
2 Connon Andrews Updated for Section 92 01/11/2017
Document Acceptance
Action Name Signed Date
Prepared by Evan Walters
01/11/2017
Reviewed by Connon Andrews
01/11/2017
Approved by Stephen Priestley
01/11/2017
on behalf of Beca Limited
Beca 2017 (unless Beca has expressly agreed otherwise with the Client in writing).
This report has been prepared by Beca on the specific instructions of our Client. It is solely for our Client’s use for the purpose for which it is intended in accordance with the agreed scope of work. Any use or reliance by any person contrary to the above, to which Beca has not given its prior written consent, is at that person's own risk.

Clifton Beach: Coastal Processes Assessment
Beca // 1 November 2017
3233367 // NZ1-14088674-29 0.29 // 2
Contents
1 Introduction 3
1.1 Background 3
1.2 Methods 3
1.3 Limitations 4
2 Project Information and Simulation Inputs 5
2.1 Previous Studies 5
2.2 Existing Information 5
2.3 Procured Information and Assumptions 7
3 Modelling 10
3.1 Wave Modelling 10
3.2 Longshore Sediment Transport 11
3.3 Calibration and Simulations 13
3.4 Results 17
3.5 Discussion 18
4 Conclusions 24

Clifton Beach: Coastal Processes Assessment
Beca // 1 November 2017
3233367 // NZ1-14088674-29 0.29 // 3
1 Introduction
1.1 Background
The southern extent of Clifton Beach has been experiencing ongoing coastal erosion that is threatening
Clifton Road and a camp No. 1 near Cape Kidnappers. Historically, Clifton Road been relocated landward
on several occasions in response to coastal erosion to maintain access.
To afford coastal protection Hastings District Council (HDC) constructed an 80m revetment in 2013 to protect
the campsite entrance and toilet block (refer to Figure 1.1). The revetment resource consent expires on
August 31st 2018. Despite these efforts, the shoreline has continued to retreat and threatens other areas of
the access road.
To address the coastal erosion HDC is preparing a resource consent application to retain the existing
revetment and to extend it further westward by 400m along the access road. This report provides an
assessment of the potential effects on coastal processes from the proposed revetment.
Figure 1.1: Project Location
1.2 Methods
The most noticeable potential effects of revetment structures is a change to the coastline planform, either by
erosion or accretion. Therefore, the focus of this coastal process assessment has been on longshore
sediment transport. This requires a sound understanding of the wave climate at the beach and the
characteristics of the sediment such as sediment size and supply rates.
To investigate the proposed revetment’s effects on the local environment; it is first necessary to compile all
existing information on the local environment. This information includes geotechnical information, wind, wave
and current data, aerial graphics, and bathymetric survey data. Available information is summarized in
Section 2.0 of this report.

Clifton Beach: Coastal Processes Assessment
Beca // 1 November 2017
3233367 // NZ1-14088674-29 0.29 // 4
The offshore bathymetry along the Clifton Beach shoreline is complex comprising of reefs and rock outcrops
which have a significant effect on wave transformation and the shoreline morphology. To resolve the
nearshore wave climate SWAN (Simulating WAves Nearshore) was employed to provide time series wave
data at 32 locations along the shoreline. Next, this data was used in Littoral Processes FM a DHI coastal
longshore transport model to simulate longshore transport and shoreline evolution. The potential effects from
the proposed engineering works are assessed within Littoral Processes FM and are presented in Section 3
of this report.
1.3 Limitations
The potential effects from the implementation of a revetment has been assessed via numerical techniques
and available data. The simulation of waves and sediment transport processes is complex and numerical
modelling is one method used to quantify these processes. The accuracy of numerical models to simulate
coastal processes is model dependent and a function of model physics, model assumptions and available
data. For this assessment the SWAN and LITPACK models have been adopted, both have been validated
for shallow water wave transformation and simulation of gravel transport. However, these models all have
inherent limitations and range of applicability. While the uncertainties have been addressed through the
coastal process assessment it is important to recognize that the model results are estimates and the model
limitations, such as 1d definition of sediment transport processes in LITPACK, needs to be considered when
defining physical effects.
The assessments are also dependent on input data, such as:
� The coastal processes assessment is reliant on the offshore wave data provided by Metocean Solutions
Ltd.
� The modelling is reliant on the available bathymetric data.
� The modelling has been calibrated to a digitised vegetation line derived from ortho-corrected aerial
photographs. There is inherent errors in ortho-correction and definition of the vegetation line particularly
with older aerial photographs.
While there are uncertainties in the model assumptions and inputs, a model calibration and validation
process has been completed to measured long term trends.

Clifton Beach: Coastal Processes Assessment
Beca // 1 November 2017
3233367 // NZ1-14088674-29 0.29 // 5
2 Project Information and Simulation Inputs
2.1 Previous Studies
2.1.1 Komar Report (March 2014)
This comprehensive report summarizes environmental information along the entire Hawke’s Bay coast. It
covers topics such as sea level rise, past earthquakes, wave climate, and extreme water levels. Most
importantly for this report, it also includes sediment budget calculations.
Information from this report was used as input to the Littoral Processes FM model. The report states that “In
this budget it is seen that the Tukituki River and the erosion of Cape Kidnappers combine to contribute an
estimated 46,000 m3/year of gravel to this cell, while loses amount to a total of -91,000 m3/year, the result
being that the budget’s balance is significantly “in the red” with a net annual loss of -45,000 m3/year,
indicating that on average the Haumoana Cell’s shoreline has experienced erosion over the decades”. For
this study, Komar reports that 18,000 m3/year of littoral supply is available at Clifton.
2.1.2 T&T Report (April 2008)
The Tonkin and Taylor report details the erosion risk at the various beaches along Hawke’s Bay. Most
relevant to this report, it discusses historical trends for Clifton beach. It states that although historical erosion
rates for the HB1 cross shore profile are higher between 1973 to 1995 than the rates after 1995, the overall
average erosion rate is 0.69m/year (1973 to 2008).
2.1.3 Environmental Management Services Ltd. (April 2009)
This report evaluates the advantages and disadvantages of several options to solve the erosion problems at
Te Awanga, Haumoana, and Clifton Beaches. Within its sediment budget section, it states that the net ‘loss’
of gravel from Te Awanga – Haumoana and Clifton beaches is estimated to be 48,800 cubic metres per year,
11,600 cubic metres being at Clifton Beach. It then goes on to evaluate various options to solve the beach
erosion. Specifically, it dismisses a seawall revetment as a solution calling it too expensive, and proposes
constructing a groyne field in the area. It rules out a beach nourishment solution due to the availability of
gravel in the area.
The recommendation provided in the report is a staged retreat approach due to the high cost of a groyne
field ($17.4 million net present value in the first 20 years, $18.5 million over 60 years) and uncertainty of
constructing groynes in the area. Although expensive, it must be noted that the extent of the 2009 study is
for a larger area than this assessment. A groynes project at Clifton beach would be less expensive than the
cited numbers above.
2.2 Existing Information
2.2.1 Tides and Water Levels
Astronomical tide levels for the Port of Napier, which are considered applicable for Clifton Beach are
presented in Table 2.1. Levels are presented in both Chart Datum (CD) and relative to the local Hawkes Bay
MSL datum (RL).

Clifton Beach: Coastal Processes Assessment
Beca // 1 November 2017
3233367 // NZ1-14088674-29 0.29 // 6
Table 2.1: Tide and Water Levels for Napier, New Zealand
Level (m CD) Level (m RL)
MHWS 1.89 10.97
MHWN 1.49 10.57
MSL 0.95 10.03
MLWN 0.39 9.47
MLWS 0.04 9.12
Source: LINZ Standard Ports
2.2.2 Geotechnical Information
The backshore comprises of alluvial deposits (silt, sand and gravel) which is underlain by papa basement
rock. The papa basement rock is exposed at various locations along the shoreline in the form of hard
headlands, exposed outcrops in the intertidal beach area and as submerged reefs. The papa rock is
generally located at an elevation of RL 10.0m and is considered hard and does not erode at any noticeable
rate.
The beach material comprises of mixed sand gravel with coarser sediment at the upper beach levels.
Sediment gradation curve for this location (labelled K1) is presented in Appendix A of the Engineering
Assessment Report. Based on the gradation data and anecdotal information, the average sediment size
used in the model is 20mm.
2.2.3 Bathymetric Information
2.2.3.1 Side scan Data
Side scan sonar data was provided by the HBRC (refer to Figure 2.1). The data extends approximately 1km
offshore to a depth of RL 8.0 at the nearshore.
Figure 2.1: Side scan sonar survey offshore of Clifton Beach, elevations in metres

Clifton Beach: Coastal Processes Assessment
Beca // 1 November 2017
3233367 // NZ1-14088674-29 0.29 // 7
2.2.3.2 Beach Profile Survey, HB1
HBRC has been keeping records of beach profiles since 1972. The closest monitoring location to the project
is called HB1 (refer to Figure 1.1). The data of these records were used in the 2008 Tonkin and Taylor report
which produced a shoreline retreat rate of 0.69m/year. Beach profile data is presented in Figures 2.7 and 2.8
of the Engineering Assessment Report.
2.2.3.3 Zorn Surveying Survey
A survey of the backshore and intertidal area was provided by Zorn Surveying for the project area. This data
was combined with the side scan sonar data and some extrapolation allowed for an accurate portrayal of the
beach and nearshore area. Figure 2.2 presents the various bathymetric data scatter sets. The red circled
area represents the nearshore extents of the Zorn Survey, the blue highlighted area is the extrapolated data
set, and the other scatter data represents the side scan sonar data.
Figure 2.2: Bathymetric Data Sets
2.3 Procured Information and Assumptions
2.3.1 Wave Data
Accurate wave data is one of the most important drivers of the coastal model. This is because the wave data
input directly influences the way that the sediment is forced to move in the model. MetOcean Solutions Ltd
keeps a SWAN wave hindcast model for all of New Zealand at a 0.005 degree resolution. The dataset spans
a timeframe of 37 years from January 1st 1979 to December 31st 2015. The advantage of using a large
dataset is that all significant events such as cyclones, storms, etc. will average out over time.
Regionally the wave climate within Hawkes Bay is influenced by Cape Kidnappers via wave sheltering.
According to the Metocean hindcast the mean significant wave height in the vicinity of Cape Kidnappers and
the Clifton area ranges between 1.00 to 1.25m and decreases to 0.75 to 1.00m north of the Tukituki River.
While it is expected that wave sheltering afforded by Cape Kidnappers is likely to influence the Clifton area,

Clifton Beach: Coastal Processes Assessment
Beca // 1 November 2017
3233367 // NZ1-14088674-29 0.29 // 8
due to the limited shoreline length of the study area the potential decrease in offshore wave energy
throughout the study area is considered negligible. Accordingly, the wave climate at the location 177.005E,
39.630S which has a seabed level of RL 5.9m and located approximately 1km offshore of the study area is
considered to the representative of the study area.
MetOcean Solutions Ltd provided Significant Wave Heights (Hs), wave periods, and mean wave directions at
3 hour intervals for the time frame. Hs and Peak Wave Period (Tp) wave roses for the 37 year dataset are
presented in Figures 2.3 and 2.4 respectively. From the wave rose, it is evident that the majority of the waves
come from the North Easterly direction in a very tight range between 50 and 65 degrees. The average Hs
and Tp over the data set is 0.67m and 10.4s respectively.
Figure 2.3: Wave Rose of Hindcast Wave Data at 177.005E, 39.630S, 5 degree bins, height in metres
Figure 2.4: Wave Rose of Hindcast Wave Data at 177.005E, 39.630S, 5 degree bins, period in seconds
Hs (m)
Tp (s)

Clifton Beach: Coastal Processes Assessment
Beca // 1 November 2017
3233367 // NZ1-14088674-29 0.29 // 9
2.3.2 Depth of Closure
Depth of closure is an important concept used in coastal engineering. It is a theoretical depth along a cross
shore beach profile where sediment transport is very small or non-existent. This depth varies dependent on
wave height wave period, and sediment grain size. Beaches with larger sediment sizes have smaller depths
of closure because larger sediment isn’t as easily influenced by wave action than smaller sediment. Since
Clifton beach is a gravel beach, its depth of closure is small due to the large sediment size. After calibration,
the depth of closure varied along the coastline, but in general the depth of closure used was RL 8.3 (1.7m
below MSL).

Clifton Beach: Coastal Processes Assessment
Beca // 1 November 2017
3233367 // NZ1-14088674-29 0.29 // 10
3 Modelling
3.1 Wave Modelling
The offshore bathymetry along the Clifton Beach shoreline is complex comprising of reefs and rock outcrops
which have a significant effect on wave transformation and the shoreline morphology. To resolve the
nearshore wave climate SWAN (Simulating WAves Nearshore) was employed to provide time series wave
data along the shoreline.
3.1.1 SWAN Wave Model Brief Description
SWAN (Simulating WAves Nearshore) is a 3rd generation spectral wave model for obtaining realistic
estimates of wave parameters in coastal areas, lakes, and estuaries from given wind, bottom, and current
conditions. The model is developed at Delft University of Technology.
For this project, SWAN was used to transform the wave data provided by MetOcean Solutions Ltd to the
closure depth (RL 8.3m).
3.1.2 SWAN Wave Modelling
The model domain and bathymetry is presented in Figure 3.1. A flexible mesh was compiled utilizing the
composite bathymetric dataset (refer to Figure 2.3). The Metocean Ltd time series dataset which consisted
of 3 hourly data from January 1st 1979 to December 31st 2015 was adopted on the seaward boundary.
Figure 3.1: SWAN Model Bathymetry, showing reef systems

Clifton Beach: Coastal Processes Assessment
Beca // 1 November 2017
3233367 // NZ1-14088674-29 0.29 // 11
The model was simulated in third generation non-stationary mode at a 3-hourly time steps allowing for the
following processes:
� Exponential wind growth (Komen, 1984)
� Quadruplets (Hasselmann et at., 1985)
� White capping (Komen, 1984)
� Triads (Eldeberky, 1996)
� Bottom friction (JONSWAP, 1973)
� Water level generated from Port of Napier tidal constituents
Time series data at approximately RL 8.0 was generated along the coastline for the full dataset (refer to
Figure 3.2 locations). The data was subsequently converted to a profile series for the use in Littoral
Processes FM.
Figure 3.2 SWAN Wave model output locations
3.2 Longshore Sediment Transport
3.2.1 Littoral Processes FM Brief Model Description
Littoral Processes FM (Flexible Mesh) was chosen for this study because of its ability to simulate non-
cohesive sediment transport, particularly for gravel beaches.
Littoral Processes FM is a modelling system published by the Danish Hydraulics Institute (DHI) that
simulates non-cohesive sediment transport along a quasi-stationary coastline. It is a powerful tool for
sediment budgets and simulating long term shoreline evolution.

Clifton Beach: Coastal Processes Assessment
Beca // 1 November 2017
3233367 // NZ1-14088674-29 0.29 // 12
Within Littoral Processes FM are four models. The transport in point model calculates non-cohesive
sediment transport in one or several points. The littoral drift model calculates the longshore transport for one
or several cross-shore profiles. The littoral drift table generation model uses similar methods to the littoral
drift model, but produces outputs which can be used in the coastline evolution model. Lastly, the coastline
evolution model calculates coastline movements with respect to a straight baseline. It has the ability to have
simulate various coastal structures such as revetments, offshore breakwaters, jetties, and groynes.
3.2.2 Littoral Processes FM Simulation Domain
For longshore sediment transport modelling it is important to extend the model past geomorphic features that
can affect or control the movement of sediment. Accordingly, a model was developed that extended 3.5 km
from the west of the Maraetotara River to east of the headland that accommodates Camp No. 1 (refer to
Figure 3.2). Figure 3.2 not only represents the model domain, but also depicts the model baseline in Red,
along with the cross shore profile.
For the model domain a grid resolution of 20 m was adopted, which was required to resolve the key
geomorphic controls and structures.
Figure 3.2: Simulation Domain with project Baseline and 5 Cross sections
3.2.3 Simulation Time Range
To provide for the most accurate results over time and most efficient use of the wave data set, the time
settings of the model were set to run from January 1st, 1979 through December 31st, 2015 in three hour time
step intervals.
3.2.4 Coastal Structure Locations
Figure 3.3 presents the extent and location of the existing (red) and proposed (cyan) revetments.

Clifton Beach: Coastal Processes Assessment
Beca // 1 November 2017
3233367 // NZ1-14088674-29 0.29 // 13
Figure 3.3: Hard point and Revetment Positions (red) and proposed revetment (cyan)
3.2.5 Sources and Sinks
3.2.5.1 Cape Kidnappers Erosion Source
Following Komar (2014) which estimated that erosion from Cape Kidnappers to the south of the project area
represents a sediment source coming from the east. In the Littoral Processes FM model, this sediment
source was included as 18,000 m3/year.
3.2.5.2 Maraetotara River
Te Awanga – Haumoana Coastal Erosion: Review and Recommendations is a report released in 2009 by
Environmental Management Services Ltd. which is available on the HBRC’s website. This report details the
various sediment inputs including the Maraetotara River. The report states that “[although] some gravel
deposits [exist] in deep water off the mouth of the Maraetotara RiverM their contribution to the beach, if any,
is unknown and assumed to be negligible.”. This statement is also reinforced in The Hawke’s Bay Littoral
Cells: Processes, Erosion Problems and Management Strategies which states that “with its small watershed
and discharges, the Maraetotara River reaching the shore at Te Awanga is considered to be insignificant”.
Hence, in the Littoral Processes FM model the Maraetotara River was not included as a sediment source.
3.3 Calibration and Simulations
3.3.1 Methods
The simulation set up discussed in Section 3.2 was run through the Littoral Processes FM model. The model
was initially set up to simulate what would happen if the revetment constructed in 2013 was not there. This
case was called the “no protection case” and was used to calibrate the model. After the model was
calibrated, two more cases were developed to compare the environmental effects of the proposed revetment
to the existing situation. These cases are discussed in more detail in Section 3.4.

Clifton Beach: Coastal Processes Assessment
Beca // 1 November 2017
3233367 // NZ1-14088674-29 0.29 // 14
3.3.2 Historical Retreat
Historical shoreline movement was assessed by comparison of historic aerial photography. Aerial
photographs from 1963, 1980 and 2009 were sourced and rectified to enable comparison. Vegetation lines
were digitized and used for comparison to obtain erosion/accretion rates. Figures 3.4 and 3.5 represent the
vegetation lines with different base photographs.
Measured shoreline movement and annual rates were calculated for simulation cells 39, 64, 76, 83, and 99
as shown in Figures 3.4 and 3.5 and are presented in Table 3.1.
Table 3.1: Shoreline Retreat Calibration Rates
Cell Measured 29 year Shoreline Retreat (m)
Retreat Rate (m/year)
Cell Description
39 4 0.13 About ½ km East from Maraetotara River
64 15 0.51 Outcrop point
76 20 0.69 HB1
83 15 0.51 Road Turnoff
99 15 0.51 Inside the Project Area
3.3.3 Scenarios
As part of the calibration and production process the following scenarios were simulated:
� Scenario 1 - No Protection Scenario: A simulation which excludes the existing 80m revetment installed in
2013, but includes a hard point to the east of Camp No.1 to simulate the existing protection and the cliff
line.
� Scenario 2 - Existing Condition Scenario: Same as Scenario 1 but includes the 80m revetment installed in
2013.
� Scenario 3 – Proposed Revetment Scenario: Same as Scenario 2 but includes the proposed revetment.
With these three runs, an accurate depiction of the coastal environment was modeled, and the results are
presented in Section 3.4.
3.3.4 Calibration
Shoreline retreat rates were calculated and compared to the target values as presented in Table 3.2. Unless
protected by a revetment, all of the measured cells exhibited shoreline retreat except for Cell 39 which
showed minor accretion. The model describes the annual rates well and replicates the larger scale
morphodynamics, particular with the salient feature adjacent cell 64.
Table 3.2: Shoreline Retreat and Target Shoreline Retreat Comparison
Case Cell 39 Cell 64 Cell 76 Cell 83 Cell 99
37 Year Shoreline Retreat Target Value 0.0m -19.1m -25.5m -19.1m -19.1m
No Protection Case +0.6m -21.1m -26.1m -21.4m -28.2m
Existing Conditions Case +0.6m -21.2m -25.7m -18.4m -7.2m
Proposed Case +0.6m -21.5m -24.5m 0m* 0m *
*Revetment holds shoreline in place

Clifton Beach: Coastal Processes Assessment
Beca // 1 November 2017
3233367 // NZ1-14088674-29 0.29 // 15
Figure 3.4: Historical shoreline movement – Base photograph 1963, 1980 vegetation line (green) and 2009 vegetation line (red)

Clifton Beach: Coastal Processes Assessment
Beca // 1 November 2017
3233367 // NZ1-14088674-29 0.29 // 16
Figure 3.5: Historical shoreline movement – Base photograph 2009, 1980 vegetation line (green) and 2009 vegetation line (red)

Clifton Beach: Coastal Processes Assessment
Beca // 1 November 2017
3233367 // NZ1-14088674-29 0.29 // 17
3.4 Results
3.4.1 Longshore Transport Statistics
The longshore transport rates in the study area vary depending on the location along the study area. With
each different location, the transport rates are influenced by the angle of the shoreline and the incident wave
angle. In areas with high oblique angles such as the shoreline adjacent to Camp No. 2 high sediment
transport rates are expected, whereas in areas where waves approach the coast close to the shoreline
normal transport rates are close to zero. Simulated annual gravel transport rates varied from 2000m3/year to
14,000m3/year in the westerly direction. Sediment transport rates in the vicinity of the proposed revetment
were calculated to be 11,000m3/year, markedly higher compared to down drift rates indicating an erosive
trend.
3.4.2 Scenario 1: No Protection Case
The shoreline retreat rates for this case were consistent with the measured aerial photo values with
negligible change west of the central salient and erosion rates of 0.70 m/year at HB1 (refer to Figure 3.8).
However, cell 99 (area of the proposed revetment) experienced approximately 9m of erosion more than the
observed. This translates to an enhanced retreat rate of 0.76m/year compared to a target retreat rate of
0.52m/year.
The rate of erosion adjacent to cell 99 is a function of the position of the eastern geomorphic control point. In
this simulation the control point is the hard lined tip of the Camp No.1 headland. It was assumed that no
coastal protection structures were implemented fronting Camp No. 1 and that the back shore are was fully
erodible. The results show that without the ad hoc erosion protection measures fronting Camp No.1 the
camp ground is particularly susceptible to erosion. Furthermore, the downstream effects of an eroding
shoreline are likely to result in increased erosion rates through to the central salient as the shoreline
continues to establish equilibrium.
3.4.3 Scenario 2: Existing Conditions Case
The shoreline retreat rates for this case were consistent with the measured aerial photos with negligible
change west of the central salient and erosion rates of 0.68 m/year at HB1 (refer to Figure 3.9). The results
show that the erosion rates down drift of the revetment constructed in 2013 have decreased compared to
Scenario 1. The decreased erosion rate is attributed to the revetment providing a fixed control point which
terminates at a point where the shoreline angle relative to the incident wave angle is less oblique than that
directly to its east, leading to lower transport rates.
Typically, revetments cause a local down drift erosional effect, however simulating revetment’s effects were
beyond the capabilities of the model. It is expected that the shoreline retreat rates would be higher if local
down drift effects were included in the model.
3.4.4 Scenario 3: Proposed Case
This simulation includes the proposed 400m revetment extension (refer to Figures 3.10 and 3.11). The
revetment extension holds the shoreline in place at cells 83 and 99, so no shoreline retreat was simulated at
these locations. Cell 76, representing HB1, approximately 200m down drift of the proposed revetment has
similar retreat rates to the existing Scenario 1 and 2 with shoreline retreat of 0.67m/year. Decadal changes
to erosion rates are presented in Table 3.3 for HB1. The results show that while the proposed revetment
protects Clifton Road the shoreline adjacent to Camp No. 2 is likely to continue to erode. While the rate of
change is low, the introduction of the revetment is expected to increase erosion at the northern end of the

Clifton Beach: Coastal Processes Assessment
Beca // 1 November 2017
3233367 // NZ1-14088674-29 0.29 // 18
revetment in the short term and revert to erosion rates consistent with the historical observations in the
medium term (20 to 30 years).
Table 3.3 – Decadal changes to average erosion rates at HB1
Existing Conditions (m/year) Proposed Case (m/year)
10 years 0.67 0.97
20 years 0.71 0.79
30 years 0.68 0.67
3.5 Discussion
The longshore sediment transport modelling has demonstrated that the erosion potential of the Camp No.1
headland is high and the erosion potential decreases to the west as the shore normal becomes more
perpendicular to the incident wave direction.
The geomorphic controls of the Camp No.1 headland, the central offshore reef west of Camp No.2 and the
Maraetotara River are the main features that control shoreline evolution. The results show that the central
salient feature in the lee of the offshore reef acts as the western control for the shoreline to the east
extending to Camp No.1. Accordingly, the headland and the 2013 revetment acts as the western control.
The modelling has shown that the implementation of the 2013 revetment transferred the control point
eastwards to a location where the sediment transport potential is lower. Accordingly, this reduced the
erosion potential in the area of the proposed revetment. The results have shown that the do nothing
scenario will result in continued erosion of the shoreline fronting Clifton Road, albeit at a slightly lower rate
(0.2m/year compared to 0.5m/year).
Extending the revetment eastwards further moves the eastern shoreline control point to a location on the
shoreline where the shore normal is more aligned to the incident wave direction. Accordingly, the shoreline
in this location adopts a crenulate shape with the down drift control being the central salient. As shown in the
modelling the shoreline immediately west of the revetment has an initial higher erosion rate compared to
existing in the first decade as the shoreline attempts to establish equilibrium and reverts to erosion rates
consistent with historical measurements thereafter. The increased erosion rate is expected to decrease over
time as the shoreline approaches equilibrium. Furthermore, local lee side erosion effects from the
revetment, which are not resolved in the modelling, are likely to locally exacerbate erosion at the terminal
end of the revetment.
Observed long term erosion rates have included effects from sea level rise. Potential future shoreline retreat
has been assessed by T&T (2004) to be 6.4m and 9.6m by 2060 and 2100 respectively. This translates to
an erosion rate of approximately 0.1m/year. In order to quantify the potential wave energy effects from sea
level rise over the expected lifetime of the revetment (30 years) the SWAN model was rerun over a 3 year
period assuming a 0.15m and 0.30m increase in water level. The results in the form of Wave Energy Flux
which is often taken a being directly proportional to sediment transport potential and Hs exceedance are
presented in Figures 3.6 and 3.7 for SWAN model output point 20 (Refer to Figure 3.2).
The wave energy flux calculated at the approximate closure depth increases by 4% and 8% for sea level
increases of 0.15m and 0.30m respectively. These increases are proportional to sea level increase with
lower sea level rises resulting in lower fluxes (and vice versa). In comparison Hs is less affected with P50%
and P90% increases over the 30 year timeframe (0.30 m SLR) of approximately 2% (0.02m).

Clifton Beach: Coastal Processes Assessment
Beca // 1 November 2017
3233367 // NZ1-14088674-29 0.29 // 19
Figure 3.6 – Wave Energy Flux Exceedance at SWAN model output Pt 20
Figure 3.7 – Hs Exceedance at SWAN model output Pt 20
The implementation of the revetment is not expected to modify the expected trends of shoreline retreat apart
from holding the line in the vicinity of the revetment. It is noted that the revetment will reduce the amount of
sediment that can be utilized for the surrounding shoreline to establish equilibrium as sea levels increase. It
is estimated that the likely reduction is in the order of 500 to 1000m3 per year which is approximately 5% of
the net regional input to the Clifton sediment cell.

Clifton Beach: Coastal Processes Assessment
Beca // 1 November 2017
3233367 // NZ1-14088674-29 0.29 // 20
Figure 3.8: Coastline Evolution, No Protection Case (Scenario 1)

Clifton Beach: Coastal Processes Assessment
Beca // 1 November 2017
3233367 // NZ1-14088674-29 0.29 // 21
Figure 3.9: Coastline Evolution, Existing Conditions Case (Scenario 2)

Clifton Beach: Coastal Processes Assessment
Beca // 1 November 2017
3233367 // NZ1-14088674-29 0.29 // 22
Figure 3.10: Coastline Evolution, Proposed Conditions Case (Scenario 3)
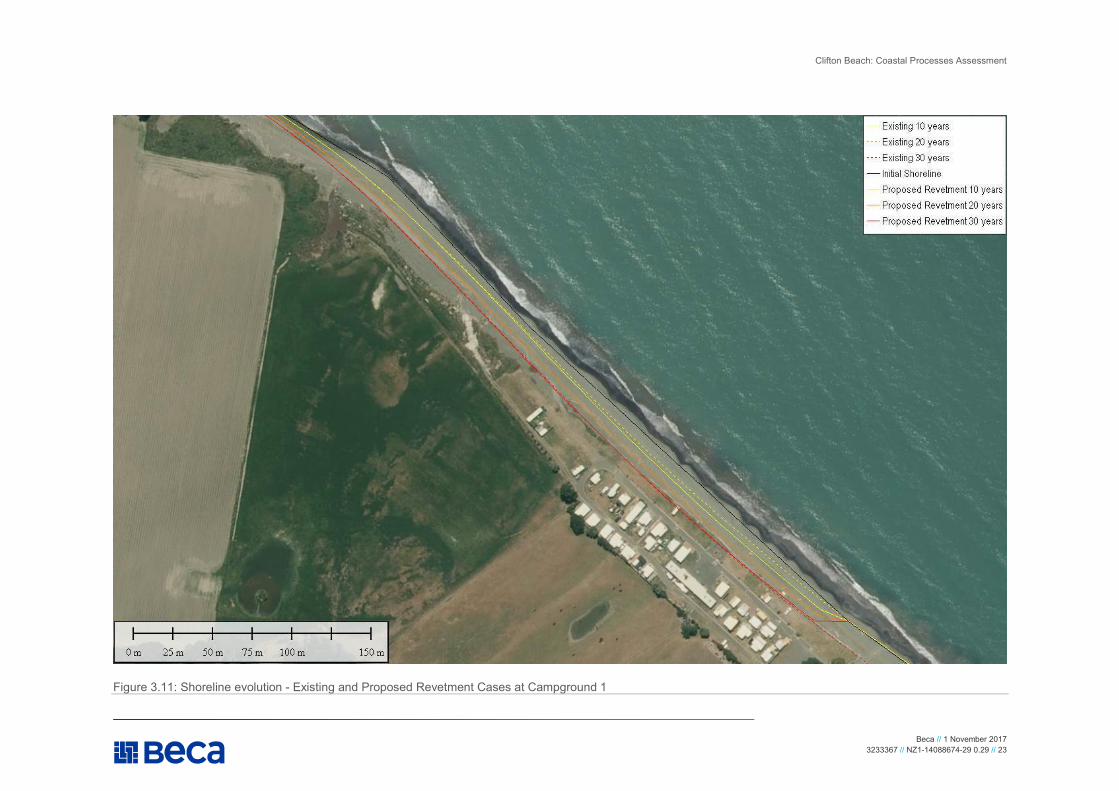
Clifton Beach: Coastal Processes Assessment
Beca // 1 November 2017
3233367 // NZ1-14088674-29 0.29 // 23
Figure 3.11: Shoreline evolution - Existing and Proposed Revetment Cases at Campground 1

Clifton Beach: Coastal Processes Assessment
Beca // 1 November 2017
3233367 // NZ1-14088674-29 0.29 // page 24
4 Conclusions
The results of the numerical modelling have shown the following:
� The wave climate along the Clifton Beach is complex due to offshore reefs which result in varying incident
wave angles which in turn dictates longshore sediment transport rates.
� Shoreline evolution is strongly dependent on reefs and outcrops at the mouth of the Maraetoetara River,
north of Camp No. 2 (Cell 64) and the hard edged headland that includes Camp No. 1.
� The shoreline fronting Clifton Road has high erosion potential as the shoreline continues to adjust to the
incident wave climate. The existing revetments have formed control points which has compartmentalised
the shoreline erosion and resulted in down drift erosion.
� While the proposed revetment protects Clifton Road the shoreline adjacent to Camp No. 2 is likely to
continue to erode. While the rate of change is low, the introduction of the revetment is expected to
increase erosion at the northern end of the revetment in the short term and revert to erosion rates
consistent with the historical observations in the medium term (20 to 30 years).
� The modelling indicates that the proposed revetment is not likely to influence the shoreline north of Cell
64, which is controlled by an offshore reef.
� Modelling is not capable of depicting any local down drift erosion, a regular feature on the leeward side of
the revetment. However, it must be assumed that this feature will occur.
� The revetment will not influence the effects of future sea level rise on down drift coastlines.