1 MCR-ALS analysis using initial estimate of concentration profile by EFA.
85
1 MCR-ALS analysis using initial estimate of concentration profile by EFA
-
date post
21-Dec-2015 -
Category
Documents
-
view
218 -
download
2
Transcript of 1 MCR-ALS analysis using initial estimate of concentration profile by EFA.

1
MCR-ALS analysis using initial estimate of concentration profile by
EFA

2

3

4

5

6

7

8

9

10
Deducing Chemical Rank(Factor Analysis)
• Scree plot
• Indicator function
• Loading plot
• Eigen-value ratio
• …

11

12

13

14
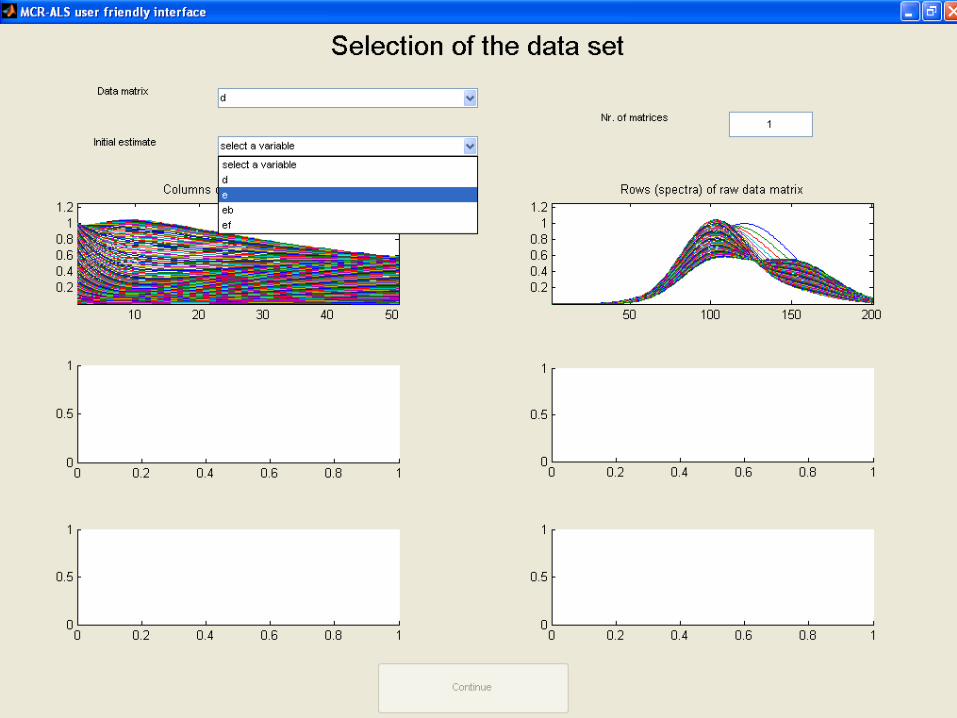
Calculating Initial estimate by EFA

15

16

17
18

19
20

21

22

23

24

25

26
1.2

27
1.2
28
1.2

29
1.2

30
1.2

31

32

33

34

35

36
Source of differences?
Rotational ambiguityPCA: D=TPBeer-Lambert: D=CSIn MCR we want to reach from PCA to Beer-Lambert
• D= TP = TRR-1P, R: rotation matrix• D = (TR)(R-1P)• C=TR, S=R-1P• (R2)(0.5R-1) = RR-1

37
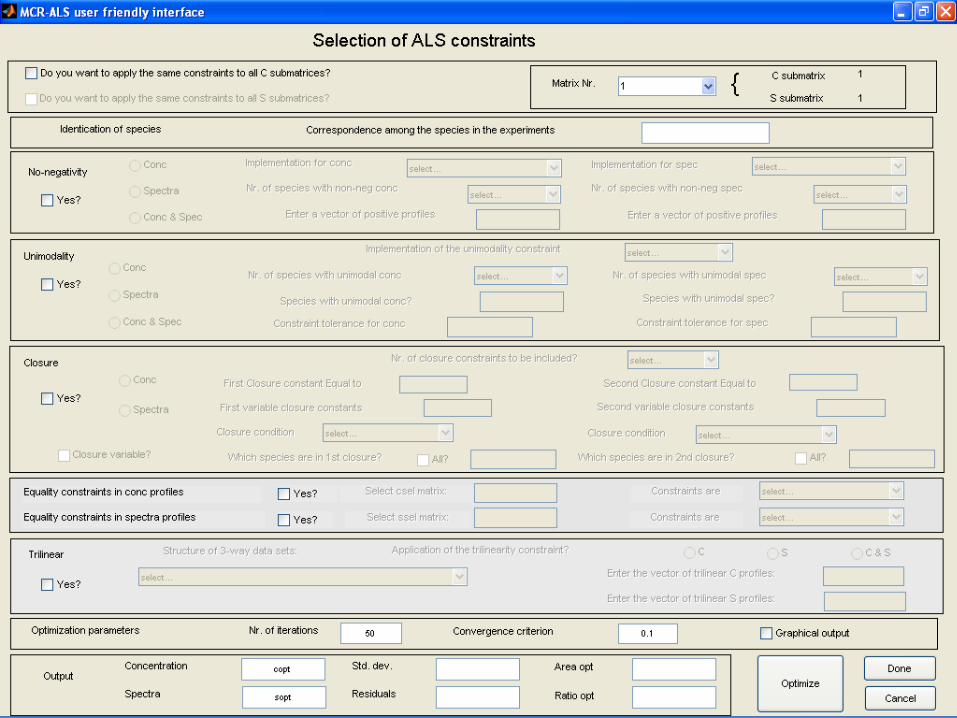
How can we overcome this problem?
More extra constraints:
1. Selectivity
2. Peak Shape
3. Matrix augmentation
4. Combined hard model

38
Implementation of selectivity in pure spectra
• If we know the pure spectrum of the reactant
39

40
1.2
41

42
43

44
Implementation of selectivity in concentration profile
• At the beginning of reaction only reactant is existed and the other species are absent

45

46
1.2

47

48

49
Two other experiments

50
Next step?

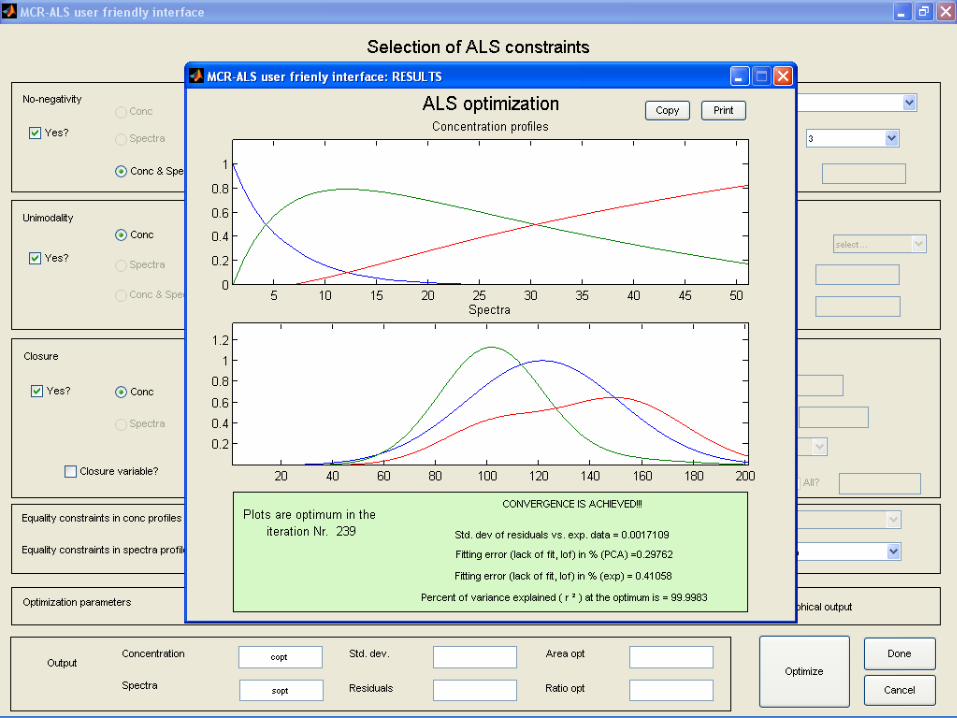
51
Matrix augmentation
• 3 kinetic experiments
• run at three different experimental conditions
• D1
• D2
• D3

52
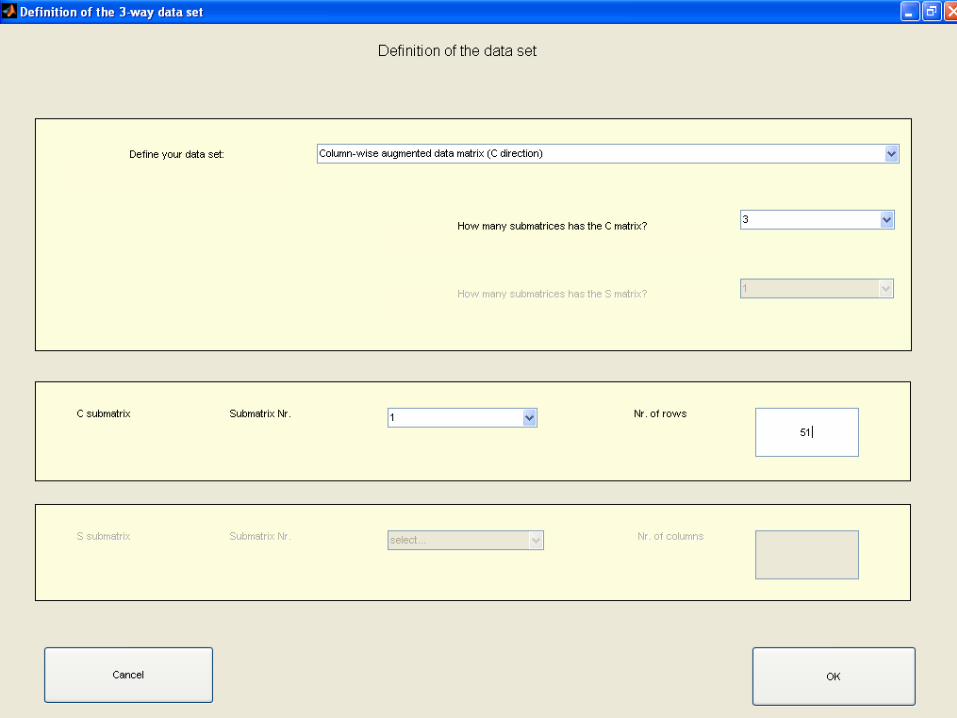
Steps for column-wise data augmentation
• 1. calculate initial estimate of concentration for each data set
• [e1,ef1,ef2]=efa(d1);• [e2,ef2,ef2]=efa(d2);• [e3,ef3,ef3]=efa(d3);
• 2. produce a matrix of initial estimate• e=[e1;e2;e3];
• 3. collect all data matrices in a single matrix• d=[d1;d2;d3];

53

54

55

56

57

58
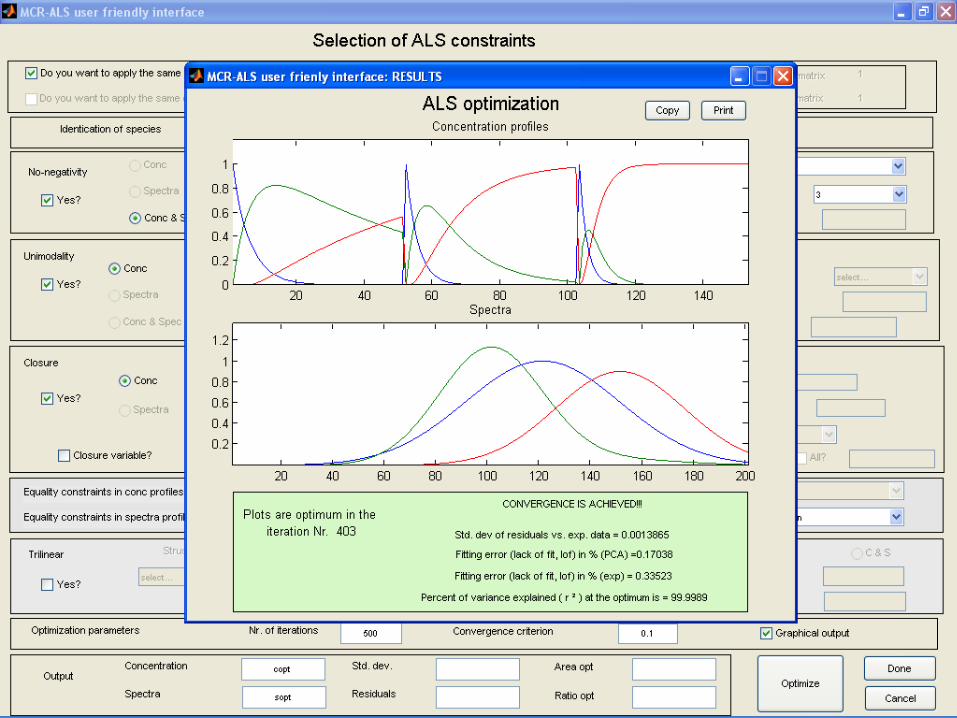
Analysis of a single data matrix Analysis of augmented data matrices

59

60

61

62
63

64
65

66
67

68

69
70

71
Original Values: k1=0.2 k2=0.02
Original Calculated
k1 k2 k1 k2
R1 0.20 0.02 0.22 0.017
R2 0.30 0.08 0.31 0.072
R3 0.45 0.32 0.45 0.29
72
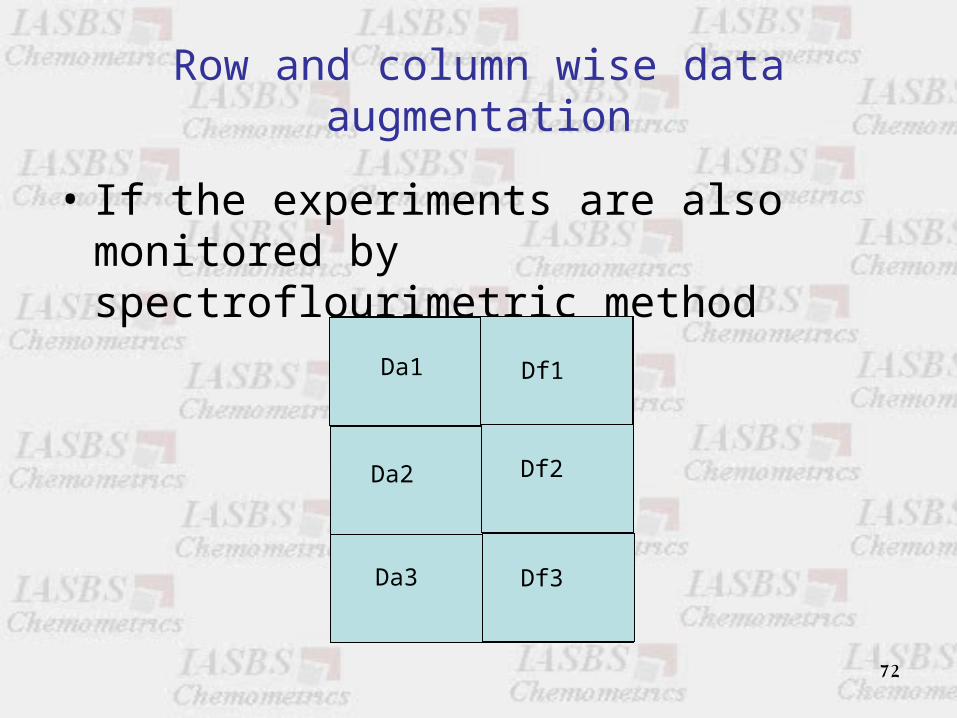
Row and column wise data augmentation
• If the experiments are also monitored by spectroflourimetric method
Da1
Da2
Da3
Df1
Df2
Df3

73

74

75

76

77

78

79

80

81
82

83

84

85