1 E nvironmental consequences of combustion processes – Part II (Global Warming) Dr. Hassan Arafat...
31
1 Environmental consequences of combustion processes – Part II (Global Warming) Dr. Hassan Arafat Department of Chem. Eng. An-Najah University (these slides were adopted, with modification, from Ms. Paulina Bohdanowicz , KTH Institute, Sweden) CHAPTER # 4 CHAPTER # 4
-
Upload
osborne-oneal -
Category
Documents
-
view
216 -
download
0
Transcript of 1 E nvironmental consequences of combustion processes – Part II (Global Warming) Dr. Hassan Arafat...

1
Environmental consequences of combustion processes – Part II
(Global Warming)
Dr. Hassan ArafatDepartment of Chem. Eng.
An-Najah University
(these slides were adopted, with modification, from Ms. Paulina Bohdanowicz , KTH Institute, Sweden)
CHAPTER # 4CHAPTER # 4

2
What is a Green House?
Greenhouses are much warmer inside than the air is outside because the glass is transparent to light and allows short-wavelength light to pass through and heat the contents of the greenhouse. It also reflects back the longer wavelength heat radiating within the greenhouse, thus preventing if from passing back out.

3
Greenhouse Effect In A Greenhouse

4
What is Green House Effect?
• In a glass greenhouse, heat builds up and gets trapped due to presence of carbon dioxide and other heat trapping gases in the upper atmosphere.
• CO2 is analogous to glass.• Earth’s surface analogous to floor
which radiates back absorbed energy as longer wave infrared heat.

5
The greenhouse effect
Atmosphere
Greenhouse gases
Long wave heat radiation
Short wave radiation
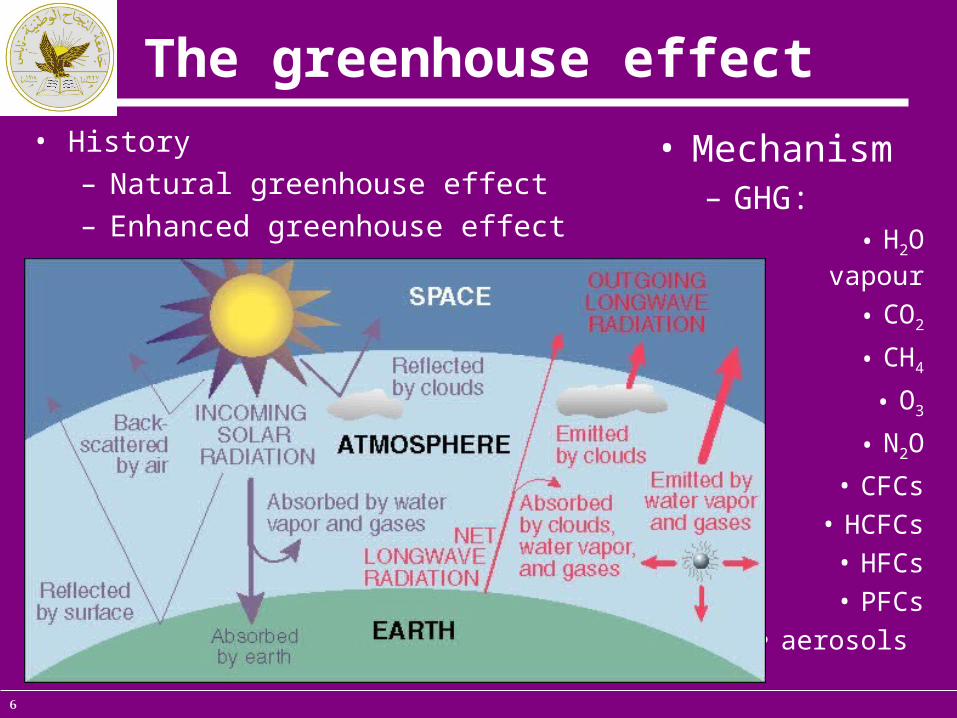
6
The greenhouse effect• History
– Natural greenhouse effect– Enhanced greenhouse effect
• Mechanism– GHG:
• H2O vapour
• CO2
• CH4
• O3
• N2O
• CFCs• HCFCs
• HFCs• PFCs
• aerosols

7
Green House Effect
• Does Greenhouse effect cause warming of the earth’s surface?
•YES!, for without a greenhouse effect due to gases in the atmosphere, the average temperature of the earth’s surface would be 00F.
•Earth’s surface temperature is about 600F due to greenhouse effect.

8
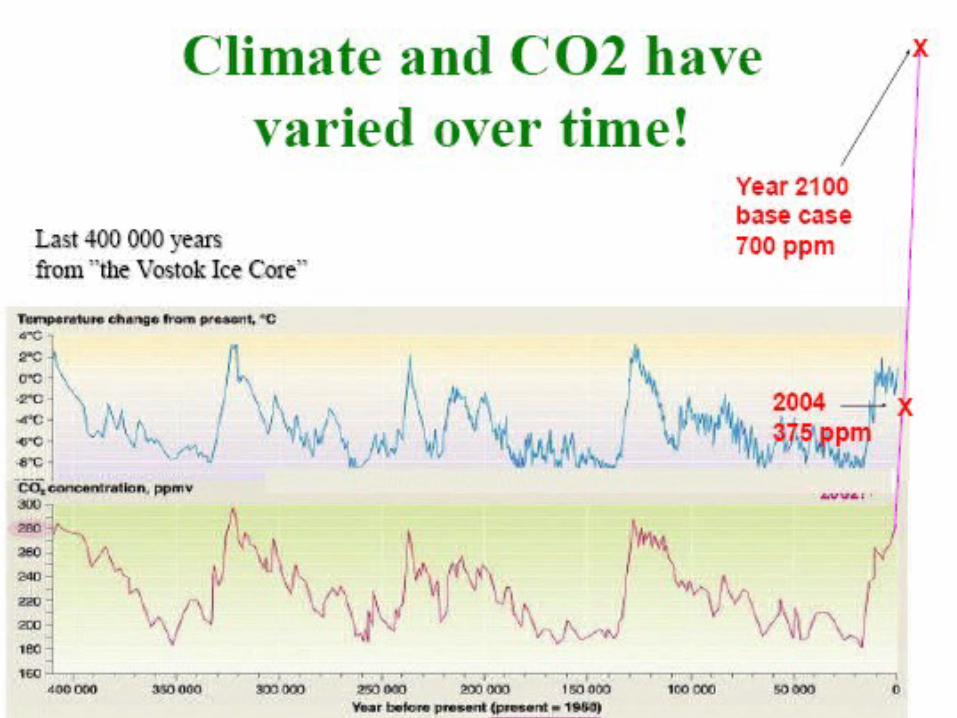
Global Warming
• Pollutants from a small area can accumulate and spread in the upper atmosphere and affect entire earth’s weather
• increase in CO2 is resulting in increase of earth’s temperature
• can result in melting of ice caps, coastal flooding, shift in weather patterns, etc.

9
Greenhouse Gases
Gas SourcesAbsorption range,
m
Residence
time,year
RIRF GWPContribution to
rel. GWP
H2O vapour
Natural processes
2.5-3.5, 5-7, > 13
CO2
(365ppmv)
Natural processes HC combustion
4-4.5, 14-19 (15-16)
50-200 1 1 57-60 %
CH4
(1.77ppmv)
Organic Matter decayHC combustionNatural processes(Ice deposits)
3-4, 7-8.5 12 43 21 12-20%
O3 Natural processes 9-10
N2O (312 ppbv)
Microbial processesAgriculture Waste and sewage dumpsHC combustion
3-5, 7.5-9
120 250 310 6%
CFCs & HCFCs (1-2ppbv)
Only anthropogenic 8-12 60-
1000015000-19000
1000-1000
0
14-25%

10
Atmospheric CO2
Figure 3.6 Change in atmospheric carbon dioxide at Mauna Loa Observatory,Hawaii. (Source: White, 1990)

11
Global Carbon Emissions from Fossil Fuel Burning, 1751-2002
0
2,000
4,000
6,000
8,000
1751 1801 1851 1901 1951 2001Source: ORNL, BP
Mill
ion
Ton
s
Carbon data include only fossil fuel related emissions. They exclude emissions from cement manufacture.
12
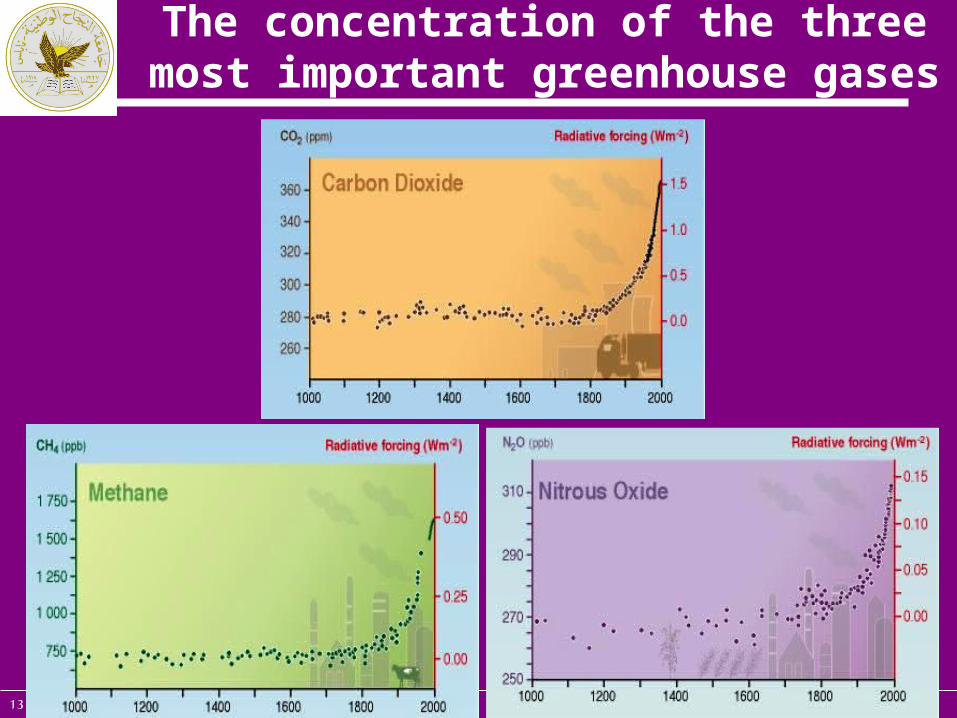
13
The concentration of the three most important greenhouse
gases

14
Effects of Major Greenhouse Gases on Global Warming
Percent contributionGas to global warming
Carbon dioxide 57
Chlorofluorocarbons 25
Methane 12
Nitrous oxides 6

15
Contribution of CO2 Toward Global Warming
Activity Percent contribution
Energy use 49
Industrial processes 24
Deforestation 14
Agriculture 13
16
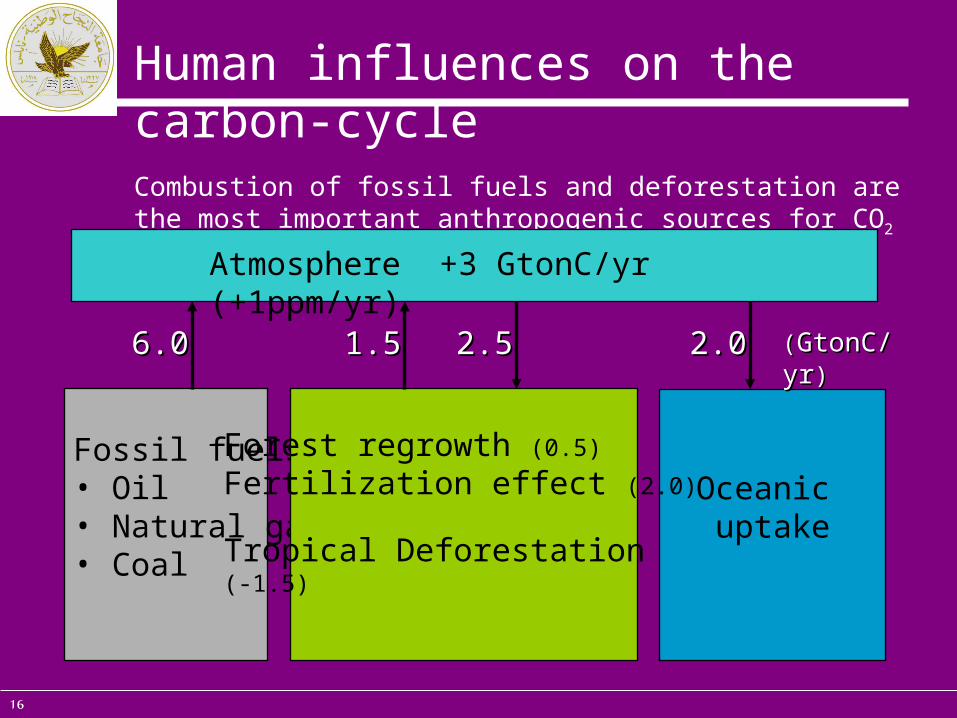
Human influences on the carbon-cycleCombustion of fossil fuels and deforestation are the most important anthropogenic sources for CO2 emissions to the atmosphere
Fossil fuels• Oil• Natural gas• Coal
Oceanic uptake
Forest regrowth (0.5)
Fertilization effect (2.0)
Tropical Deforestation (-1.5)
6.06.0 1.51.5 2.52.5 2.02.0
Atmosphere +3 GtonC/yr (+1ppm/yr)
((GtonC/yrGtonC/yr))

17
Carbon Emissions Per Person in Selected Countries, 2002
0
2
4
6
Sources: ORNL, BP, IEA, DOE, LBL, IGU, Census Bureau
Ton
s of
C
arb
on
18
-
1.00
2.00
3.00
4.00
5.00
6.00
0 1,000 2,000 3,000 4,000 5,000 6,000
Population (million)
Em
iss
ion
s (
ton
car
bo
n p
er
cap
ita)
USA
Canada, Australia, New Zealand
Japan
OECD Europe
Russia
Other Europe
China
Middle East
IndiaOther Asia Africa
Latin America
World Average
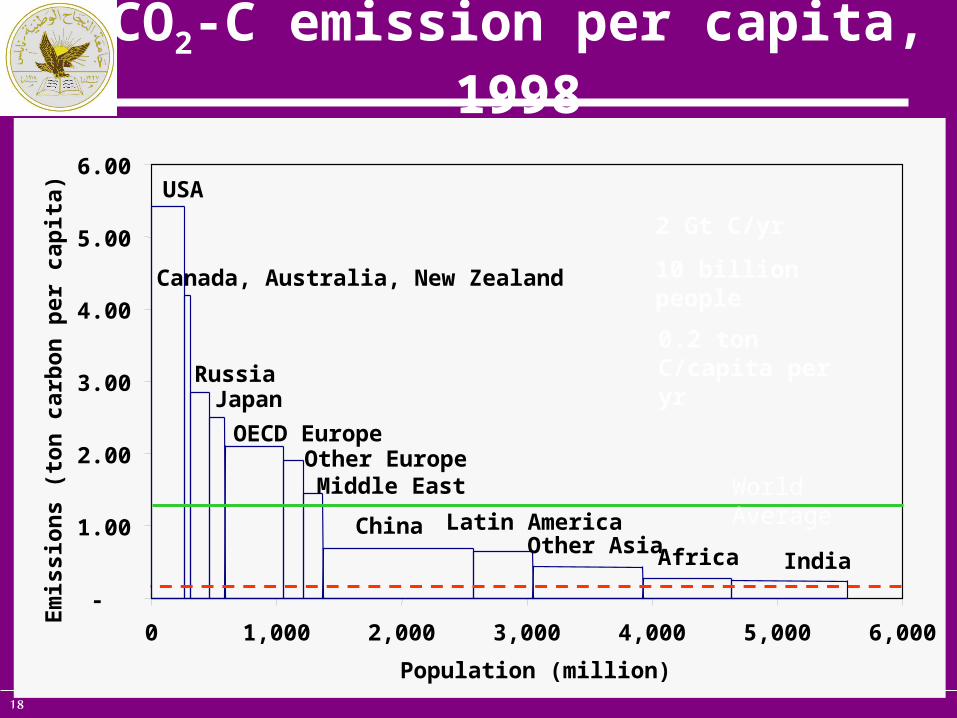
CO2-C emission per capita, 1998
2 Gt C/yr
10 billion people
0.2 ton C/capita per yr

19
Annual precipitation pattern has changed
Source: www.ipcc.ch
20
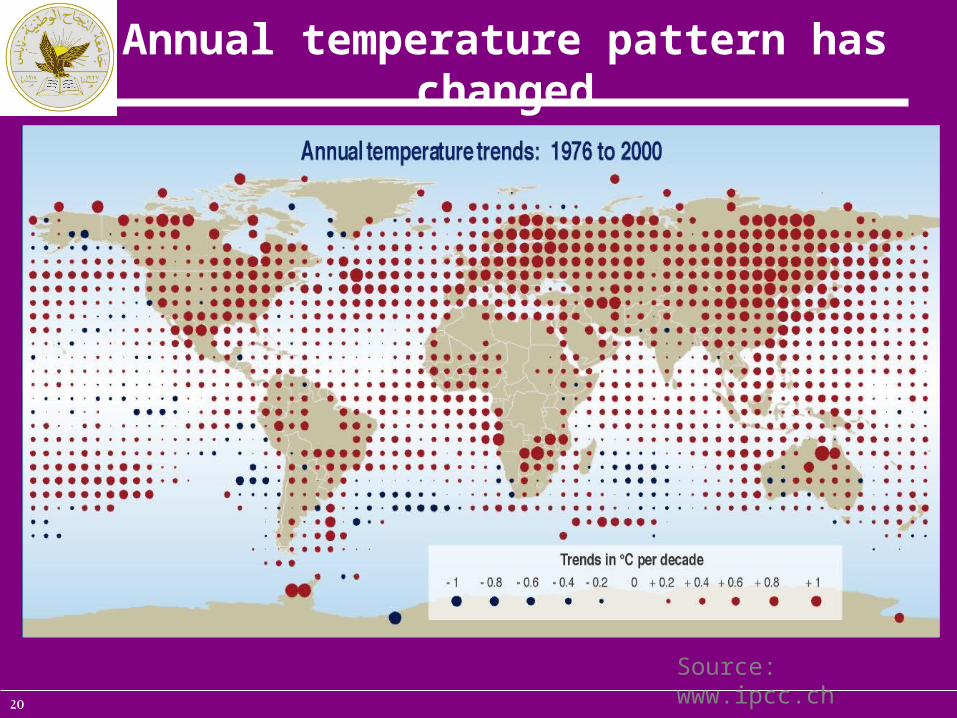
Annual temperature pattern has changed
Source: www.ipcc.ch

21
Global warming
• Consequences of increased CO2 levels– Enhanced
photosynthesis & plant growth
– Increased plant water use efficiency
– Reduction of susceptibility to several environmental stresses
– Increase in biodiversity
– Increase in acidity of oceans
• Consequences of global warming– Melting of ice caps– Increase in ocean levels– Coral bleaching– More severe weather
conditions– Plant life – loss of
biodiversity– Gulf Stream?– Global warming kills
about 160,000 people through its effects every year
22
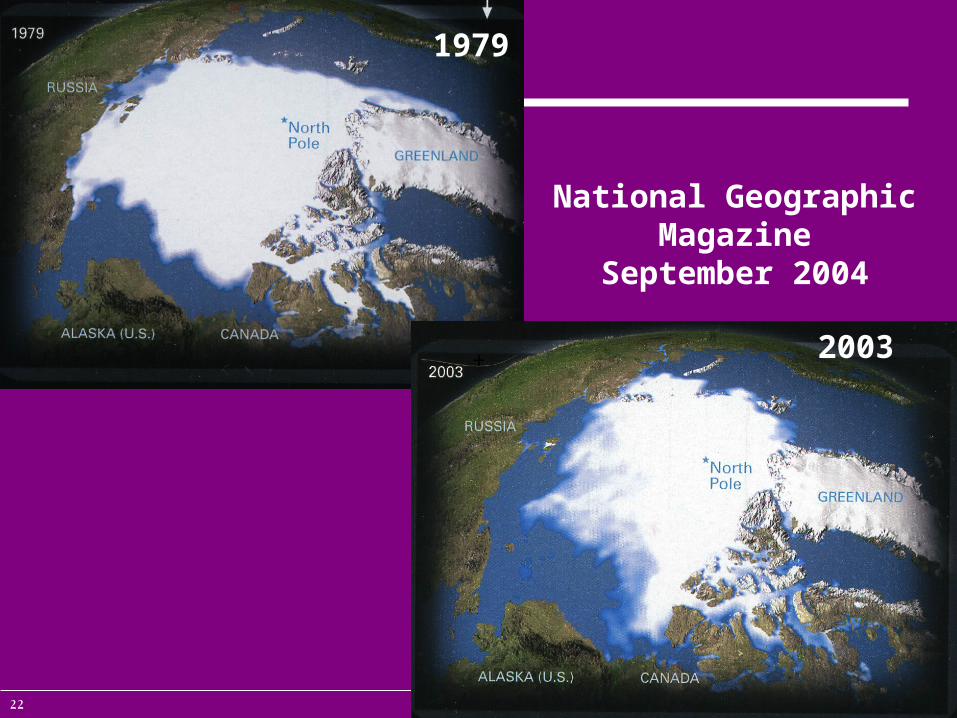
1979
2003
National Geographic Magazine
September 2004
+
23
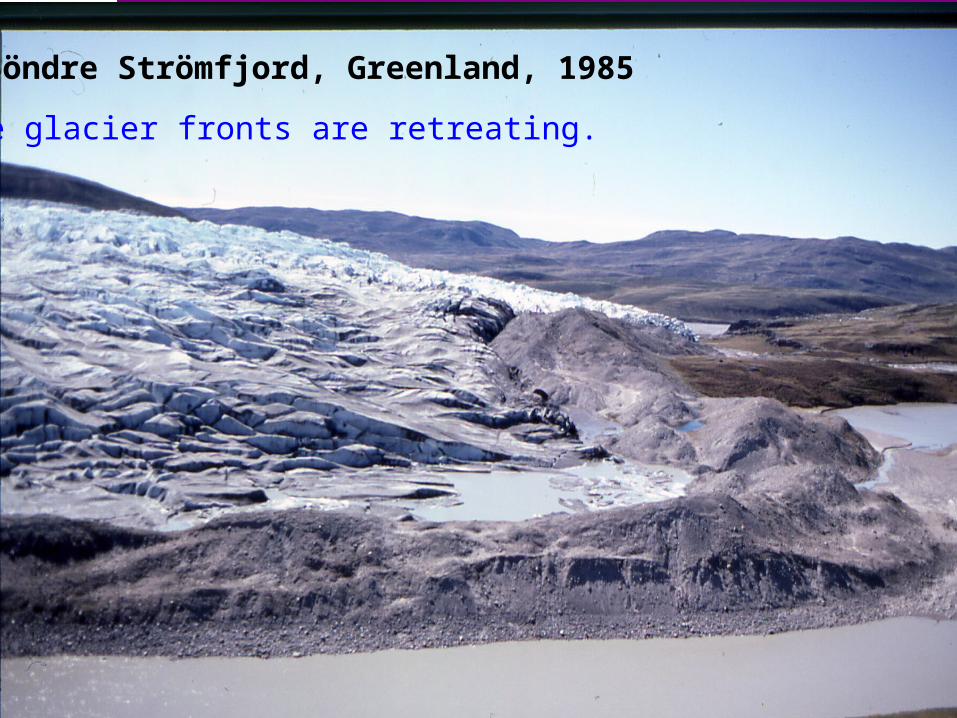
Söndre Strömfjord, Greenland, 1985
The glacier fronts are retreating.

24
Melting glaciers

25
Number and Cost of Weather-Related Disasters, 1980-2003
0
30
60
90
120
1980 1985 1990 1995 2000
Source: Munich Re
Billio
n Do
llars
(2
002
Dolla
rs)
0
200
400
600
800Num
ber of Events
Economic Losses
Disasters

26Vogel, G.: Science 297, Aug. 23 2002 Scott, R.C. 1996

27
Weather-related disasters

28
Weather-related disasters

29
What Can We Do?
• Reduce World’s Population? • Reduce or maintain current levels
of CO2 in the atmosphereR ed u c tion in C arb on D ioxid e
in c reas in g th e rem ova l o fa tm osp h eric ca rb on d ioxid e b y p lan ts
red u c in g carb on d ioxid eem iss ion s in to th e en viron m en t
R ed u c tion incarb on d ioxid e
30
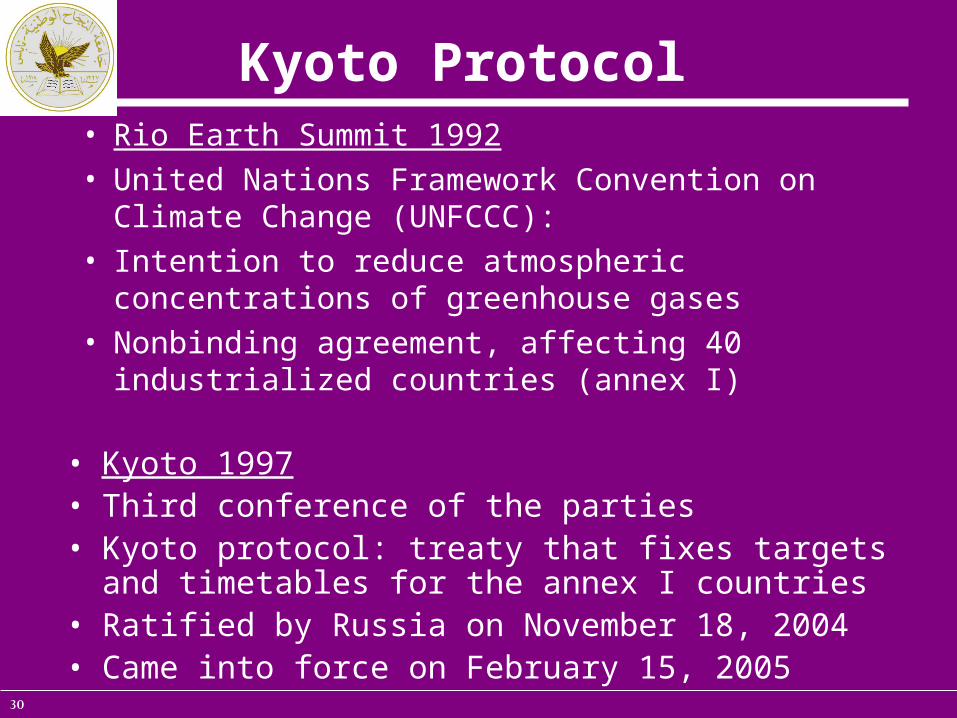
Kyoto Protocol• Rio Earth Summit 1992• United Nations Framework Convention on
Climate Change (UNFCCC):• Intention to reduce atmospheric concentrations
of greenhouse gases• Nonbinding agreement, affecting 40
industrialized countries (annex I)
• Kyoto 1997• Third conference of the parties• Kyoto protocol: treaty that fixes targets and
timetables for the annex I countries• Ratified by Russia on November 18, 2004 • Came into force on February 15, 2005

31
Present status of the USA
• Responsible for 25% of CO2 emissions• Did not ratify the Kyoto Protocol• Calling for a further involvement of developing
countries, in particular China and India• ”Economy would be affected too much” &
”American lif style is not a point of discussion”• Kyoto Protocol is ”fatally flaved”• Aim to stabilize emissions• In 2002 left the international negotiations• Measures on state level• 12% increase between 1990 and 2001