Solid acid mediated hydrolysis of biomass for producing biofuels

21
SOLID BIOMASS BAROMETER – EUROBSERV’ER – DECEMBER 2016 SOLID BIOMASS BAROMETER – EUROBSERV’ER – DECEMBER 2016
soli
d b
iom
ass
ba
ro
met
er
soli
d b
iom
ass
ba
ro
met
er
A study carried out by EurObserv’ER.
89.5 MtoePrimary energy production from solid biomass
in the EU in 2015
93.8 MtoeGross inland consumption from solid biomass
in the EU in 2015
+6.7%the growth of electricity from solid biomass
in the UE between 2014 and 2015
SOLID BIOMASSBAROMETER
Ba
den
ova
AG
& C
o K
G
Solid biomass consumption, primarily wood energy, is still largely governed by heating requirements which are climate-dependent. The main factor
for the European rebound in solid biomass consumption as primary energy during the winter of 2015 is that it was not as mild across the continent as the previous winter. Leaving aside climatic variations, the use of solid biomass for producing heat or electricity has tended to increase in the European Union, spurred on by European support policies. A new consumption record of 93.8 Mtoe was posted in 2015… a rise of 3.8 Mtoe over 2014.
Woodfuel grapple in the biomass heating plant in the Vauban area in Fribourg, Germany
43
soli
d b
iom
ass
ba
ro
met
er
soli
d b
iom
ass
ba
ro
met
er
SOLID BIOMASS BAROMETER – EUROBSERV’ER – DECEMBER 2016 SOLID BIOMASS BAROMETER – EUROBSERV’ER – DECEMBER 2016
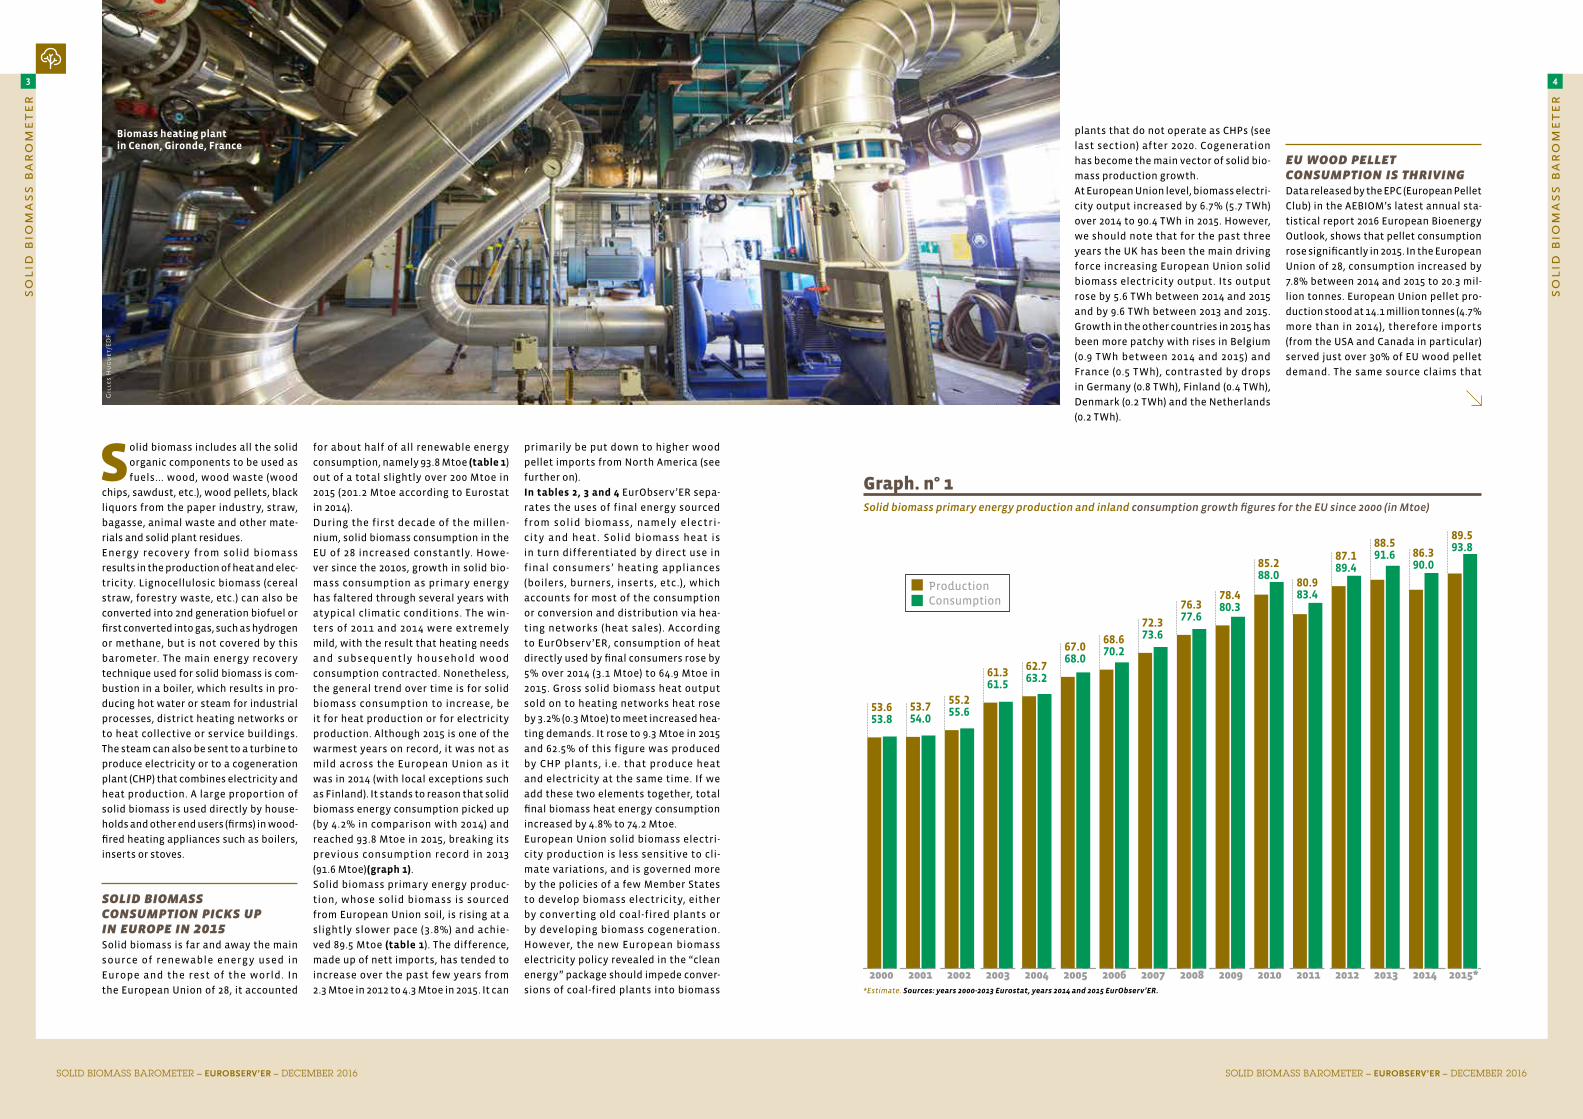
Graph. n° 1Solid biomass primary energy production and inland consumption growth figures for the EU since 2000 (in Mtoe)
*Estimate. Sources: years 2000-2013 Eurostat, years 2014 and 2015 EurObserv’ER.
2000 2001 2002 2003 2004 2005 2006 2007 2008 2009 2010 2011 2012 2013 2014 2015*
53.653.8
53.754.0
55.255.6
61.361.5
62.763.2
67.068.0
68.670.2
72.373.6
76.377.6
78.480.3
85.288.0
80.983.4
87.189.4
88.591.6 86.3
90.0
89.593.8
ProductionConsumption
Solid biomass includes all the solid
organic components to be used as
fuels... wood, wood waste (wood
chips, sawdust, etc.), wood pellets, black
liquors from the paper industry, straw,
bagasse, animal waste and other mate-
rials and solid plant residues.
Energy recover y from solid biomass
results in the production of heat and elec-
tricity. Lignocellulosic biomass (cereal
straw, forestry waste, etc.) can also be
converted into 2nd generation biofuel or
first converted into gas, such as hydrogen
or methane, but is not covered by this
barometer. The main energy recovery
technique used for solid biomass is com-
bustion in a boiler, which results in pro-
ducing hot water or steam for industrial
processes, district heating networks or
to heat collective or service buildings.
The steam can also be sent to a turbine to
produce electricity or to a cogeneration
plant (CHP) that combines electricity and
heat production. A large proportion of
solid biomass is used directly by house-
holds and other end users (firms) in wood-
fired heating appliances such as boilers,
inserts or stoves.
Solid biomaSS conSumption pickS up in EuropE in 2015Solid biomass is far and away the main
source of renewable energ y used in
Europe and the rest of the world. In
the European Union of 28, it accounted
plants that do not operate as CHPs (see
last section) after 2020. Cogeneration
has become the main vector of solid bio-
mass production growth.
At European Union level, biomass electri-
city output increased by 6.7% (5.7 TWh)
over 2014 to 90.4 TWh in 2015. However,
we should note that for the past three
years the UK has been the main driving
force increasing European Union solid
biomass electricity output. Its output
rose by 5.6 TWh between 2014 and 2015
and by 9.6 TWh between 2013 and 2015.
Growth in the other countries in 2015 has
been more patchy with rises in Belgium
(0.9 TWh between 2014 and 2015) and
France (0.5 TWh), contrasted by drops
in Germany (0.8 TWh), Finland (0.4 TWh),
Denmark (0.2 TWh) and the Netherlands
(0.2 TWh).
Eu wood pEllEt conSumption iS thriving Data released by the EPC (European Pellet
Club) in the AEBIOM’s latest annual sta-
tistical report 2016 European Bioenergy
Outlook, shows that pellet consumption
rose significantly in 2015. In the European
Union of 28, consumption increased by
7.8% between 2014 and 2015 to 20.3 mil-
lion tonnes. European Union pellet pro-
duction stood at 14.1 million tonnes (4.7%
more than in 2014), therefore imports
(from the USA and Canada in particular)
served just over 30% of EU wood pellet
demand. The same source claims that
Légende
for about half of all renewable energy
consumption, namely 93.8 Mtoe (table 1)
out of a total slightly over 200 Mtoe in
2015 (201.2 Mtoe according to Eurostat
in 2014).
During the first decade of the millen-
nium, solid biomass consumption in the
EU of 28 increased constantly. Howe-
ver since the 2010s, growth in solid bio-
mass consumption as primary energy
has faltered through several years with
atypical climatic conditions. The win-
ters of 2011 and 2014 were extremely
mild, with the result that heating needs
and subsequently household wood
consumption contracted. Nonetheless,
the general trend over time is for solid
biomass consumption to increase, be
it for heat production or for electricity
production. Although 2015 is one of the
warmest years on record, it was not as
mild across the European Union as it
was in 2014 (with local exceptions such
as Finland). It stands to reason that solid
biomass energy consumption picked up
(by 4.2% in comparison with 2014) and
reached 93.8 Mtoe in 2015, breaking its
previous consumption record in 2013
(91.6 Mtoe)(graph 1).
Solid biomass primary energy produc-
tion, whose solid biomass is sourced
from European Union soil, is rising at a
slightly slower pace (3.8%) and achie-
ved 89.5 Mtoe (table 1). The difference,
made up of nett imports, has tended to
increase over the past few years from
2.3 Mtoe in 2012 to 4.3 Mtoe in 2015. It can
primarily be put down to higher wood
pellet imports from North America (see
further on).
In tables 2, 3 and 4 EurObserv’ER sepa-
rates the uses of final energy sourced
from solid bioma ss, namely electri -
city and heat . Solid bioma ss heat is
in turn differentiated by direct use in
final consumers’ heating appliances
(boilers, burners, inserts, etc.), which
accounts for most of the consumption
or conversion and distribution via hea-
ting networks (heat sales). According
to EurObserv’ER, consumption of heat
directly used by final consumers rose by
5% over 2014 (3.1 Mtoe) to 64.9 Mtoe in
2015. Gross solid biomass heat output
sold on to heating networks heat rose
by 3.2% (0.3 Mtoe) to meet increased hea-
ting demands. It rose to 9.3 Mtoe in 2015
and 62.5% of this figure was produced
by CHP plants, i.e. that produce heat
and electricity at the same time. If we
add these two elements together, total
final biomass heat energy consumption
increased by 4.8% to 74.2 Mtoe.
European Union solid biomass electri-
city production is less sensitive to cli-
mate variations, and is governed more
by the policies of a few Member States
to develop biomass electricity, either
by converting old coal-fired plants or
by developing biomass cogeneration.
However, the new European biomass
electricity policy revealed in the “clean
energy” package should impede conver-
sions of coal-fired plants into biomass
Légende
Gil
les
Hu
gu
et/
ED
F
Biomass heating plant in Cenon, Gironde, France

65
soli
d b
iom
ass
ba
ro
met
er
soli
d b
iom
ass
ba
ro
met
er
SOLID BIOMASS BAROMETER – EUROBSERV’ER – DECEMBER 2016 SOLID BIOMASS BAROMETER – EUROBSERV’ER – DECEMBER 2016
Tabl. n° 1Primary energy production and gross inland consumption of solid biomass in the European Union in 2014 and 2015* (in Mtoe)
2014 2015*
Country Production Consumption Production Consumption
Germany 11.417 11.417 12.062 12.062
France** 9.074 9.074 9.559 9.559
Sweden 8.923 8.923 9.129 9.129
Italy 6.539 8.066 6.712 8.357
Finland 8.117 8.137 7.901 7.927
Poland 6.179 6.755 6.268 6.774
United Kingdom 3.165 4.885 3.824 6.097
Spain 5.161 5.276 5.260 5.260
Austria 4.227 4.361 4.473 4.573
Romania 3.646 3.618 3.700 3.620
Czech Republic 2.842 2.763 2.954 2.874
Denmark 1.308 2.351 1.590 2.532
Portugal 2.671 2.351 2.603 2.340
Belgium 1.104 1.689 1.166 1.937
Hungary 1.403 1.390 1.414 1.457
Latvia 2.047 1.337 2.008 1.257
Lithuania 1.117 1.084 1.205 1.204
Croatia 1.375 1.093 1.470 1.200
Netherlands 1.290 1.147 1.364 1.179
Greece 0.869 0.930 0.952 1.013
Bulgaria 1.087 0.992 1.100 1.000
Estonia 1.122 0.789 1.209 0.825
Slovakia 0.759 0.752 0.734 0.734
Slovenia 0.533 0.533 0.590 0.590
Ireland 0.210 0.252 0.201 0.228
Luxembourg 0.060 0.059 0.050 0.059
Cyprus 0.009 0.012 0.010 0.012
Malta 0.001 0.001 0.001 0.001
European Union 86.254 90.036 89.511 93.800
* Estimate. **Overseas departments not included for France. Source: EurObserv’ER 2016.
Tabl. n° 2Gross electricity production from solid biomass in the European Union in 2014 and 2015* (in TWh)
2014 2015
CountryElectricity
only plantsCHP Plants
Total electricity
Electricity only plants
CHP PlantsTotal
electricity
United Kingdom 13.852 0.000 13.852 19.418 0.000 19.418
Germany 5.300 6.500 11.800 4.800 6.200 11.000
Finland 1.073 9.894 10.967 1.217 9.372 10.588
Poland 0.000 9.161 9.161 0.000 9.027 9.027
Sweden 0.000 9.007 9.007 0.000 8.977 8.977
Spain 2.856 0.965 3.821 3.126 0.888 4.014
Italy 2.011 1.739 3.750 2.077 1.786 3.862
Belgium 1.388 1.244 2.632 2.298 1.256 3.554
Austria 1.109 2.332 3.440 1.232 2.264 3.497
Denmark 0.000 2.959 2.959 0.000 2.803 2.803
Portugal 0.765 1.765 2.530 0.795 1.723 2.518
France** 0.095 1.543 1.637 0.098 2.042 2.140
Czech Republic 0.054 1.938 1.992 0.049 2.042 2.091
Netherlands 1.436 0.662 2.099 1.724 0.173 1.897
Hungary 1.537 0.165 1.702 1.540 0.173 1.713
Slovakia 0.011 0.905 0.916 0.011 0.842 0.853
Estonia 0.061 0.670 0.731 0.069 0.641 0.710
Romania 0.237 0.217 0.454 0.237 0.217 0.454
Latvia 0.002 0.317 0.319 0.000 0.378 0.378
Lithuania 0.000 0.293 0.293 0.000 0.318 0.318
Ireland 0.251 0.014 0.265 0.184 0.013 0.197
Bulgaria 0.010 0.128 0.138 0.010 0.128 0.138
Slovenia 0.000 0.125 0.125 0.000 0.131 0.131
Croatia 0.000 0.050 0.050 0.000 0.050 0.050
Luxembourg 0.000 0.021 0.021 0.000 0.024 0.024
Greece 0.000 0.000 0.000 0.002 0.000 0.002
European Union 32.047 52.612 84.659 38.886 51.467 90.353
* Estimate. **Overseas departments not included for France. Source: EurObserv’ER 2016.
63.9% of pellet consumption in 2015 was
used for heating purposes, broken down
as 8.5 million tonnes for home heating,
3.2 million tonnes for “commercial” hea-
ting and 1.2 million tonnes in CHP plants.
The remaining 36.1% was channelled
into electricity production split between
6.7 million tonnes in power plants and
0.6 million tonnes in CHP plants.
Despite a fairly mild winter and low
oil prices, the EPC reckons that pellet
consumption for heating increased by
4.2% between 2014 and 2015 to reach
12.9 million tonnes. Italy is the leading
consumer (with 3.1 million tonnes), fol-
lowed by Germany (2.3 MT), Denmark
(1.8 MT), Sweden (1.6 MT) and France
(1 MT). Incidentally wood pellet uses vary
by country. In Italy, Germany and France,
at 92%, 58% and 95% respectively, most of
the consumption is devoted to the home
heating market, while 56% of Denmark’s
consumption goes for heat production
in CHP plants, and in Sweden 60% is ear-
marked for boiler plants (commercial
heating), yet only 8% for producing heat
in CHP plants.
The increase in pellet consumption for
electricity production in the EU of 28
(14.9% between 2014 and 2015) was even
higher, reaching 7.3 million tonnes. The
main consumers were the UK with 5.7 mil-
lion tonnes (a 21.4% rise), Belgium with
1 million tonnes (a 67% rise) and Denmark
with 0.5 million tonnes (a 0% rise). Swe-
dish consumption dropped by 25.7%.to
only 70 000 tonnes
nEwS from around SomE of thE producEr countriES
Brexit will have a significant impact on europe’s Bioenergy landscapeThe UK’s exit from the European Union
will shake up the solid biomass energy
scene. While the UK only accounts for
6.5% (6.1 Mtoe in 2015) of the total solid
biomass consumption of the EU of 28, it
has led Europe in solid biomass electri-
city production since 2014. The Depart-
ment for Business, Energy & Industrial
Strategy claims that solid biomass elec-
tricity output rose from 13 852 GWh in
2014 to 19 418 GWh in 2015, which equates
to 40.2% growth. The UK now produces
21.5% of the European Union’s solid bio-
mass electricity. If the UK is taken out
of the equation, then overall European
Union solid biomass electricity output
has been stable since 2013 and has even
contracted slightly (71.1 TWh in 2013,
70.8 TWh in 2014 and 70.9 TWh in 2015). Bri-
tish policy supporting biomass and more
generally renewable electricity should be
stepped up over the next few years. On
9 November 2016, the UK government pre-
sented its plan to phase out coal by 2025
as a side event to the Marrakech Climate
Conference. While the plan counts on
using gas and nuclear power, it also plans
to invest £ 730 million annually in aid for
renewable electricity projects over the
next fifteen years (offshore wind power,
advanced conversion technologies, anae-
So
der
ener
gi
Biomass heating plantin Igelsta, Sweden

87
soli
d b
iom
ass
ba
ro
met
er
soli
d b
iom
ass
ba
ro
met
er
SOLID BIOMASS BAROMETER – EUROBSERV’ER – DECEMBER 2016 SOLID BIOMASS BAROMETER – EUROBSERV’ER – DECEMBER 2016
Tabl. n° 3Gross heat production from solid biomass in the European Union in 2014 and in 2015* (in Mtoe) in the transformation sector**
2014 2015
CountryHeat
plants onlyCHP plants Total Heat
Heat plants only
CHP plants Total Heat
Sweden 0.716 1.562 2.278 0.704 1.614 2.318
Finland 0.630 1.055 1.685 0.594 1.012 1.606
Denmark 0.398 0.592 0.990 0.420 0.602 1.022
Austria 0.457 0.333 0.790 0.471 0.356 0.827
France*** 0.256 0.359 0.616 0.326 0.395 0.721
Germany 0.179 0.358 0.537 0.184 0.399 0.583
Italy 0.065 0.528 0.593 0.062 0.502 0.564
Lithuania 0.261 0.095 0.355 0.346 0.100 0.445
Poland 0.033 0.300 0.333 0.029 0.268 0.297
Estonia 0.049 0.133 0.182 0.075 0.140 0.215
Latvia 0.095 0.090 0.185 0.095 0.106 0.201
Czech Republic 0.022 0.117 0.139 0.030 0.123 0.153
Slovakia 0.041 0.073 0.113 0.040 0.071 0.111
Hungary 0.042 0.035 0.077 0.052 0.036 0.088
Romania 0.029 0.035 0.064 0.029 0.035 0.064
Netherlands 0.009 0.017 0.025 0.018 0.014 0.032
Slovenia 0.006 0.014 0.019 0.008 0.018 0.027
Luxembourg 0.003 0.008 0.011 0.004 0.009 0.013
Bulgaria 0.004 0.003 0.007 0.004 0.003 0.007
Belgium 0.000 0.007 0.007 0.000 0.006 0.006
Croatia 0.000 0.006 0.006 0.000 0.006 0.006
United Kingdom 0.003 0.000 0.003 0.004 0.000 0.004
European Union 3.298 5.719 9.018 3.494 5.817 9.311
* Estimate. ** Heat sold in district heating. Decimals are written with a comma. ***Overseas departments not included for France. Source: EurObserv’ER 2016.
robic digestion, biomass cogeneration,
marine energies and geothermal power).
The UK government also gave the details
of the next Contracts for Difference (CfD)
auction for a total sum of £ 290 million.
This second round of CfD auctions should
produce enough electricity for 1 million
people and reduce carbon emissions
by approximately 2.5 million tonnes
from 2021/2022 onwards, according to
the government. The Strike Price for
biomass cogeneration has been set at
£ 115/MWh for projects that should start
producing electricity from 2021–2022 or
2022–2023 onwards. Consultations on the
coal phase-out plan are underway until
1st February 2017.
wood consumption in france is on a slight upswing France had its third hottest year since
1900 in 2015 following 2011 and 2014
– which had a marked impact on solid
biomass consumption for heating. Accor-
ding to the French Sustainable Develop-
ment Ministerial Statistical Department
(SOeS), consumption in mainland France
reached 9.6 Mtoe in 2015 compared to
9.1 Mtoe in 2014, but remained below its
2013 level of 10.4 Mtoe. Heat accounts for
about 95% of the energy produced by this
sector, while the remaining 5% produces
electricity. Wood-energy accounts for
almost all of this production, of which
73% is devoted to heating family dwel-
lings. While 2015 was one of the hottest
years in the last three decades, it was a
little cooler than the previous year on
average, which explains the rebound
of the wood-energy sector despite the
drop in wood heating appliance sales
(see the Observ’ER study, www.energies-
renewables.org).
Leaving aside domestic heating, ADEME
and the French Environment Ministry
continue to promote bioma ss heat
through the Heat Fund via BCIAT (Bio-
mass Heating for Industry, Agriculture
and Services) calls for projects. In 2016,
10 new winners were designated, which
takes the number of projects benefit-
ting from this support mechanism to 120
since 2009. At the end of 2016, 66 facilities
were already in service, producing more
than 330 ktoe and all the winning projects
from 2009–2016 will produce 680 ktoe, so
avoiding 2.1 million tonnes of CO2 emis-
sions. The Environment Minister also
designated the 19 winners of the Dynamic
wood call for Expressions of Interest (EoI)
in 2016 which aims to accelerate the use
of wood in boiler plants. These projects
will result in the use of a further 1 million
tonnes of wood per annum.
A n imp or t ant landmark for French
regions taking charge of their biomass
potential will be for them to individually
adopt regional biomass schemes, before
18 February 2017, in line with the energy
transition law’s provisions. These plans
should match the multi-annual energy
programming (PPE) aims, approved by
Decree No. 2016-1442 of 27 October 2016.
The PPE provides for 540 MW of instal-
led solid biomass electricity capacity by
31 December 2018 and capacity ranging
from 790 MW (low option) to 1 040 MW
(high option) by 31 December 2023 .
France’s renewable heat and cooling
production development aims for bio-
mass (excluding biogas) are 12 Mtoe by
31 December 2018 and output ranging
from 13 Mtoe (low option) to 14 Mtoe (high
option) by 31 December 2023.
In particular the regional biomass scheme
must determine “the orientations and
actions to be implemented at regional
and infra-regional level to stimulate the
biomass production and recovery sectors
likely to be put to energy use, taking care
that the multi-functionality of natural
areas is upheld, primarily farming and
forest areas”.
germany’s wood consumption Boosted By falling temperatures Data released by AGEEstat indicates
that solid biomass consumption passed
the 12 Mtoe mark, with a 5.6% increase
over 2014. There are two reasons for this
increase – firstly the harsher weather
which boosted heating requirements
and secondly the larger base of modern
wo o d - burning heat ing a pplia nce s .
Renewable energy use in Germany’s hea-
ting sector is regulated by the renewable
heat law (EEWärmeG) which came into
force on 1 July 2009. It intends to raise the
renewable energy share of final energy
consumption for heating and cooling to
14% by 2020. Thus the law has made par-
tial use of renewable heat compulsory in
all new buildings, and in existing public
buildings. Owners are free to choose the
type of renewable energy they wish to
use, but if they choose a system that runs
on solid biomass, it must cover at least
Pr
oP
elle
ts A
ust
ria

109
soli
d b
iom
ass
ba
ro
met
er
soli
d b
iom
ass
ba
ro
met
er
SOLID BIOMASS BAROMETER – EUROBSERV’ER – DECEMBER 2016 SOLID BIOMASS BAROMETER – EUROBSERV’ER – DECEMBER 2016
growth to 158 billion kWh. The renewable
energy share of total energy consump-
tion for heating and cooling rose from
12.5% in 2014 to 13.2% in 2015.
new temperature records curB finland’s wood consumption In Finland, solid biomass-sourced energy
Graph. 2Gross energy consumption of solid biomass in toe per inhab in the European Union in 2015*
* Estimate. Source: EurObserv’ER 2016.
1.449
0.937
0.633
0.628
0.533
0.447
0.412
0.286
0.284
0.273
0.226
0.182
0.178
0.172
0.149
0.148
0.144
0.139
0.137
0.135
0.113
0.104
0.094
0.094
0.070
0.049
0.014
0.003
0.185
Finland
Sweden
Latvia
Estonia
Austria
Denmark
Lithuania
Slovenia
Croatia
Czech rep
Portugal
Romania
Poland
Belgium
Germany
Hungary
France
Bulgaria
Italy
Slovakia
Spain
Luxembourg
United Kingdom
Greece
Netherlands
Ireland
Cyprus
Malta
European Union 28
Tabl. n° 4Heat consumption* from solid biomass in the countries of the European Union in 2014 and 2015**
Country 2014Of which direct use by end user
Of which district heating
2015Of which direct use by end user
Of which district heating
Germany 8.372 7.834 0.537 9.253 8.670 0.583
France*** 8.314 7.698 0.616 8.836 8.115 0.721
Sweden 7.464 5.186 2.278 7.689 5.371 2.318
Italy 6.594 6.001 0.593 6.856 6.292 0.564
Finland 6.530 4.846 1.685 6.433 4.826 1.606
Poland 4.771 4.438 0.333 4.786 4.489 0.297
Spain 3.734 3.734 0.000 3.926 3.926 0.000
Austria 3.580 2.790 0.790 3.728 2.902 0.827
Romania 3.495 3.431 0.064 3.564 3.500 0.064
United Kingdom 2.197 2.193 0.003 2.595 2.591 0.004
Czech Republic 2.335 2.196 0.139 2.404 2.251 0.153
Denmark 1.949 0.958 0.990 2.171 1.149 1.022
Portugal 1.742 1.742 0.000 1.720 1.720 0.000
Belgium 1.135 1.128 0.007 1.186 1.181 0.006
Croatia 1.058 1.052 0.006 1.106 1.100 0.006
Latvia 1.194 1.009 0.185 1.106 0.905 0.201
Lithuania 0.990 0.635 0.355 1.065 0.620 0.445
Hungary 0.916 0.839 0.077 1.064 0.976 0.088
Greece 0.927 0.927 0.000 1.010 1.010 0.000
Bulgaria 0.959 0.952 0.007 1.007 1.000 0.007
Estonia 0.654 0.472 0.182 0.692 0.477 0.215
Netherlands 0.645 0.620 0.025 0.685 0.653 0.032
Slovenia 0.510 0.491 0.019 0.565 0.538 0.027
Slovakia 0.481 0.367 0.113 0.478 0.367 0.111
Ireland 0.196 0.196 0.000 0.193 0.193 0.000
Luxembourg 0.054 0.043 0.011 0.053 0.040 0.013
Cyprus 0.011 0.011 0.000 0.011 0.011 0.000
Malta 0.001 0.001 0.000 0.001 0.001 0.000
European Union 28 70.806 61.789 9.018 74.184 64.874 9.311
* Consumption of the end user (either as heat sold by the district heating or self-consumed. either as fuels for the production of heat and cold). ** Estimate.
***Overseas departments not included for France. Source: EurObserv’ER 2016.
50% of the building’s heating consump-
tion. The Federal Government encou-
rages the use of heating appliances run-
ning on renewable energy through the
“Marktanreizprogramm” (MAP) market
incentive programme in addition to the
EEWärmeG law. From 2000–2015, the MAP
programme funded 383 000 domestic bio-
mass heating appliances (mainly pellet
burners) to the tune of 701 million euros
of aid. In 2015 alone, 32 500 new pellet
burners were installed.
The Federal Ministry for Economic Affairs
and Energy’s (BMWi) annual “Renewable
Energy in Figures” report for 2015 states
that renewable energy-sourced heat
consumption grew faster than overall
heat consumption by putting on 8.5%
consumption dropped again according
to Statistics Finland, from 8.1 Mtoe in
2014 to 7.9 Mtoe in 2015. The explanation
for this drop is another warm year that
reduced heating requirements. It had a
direct impact on solid biomass consump-
tion as the country is the leading gross
per capita consumer of solid biomass
energy consumption (graph 2).
The Finnish Meteorological Institute
points out that the country went through
four exceptionally warm years in the first
half of the decade… 2011, 2013 and 2014
crowned by a record year in 2015, when
home heating consumption dropped by
5% to 41 TWh (3.5 Mtoe). The most popu-
lar heat sources in Finland used for hea-
ting are electricity, heating networks
and wood-fired appliances. It should be
noted that the use of solid biomass is
widespread for generating electricity
(10.6 TWh) and supplying district heating
networks (1.6 Mtoe). The good news is
that wood energy consumption level was
kept up in the manufacturing sector as
wood is the main energy source used – it
commands a 37% share of the 12 Mtoe
total (i.e. 4.4 Mtoe).
a multi-facEtEd induStryThere is no biomass industry as such,
but rather a broad variety of market seg-
ments. The European biomass scene for
energy is multi-faceted, including manu-
facturers, service providers, producers
and component suppliers for the various
forms of energetic biomass conversion
in the residential, commercial, industrial
heating, electricity or transport sectors.
The segments are ranging from the direct
wood production in the forestry industry,
transportation and logistics, pellet pro-
duction, over the industrial wood fuel
conversion, i.e. the planning, construc-
tion and operation of biomass plants,
for electricity and heat production, the
operation of district heating plants and
networks, the component supply to these
utilities (biomass boilers) or the manufac-
turing of individual heating appliances.
Important players in the European bio-
mass industry are largely located in
the markets with the highest shares
of biomass in terms of installed gene-
rating capacity. According to the 2016
IRENA solid biofuels capacity statistics,
over 23 300 MW of generating capacity
were installed in the European Union,
with Sweden (4 340 MW) and Germany
(3 962 MW) heading the table, and with
Italy (1 446 MW), Austria (1 332 MW), Den-
mark (1 172 MW), and France (908 MW) in
the follow-up positions. Most notably
the Scandinavian EU member states
Sweden and Finland have well - esta-
blished forestry sectors, Denmark has
implemented ambitious district heating
projects, Austria has a vibrant scene of
technology suppliers, Germany, in its cur-
rent strive to efficiently connect the dif-
ferent markets segments of power, heat
and transport fuels (a process termed
sector coupling), or the United Kingdom
that increasingly modernizes its (coal)
power plant infrastructure with increa-

1211
soli
d b
iom
ass
ba
ro
met
er
soli
d b
iom
ass
ba
ro
met
er
SOLID BIOMASS BAROMETER – EUROBSERV’ER – DECEMBER 2016 SOLID BIOMASS BAROMETER – EUROBSERV’ER – DECEMBER 2016
N
400 km
Spain n° 8
TOTAL EU
93.8
90.4
74.2
Germany n° 1
12.111.0
9.3
Cyprus n° 27Malta n° 28
France1 n° 2
9.62.18.8
Sweden n° 3
9.19.07.7
Finland n° 5
7.910.6
6.4
Poland n° 6
6.89.04.8
5.34.03.9
Austria n° 9
4.63.53.7 Romania n° 10
3.60.53.6
Italy n° 4
8.43.96.9
Portugal n° 13
2.32.51.7
Czech Rep. n° 11
2.92.12.4
United-Kingdom n° 7
6.119.4
2.6
Latvia n° 16
1.30.41.1
Hungary n° 15
1.51.71.1
Denmark n° 12
2.52.82.2
Netherlands n° 19
1.21.90.7
Bulgaria n° 21
1.00.11.0
Belgium n° 14
1.93.61.2
Lithuania n° 17
1.20.31.1
Greece n° 20
1.00.01.0
Estonia n° 22
0.80.70.7
Slovakia n° 23
0.70.90.5
Croatia n° 18
1.20.11.1
Slovenia n° 24
0.60.10.6
Ireland n° 25
0.20.20.2
Luxembourg n° 26
0.10.00.1
0.00.00.0
0.00.00.0
3.9
Key
Gross inland consumption, gross electricity production and heat consumption from solid biomass in the European Union in 2015*
* Estimate. 1 Overseas departments not included. Source: EurObserv’ER 2016.
Gross inland consumption of solid biomass in the European Union in 2015* (in Mtoe).
Heat consumption from solid biomass in the European Union in 2015* (in Mtoe).
Gross electricity production from solid biomassin the European Union in 2015* (in TWh).
9.2 1.5
8.7
sing shares of solid biomass in co-firing
CHP plants.
The trend observed last year of conver-
ting coal-fired plants to 100% biomass
plants continued. The UK, Denmark and
Finland are specifically active in this
scene, despite some biomass subsidy
cuts in 2015 in the UK. In the DRAX power
plant – once Britain’s biggest coal station,
biomass provided about 70 percent of
fuel to in the first half of 2016, up from
37 percent in the same period in 2015.
Drax announced that it has upgraded
a third unit to run on wood pellets and
plans for further conversions. To illus-
trate the sheer amount of biomass elec-
tricity, we need to keep in mind that bio-
mass based electricity generated in the
plant, represents about 20 percent of
renewable and 8 percent of Britain’s total
power. Further illustrations in Scandina-
via and Eastern Europe could be named.
Finnish Valmet and Danish HOFOR Ener-
giproduktion A/S announced to install a
500 MW biomass CHP plant in Copenha-
gen. The signed €150 million contract to
replace an existing 600-MW coal-fired
plant with a biomass CHP plant by 2019
aims at emission reductions of some
1.2 million tons annually which would
turn the plant into the tenth largest in
the world. In Denmark, the utility Dong
Energy in October 2016 finally switched
its Studstrup combined heat and power
(CHP) plant in Aarhus from coal to wood
pellets. The boilers use electricity to pro-
vide district heating when the Danish
wind turbines are running at full capacity
and the electricity prices are low. Another
example can be found in Latvia where one
of the largest dairy processing companies
inaugurated a new 8 MW biomass-fuelled
steam boiler unit. The new biomass plant
will produce about 51 200 MWh of energy
annually, displacing the equivalent of
6.4 million Nm3 of fossil gas thus avoiding
around 10 500 tons of CO2 emissions.
A n d i n F i n l a n d P o r i E n e r g i a h a s
announced that its ageing Aittaluoto
CHP plant will undergo a EUR 50 million
investment for boiler replacement and
a flue gas treatment overhaul by 2020.
This measure shall increase the share of
biomass fuels used as well as increase
the overall fuel efficiency of the plant.
The plant with a combined thermal input
of 206 MW and 55 MW electric output
also exemplifies another important
trend often overlooked as crucial pillar
of energy transitions: the increasingly
beneficial role of biomass in renewable
heat supply. The plant supplies district
heat to the Pori and Ulvila district heating
networks as well as process steam to the
industrial park. The plant uses a mix of
fuels including woody biomass and peat.
Fortum Värme’s Värtaverket CHP plant in
the Swedish capital Stockholm has one
of Europe’s largest district heating and
cooling systems, which has entered its
final testing phase. The new Värtaverket
biomass-fired CHP plant is connected to
Stockholm’s southern-central district
heating network. Fortum Värme supplies
the city of Stockholm with heat and elec-
tricity and cooling – a concept termed
tri-generation. The new plant uses forest
biomass as fuel, increasing the overall
use of biomass at Värtanverket from
around 45 percent to as high as 70 percent
according to the Bioenergy Internatio-
nal magazine. And in Latvia, Axis Tech-
nologies, has won the bid to build the
countries’ largest biomass energy pro-
ject. Awarded by energy utility Rigas
BioEnergija the EUR 30 million contract
is for a 48 MW capacity biomass-fired dis-
trict heating plant. The project consists
of two identical boiler plants in Riga,
each unit consisting of a 20 MW biomass
boiler with a 4 MW flue gas condensing
economizer.
Gav
in Y
ou
ng
/EO
N U
K
Stevens Croft’s biomass heating plant in Lockerbie, Scotland

1413
soli
d b
iom
ass
ba
ro
met
er
soli
d b
iom
ass
ba
ro
met
er
SOLID BIOMASS BAROMETER – EUROBSERV’ER – DECEMBER 2016 SOLID BIOMASS BAROMETER – EUROBSERV’ER – DECEMBER 2016
sourced from renewable urban waste) in
2015 has made up for much of the delay
in reaching the common NREAP target
of 113.8 TWh in 2015 (graph 4). However
the downside of this achievement is that
most of the increase in solid biomass
electricity production is the result of the
UK’s policy to convert coal-fired power
plants. On the contrary, solid biomass
electricity output in the other major
producing countries has tended to fall.
In relation to 2013, output is lower in the
Nordic countries (Finland, Sweden and
Denmark), and also in the Netherlands,
Germany, Austria and Spain. If the UK is
left out, and it is due to leave the Euro-
pean Union, solid biomass electricity
production’s momentum is mediocre.
France, Belgium, Spain, the Netherlands
and Poland are clearly drifting further
away from their NREAP roadmaps.
We can hint at the lack of political deter-
mination, the low price of the tonne of
coal and the per tonne price of carbon
being too low to play its role of stimula-
ting renewable electricity as just some
of the reasons. Furthermore, in some
countries the construction or conver-
sion of high-capacity biomass plants
that do not operate as CHP plants (such
as the Gardanne plant in France), has
also courted controversy about the
sustainability of large quantities of
biomass fuel supplies and the fact that
their yields are lower than CHP plants.
Incidentally these remarks have been
factored in by the European Commis-
sion in its new draft renewable energy
directive for plants built after 2020 (see
further on).
On 30 November 2016, just three years
before the 2020 deadline, the European
Commission presented its new Clean
Energy Package of measures that aims
to round off the European Union climate
and energy framework to the 2030 time-
line. The package includes a number
of amendment proposals to directives
covering energy efficiency, renewable
energy, the design of the electricity mar-
ket, security of electricity supply and
governance rules for the Energy Union. It
is a legislative arsenal aimed at shaping
Europe’s forthcoming energy system. As
for the package aims, it covers broadly
the same lines as the terms of the agree-
ments set by the European Council in
October 2014. To recap, the European
Union set itself the aim of collectively
reaching a 27% share of renewables in
final energy consumption by 2030 and
reducing it s GHG emissions by 40% .
The only difference is in the energ y
consumption reduction target. The Com-
mission proposes to take the target to
30% instead of 27% and make it binding.
As for heating and cooling, the Commis-
sion recalls that “three out of four Euro-
pean homes are heated with fossil fuels.
This corresponds to 68% of the EU’s gas
import, and is a sign of slow growth of
clean energy in a sector which takes half
of EU’s energy needs. In order to address
these challenges, the Renewables Direc-
tive includes a number of options for
Member States to increase their share of
renewable energy in heating and cooling
supply, by 1 percentage point per year
until 2030.” The new directive’s proposal
“opens access rights to local district hea-
ting and cooling systems for producers
of renewables heating and cooling and
waste from industry and third parties
acting on their behalf”.
Despite the European Commission’s
declared enthusiasm, the “clean energy”
package received a cold reception from
the European associations that promote
renewable heat (and cooling) (AEBIOM,
EGEC, EHPA , ESTIF), who criticise its
unambitious renewable energy targets
and over-generous attitude towards fos-
sil fuels.
As currently worded, the energy effi-
ciency directive does not actually spe-
cify which energy sources and tech-
nologies are eligible for achieving the
energy efficiency targets. This omission
allows Member States to finance the
most efficient heating technologies
using fossil fuels such as condensing
gas and oil-fired boilers. These policies
are curbing the development and sales
of high-efficiency renewable energy-
sourced heating systems, and primarily
heating appliances that use wood or
wood pellets.
The winter package also introduces
major changes to the energy use of solid
biomass. The revised renewable energy
directive strengthens current European
Union criteria that apply to bioenergy
sustainability and extends their applica-
tion to biomass and biogas used to pro-
duce heat and electricity. One of the new
sustainability criteria in the proposed
measures now applies to the forest bio-
mass used for energy purposes, to miti-
gate the risk of forest overexploitation
and guarantee that accounting rules on
land use, land use change and forestry
(LULUCF) are applied. The sustainabi-
lity criteria will be extended to large
heat-producing and biomass or biogas
electricity producing installations (with
capacities of ≥20 MW) combined with a
pellet sectorAccording to a report by the UN Food and
Agriculture Organization (FAO) global
wood pellet production surged to record
levels in 2014. The main production cen-
ters are located in Europe (61% of pro-
duction) and North America (33% in USA
and Canada). The top five consumers of
pellets were U.K., U.S., Denmark, Italy
and Sweden, with a total consumption
amounting to 14 million metric tons or
55 percent of global consumption. At the
beginning of 2016 the insolvency of Ger-
many‘s largest Pellet producer (German
Pellets) made headlines. Although this
insolvency has no real impacts on the
supply and consumption side for consu-
mers, and the reason for breakdown are
rather unprofessional business prac-
tices, it is a reminder that the transfor-
mation of the energy systems are no
self-evident one way roads. The German
pellet market is also witnessing lower
prices according to information from
DEPV the German pellet association.
Pellets are cost competitive with oil
and gas. 1 kWh of heat from pellet costs
around 4,79 cents/kWh compared to
6,45 cents/kWh from gas or 4.39 cents/
kWh from oil. Despite improved support
conditions, the pellet market declined
by 10% in 2015. The sales of pellet boilers
and wood stoves also declined in 2015.
Nevertheless, large projects based on
pellet combustion started operation in
2016. In Finland, energy utility Helen
Oy contracted Valmet to supply a EUR
20 million wood pellet fired heating
plant to its Salmisaari power plant in
Helsinki with a district heating capa-
city of 92 MW. At full capacity it will use
21 tons of wood pellets per hour.
A major challenge ahead of the biomass
industry is certainly the low price range
of fossil oil and gas which are currently
not favoring investments in biomass
based solutions. Also the low carbon
certificate prices are dis-incentivizing
further progress. France has announced
to introduce a gradually increase carbon
tax on fossil fuels, which might in turn
unleash a massive stimulus and invest-
ment programme in renewables and
energy efficiency from which companies
active in the French heat and electricity
markets might clearly take advantage.
Current issues and topics debated in the
European biomass industry relate to the
supply of residues and by-products from
agriculture and forestry or the produc-
tion of short rotation woody biomass.
Biomass strategies, policies and targets
for 2030 may also take into considera-
tion bioenergy’s positive contribution
to the creation of low carbon economies.
Ways ahead for the bioenergy sector
seem to be the combination of bioenergy
with other renewable energy sources,
biomass energy storage, and the integra-
tion of biomass systems in more flexible
supply systems. Due to its very nature,
biomass could play a vital role in grid
balancing, an ever more present issue in
EU countries with increasing shares of
RES in the electricity mix.
2030 – thE “wintEr packagE” iS blowing hot and cold The year 2015 is a suitable occasion to
see how the land lies as far as targets
are concerned and compare them with
the National Renewable Energy Action
Plan (NREAP) trajectories. As far as heat
consumption is concerned, the Euro-
pean Union taken together is ahead of
its planned trajectory with 77.6 Mtoe
(including 3.4 Mtoe from the incinera-
tion of renewable urban waste) com-
pared to the projection of 66.2 Mtoe in
2015 (Graph 3). The reason for this signi-
ficant difference can be put down to
the efforts made by Member States to
develop solid biomass heat but almost
certainly to initial underestimation of
their consumption of this type of heat.
We note that since the NREAPs were
published in 2010, a few countries such
as Germany, Spain, Italy, the UK and
France, followed recently by the Czech
Republic have upgraded their biomass
heat consumption estimates retroacti-
vely, primarily as a result of more accu-
rate surveys of household wood energy
consumption.
Despite these statistical shots in the
arm, current momentum is not as posi-
tive as it was during the first decade of
the millennium, and the climate is partly
to blame for this. Since 2010, biomass
heat consumption has come up against
a run of abnormally warm years that has
reduced heating requirements. Points in
case are 2014 and 2015 while 2016 looks
as though it will also be very hot. Another
reason that gives more to celebrate than
climate warming , is that some of the
wood-fired heating appliance base has
been replaced by high energy efficiency
systems that use very much less wood.
This trend, which seems set to last, has
prompted EurObserv’ER to downward
revise its projections of biomass heat
consumption, although, given the state
of progress, the common NREAP goal
should be exceeded.
As regards electricity production, the
high growth of solid biomass electricity
output of 111.2 TWh (including 20.9 TWh
These data include an estimate of the renewable heat from incineration plants of municipal waste.
Source: EurObserv’ER 2016.
Graph. n° 3Comparison of the current trend of heat consumption from solid biomass against the NREAP (National Renewable Energy Action Plan) roadmaps (in Mtoe)
66.2
81.076.3 74.0 77.6
89.0
NREAP roadmaps
Current trend*
2013 2014 2015 20202013 2014 2015 20202013 2014 2015 2020
99.4 104.3111.2
130
113.8
154.9
NREAP roadmaps
Current trend*
Graph. n° 4Comparison of the current trend of electricity production from solid biomass against the NREAP (National Renewable Energy Action Plan) roadmaps (in TWh)
These data include an estimate of the renewable electricity from waste incineration units.
Source: EurObserv’ER 2016.

15
soli
d b
iom
ass
ba
ro
met
er
SOLID BIOMASS BAROMETER – EUROBSERV’ER – DECEMBER 2016
Sources : Statistics Austria, SPF Economie (Belgium),
Ministry of Industry and Trade (Czech Republic), ENS
(Denmark), Statistics Estonia, Statistics Finland, SOeS
(France), ZSW AGEE-Stat (Germany), CRES (Greece),
SEAI (Ireland Republic), Statistics Netherlands,
Statistics Lithuania, STATEC (Luxembourg), CSB
(Latvia), GUS (Poland), DGGE (Portugal), IDAE
(Spain), Statistics Sweden, DBEIS (United Kingdom),
Statistical Office RS (Slovenia), GUS (Poland), IEA,
Observ’ER.
The next barometer will cover wind power
This barometer was prepared by Observ’ER in the scope of the “EurObserv’ER” project with the collaboration of RENAC (DE). Sole responsibility for the publication’s content lies with its authors. It does not represent the opinion of Ademe nor that of Caisse des dépôts. Ademe and Caisse des dépôts may not be held responsible for any use that may be made of the information published. This action benefits from the financial support of Ademe and Caisse des dépôts.
binding reduction in GHG of 80% compa-
red to fossil fuels from 2021 onwards and
of 85% from 2026 onwards). This is com-
pounded by the demand that the electri-
city is produced by high-efficiency coge-
neration (with a yield of >80%). However
there will be no challenge to the acqui-
red rights of existing installations.
According to AEBIOM, which reacted in a
press release, the European Commission
has taken a pragmatic approach that
takes into account some of the realities
on the ground, such as not proposing
special sustainability requirements for
very big installations and endorsing a
risk-based approach for forest biomass,
primarily on the supply sources of very
large plants. The association considers
that the European Commission has also
opted for a rational approach founded
on land-based sustainability by biomass
type (biomass from forestry, biomass
from agriculture, etc.) as opposed to
by energy consumption. AEBIOM’s Pre-
sident, Didzis Palejs reacted by saying
« As wood can be used to make biofuels
or produce heat and electricity, the Com-
mission’s approach addressing sustai-
nability of forest biomass, whatever its
energy end use, makes sense. »
However, AEBIOM regret s that this
approach has not been followed for defi-
ning a single GHG emissions target for all
bioenergy. It is also concerned that by
giving Member States the flexibility they
need to define additional sustainability
rules, the Commission’s proposal cannot
ensure that the whole sector is handled
evenly. « I am very concerned that a lack
of full harmonisation at EU level could
hamper biomass trade and lead to une-
qual treatment among economic ope-
rators, » said Eric Vial, President of the
European Pellet Council.
As regards the production of solid bio-
ma ss electricity, AEBIOM notes the
Commission’s political rationale to only
include electricity produced by effi-
cient cogeneration technology in tar-
get accounting. However the approach
ignores the potential role that could
be played by “biopower” in backing up
variable renewable electricity such as
wind and solar. The association fears
that this provision could leave the door
wide open for fossil fuel development,
which runs counter to the EU’s decarbo-
nisation targets and commitments.


![Biomass Conversion into Solid Composite Fuel for … for energy purposes [1, 2]. Biomass power plants ... methods for the biomass conversion into solid composite fuel is an actual](https://static.fdocuments.in/doc/165x107/5aa5e6927f8b9a7c1a8e0b4c/biomass-conversion-into-solid-composite-fuel-for-for-energy-purposes-1-2.jpg)