09.10.2011 What opportunities exist for private equity investors within Mongolia, Masa Igata
14
I N T R O D U C T I O N T O M O N G O L I A Securities Discover Mongolia’s investment opportunities 1 1 December 8 – 9, 2011 By Masa Igata, Founder & CEO Frontier Securities M O N G O L I A I N V E S T M E N T S U M M I T 2 0 1
-
Upload
the-business-council-of-mongolia -
Category
Business
-
view
230 -
download
0
Transcript of 09.10.2011 What opportunities exist for private equity investors within Mongolia, Masa Igata
I N T R O D U C T I O N T O M O N G O L I A
Securities
Discover Mongolia’s investment opportunities
2 0
1 1
December 8 – 9, 2011
Discover Mongolia’s investment opportunitiesBy Masa Igata, Founder & CEO Frontier Securities
M O
N G
O L
I A
I N
V E
S T
M E
N T
S
U M
MI T
2
0 1
1
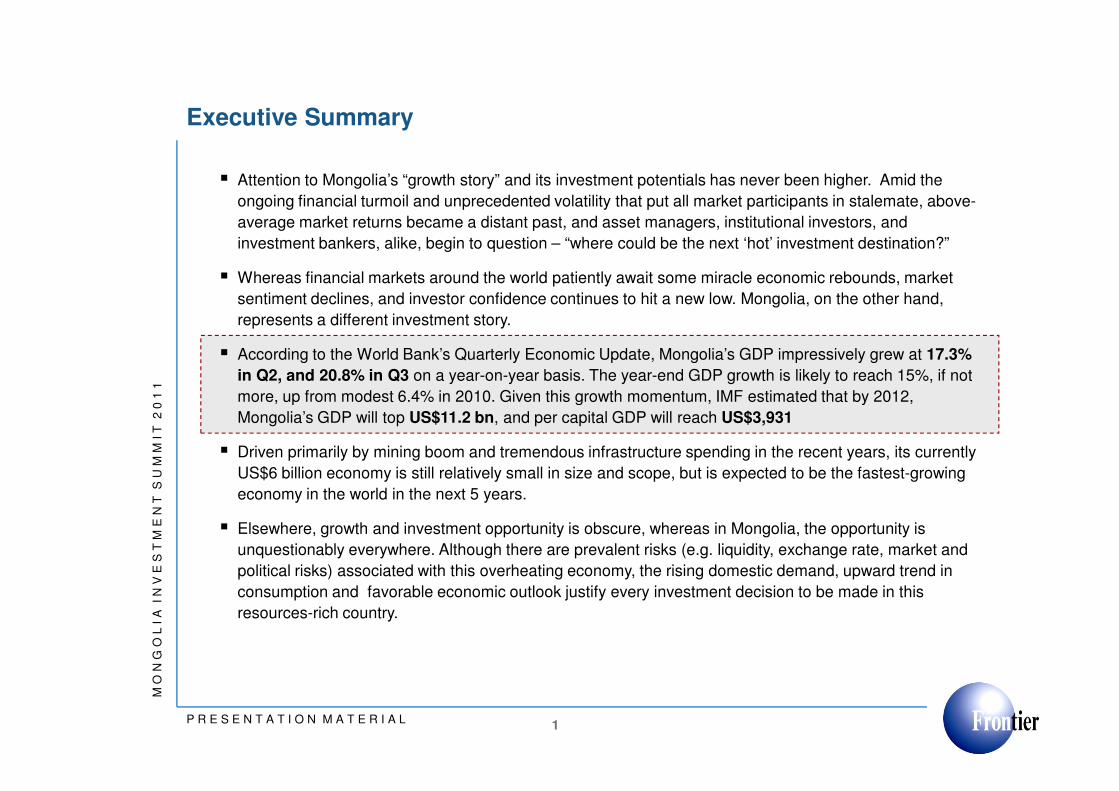
Executive Summary
� Attention to Mongolia’s “growth story” and its investment potentials has never been higher. Amid the
ongoing financial turmoil and unprecedented volatility that put all market participants in stalemate, above-
average market returns became a distant past, and asset managers, institutional investors, and
investment bankers, alike, begin to question – “where could be the next ‘hot’ investment destination?”
� Whereas financial markets around the world patiently await some miracle economic rebounds, market
sentiment declines, and investor confidence continues to hit a new low. Mongolia, on the other hand,
represents a different investment story.
� According to the World Bank’s Quarterly Economic Update, Mongolia’s GDP impressively grew at 17.3%
in Q2, and 20.8% in Q3 on a year-on-year basis. The year-end GDP growth is likely to reach 15%, if not
more, up from modest 6.4% in 2010. Given this growth momentum, IMF estimated that by 2012,
2 0
1 1
1
more, up from modest 6.4% in 2010. Given this growth momentum, IMF estimated that by 2012,
Mongolia’s GDP will top US$11.2 bn, and per capital GDP will reach US$3,931
� Driven primarily by mining boom and tremendous infrastructure spending in the recent years, its currently
US$6 billion economy is still relatively small in size and scope, but is expected to be the fastest-growing
economy in the world in the next 5 years.
� Elsewhere, growth and investment opportunity is obscure, whereas in Mongolia, the opportunity is
unquestionably everywhere. Although there are prevalent risks (e.g. liquidity, exchange rate, market and
political risks) associated with this overheating economy, the rising domestic demand, upward trend in
consumption and favorable economic outlook justify every investment decision to be made in this
resources-rich country.
P R E S E N T A T I O N M A T E R I A L
M O
N G
O L
I A
I N
V E
S T
M E
N T
S
U M
MI T
2
0 1
1

Mongolia: country profile1
Young, democratic and resources-rich country sandwiched by Russia and China
Territory: 19th largest country - 1,565,000 km2Population: 135th in the world3.1 millions (July 2011 est.)1.8 people/km2 on average180 people/km2 in the capital, Ulaanbaatar cityTerrain: Vast semi-desert and desert plains, grassy steppe, mountains in west and southwest; Gobi Desert in south-centralLandlocked; strategic location between China and Russia
2 0
1 1
2P R E S E N T A T I O N M A T E R I A L
Russia
Political structure: Parliamentary democracy from 1991, 2 large parties (MPP and Democratic Party)Current Prime Minister: S. Batbold (MPP), 2008 election results: MPP 46, DP 27, others 3Current President: Ts. Elbegdorj (nominated from DP) in office since 2008Next Elections: June 2012
Main Religions: Buddhist (90%), Muslim (5%), Shamanist and Christian (5%)Life expectancy: Men – 66 years old, Women – 71 Literacy rate: 97.8%
Currency: Tögrög (1,315₮ = US$1 as of Nov 18th, 2011)Inflation: 11.9% (as of Sept 2011)GDP*: US$6.24 bn (2010, IMF)Growth rate: 20.8% yoy (Q3:2011)Per capita GDP*: $2,267 (2010, IMF)No capital controls, free press and internet
Source: 1) Unless stated otherwise, all economic figures are obtained from the World Bank’s Mongolia Quarterly Update (October 2011)
Note: “GDP” and “Per capita GDP” statistics are in current prices
M O
N G
O L
I A
I N
V E
S T
M E
N T
S
U M
MI T
2
0 1
1

Mongolia’s GDP surged 20.8% yoy in Q3:2011, and robust growth is expected to continue
With OT and TT operating at full capacity, Mongolia is the fasting-growing economy in the next 5 years
0
5
10
15
20
25
4,000
5,000
6,000
7,000
8,000
9,000
10,000
%MNT bn 1990 – 2016F real GDP (constant price of 2005) and GDP growth
Inception of OyuTolgoi
Tavan Tolgoi at full capacity
2 0
1 1
3P R E S E N T A T I O N M A T E R I A L
Source: IMF estimates (September 2011)
-15
-10
-5
0
0
1,000
2,000
3,000
GDP (MNT bn) % GDP growth
2008 2009 2010 2011F 2012F 2013F 2014F 2015F 2016F
Mongolia % GDP Growth
8.9% -1.3% 6.4% 11.5% 11.8% 19.3% 14.8% 9.3% 15.6%
M O
N G
O L
I A
I N
V E
S T
M E
N T
S
U M
MI T
2
0 1
1

GDP breakdown by sector: 2009 vs 2010
While mining sector is the main driving force, emerging opportunities in other sectors exist
164
369
51
68
206
240
95
21
19
455
Financial and insurance activities
Real estate activities
Professional, scientific and …
Administrative and support …
Public administration and …
Education
Human health and social work …
Arts, entertainment and recreation
Other service activities
Net taxes on products
2009 GDP by sectors at current pricesUS$5,070 mm*
122
394
54
77
232
266
107
24
21
771
Financial and insurance activities
Real estate activities
Professional, scientific and …
Administrative and support …
Public administration and …
Education
Human health and social work …
Arts, entertainment and recreation
Other service activities
Net taxes on products
2010 GDP by sectors at current pricesUS$6,350 mm*
I T
2
0 1
1
4P R E S E N T A T I O N M A T E R I A L
Source: National Statistics Office (NSO) – Macroeconomic Statistical Indicators
Note: * Exchange rate attributes to discrepancy in GDP figures (US$ = 1,300 MNT).
� Mining sector contributes to nearly 20% of the country’s GDP composition
� Non-mining sectors, especially services industry, are also gaining momentum in the recent years
906
989
327
121
20
66
333
421
34
166
164
0 500 1,000 1,500
Agriculture, forestry and fishing
Mining and quarrying
Manufacturing
Electricity, gas, steam and air …
Water supply; sewerage, waste …
Construction
Wholesale and retail trade; …
Transportation and storage
Accommodation and food …
Information and communication
Financial and insurance activities
US$ mm
1,010
1,385
410
153
25
82
458
517
42
201
122
1,500
Agriculture, forestry and fishing
0 500 1,000
Manufacturing
Electricity, gas, steam and air …
Water supply; sewerage, waste …
Construction
Wholesale and retail trade; …
Transportation and storage
Accommodation and food …
Information and communication
Financial and insurance activities
US$ mm
M O
N G
O L
I A
I N
V E
S T
M E
N T
S
U M
MI T
2
0 1
1

Mongolian exports resume its upward trend after 2009 recession
Resources-driven economy of Mongolia is vulnerable to commodity prices volatility
1%
4%26%
11%
51%
1%
2%4%
US$3,190 mm in Mineral Exports (2011 I-X)
Refined copper & Copper alloysZinc
Copper
Iron
Bituminous coal
Molybdenium
Fluor spar
1%
5%
35%
11%
35%3%
8%
US$1,837 mm in Mineral Exports (2010 I-X)
Refined copper & Copper alloysZinc
Copper
Iron
Bituminous coal
Molybdenium
Fluor spar
2 0
1 1
5P R E S E N T A T I O N M A T E R I A L
Source: National Development and Innovations Committee (NDIC) & National Statistics Office (NSO) – Sept 2011 Bulletin
51%Gold
35%
2%
3% Gold
127
1394
68 14767
2466
83 14259
3430
78 76
0
500
1,000
1,500
2,000
2,500
3,000
3,500
4,000
UK China Russia Canada
US$ mmMongolia’s major exports destinations
2009 2010 2011 (I-X)
0
500
1,000
1,500
2,000
2,500
3,000
3,500
2000 2001 2002 2003 2004 2005 2006 2007 2008 2009 2010
US$ mmMining equipment and fuel imports contribute
to the surge in Mongolia’s trade deficit
Exports Imports
M O
N G
O L
I A
I N
V E
S T
M E
N T
S
U M
MI T
2
0 1
1

Inflation and currency outlooks
Annualized inflation is 10.8% with upside risk
� Generalized wage and price pressures from a booming economy, expansion in fiscal expenditures, and large government cash handout contribute to rising inflation.
� Given the overheating economy (20%+ GDP growth), rising policy rate measure (currently at 12.5%) is implemented to curb price increases.
� Yet, inflation is expected to reach 13% by 2011 year-end. Double-digit inflation is likely to prevail at least until 2013.
� BOM combats against inflationary pressure by 0
5
10
15
20
25
30
2006 2007 2008 2009 2010 2011 2012 2013 2014 2015 2016
% Percentage change in average consumer prices(2005 – 2016F)1
Annualized inflation
Upward trend in inflation
2 0
1 1
6P R E S E N T A T I O N M A T E R I A L
Source: 1) IMF estimates (September 2011)
2) Bank of Mongolia, Exchange Rates Statistics
� BOM combats against inflationary pressure by tightening monetary policy to ensure economic stability.
2006 2007 2008 2009 2010 2011 2012 2013 2014 2015 2016
1,000
1,100
1,200
1,300
1,400
1,500
1,600
1,700
2/1/2006 2/1/2007 2/1/2008 2/1/2009 2/1/2010 2/1/2011
MNT per US$ MNT vs USD (2006 – 2011)2
MNT vs US$
MNT – 13% appreciation against US$ in 2010, the world’s second best performing currency
Capital inflows and exports drive MNT
� Rising domestic consumption and demand for raw materials from industrialized countries contribute to MNT appreciation
� In 2010, coal exports increased 2.3 times to 16.6 mm tons, and iron exports increased 2.2 times to 3.5 mm tons.
� Further mild appreciation or FX stability is expected due to large capital inflows for major mining projects.
� With continued high real GDP growth, the real exchange rate will have to adjust, either through nominal appreciation or through inflation.
M O
N G
O L
I A
I N
V E
S T
M E
N T
S
U M
MI T
2
0 1
1
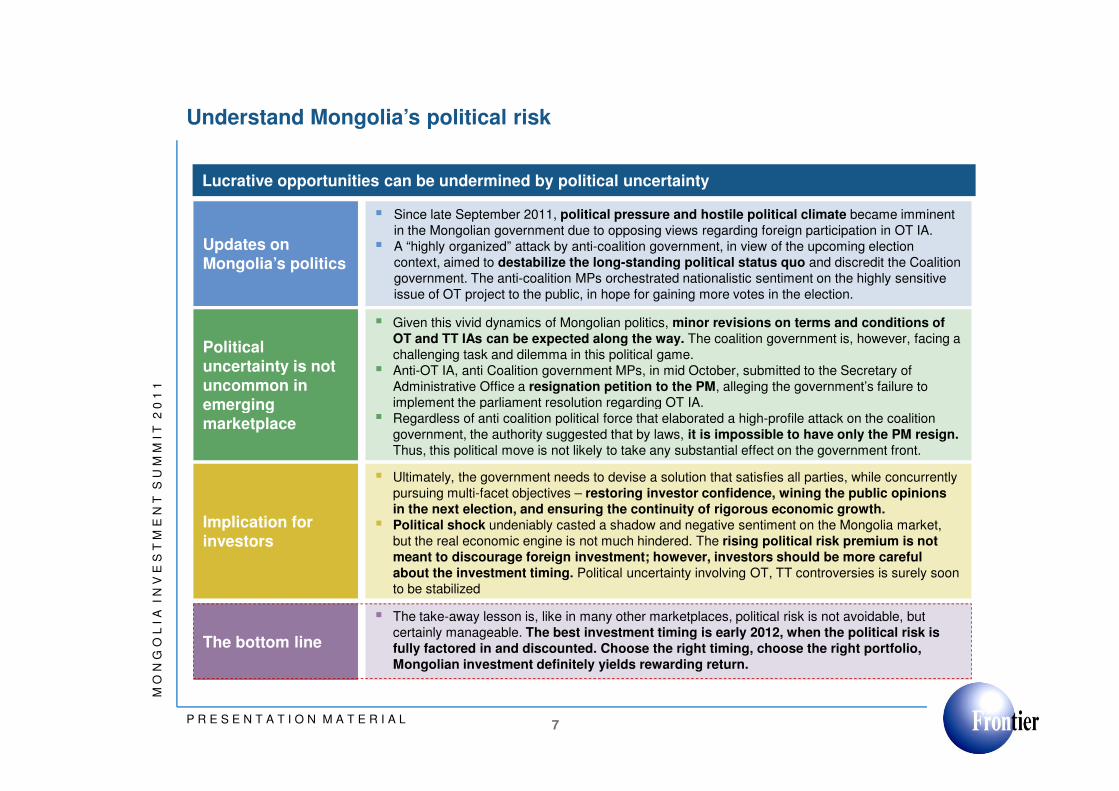
Understand Mongolia’s political risk
Lucrative opportunities can be undermined by political uncertainty
Updates on Mongolia’s politics
Political uncertainty is not uncommon in emerging
� Since late September 2011, political pressure and hostile political climate became imminent in the Mongolian government due to opposing views regarding foreign participation in OT IA.
� A “highly organized” attack by anti-coalition government, in view of the upcoming election context, aimed to destabilize the long-standing political status quo and discredit the Coalition government. The anti-coalition MPs orchestrated nationalistic sentiment on the highly sensitive issue of OT project to the public, in hope for gaining more votes in the election.
� Given this vivid dynamics of Mongolian politics, minor revisions on terms and conditions of OT and TT IAs can be expected along the way. The coalition government is, however, facing a challenging task and dilemma in this political game.
� Anti-OT IA, anti Coalition government MPs, in mid October, submitted to the Secretary of Administrative Office a resignation petition to the PM, alleging the government’s failure to implement the parliament resolution regarding OT IA.
2 0
1 1
7P R E S E N T A T I O N M A T E R I A L
emerging marketplace
implement the parliament resolution regarding OT IA. � Regardless of anti coalition political force that elaborated a high-profile attack on the coalition
government, the authority suggested that by laws, it is impossible to have only the PM resign. Thus, this political move is not likely to take any substantial effect on the government front.
Implication for investors
� Ultimately, the government needs to devise a solution that satisfies all parties, while concurrently pursuing multi-facet objectives – restoring investor confidence, wining the public opinions in the next election, and ensuring the continuity of rigorous economic growth.
� Political shock undeniably casted a shadow and negative sentiment on the Mongolia market, but the real economic engine is not much hindered. The rising political risk premium is not meant to discourage foreign investment; however, investors should be more careful about the investment timing. Political uncertainty involving OT, TT controversies is surely soon to be stabilized
The bottom line
� The take-away lesson is, like in many other marketplaces, political risk is not avoidable, but certainly manageable. The best investment timing is early 2012, when the political risk is fully factored in and discounted. Choose the right timing, choose the right portfolio, Mongolian investment definitely yields rewarding return.
M O
N G
O L
I A
I N
V E
S T
M E
N T
S
U M
MI T
2
0 1
1
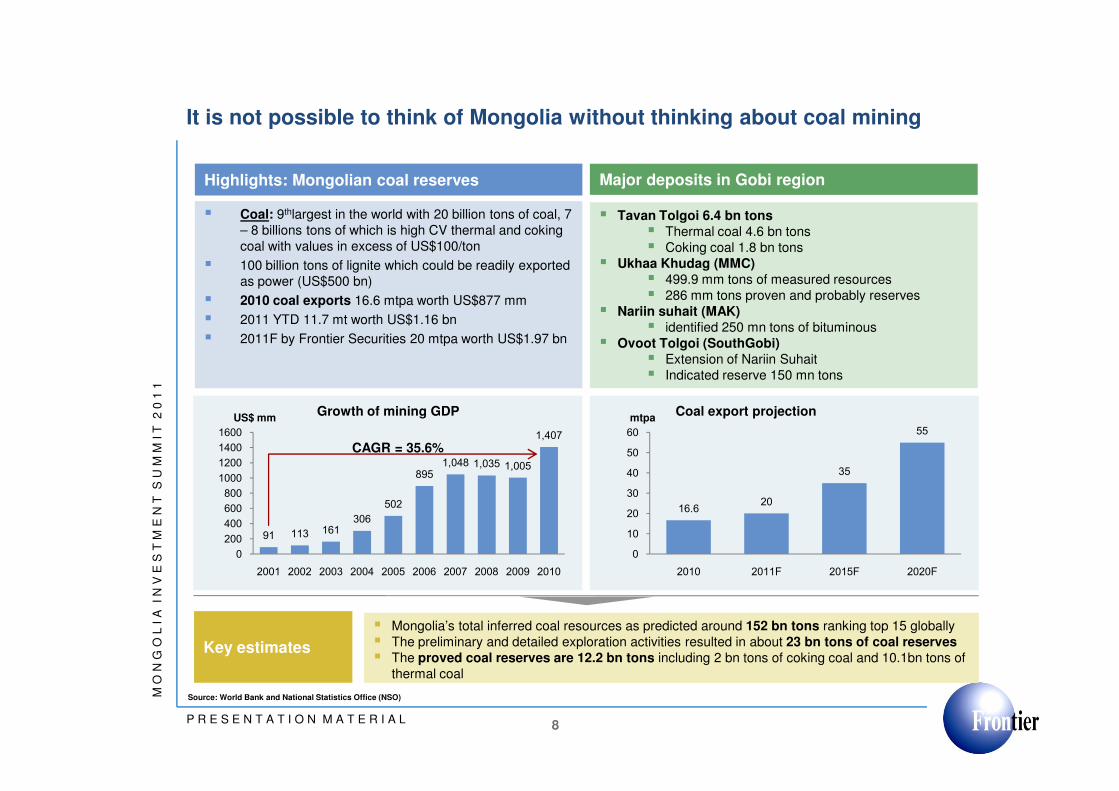
It is not possible to think of Mongolia without thinking about coal mining
Major deposits in Gobi region
� Tavan Tolgoi 6.4 bn tons � Thermal coal 4.6 bn tons� Coking coal 1.8 bn tons
� Ukhaa Khudag (MMC)� 499.9 mm tons of measured resources� 286 mm tons proven and probably reserves
� Nariin suhait (MAK)� identified 250 mn tons of bituminous
� Ovoot Tolgoi (SouthGobi)� Extension of Nariin Suhait� Indicated reserve 150 mn tons
Highlights: Mongolian coal reserves
� Coal: 9thlargest in the world with 20 billion tons of coal, 7 – 8 billions tons of which is high CV thermal and coking coal with values in excess of US$100/ton
� 100 billion tons of lignite which could be readily exported as power (US$500 bn)
� 2010 coal exports 16.6 mtpa worth US$877 mm
� 2011 YTD 11.7 mt worth US$1.16 bn
� 2011F by Frontier Securities 20 mtpa worth US$1.97 bn
2 0
1 1
8P R E S E N T A T I O N M A T E R I A L
Key estimates
� Mongolia’s total inferred coal resources as predicted around 152 bn tons ranking top 15 globally� The preliminary and detailed exploration activities resulted in about 23 bn tons of coal reserves� The proved coal reserves are 12.2 bn tons including 2 bn tons of coking coal and 10.1bn tons of
thermal coal
Source: World Bank and National Statistics Office (NSO)
16.620
35
55
0
10
20
30
40
50
60
2010 2011F 2015F 2020F
mtpaCoal export projection
91 113 161306
502
895
1,048 1,035 1,005
1,407
0
200
400
600
800
1000
1200
1400
1600
2001 2002 2003 2004 2005 2006 2007 2008 2009 2010
US$ mmGrowth of mining GDP
CAGR = 35.6%
M O
N G
O L
I A
I N
V E
S T
M E
N T
S
U M
MI T
2
0 1
1

Mineral assets’ geographical locations: an ultimate blessing
Mining sector is the driving force of resources-rich Mongolia
2 0
1 1
9P R E S E N T A T I O N M A T E R I A L
Coking coal Bituminous coal Sub-bituminous coal Lignite
Most developments located hereMost mining developments are located in South Gobi area
Source: The Mineral Resources Authority of Mongolia (MRAM)M O
N G
O L
I A
I N
V E
S T
M E
N T
S
U M
MI T
2
0 1
1
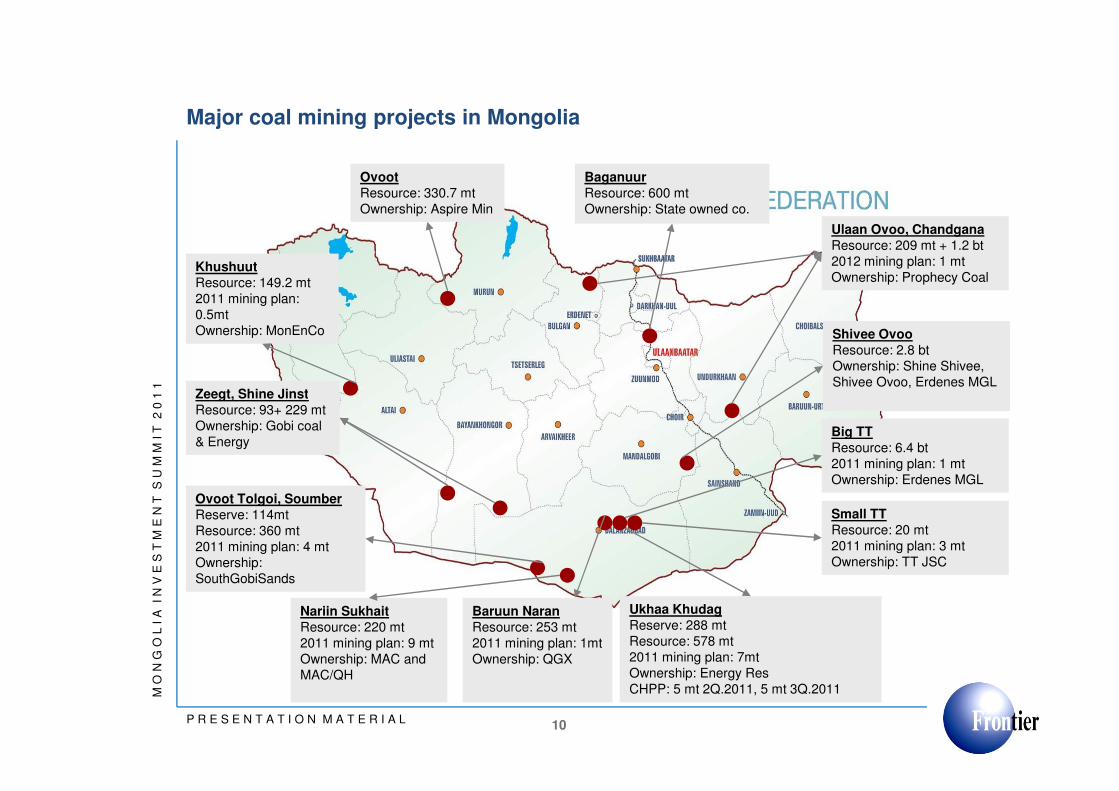
Major coal mining projects in Mongolia
KhushuutResource: 149.2 mt2011 mining plan: 0.5mtOwnership: MonEnCo
Zeegt, Shine Jinst
OvootResource: 330.7 mtOwnership: Aspire Min
Ulaan Ovoo, ChandganaResource: 209 mt + 1.2 bt2012 mining plan: 1 mtOwnership: Prophecy Coal
Shivee OvooResource: 2.8 btOwnership: Shine Shivee, Shivee Ovoo, Erdenes MGL
BaganuurResource: 600 mtOwnership: State owned co.
2 0
1 1
10P R E S E N T A T I O N M A T E R I A L
Zeegt, Shine JinstResource: 93+ 229 mtOwnership: Gobi coal & Energy
Ovoot Tolgoi, SoumberReserve: 114mtResource: 360 mt2011 mining plan: 4 mtOwnership: SouthGobiSands
Nariin SukhaitResource: 220 mt2011 mining plan: 9 mtOwnership: MAC and MAC/QH
Baruun NaranResource: 253 mt2011 mining plan: 1mtOwnership: QGX
Ukhaa KhudagReserve: 288 mtResource: 578 mt2011 mining plan: 7mtOwnership: Energy ResCHPP: 5 mt 2Q.2011, 5 mt 3Q.2011
Small TTResource: 20 mt2011 mining plan: 3 mtOwnership: TT JSC
Big TTResource: 6.4 bt2011 mining plan: 1 mtOwnership: Erdenes MGL
M O
N G
O L
I A
I N
V E
S T
M E
N T
S
U M
MI T
2
0 1
1
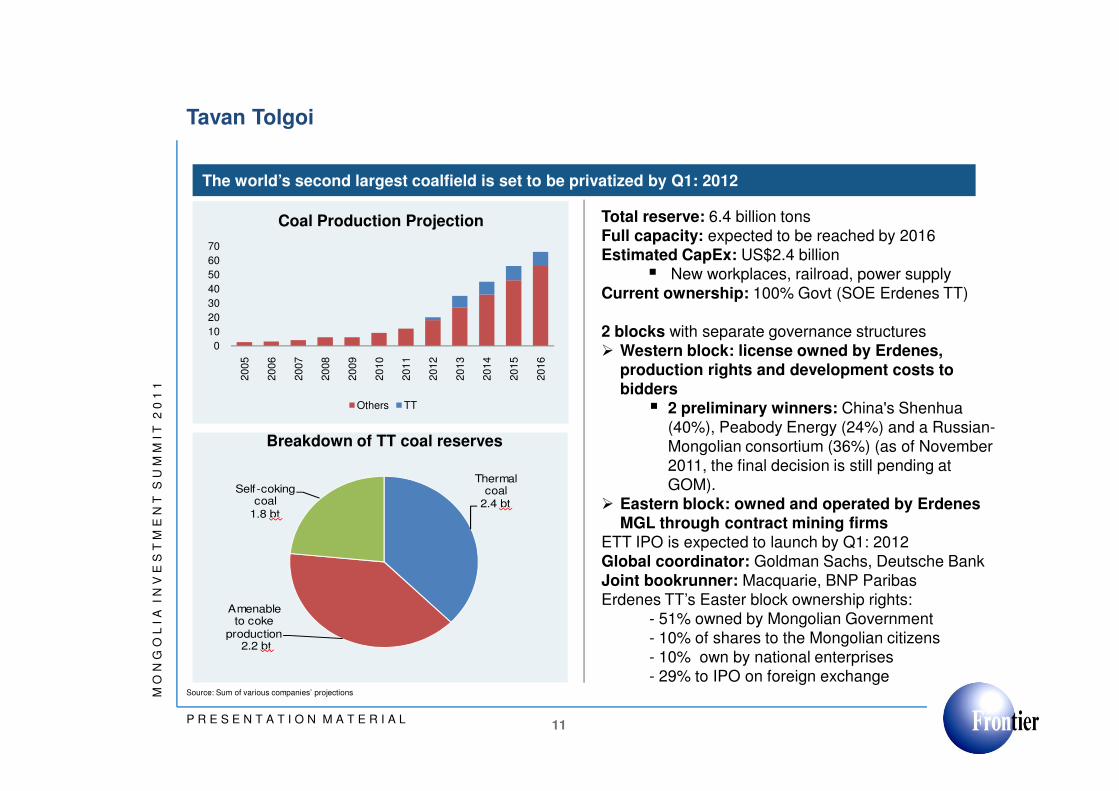
Tavan Tolgoi
The world’s second largest coalfield is set to be privatized by Q1: 2012
Total reserve: 6.4 billion tonsFull capacity: expected to be reached by 2016Estimated CapEx: US$2.4 billion
� New workplaces, railroad, power supplyCurrent ownership: 100% Govt (SOE Erdenes TT)
2 blocks with separate governance structures� Western block: license owned by Erdenes,
production rights and development costs to bidders
�
0
10
20
30
40
50
60
702005
2006
2007
2008
2009
2010
2011
2012
2013
2014
2015
2016
Coal Production Projection
0
10
20
30
40
50
60
702005
2006
2007
2008
2009
2010
2011
2012
2013
2014
2015
2016
Coal Production Projection
2 0
1 1
11P R E S E N T A T I O N M A T E R I A L
bidders� 2 preliminary winners: China's Shenhua
(40%), Peabody Energy (24%) and a Russian-Mongolian consortium (36%) (as of November 2011, the final decision is still pending at GOM).
� Eastern block: owned and operated by ErdenesMGL through contract mining firms
ETT IPO is expected to launch by Q1: 2012Global coordinator: Goldman Sachs, Deutsche BankJoint bookrunner: Macquarie, BNP ParibasErdenes TT’s Easter block ownership rights:
- 51% owned by Mongolian Government - 10% of shares to the Mongolian citizens- 10% own by national enterprises- 29% to IPO on foreign exchange
Thermal coal
2.4 bt
Amenable to coke
production 2.2 bt
Self-coking coal
1.8 bt
Source: Sum of various companies’ projections
Others TT
Breakdown of TT coal reserves
Others TT
M O
N G
O L
I A
I N
V E
S T
M E
N T
S
U M
MI T
2
0 1
1

Oyu Tolgoi (66% owned by Ivanhoe Mines)
0
0.2
0.4
0.6
0.8
1
1.2
Ou
nces (
Mil
lio
ns)
OT Gold Production Projection
0
200
400
600
800
1000
1200
1400
1600
1800
Lb
s. (M
illi
on
s)
OT Copper Production Projection
I T
2
0 1
1
12P R E S E N T A T I O N M A T E R I A L
Source: Ivanhoe Mines IDP-10 & Frontier Securities’s projections
Total Reserve: 81 billion lbs. of copper, 46 million oz of goldExpected production: 2013 Projected investment: US$4.6 billion in pre-production capitalNPV at today’s metal prices: US$15 billionBenefits/contribution to Mongolian economy:� average 34% increase in real GDP over 30 years� average 71.6% increase in export� average 10.3% increase in employment� up to 48 thousand new workplaces over the project life
time
Oyu Tolgoi Investment Agreement (In full legal effect since March 2010)� Integrated Development Plan is released� Stabilized custom regime� Abolishment of Windfall tax� Government ownership 34% � Private investment in auto roads� Loss rollover period of 4-8 years� Stabilized tax regime� 95% Mongolian employees
OT has the mineral resources to become one of the world’s top 3 copper-gold producers
M O
N G
O L
I A
I N
V E
S T
M E
N T
S
U M
MI T
2
0 1
1
Disclaimer
Information in this presentation does not constitute invitation or application or investment advice or service provisionfor sale and purchase of any stock, future, option or other financial product by Frontier Securities and its relatedcompany. This presentation is not the recommendation to make a specific trade and guarantee for a specific productwhether it is appropriate or adequate for buyers. Also, although this presentation is prepared from the variousinformation sources we deem reliable, we shall not guarantee their accuracies and rightness. Moreover, pastperformances do not suggest or guarantee for the future results. Thus, the Company shall not take responsibility forthe loss out of the decision based on its content. When making a contract on trades using the information in thispresentation, please consult with your business advisor, lawyer, tax & accounting advisor about investment productprices, compatibility, value or other items beforehand. Information and services in this presentation and its provision orusage shall not contradict to the applied laws and work guidelines or regulations of self regulating organization or shallnot be provided in the legal frame which does not admit such information and its provision; in the legal frame naturalperson or legal body shall not use those information and service. Some of the products and services in thispresentation may not be applied for all the legal frames or not all customers may not use. Also, the Company may
2 0
1 1
P R E S E N T A T I O N M A T E R I A L
presentation may not be applied for all the legal frames or not all customers may not use. Also, the Company maychange or delete information or others items in this presentation without previous notice.
Contact:Frontier SecuritiesEmail: [email protected]: +976-70119999Address: #705, Blue Sky TowerPeace Avenue 17, 1st khorooSukhbaatar, District,Ulaanbaatar, Mongolia
M O
N G
O L
I A
I N
V E
S T
M E
N T
S
U M
MI T
2
0 1
1