081516_Just how good is active portfolio management compared_f ...
48
Just how good is active portfolio management compared to buy-and-hold? Goal: demonstrate added value of actively managed portfolios with years of theoretical results and months of actual results Educational: nothing being sold Past performance does not insure future performance. Investors may lose principal in stock and bond market. Hypothetical results may have limitations- see disclosure inside. 8/15/2016: Porter Library, Westlake, OH Gary J. Harloff, Ph.D. Harloff Capital Management (HCM), RIA firm 795 Sharon Drive, Suite 226, Westlake, OH 44145 440-871-7278
Transcript of 081516_Just how good is active portfolio management compared_f ...
Just how good is active portfolio management compared to buy-and-hold?
Goal: demonstrate added value of actively managed portfolios with years of theoretical results and months of actual results
Educational: nothing being sold Past performance does not insure future performance. Investors may lose principal in stock and bond
market. Hypothetical results may have limitations- see disclosure inside.
8/15/2016: Porter Library, Westlake, OH
Gary J. Harloff, Ph.D.
Harloff Capital Management (HCM), RIA firm 795 Sharon Drive, Suite 226, Westlake, OH 44145
440-871-7278

Outline • Gary biography
• Market timing in U.S.- current buy/sells
• What Harloff Capital does
• Investor concerns
• 60/40 and bond “insurance” cost
• Buy-and hold performance
• Timing approach to asset & sector allocation
• University Beta Strategies™: Harloff Capital strategies: live and hypothetical returns
• University Beta Strategies™ current positions
• Summary & conclusions
Gary Harloff, Ph.D. bio
• Founder of Harloff Capital Management • Ph.D. – can do original research • 27 years in AeroSpace and Energy research including 10 years at NASA in
CFD/Propulsion, 2 patents, 2 international papers • 22 years in portfolio management as RIA firm: 1994 - current • 1992, 1993 placed in top 5,3 respectively in national year-long US
Investing Championships • In top 5 US market timers – Timer Digest 12/04 to 12/14 – 1, 3, 5, 8, and
10 years • Original market timing research began about 1975 • Dynamic Asset Allocation: Beyond Buy-and-Hold, Stocks and commodities:
Jan 1998; similar concept as here • 168% net gain in 1999, mutual fund switching, highest MoniResearch
recorded in previous 15 years • Developed University Beta Strategies™ in February 2016


Recent Timer Digest Top Ten Timers (of about 100+)
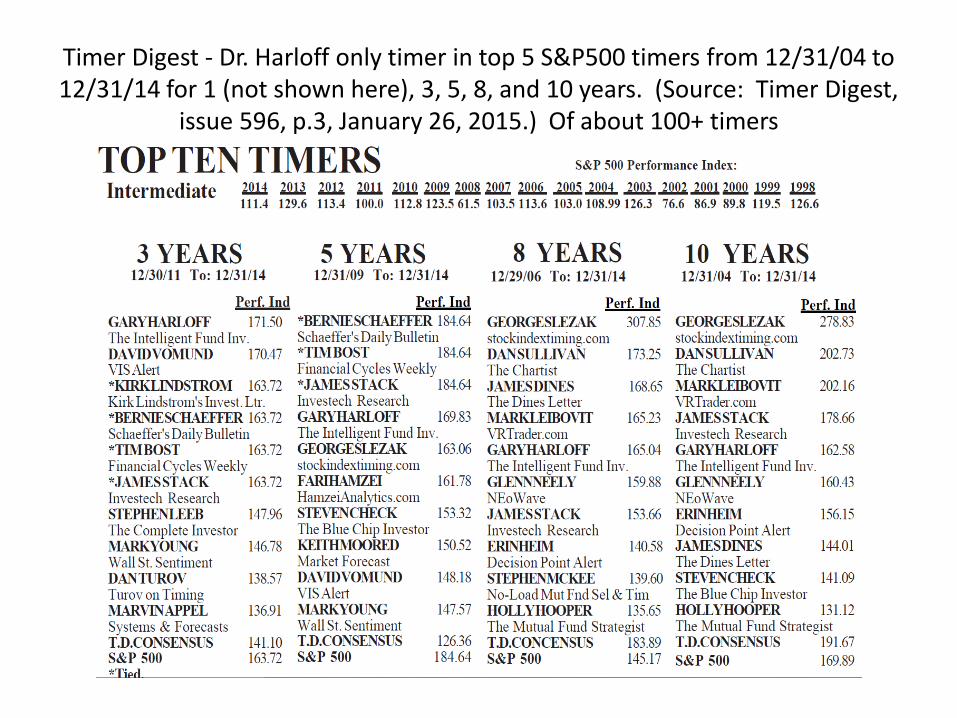
Timer Digest - Dr. Harloff only timer in top 5 S&P500 timers from 12/31/04 to 12/31/14 for 1 (not shown here), 3, 5, 8, and 10 years. (Source: Timer Digest,
issue 596, p.3, January 26, 2015.) Of about 100+ timers

6 Bulls, 3 Bears, and 1 Neutral: top 10 S&P500 timers (source Timer Digest 8-10-16)
1. Barry Rosen June 30, Buy signal. However, he identified a prospective top formation that may be completed within several trading days.
2. Fari Hamzei August 1, Sell signal. He has retained a defensive posture in response to some further expansion of negative divergences.
3. Hitesh Shah July 8, Buy signal. His S&P 500 index target for the current phase of advance remains in the 2250 area.
4. Stan Harley August 9, Sell signal from a previous Buy on June 22. He has shifted his time cycle conclusion to align with other indicators that favor a correction.
5. Gary Harloff May 31, Buy signal. His most recent forecast included the probability of additional demand for stocks as investors reduce fixed income exposure.
6. David Luciano February 1, Buy signal. He noted the development of a positive chart formation ahead of last Friday's July Employment Report.
7. Stephen Leeb January 12, Buy signal. He highlighted the potentially favorable influence on commodity-related stocks from economically-driven demand in China.
8. Michael Cintolo July 8, Buy signal. He said a pullback remains possible; but key timing indicators remain bullish.
9. Tim Ord August 5, Neutral signal. He noted an opposition between proprietary indicators that suggests limited potential for the market in either direction.
10. George Slezak August 1, Sell signal. He said a quick 4% decline from current levels would likely confirm a change in trend.
What HCM Does- Portfolio Management with New Tactical Asset Allocation Strategies
• Manage retirement and taxable portfolios - individuals and companies
• Discretionary authority – not stock broker
• Quantitative portfolio management beyond common planner-portfolios and technical analysis means
• Original strategies, developed by a Ph.D. over many years, adapt portfolios with market conditions

Investor concerns
• Market volatility
• Funding retirement
• Investment risk: most advisors tell you to stay the course, … no matter what
• Where to put money: most advisors sell winners and buy losers once or twice a year
• 60/40 typical asset allocation…. why?
• Fear of investing, not making smart choices
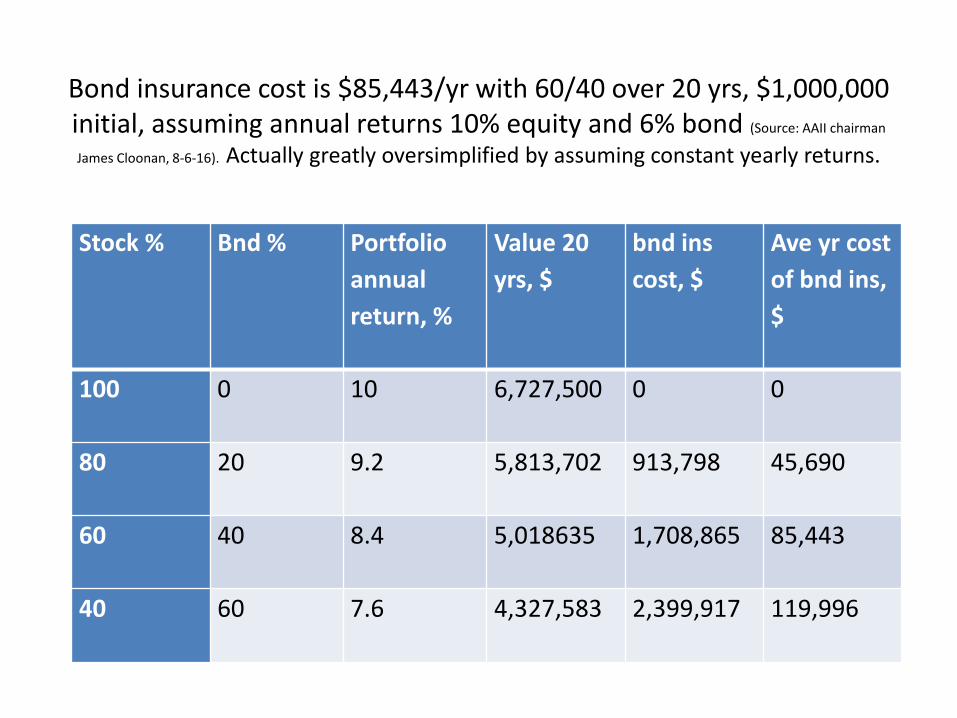
Bond insurance cost is $85,443/yr with 60/40 over 20 yrs, $1,000,000 initial, assuming annual returns 10% equity and 6% bond (Source: AAII chairman
James Cloonan, 8-6-16). Actually greatly oversimplified by assuming constant yearly returns.
Stock % Bnd % Portfolio
annual
return, %
Value 20
yrs, $
bnd ins
cost, $
Ave yr cost
of bnd ins,
$
100 0 10 6,727,500 0 0
80 20 9.2 5,813,702 913,798 45,690
60 40 8.4 5,018635 1,708,865 85,443
40 60 7.6 4,327,583 2,399,917 119,996
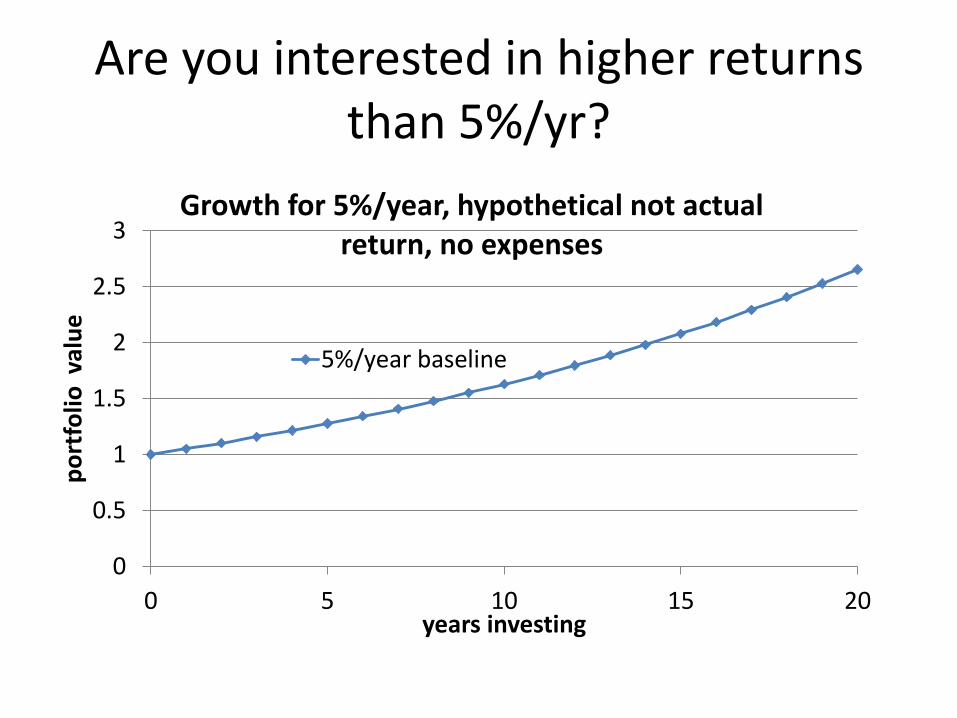
Are you interested in higher returns than 5%/yr?
0
0.5
1
1.5
2
2.5
3
0 5 10 15 20
po
rtfo
lio v
alu
e
years investing
Growth for 5%/year, hypothetical not actual return, no expenses
5%/year baseline
Does an extra 10 to 20%/yr interest you?
• Buy-and-hold has conditioned investors to think in terms of 1 to 7 % net annual return
• Adding 10 to 20% per year could give a live style change over 20 years
0
5
10
15
20
25
30
35
0 5 10 15 20
po
rtfo
lio m
ult
iplie
r
years investing
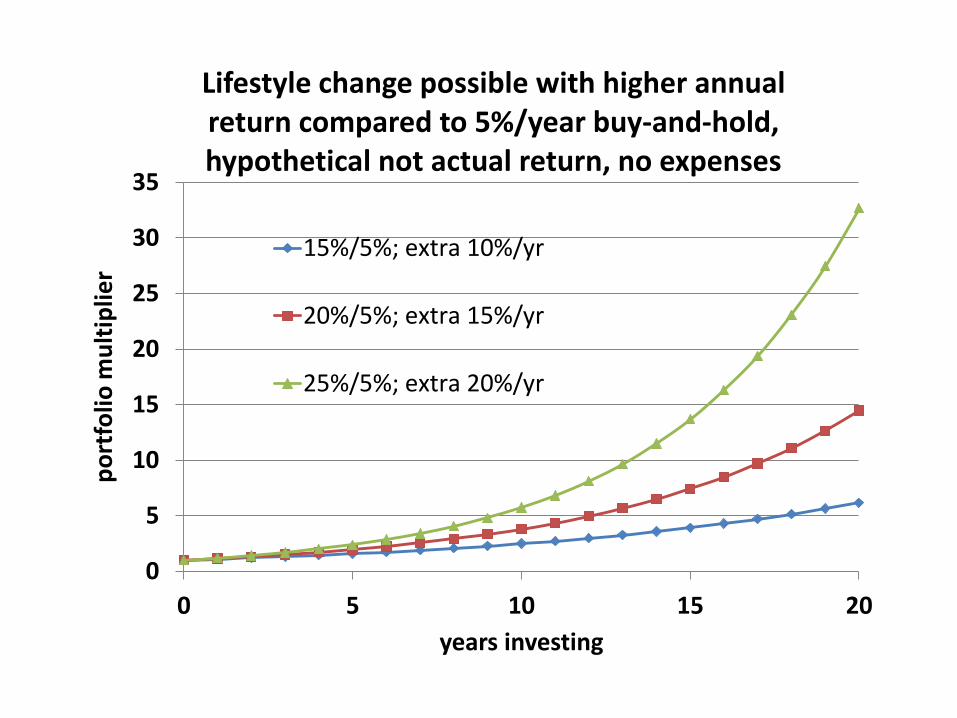
Lifestyle change possible with higher annual return compared to 5%/year buy-and-hold, hypothetical not actual return, no expenses
15%/5%; extra 10%/yr
20%/5%; extra 15%/yr
25%/5%; extra 20%/yr
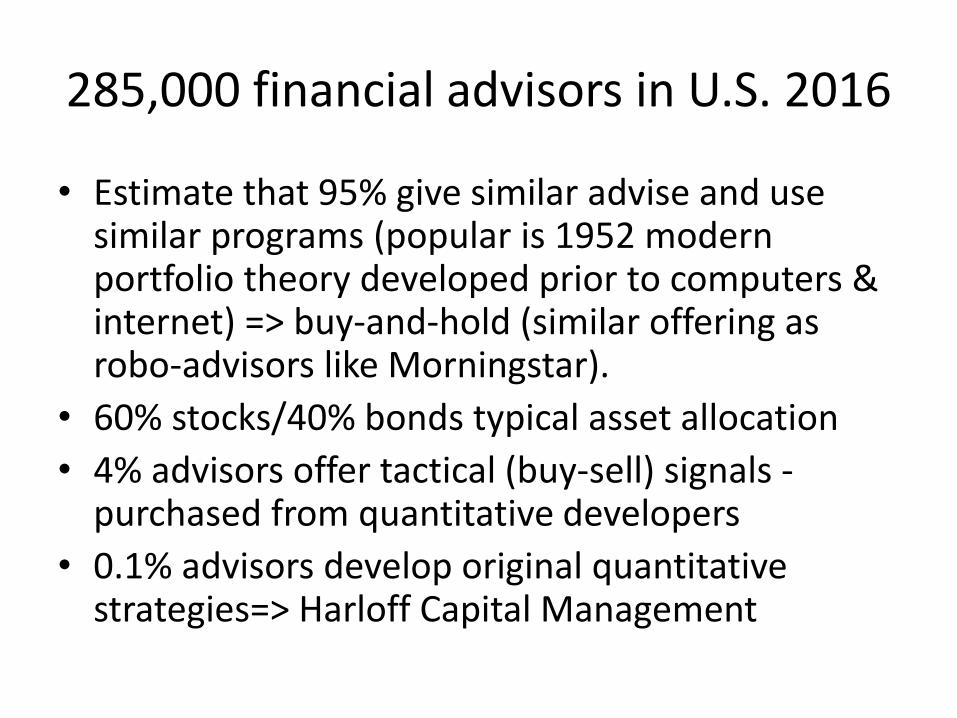
285,000 financial advisors in U.S. 2016
• Estimate that 95% give similar advise and use similar programs (popular is 1952 modern portfolio theory developed prior to computers & internet) => buy-and-hold (similar offering as robo-advisors like Morningstar).
• 60% stocks/40% bonds typical asset allocation
• 4% advisors offer tactical (buy-sell) signals -purchased from quantitative developers
• 0.1% advisors develop original quantitative strategies=> Harloff Capital Management
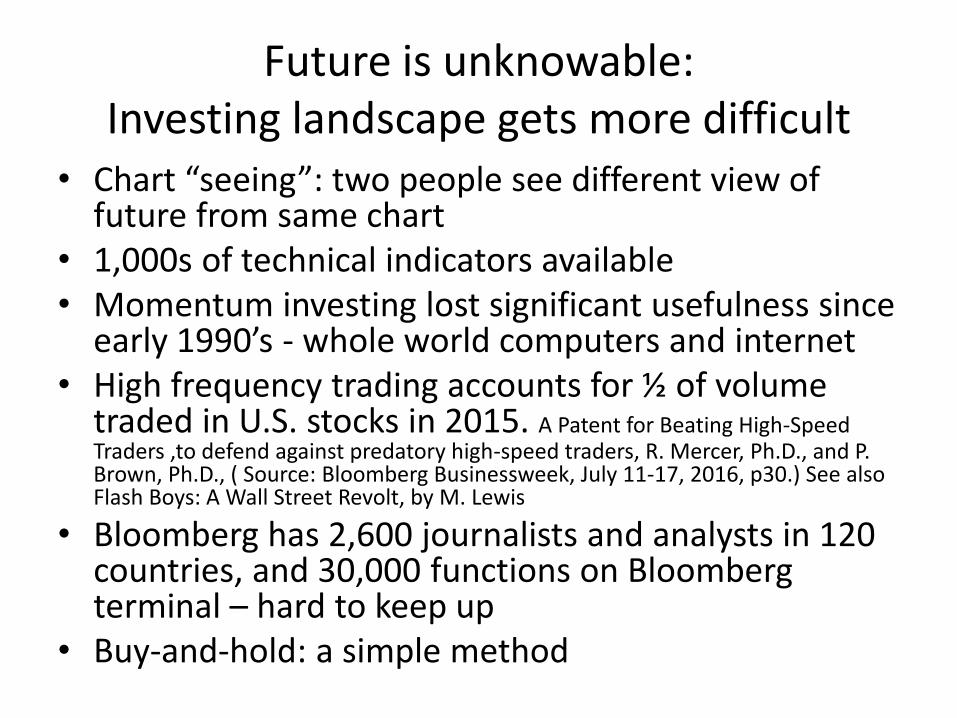
Future is unknowable: Investing landscape gets more difficult
• Chart “seeing”: two people see different view of future from same chart
• 1,000s of technical indicators available • Momentum investing lost significant usefulness since
early 1990’s - whole world computers and internet • High frequency trading accounts for ½ of volume
traded in U.S. stocks in 2015. A Patent for Beating High-Speed Traders ,to defend against predatory high-speed traders, R. Mercer, Ph.D., and P. Brown, Ph.D., ( Source: Bloomberg Businessweek, July 11-17, 2016, p30.) See also Flash Boys: A Wall Street Revolt, by M. Lewis
• Bloomberg has 2,600 journalists and analysts in 120 countries, and 30,000 functions on Bloomberg terminal – hard to keep up
• Buy-and-hold: a simple method
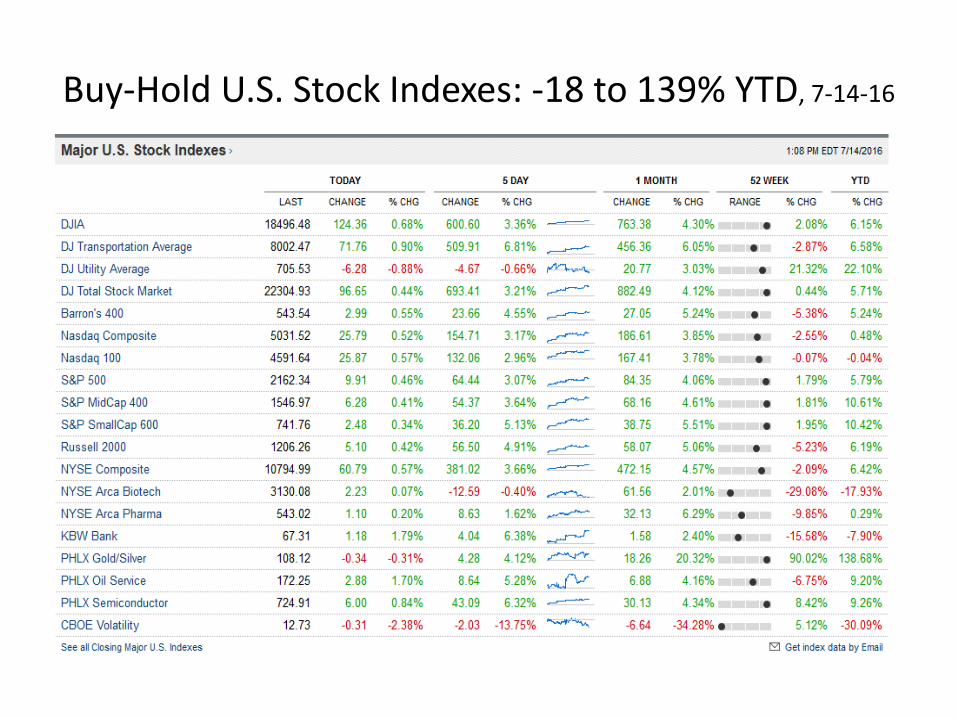
Buy-Hold U.S. Stock Indexes: -18 to 139% YTD, 7-14-16
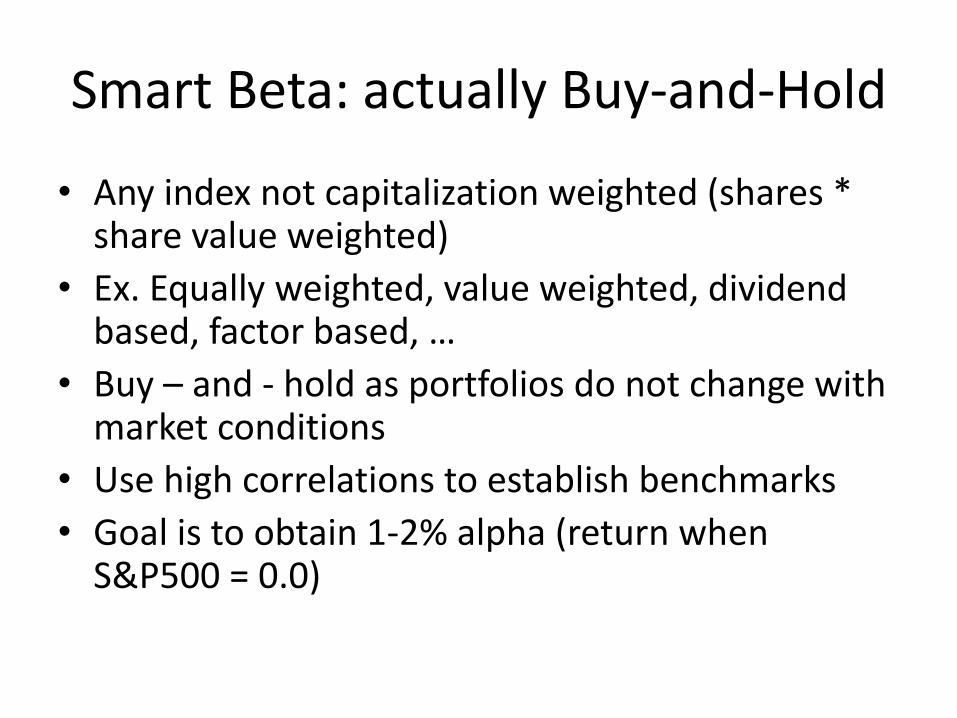
Smart Beta: actually Buy-and-Hold
• Any index not capitalization weighted (shares * share value weighted)
• Ex. Equally weighted, value weighted, dividend based, factor based, …
• Buy – and - hold as portfolios do not change with market conditions
• Use high correlations to establish benchmarks
• Goal is to obtain 1-2% alpha (return when S&P500 = 0.0)

Investment return guesses
• 0.25%/yr CD national average of top 50 banks as of 7/6/16 (Source:
AAII)
• To 7%/yr fixed annuities
• To 10%/yr variable annuities
• To 10%/yr stock market investing
• To 12%/yr bond investing in previous decade of interest rate drop
• Goal is greater than 12%/yr for University Beta Strategies™

Interest rates peaked in 1981 and in 2016 10- year
U.S. Treasury rates are under 2%; rates to rise soon

3 Asset Allocation Approaches
• Strategic: buy-and-hold (ex. 60% equity & 40% bonds) – once or twice per year rebalance to sell winners & buy losers
• Tactical: change weights by large increments between a few asset classes – based on market conditions, ex. business cycle sector rotation or market timing
• Dynamic: shift capital among several asset classes depending on market conditions based on quantitative indicator or market timing

Approaches to active management
• Technical analysis or chart seeing – not repeatable and not quantifiable. Joe Fabitz interprets charts differently than you.
• Discretionary portfolios (rank and sort) – not repeatable and not quantifiable
• Stock picking; stocks more volatile than funds
• Employ no-load funds or ETFs: no commissions
• Dynamic asset allocation- Gary Harloff 1998 article: market timing of fund pairs

Return vs Risk, Gary Harloff – Stocks & Commodities publication, 1-1998
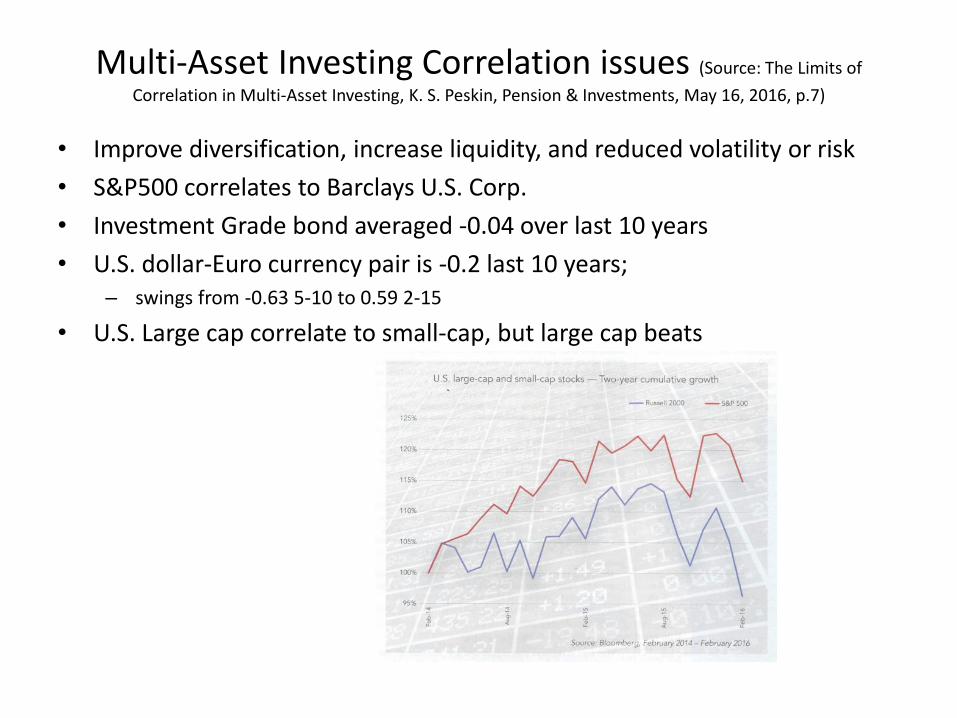
Multi-Asset Investing Correlation issues (Source: The Limits of
Correlation in Multi-Asset Investing, K. S. Peskin, Pension & Investments, May 16, 2016, p.7)
• Improve diversification, increase liquidity, and reduced volatility or risk
• S&P500 correlates to Barclays U.S. Corp.
• Investment Grade bond averaged -0.04 over last 10 years
• U.S. dollar-Euro currency pair is -0.2 last 10 years; – swings from -0.63 5-10 to 0.59 2-15
• U.S. Large cap correlate to small-cap, but large cap beats

University Beta Strategies™
• Harloff Capital developing concept since 1975
• February 2016 working
• University Beta smarter than Smart Beta
• Market timing concept applied individually to asset and sector classes
• Currently: 1) equity, 2) government bond, 3) high yield bond, 4) energy, 5) gold, 6) emerging market – equity, and 7) U.S. dollar

University Beta Strategies™ basics
• Use timer to select long or inverse asset class/ sector funds
• Only a few constants and freeze them
• Do better than buy-hold, static 60% equities and 40% bonds
• select long/inverse equities and bonds depending on market conditions
• Combine strategies to increase return and reduce risk: multi-asset class strategy
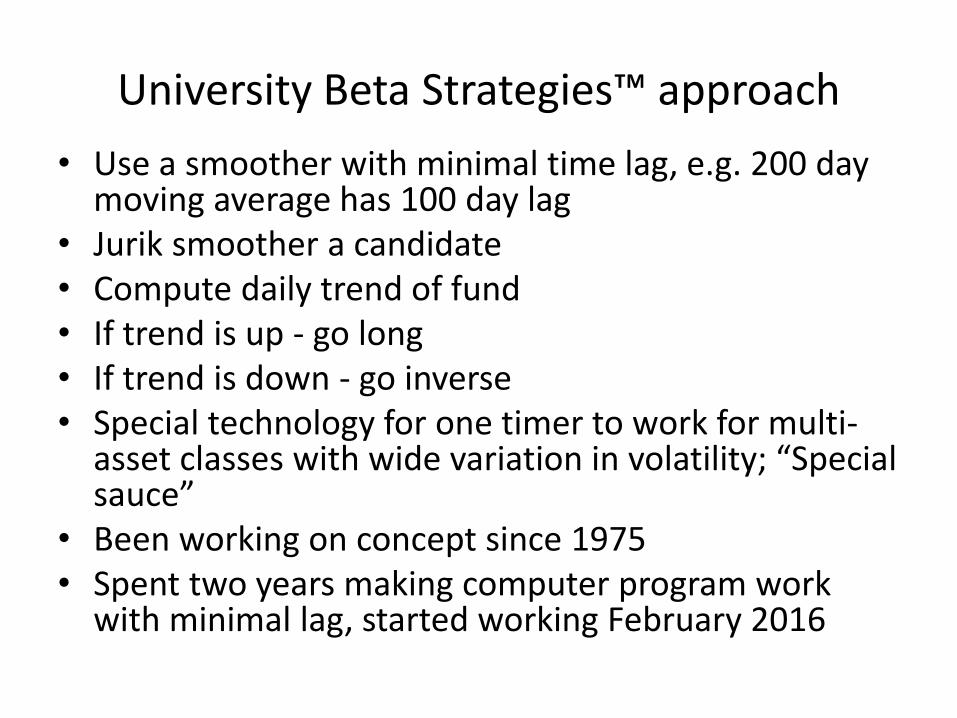
University Beta Strategies™ approach
• Use a smoother with minimal time lag, e.g. 200 day moving average has 100 day lag
• Jurik smoother a candidate • Compute daily trend of fund • If trend is up - go long • If trend is down - go inverse • Special technology for one timer to work for multi-
asset classes with wide variation in volatility; “Special sauce”
• Been working on concept since 1975 • Spent two years making computer program work
with minimal lag, started working February 2016

University Beta Strategies™: actual performance without fees, -2% to 39% YTD (past performance does not insure future performance)
Strategy Mar-16 Apr-16 May-16 Jun-16 Jul-16 YTD
UBS equity 10.17 0.45 2.49 -1.88 8.54 20.79
UBS Gov Bd -0.13 -2.83 -1.46 9.31 3.09 7.76
UBS HI Yld 2.69 0.86 -1.59 2.50 1.50 6.04
UBS Energy na na -2.09 1.91 -1.46 -1.68
UBS Gold na na na 23.22 12.83 39.03
UBS Em Mk
Eq
na na na na 6.59 6.59
UBS US
Dollar
na na na na -1.19 -1.19
S&P500 6.60 0.27 1.53 0.09 3.56 12.49

8 Tactical University Beta Strategies™ hypothetical and actual gross performance June ‘07 to June
‘16, and S&P500 buy-and-hold. Note live dates. Additional information available. Disclosure: source- Harloff
Capital Management, May 1995 available (start date range here selected above) to June 2016. University Beta Strategies™: Strategy returns after 0.0% advisory and 0.0% other fees. Maximum
advisory fee of 2.96%/yr will lower returns about this much/yr. and brokerage fees, if any, would further reduce annual returns. The S&P500 index results are not investible. Results are believed to
be accurate, are not guaranteed, and are subject to updating without notice. UBSEQ is live 2-24-16, UBSGB is live 2-24-16, UBSHI is live 3-2-16, and Blend of UBSEQ and UBSGB is live 4-11-
16, UBSEN live 5-17-16, UBSGLD live 5-17-16, UBSEME live 6-13-16, UBSDL live 6-29-16. Results reflect hypothetical, except as noted, and back-tested results that have inherent limitations
including: (1) strategy results prior to live dates do not reflect results of actual trading and were achieved by retroactive application of frozen mathematical models with use of hindsight, (2) material
market and economic factors are reflected by comparison with S&P500 (without dividends or expenses), and (3) clients may experience materially different results going forward. Investors may
lose principal in the stock/bond markets. Reported live results for Equity and Government bond begin March 2016, High Yield March 2016 result is for partial month beginning 3-2-1, and Blend 2
April actual performance is for 4-11-16 to 4-30-16. Past performance does not insure future results.
Strategy 1 yr.
cagr %
3 yr cagr
%
3 yr std
dev %
3 yr
Sharpe(1)
3 yr
alpha
3 yr
beta
Incep
cagr %
Max
drw dn
MAR
cagr/mdd
B-H S&P500 7-05 to 6-16 1.7 9.3 11.1 0.7 0.0 1.0 5.3 -52.6 -0.1
B-H S&P500 6-07 to 6-16 1.7 9.3 11.1 0.7 0.0 1.0 3.5 -52.6 -0.1
B-H S&P500 12-10 to 6-16 1.7 9.3 11.1 0.7 0.0 1.0 10.9 -26.3 -0.4
UBS Equity 6-07 to 6-16.
Live 2-24-16.
27.2 17.6 11.2 1.5 15.5 0.1 34.2 -17.3 -2.0
UBS Gov Bnd 6-07 to 6-16.
Live 2-24-16.
24.4 24.3 13.4 1.7 30.6 -0.4 31.9 -9.7 -3.3
Blend 2: Eq + Gov Bnd 6-07
to 6-16. Live 4-11-16
27.3 21.6 9.4 2.2 23.2 -0.2 33.5 -10.7 -3.1
UBS Hi Yld 6-07 to 6-16.
Live 3-2-16.
25.4 12.4 10.6 1.1 12.3 -0.1 20.9 -13.7 -1.5
UBS Energy7-05 to 6-16.
Live 5-17-16.
15.5 13.1 12.1 1.0 15.2 -0.1 35.6 -9.4 -3.8
UBS Gld 7-05 to 6-16.
Live 5-17-16.
70.5 44.8 27.1 1.6 51.5 -0.2 34.9 -14.6 -2.4
UBS Em M Eq, 12-10 to
6-16. Live 6-13-16.
105.7 121.1 33.8 3.6 128.3 0.3 112.0 -13.9 -8.0
UBS US DL 7-05 to 6-16.
Live 6-29-16.
36.5 40.4 13.2 3.0 38.5 0.2 44.0 -8.3 -5.3

University Beta Strategies™: Equity. Live net performance 02/23/16 to 8/05/16
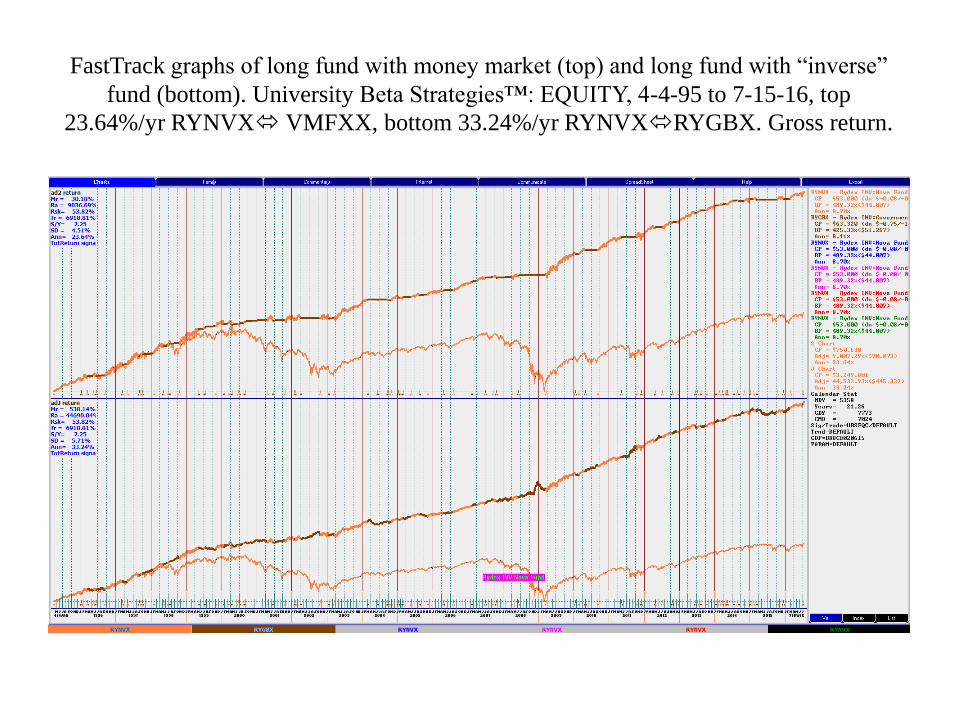
FastTrack graphs of long fund with money market (top) and long fund with “inverse”
fund (bottom). University Beta Strategies™: EQUITY, 4-4-95 to 7-15-16, top
23.64%/yr RYNVX VMFXX, bottom 33.24%/yr RYNVXRYGBX. Gross return.

University Beta Strategies™: Gold. Live net performance 05/17/16 to 8/05/16

Fig.5. Harloff Capital Management University Beta Strategies™: GOLD, 6-27-05 to 7-15-16, 440-871-7278; top 32.70%/yr RYPMX VMFXX, bottom 36.11%/yr RYPMXRYSBX. Gross return.

• Have additional graphs of University Beta Strategies should you wish to see them

University Beta Strategies™ Current Positions (8-11-16)
• Buy (long): – Equity
– Government bonds
– High yield bonds
– Energy
– Gold
– Emerging Market Equity
• Sell (inverse): – U.S. Dollar

Summary & Conclusions • Buy-and-hold is simple and basis of nearly all managed
accounts • Possibly 95% of advisors have same offering as Morningstar
robo-advisor • Future is not knowable with chart “seeing” • Technical analysis is less useful now with thousands of
indicators to assess, and millions of investors on internet • Quantitative tactical management, discussed here, is
difficult and time consuming • Harloff Capital University Beta Strategies™ promising • Demonstrated added value over buy-and-hold of actively
managed portfolios with years of theoretical results and months of actual results
• Past performance does not insure future performance • Investors in stock & bond market may lose principal

Questions ?
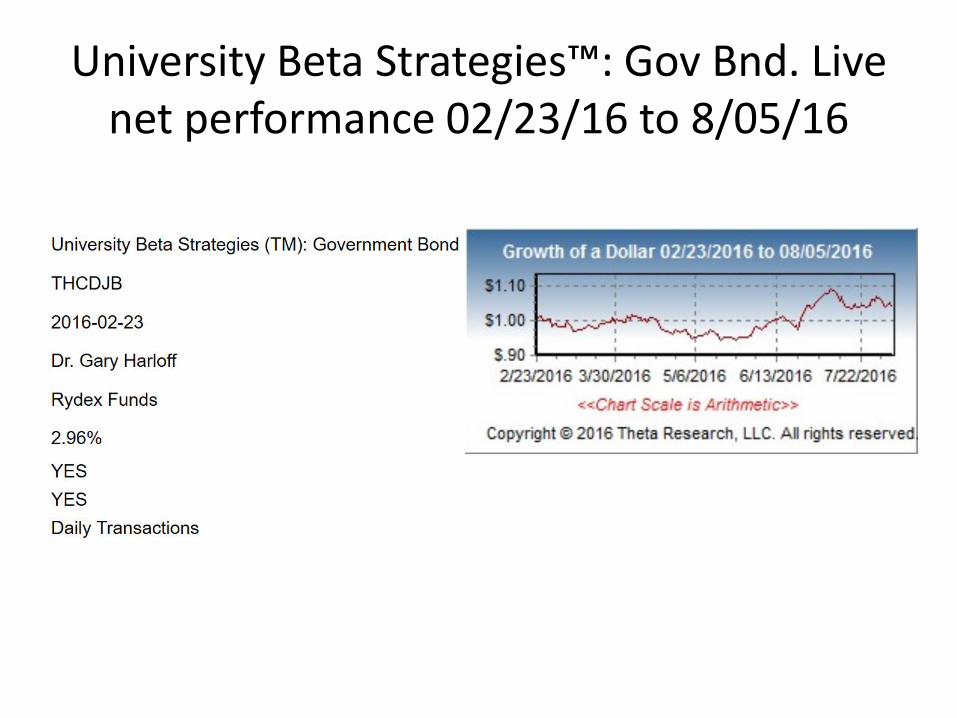
University Beta Strategies™: Gov Bnd. Live net performance 02/23/16 to 8/05/16
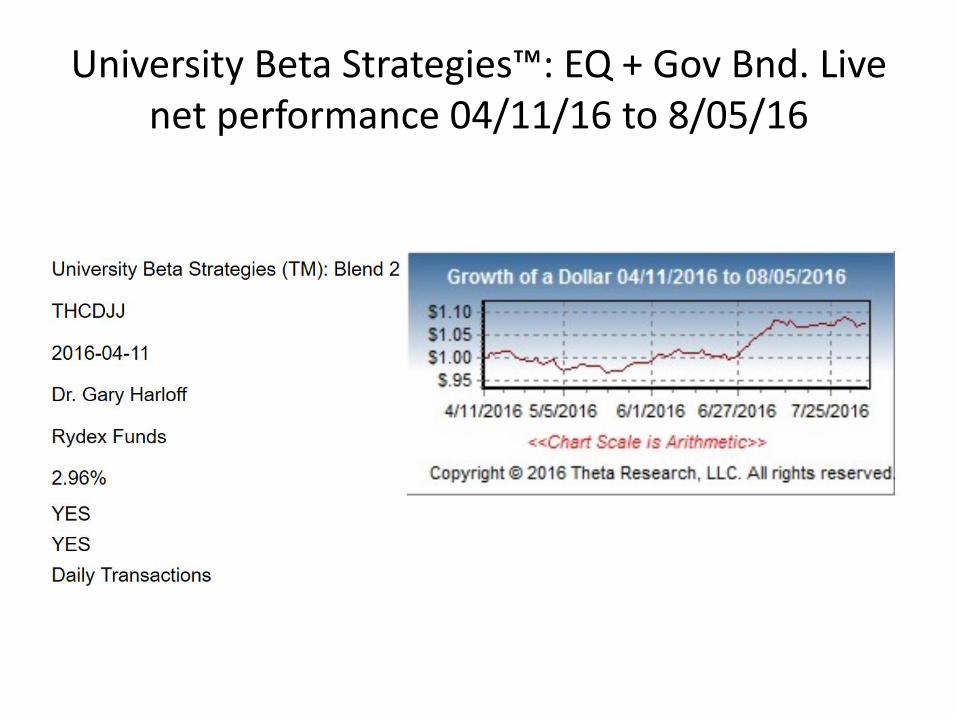
University Beta Strategies™: EQ + Gov Bnd. Live net performance 04/11/16 to 8/05/16
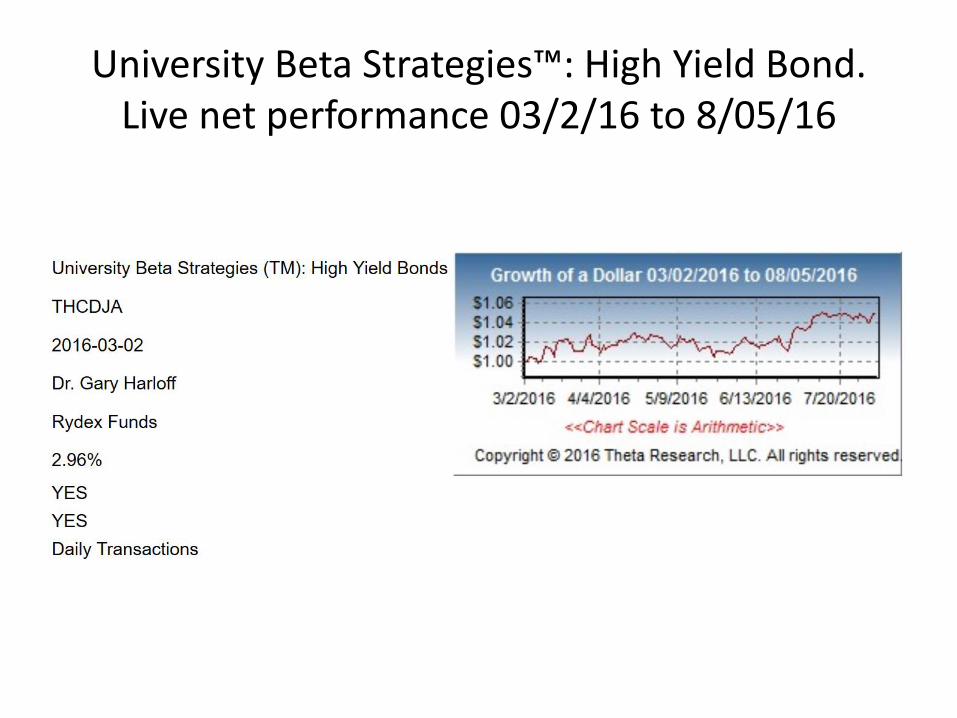
University Beta Strategies™: High Yield Bond. Live net performance 03/2/16 to 8/05/16
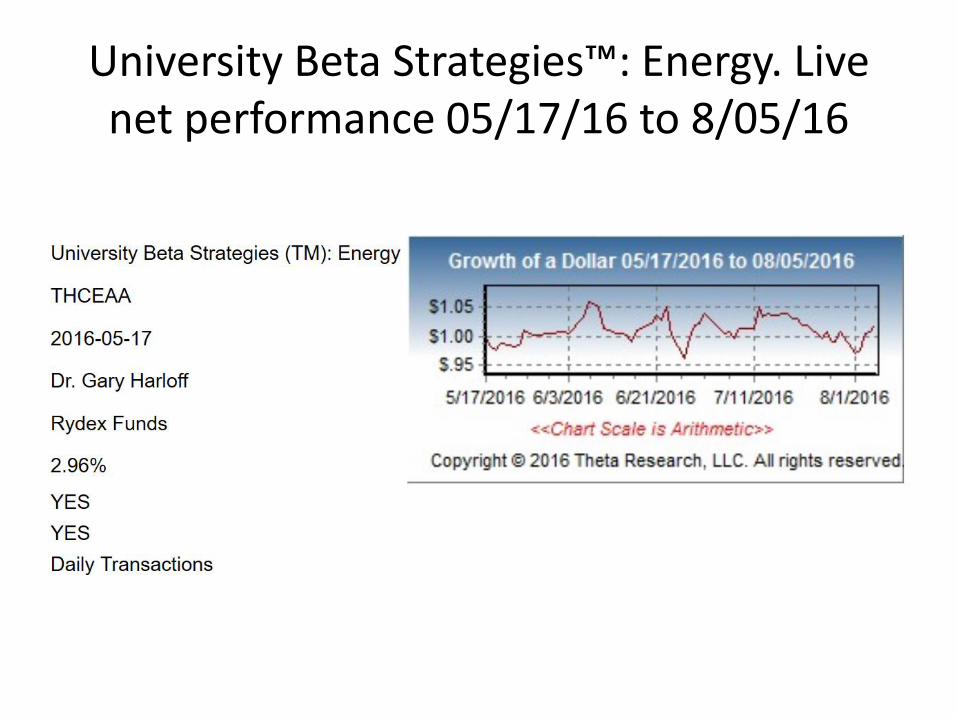
University Beta Strategies™: Energy. Live net performance 05/17/16 to 8/05/16
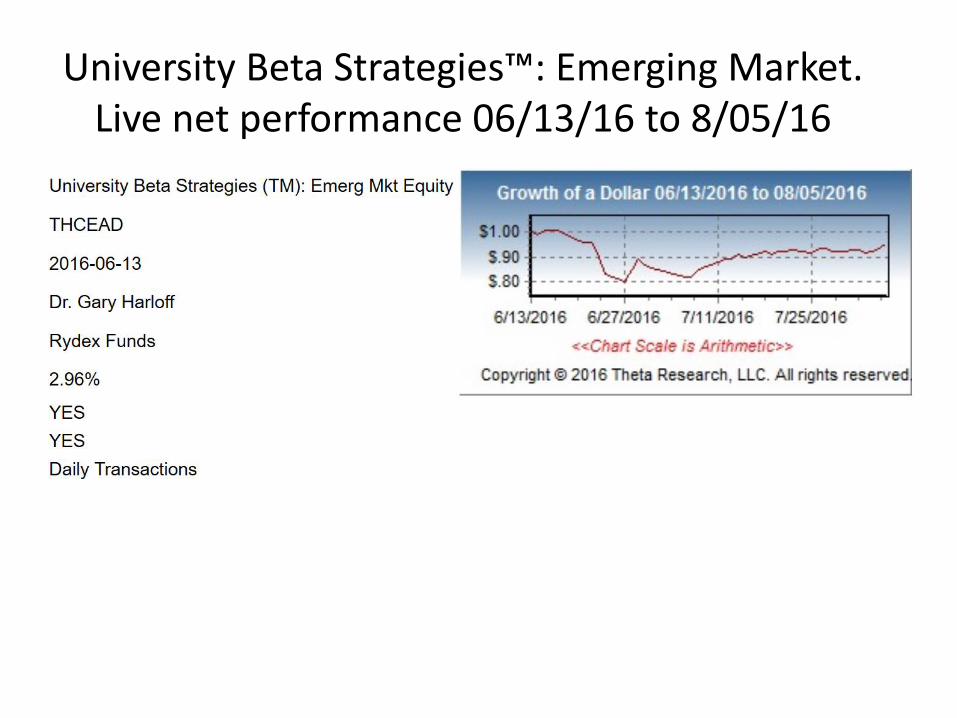
University Beta Strategies™: Emerging Market. Live net performance 06/13/16 to 8/05/16

University Beta Strategies™: U.S. Dollar. Live net performance 06/29/16 to 8/05/16

University Beta Strategies™: Fully Diversified. Live net performance 07/06/16 to 8/05/16

Fig.2. Harloff Capital Management University Beta Strategies™: Gov Bond, 4-4-1995 to 7-15-16, 440-871-7278; top 18.13%/yr RYGBX VMFXX, bottom 24.06%/yr RYGBXRYJUX . Gross return.
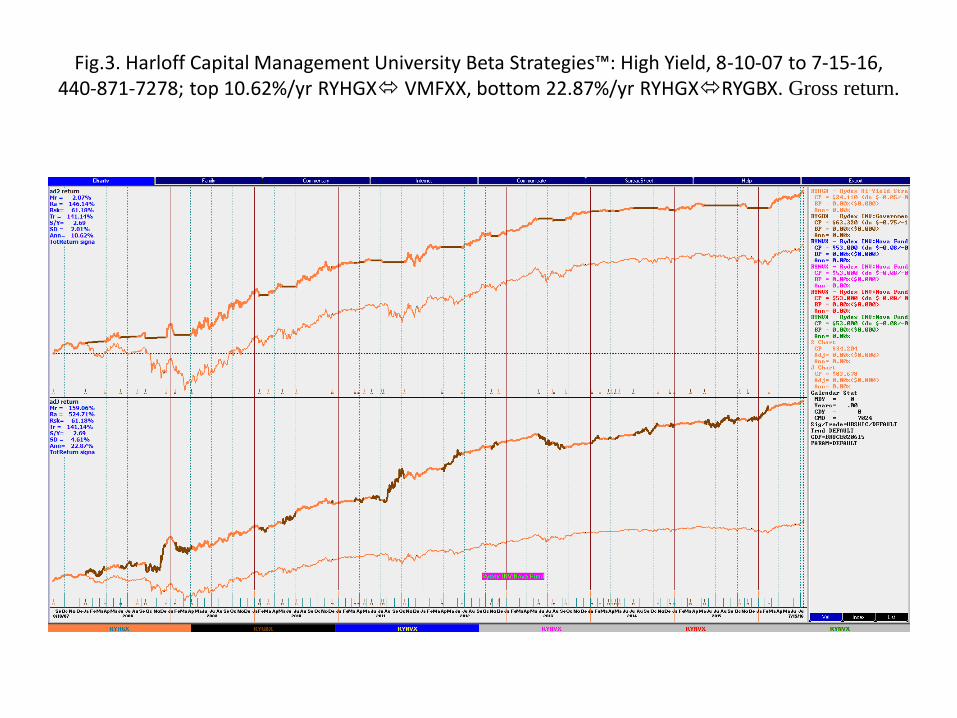
Fig.3. Harloff Capital Management University Beta Strategies™: High Yield, 8-10-07 to 7-15-16, 440-871-7278; top 10.62%/yr RYHGX VMFXX, bottom 22.87%/yr RYHGXRYGBX. Gross return.

Fig.4. Harloff Capital Management University Beta Strategies™: ENERGY, 6-27-05 to 7-15-16, 440-871-7278; top 24.82%/yr RYEIX VMFXX, bottom 32.22%/yr RYEIXRYMHX. Gross return.

Fig.6. Harloff Capital Management University Beta Strategies™: EMERGING MARKET EQUITY, 12-6-2010 to 7-15-16, 440-871-7278; top 48.57%/yr RYWVX VMFXX, bottom 127.13%/yr
RYWVXRYWYX. Gross return.

Fig.7. Harloff Capital Management University Beta Strategies™: US Dollar, 6-27-05 to 7-15-16, 440-871-7278; top 20.54%/yr RYSBX VMFXX, bottom 42.71%/yr RYSBXRYWBX. Gross return.