0470F0026A Software Manual PHERAstar Part II...PHERAstar Software Manual – Part II: Control...
138
Software User Manual – Part II: Control Software Version 3.10
Transcript of 0470F0026A Software Manual PHERAstar Part II...PHERAstar Software Manual – Part II: Control...
Software User Manual – Part II: Control Software
Version 3.10

PHERAstar Software Manual – Part II: Control Software BMG LABTECH
2/138 0470F0026A 2010-03-15
This manual was designed to guide PHERAstar users through the software features.
Although these instructions were carefully written and checked, we cannot accept responsibility for problems encountered when using this manual. Suggestions for improving this manual will be gratefully accepted.
BMG LABTECH reserves the right to change or update this manual at any time. The revision number is stated at the bottom of every page.
Copyright 2003-2010 BMG LABTECH. All rights reserved. All BMG LABTECH brand and product names are trademarks of BMG LABTECH. Other brand and product names are trademarks or registered trademarks of their respective holders.
BMG LABTECH PHERAstar Software Manual – Part II: Control Software
2010-03-15 0470F0026A 3/138
TABLE OF CONTENTS
1 LOGIN SCREEN 6 1.1 User Functions 6 1.1.1 SIGNATURE KEYS 7 1.2 Administrator Functions 8 1.3 Administrator Options 9 1.3.1 PASSWORD POLICIES AND PASSWORD AGING 9 1.3.2 PROGRAM USAGE LOG FILE 10 1.3.3 ALERT MESSAGES 10 1.4 User Directories 11
2 CONTROL SOFTWARE OVERVIEW 12 2.1 Main Screen 12 2.2 Menu Commands and Icons 13
3 SETUP 16 3.1 Instrument Setup 16 3.1.1 READER TYPE AND CONNECTION SELECTION 16 3.1.2 OPTIC MODULES 17 3.1.3 READER OFFSETS 18 3.1.4 FIRMWARE UPDATE 18 3.2 Stacker Configuration 19 3.2.1 POSITION ALIGNMENT 19 3.2.2 STACKER SELF TEST 19 3.3 Microplate Database 21 3.3.1 DEFINE A MICROPLATE 22 3.3.2 PLATE MAPPING 25 3.4 Program Configuration 26 3.4.1 PREFERENCES SHEET 26 3.4.2 TEST RUN SETTINGS SHEET 27 3.4.3 VIEW SHEET 28 3.4.4 MESSAGES SHEET 29 3.5 ASCII Export Function 30 3.5.1 FILENAME AND OUTPUT PATH 30 3.5.2 DATA FORMAT 33 3.5.3 DATA CALCULATION FOR ASCII EXPORT 35 3.5.4 RUN STATISTICS 36 3.6 Login 37 3.7 Data Path 37
4 DEFINING PROTOCOLS 38 4.1 Protocol Selection Window 38 4.2 Creating a New Test Protocol 40 4.3 Fluorescence Intensity Protocols 41 4.3.1 BASIC PARAMETERS – ENDPOINT 41 4.3.2 BASIC PARAMETERS – PLATE MODE 44 4.3.3 BASIC PARAMETERS – WELL MODE 48 4.3.4 BASIC PARAMETERS – WELL SCANNING 52 4.3.5 ORBITAL AVERAGING 54 4.3.6 KINETIC WINDOWS – PLATE MODE 55 4.3.7 KINETIC WINDOWS – WELL MODE 57 4.3.8 LAYOUT DEFINITION 59 4.3.9 USING LAYOUT GROUPS 61 4.3.10 CONCENTRATIONS / VOLUME / SHAKING 62 4.3.11 INJECTION TIMING – PLATE MODE 66 4.3.12 INJECTIONS IN SEPARATE CYCLES 67 4.3.13 INJECTION TIMING – ENDPOINT, WELL MODE AND WELL SCANNING TEST PROTOCOLS 68
PHERAstar Software Manual – Part II: Control Software BMG LABTECH
4/138 0470F0026A 2010-03-15
4.3.14 MULTICHROMATIC MEASUREMENTS 69 4.3.15 TIMING OVERVIEW 70 4.3.16 OUTPUT SHEET 71 4.4 Time Resolved Fluorescence Protocols 72 4.4.1 MEASUREMENT WITHOUT DECAY CURVE MONITORING 73 4.4.2 DECAY CURVE MONITORING 74 4.4.3 MULTICHROMATICS / MULTITIMINGS FOR TIME RESOLVED FLUORESCENCE PROTOCOLS 75 4.5 Fluorescence Polarization Protocols 76 4.6 Luminescence Protocols 77 4.6.1 ORBITAL AVERAGING FOR LUMINESCENCE PROTOCOLS 78 4.7 Absorbance Protocols 79 4.7.1 INJECTIONS IN COMBINATION WITH SPECTROMETER MEASUREMENTS 80 4.8 AlphaScreen Protocols 81
5 PRIMING / INCUBATION 83 5.1 Priming 83 5.2 Incubation 85 5.2.1 TEMPERATURE CONTROL 85 5.2.2 TEMPERATURE MONITORING FEATURE 85 5.2.3 AUTO POWER ON INCUBATION 85
6 PERFORMING MEASUREMENTS 86 6.1 Quick Start 86 6.2 Executing Pre-Defined Test Protocols 87 6.3 Focus and Gain Adjustment 88 6.3.1 FOCUS ADJUSTMENT 89 6.3.2 GAIN ADJUSTMENT 90 6.3.3 GAIN ADJUSTMENT IN FLUORESCENCE POLARIZATION MODE 90 6.3.4 PERFORMING THE ADJUSTMENTS 91 6.4 Plate Identification 92 6.4.1 BARCODE LIST 94 6.5 Sample IDs / Dilution Factors 95 6.6 Executing Measurements 97 6.6.1 STACKER OPERATION 97 6.6.2 TEST RUN INFORMATION 98 6.6.3 STOPPING THE MEASUREMENT 98 6.7 Current State Graphics 99 6.7.1 CURRENT STATE – MICROPLATE VIEW 99 6.7.2 CURRENT STATE OPTIONS 100 6.7.3 CURRENT STATE – WELL VIEW 104 6.7.4 DISPLAY OF SPECTRA DATA 105 6.7.5 DISPLAY OF WELL SCANNING DATA 107 6.7.6 TIMING OVERVIEW 108 6.8 Repeating the Execution of a Test Protocol (“Re run”) 109
7 SCRIPT MODE 110 7.1 Script Mode Window 110 7.1.1 CONTROL ELEMENTS 110 7.1.2 EDITOR FUNCTIONS 111 7.1.3 SYNTAX HIGHLIGHT FUNCTION 111 7.1.4 EXECUTING SCRIPTS 112 7.2 Script Auto Run 112
BMG LABTECH PHERAstar Software Manual – Part II: Control Software
2010-03-15 0470F0026A 5/138
8 THE SCRIPT LANGUAGE 113 8.1 Introduction 113 8.1.1 TYPOGRAPHICAL CONVENTIONS 113 8.1.2 ADVICES 113 8.2 Batch Control Commands 114 8.2.1 WAIT COMMANDS 114 8.2.2 LOOP COMMANDS 114 8.2.3 COMPARISONS 115 8.2.4 OTHER BATCH CONTROL COMMANDS 116 8.3 Dialogue Commands 117 8.3.1 MESSAGE BOXES 117 8.3.2 INPUT COMMANDS 117 8.3.3 SCRIPT MEMO 119 8.4 Reader Commands 120 8.4.1 INIT COMMAND 120 8.4.2 PLATE CARRIER MOVEMENT 120 8.4.3 INCUBATOR CONTROL 121 8.4.4 FOCUS AND GAIN ADJUSTMENT 121 8.4.5 RUN COMMANDS 123 8.5 Stacker Commands 124 8.5.1 INIT COMMAND 124 8.5.2 PLATE HANDLING COMMANDS 124 8.5.3 OTHER STACKER COMMANDS 125 8.6 System Constants and Variables 126 8.6.1 SYSTEM CONSTANTS 126 8.6.2 NUMERICAL SYSTEM VARIABLES 126 8.6.3 STRING SYSTEM VARIABLE 127 8.6.4 BOOLEAN SYSTEM VARIABLES 128 8.7 Numerical Variables 129 8.7.1 CONVERTING NUMERICAL VALUES INTO STRING VALUES 130 8.8 String Variables 130 8.9 Measurement Data 131 8.9.1 R_GETDATA 131 8.9.2 R_GETRAWDATAFILENUMBER 131 8.10 Date and Time Functions 132 8.10.1 USING DATE AND TIME IN NUMERICAL VARIABLES 132 8.10.2 USING DATE AND TIME IN STRING VARIABLES 132 8.11 Calling External Applications 133
9 KNOWN PROBLEMS AND SOLUTIONS 134 9.1 Disabled Plate In / Out Buttons 134 9.2 Access Rights 134 9.2.1 FILE ACCESS PERMISSIONS 134 9.2.2 REGISTRY ACCESS 136 9.3 Run Log Window 137 9.3.1 SEARCH FUNCTION 137 9.3.2 RUN LOG FILE 137
10 SUPPORT 138
PHERAstar Software Manual – Part II: Control Software BMG LABTECH
6/138 0470F0026A 2010-03-15
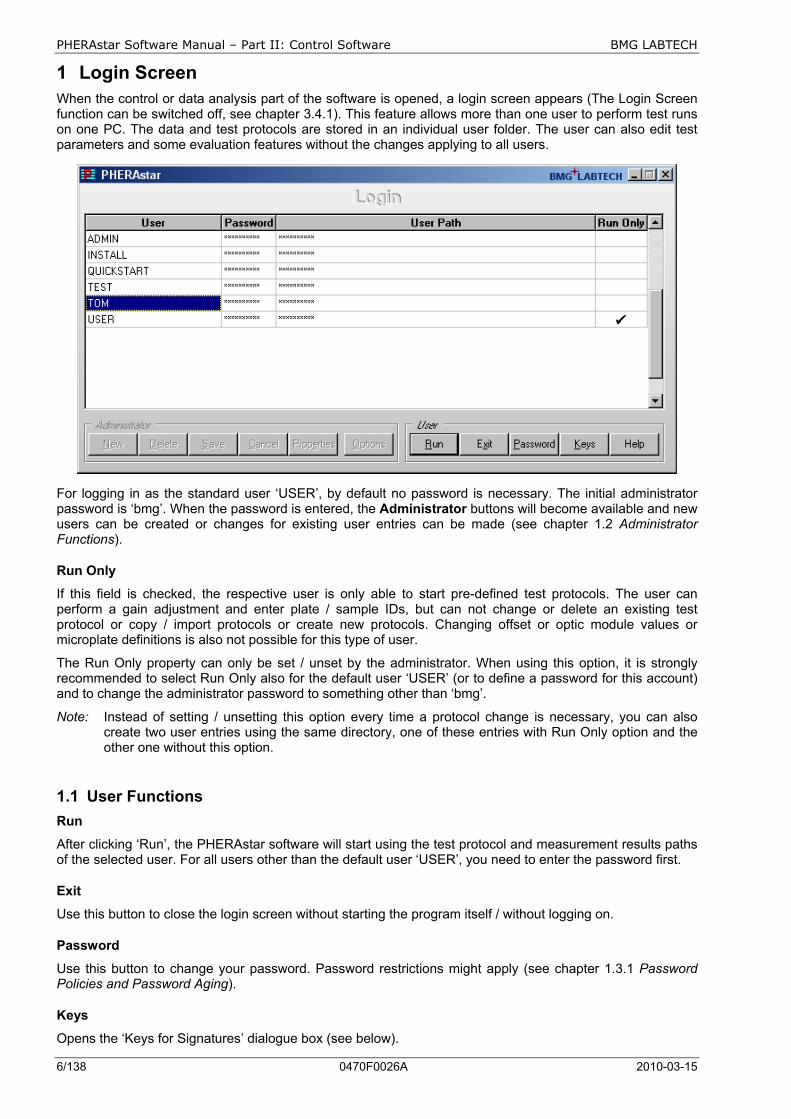
1 Login Screen When the control or data analysis part of the software is opened, a login screen appears (The Login Screen function can be switched off, see chapter 3.4.1). This feature allows more than one user to perform test runs on one PC. The data and test protocols are stored in an individual user folder. The user can also edit test parameters and some evaluation features without the changes applying to all users.
For logging in as the standard user ‘USER’, by default no password is necessary. The initial administrator password is ‘bmg’. When the password is entered, the Administrator buttons will become available and new users can be created or changes for existing user entries can be made (see chapter 1.2 Administrator Functions).
Run Only
If this field is checked, the respective user is only able to start pre-defined test protocols. The user can perform a gain adjustment and enter plate / sample IDs, but can not change or delete an existing test protocol or copy / import protocols or create new protocols. Changing offset or optic module values or microplate definitions is also not possible for this type of user.
The Run Only property can only be set / unset by the administrator. When using this option, it is strongly recommended to select Run Only also for the default user ‘USER’ (or to define a password for this account) and to change the administrator password to something other than ‘bmg’.
Note: Instead of setting / unsetting this option every time a protocol change is necessary, you can also create two user entries using the same directory, one of these entries with Run Only option and the other one without this option.
1.1 User Functions Run
After clicking ‘Run’, the PHERAstar software will start using the test protocol and measurement results paths of the selected user. For all users other than the default user ‘USER’, you need to enter the password first.
Exit
Use this button to close the login screen without starting the program itself / without logging on.
Password
Use this button to change your password. Password restrictions might apply (see chapter 1.3.1 Password Policies and Password Aging).
Keys
Opens the ‘Keys for Signatures’ dialogue box (see below).
BMG LABTECH PHERAstar Software Manual – Part II: Control Software
2010-03-15 0470F0026A 7/138
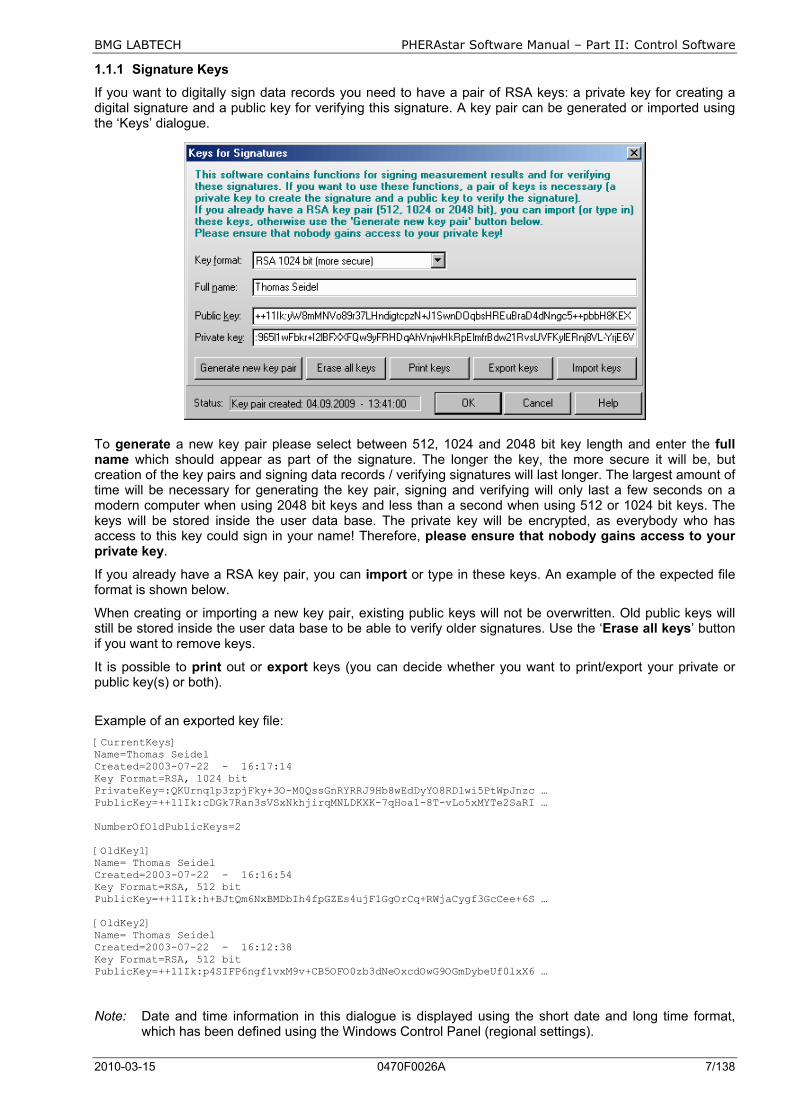
1.1.1 Signature Keys
If you want to digitally sign data records you need to have a pair of RSA keys: a private key for creating a digital signature and a public key for verifying this signature. A key pair can be generated or imported using the ‘Keys’ dialogue.
To generate a new key pair please select between 512, 1024 and 2048 bit key length and enter the full name which should appear as part of the signature. The longer the key, the more secure it will be, but creation of the key pairs and signing data records / verifying signatures will last longer. The largest amount of time will be necessary for generating the key pair, signing and verifying will only last a few seconds on a modern computer when using 2048 bit keys and less than a second when using 512 or 1024 bit keys. The keys will be stored inside the user data base. The private key will be encrypted, as everybody who has access to this key could sign in your name! Therefore, please ensure that nobody gains access to your private key.
If you already have a RSA key pair, you can import or type in these keys. An example of the expected file format is shown below.
When creating or importing a new key pair, existing public keys will not be overwritten. Old public keys will still be stored inside the user data base to be able to verify older signatures. Use the ‘Erase all keys’ button if you want to remove keys.
It is possible to print out or export keys (you can decide whether you want to print/export your private or public key(s) or both).
Example of an exported key file: [CurrentKeys] Name=Thomas Seidel Created=2003-07-22 - 16:17:14 Key Format=RSA, 1024 bit PrivateKey=:QKUrnq1p3zpjFky+3O-M0QssGnRYRRJ9Hb8wEdDyYO8RDlwi5PtWpJnzc … PublicKey=++11Ik:cDGk7Ran3sVSxNkhjirqMNLDKXK-7qHoa1-8T-vLo5xMYTe2SaRI … NumberOfOldPublicKeys=2 [OldKey1] Name= Thomas Seidel Created=2003-07-22 - 16:16:54 Key Format=RSA, 512 bit PublicKey=++11Ik:h+BJtQm6NxBMDbIh4fpGZEs4ujF1GgOrCq+RWjaCygf3GcCee+6S … [OldKey2] Name= Thomas Seidel Created=2003-07-22 - 16:12:38 Key Format=RSA, 512 bit PublicKey=++11Ik:p4SIFP6ngf1vxM9v+CB5OFO0zb3dNeOxcdOwG9OGmDybeUf0lxX6 …
Note: Date and time information in this dialogue is displayed using the short date and long time format, which has been defined using the Windows Control Panel (regional settings).
PHERAstar Software Manual – Part II: Control Software BMG LABTECH
8/138 0470F0026A 2010-03-15
1.2 Administrator Functions The buttons of the ‘Administrator’ group will become available after entering the administrator password.
New
Click on ‘New’ to create a new user account. Enter the user name, the initial password (you can also leave this field empty and let the user define the password later). Select the directory for the user's data and test protocols. For directory options, click on the far right side under ‘Directory’ and a button appears [...]. After clicking this button, a user path dialog box appears where you can select the directory for storing test protocols and measurement data (see chapter 1.4 User Directories).
Delete
When an existing user entry needs to be deleted, highlight this entry and click ‘Delete’.
Save
After clicking the ‘Save’ button all changes made will be saved in the user data base.
Cancel
If you click ‘Cancel’, all changes made after the last save will be discarded.
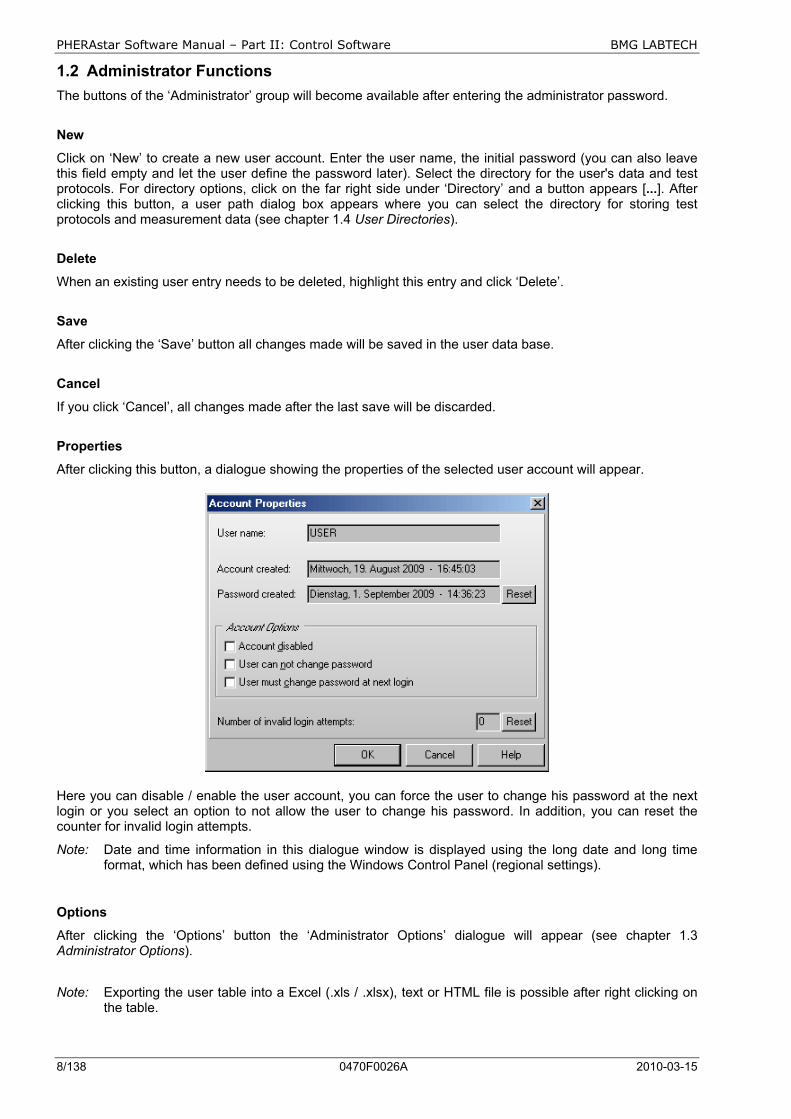
Properties
After clicking this button, a dialogue showing the properties of the selected user account will appear.
Here you can disable / enable the user account, you can force the user to change his password at the next login or you select an option to not allow the user to change his password. In addition, you can reset the counter for invalid login attempts.
Note: Date and time information in this dialogue window is displayed using the long date and long time format, which has been defined using the Windows Control Panel (regional settings).
Options
After clicking the ‘Options’ button the ‘Administrator Options’ dialogue will appear (see chapter 1.3 Administrator Options).
Note: Exporting the user table into a Excel (.xls / .xlsx), text or HTML file is possible after right clicking on
the table.

BMG LABTECH PHERAstar Software Manual – Part II: Control Software
2010-03-15 0470F0026A 9/138
1.3 Administrator Options The Administrator Options dialogue box can be reached from the login screen.
1.3.1 Password Policies and Password Aging
In the first sheet the Administrator can define the policies for password. In addition it is possible to use password aging (passwords will be valid only for a defined time to force the users to change their passwords from time to time).
Password Policies
Here the required minimum length of passwords and the minimum number of non-alpha characters (numbers, special characters) can be specified. If you use 0 in both fields user accounts without passwords are possible.
The administrator can disable the ‘Auto Login’ function (see chapter 3.4.1) here.
If you want an account to be disabled after a certain number of invalid login attempts (login attempts using a wrong password), select the number in the last line of the Password Policies box. If 0 is specified here, accounts will never be disabled.
When this software is used in an FDA 21 CFR part 11 compliant environment, BMG LABTECH recommends using a minimum password length of 6 characters including at least one non-alpha character. In this case, you should disable the auto login function and choose to disable account after 3 invalid login attempts. In addition, you should change the initial administrator password to something other than ‘BMG’ and you should also define a password for the default user ‘USER’. See also Software manual part IV: FDA 21 CFR part.
Password Aging
If passwords should be valid for only a certain amount of time, you can use the password aging function. The user will be prompted to change his password several days before the defined time is over. After the defined time, logging on is no longer possible. If the option ‘Disable user accounts when password has expired’ has been selected only the administrator can reactivate the account (by deselecting the ‘Account disabled’ check box in the ‘Account Properties’ dialogue (see chapter 1.2 Administrator Functions), otherwise the user can reactive his account by changing the password (see chapter 1.1 User Functions). When changing the password aging settings you can use the ‘Reset all password creation dates’ button to avoid that some existing passwords have already expired.
When this software is used in an FDA 21 CFR part 11 compliant environment, BMG LABTECH recommends using the password aging function with a setting of 92 days (3 months) or 183 days (half a year). See also Software manual part IV: FDA 21 CFR part.

PHERAstar Software Manual – Part II: Control Software BMG LABTECH
10/138 0470F0026A 2010-03-15
1.3.2 Program Usage Log File
The BMG LABTECH software can create a log file (named ‘Program usage.log’) containing information about all important program actions such as logging on, defining a test protocol, changing offset or optic module values, performing a measurement, and so on. This function can be switched on in the second sheet of the ‘Administrator Options’ dialogue box.
Here you can also specify the directory where this file is to be stored and under which conditions a new file should be opened. When starting a new log file, the old file might be renamed or erased. The log file is protected against manipulation by calculating a cryptographically secure hash value. The integrity of the log file will be checked at every program start. If the log file has been manipulated, the program usage can be disabled. To re-enable program usage the administrator needs to log in. You can also use the ‘Check Data Integrity’ tool (see also Software manual part IV: FDA 21 CFR part) to check the integrity of the log file.
When this software is used in an FDA 21 CFR part 11 compliant environment BMG LABTECH recommends using the log file function.
Note: There will be an additional run log file (see chapter 9.3 Run Log Window) which contains the communication between reader and computer. This file is intended to deliver background information in case of problems.
1.3.3 Alert Messages
By using the third sheet of the administrator options dialogue, it is possible to define alert messages which can be sent under certain circumstances via email (e.g. to the administrator) or saved into an alert message file.
BMG LABTECH PHERAstar Software Manual – Part II: Control Software
2010-03-15 0470F0026A 11/138
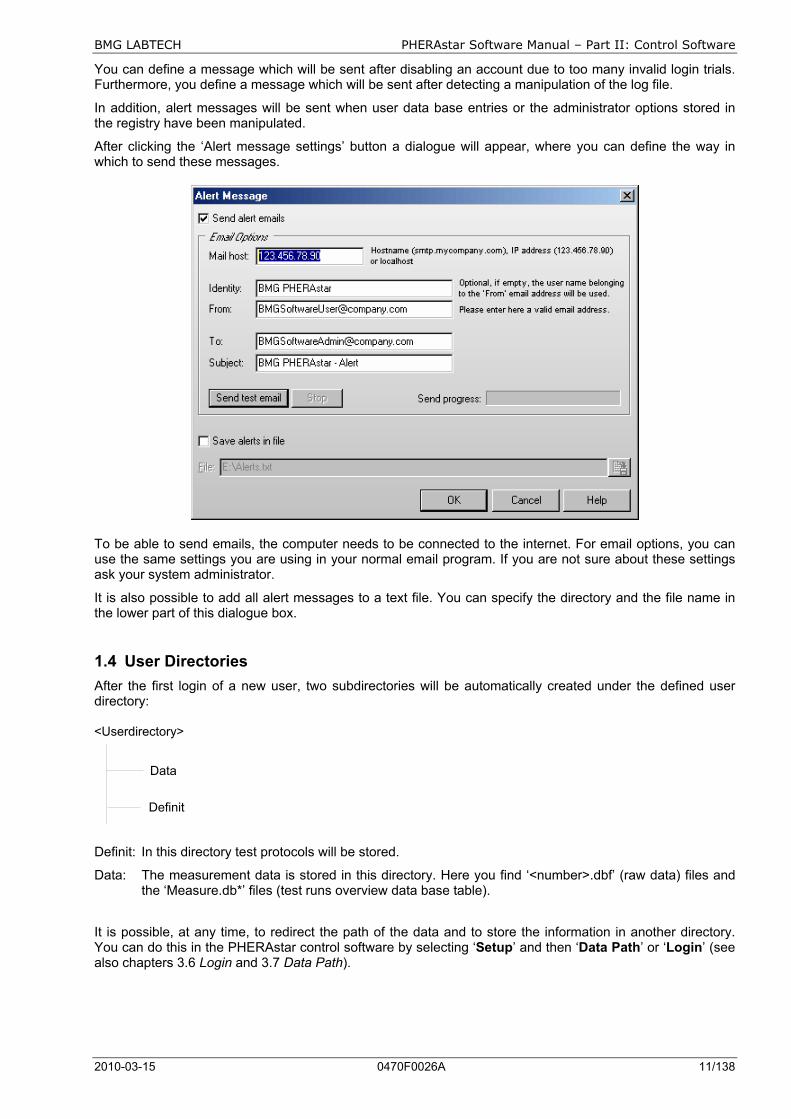
You can define a message which will be sent after disabling an account due to too many invalid login trials. Furthermore, you define a message which will be sent after detecting a manipulation of the log file.
In addition, alert messages will be sent when user data base entries or the administrator options stored in the registry have been manipulated.
After clicking the ‘Alert message settings’ button a dialogue will appear, where you can define the way in which to send these messages.
To be able to send emails, the computer needs to be connected to the internet. For email options, you can use the same settings you are using in your normal email program. If you are not sure about these settings ask your system administrator.
It is also possible to add all alert messages to a text file. You can specify the directory and the file name in the lower part of this dialogue box.
1.4 User Directories After the first login of a new user, two subdirectories will be automatically created under the defined user directory:
Data
Definit
<Userdirectory>
Definit: In this directory test protocols will be stored.
Data: The measurement data is stored in this directory. Here you find ‘<number>.dbf’ (raw data) files and the ‘Measure.db*’ files (test runs overview data base table).
It is possible, at any time, to redirect the path of the data and to store the information in another directory. You can do this in the PHERAstar control software by selecting ‘Setup’ and then ‘Data Path’ or ‘Login’ (see also chapters 3.6 Login and 3.7 Data Path).
PHERAstar Software Manual – Part II: Control Software BMG LABTECH
12/138 0470F0026A 2010-03-15
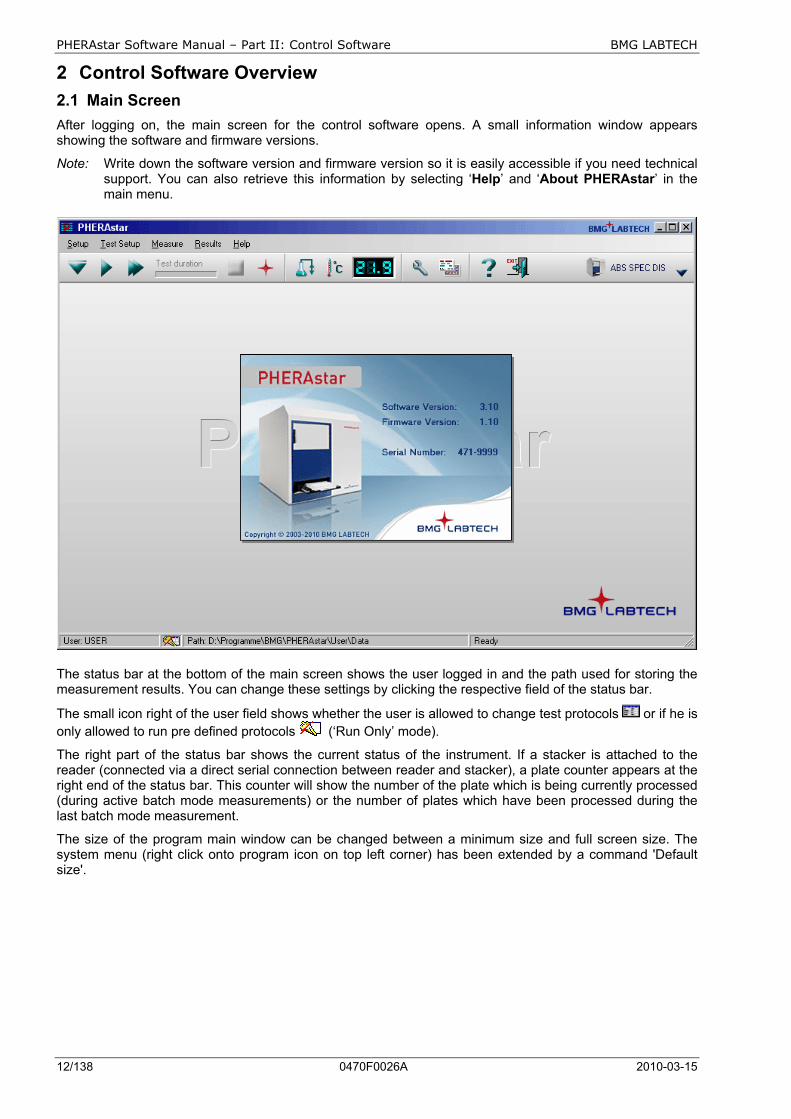
2 Control Software Overview 2.1 Main Screen After logging on, the main screen for the control software opens. A small information window appears showing the software and firmware versions.
Note: Write down the software version and firmware version so it is easily accessible if you need technical support. You can also retrieve this information by selecting ‘Help’ and ‘About PHERAstar’ in the main menu.
The status bar at the bottom of the main screen shows the user logged in and the path used for storing the measurement results. You can change these settings by clicking the respective field of the status bar.
The small icon right of the user field shows whether the user is allowed to change test protocols or if he is only allowed to run pre defined protocols (‘Run Only’ mode).
The right part of the status bar shows the current status of the instrument. If a stacker is attached to the reader (connected via a direct serial connection between reader and stacker), a plate counter appears at the right end of the status bar. This counter will show the number of the plate which is being currently processed (during active batch mode measurements) or the number of plates which have been processed during the last batch mode measurement.
The size of the program main window can be changed between a minimum size and full screen size. The system menu (right click onto program icon on top left corner) has been extended by a command 'Default size'.
BMG LABTECH PHERAstar Software Manual – Part II: Control Software
2010-03-15 0470F0026A 13/138
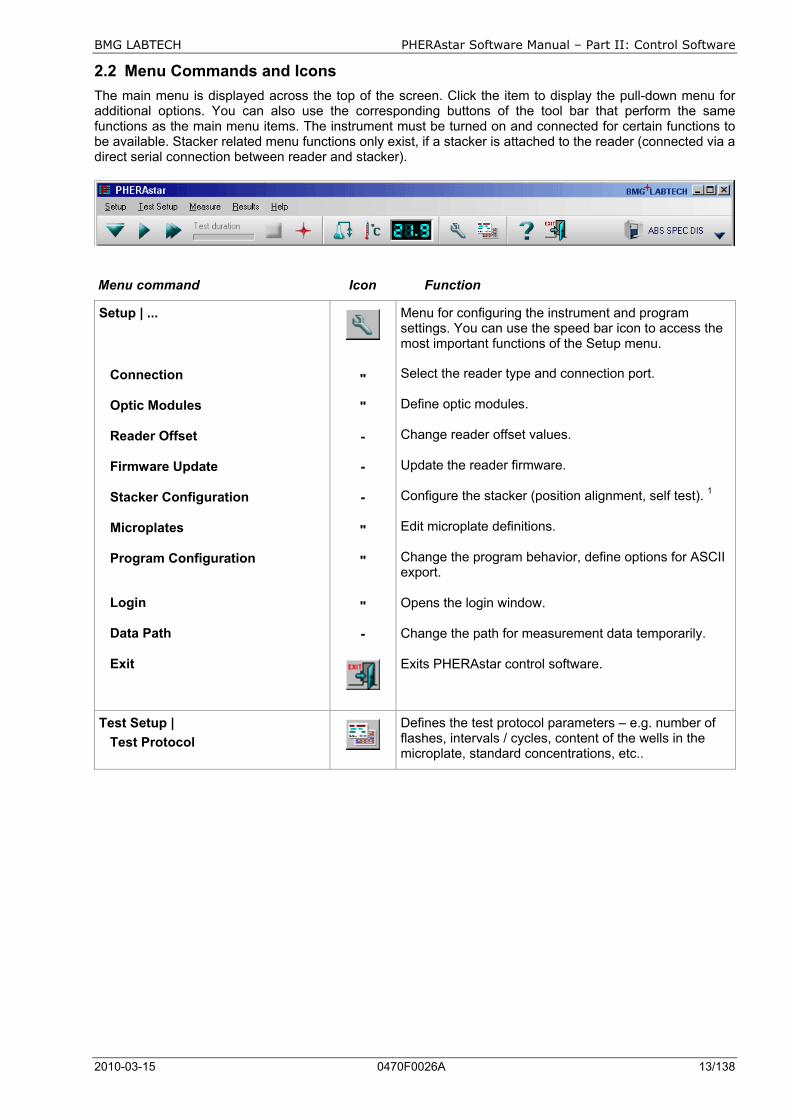
2.2 Menu Commands and Icons The main menu is displayed across the top of the screen. Click the item to display the pull-down menu for additional options. You can also use the corresponding buttons of the tool bar that perform the same functions as the main menu items. The instrument must be turned on and connected for certain functions to be available. Stacker related menu functions only exist, if a stacker is attached to the reader (connected via a direct serial connection between reader and stacker).
Menu command Icon Function
Setup | ...
Connection Optic Modules Reader Offset Firmware Update Stacker Configuration Microplates Program Configuration Login Data Path Exit
" "
- - -
" " " -
Menu for configuring the instrument and program settings. You can use the speed bar icon to access the most important functions of the Setup menu.
Select the reader type and connection port. Define optic modules. Change reader offset values. Update the reader firmware. Configure the stacker (position alignment, self test). 1 Edit microplate definitions. Change the program behavior, define options for ASCII export. Opens the login window. Change the path for measurement data temporarily. Exits PHERAstar control software.
Test Setup | Test Protocol
Defines the test protocol parameters – e.g. number of flashes, intervals / cycles, content of the wells in the microplate, standard concentrations, etc..
PHERAstar Software Manual – Part II: Control Software BMG LABTECH
14/138 0470F0026A 2010-03-15
Menu command Icon Function
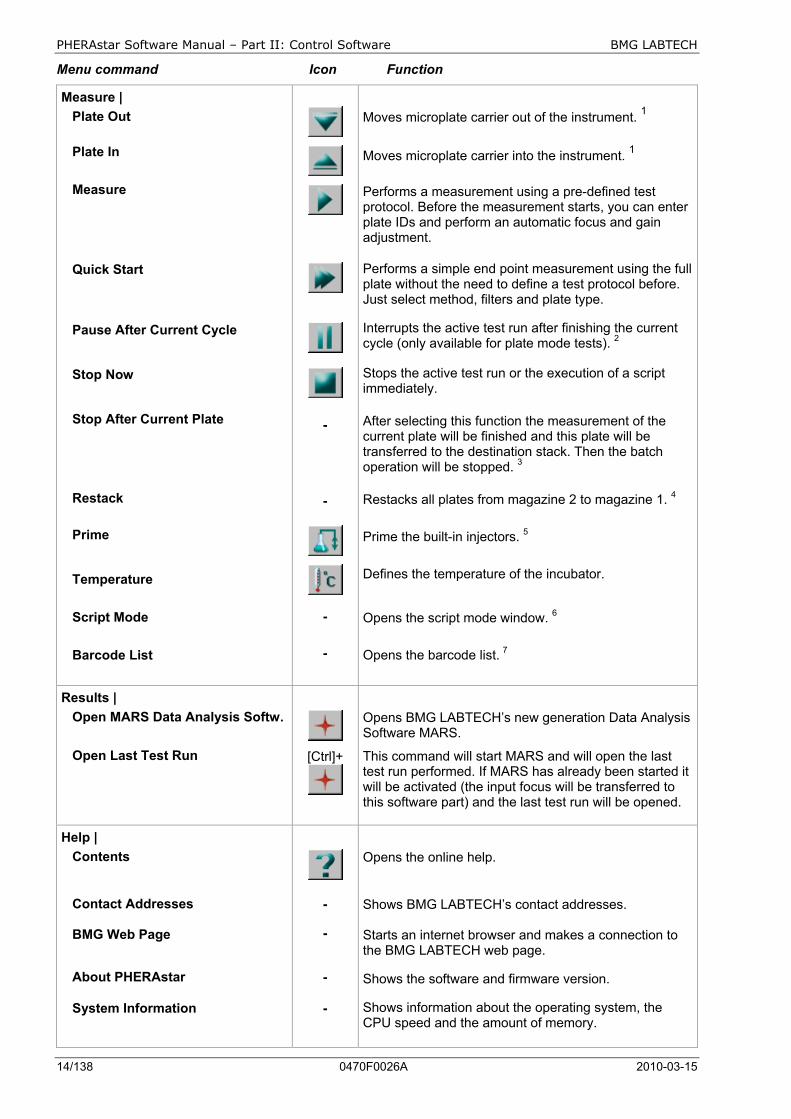
Measure | Plate Out
Plate In
Measure
Quick Start
Pause After Current Cycle
Stop Now
Stop After Current Plate
Restack
Prime
Temperature
Script Mode
Barcode List
-
-
-
-
Moves microplate carrier out of the instrument. 1
Moves microplate carrier into the instrument. 1
Performs a measurement using a pre-defined test protocol. Before the measurement starts, you can enter plate IDs and perform an automatic focus and gain adjustment.
Performs a simple end point measurement using the full plate without the need to define a test protocol before. Just select method, filters and plate type.
Interrupts the active test run after finishing the current cycle (only available for plate mode tests). 2
Stops the active test run or the execution of a script immediately.
After selecting this function the measurement of the current plate will be finished and this plate will be transferred to the destination stack. Then the batch operation will be stopped. 3
Restacks all plates from magazine 2 to magazine 1. 4
Prime the built-in injectors. 5
Defines the temperature of the incubator.
Opens the script mode window. 6
Opens the barcode list. 7
Results | Open MARS Data Analysis Softw.
Open Last Test Run
[Ctrl]+
Opens BMG LABTECH’s new generation Data Analysis Software MARS.
This command will start MARS and will open the last test run performed. If MARS has already been started it will be activated (the input focus will be transferred to this software part) and the last test run will be opened.
Help | Contents
Contact Addresses BMG Web Page
About PHERAstar
System Information
-
-
-
-
Opens the online help.
Shows BMG LABTECH’s contact addresses. Starts an internet browser and makes a connection to the BMG LABTECH web page.
Shows the software and firmware version.
Shows information about the operating system, the CPU speed and the amount of memory.
BMG LABTECH PHERAstar Software Manual – Part II: Control Software
2010-03-15 0470F0026A 15/138
1 This option is not available when the reader is connect to a stacker and magazine 1 is inserted. Here the plate movement from the source magazine into the reader and out of the reader to the destination magazine after the measurement is part of the batch or single plate measurement routine.
If the plate button ( ) is disabled and the reader is not attached to a stacker and there is no measurement or other action active and the communication to the reader is OK, then it is most likely that there is an incorrect setting in the configuration file ‘~\Program Files\BMG\PHERAstar\ PHERAstar.ini’. The value behind ‘DisablePlateCmds=’ should be ‘False’. This parameter will be set to ‘True’ if the reader is used in a robotic system or in combination with Stacker Control, as here the plate in/out movement will be only controlled using the robotic software.
2 The ‘Pause After Current Cycle’ function is also not available when using the script mode (see chapter 7). It is only available while executing plate mode protocols other than absorbance spectra measurement.
3 This function is only available in batch mode (reader with a stacker attached) or in script mode when a script containing batch measurements is used.
4 This function is only available if a stacker is attached to the reader.
5 The priming function is only available for PHERAstar FS readers. 6 The script mode is not available when the program is used in ActiveX or DDE mode, e.g. as part of a robotic system or in
combination with Stacker Control. 7 This function is only available if a stacker is attached to the reader and the stacker is equipped with a barcode reader and barcodes
have already be read.
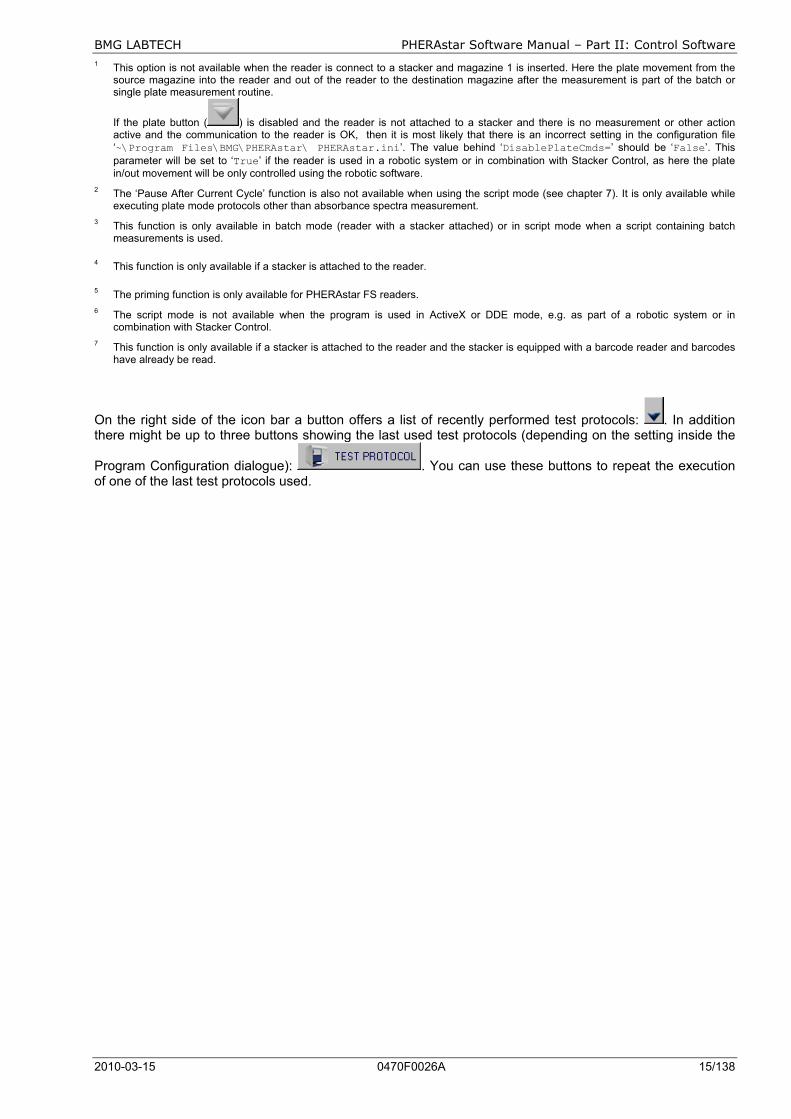
On the right side of the icon bar a button offers a list of recently performed test protocols: . In addition there might be up to three buttons showing the last used test protocols (depending on the setting inside the
Program Configuration dialogue): . You can use these buttons to repeat the execution of one of the last test protocols used.
PHERAstar Software Manual – Part II: Control Software BMG LABTECH
16/138 0470F0026A 2010-03-15
3 Setup 3.1 Instrument Setup The configuration settings for the instrument include the communication port, the optic modules table, instrument offsets and the definitions of microplate dimensions.
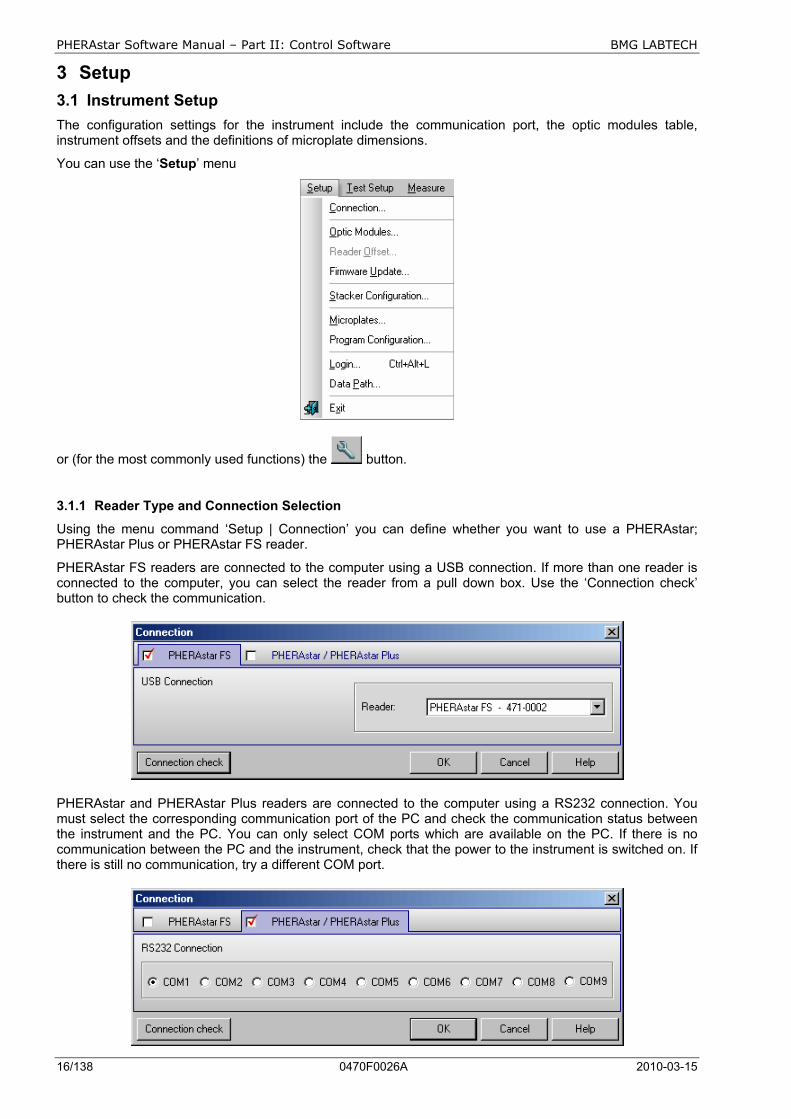
You can use the ‘Setup’ menu
or (for the most commonly used functions) the button.
3.1.1 Reader Type and Connection Selection
Using the menu command ‘Setup | Connection’ you can define whether you want to use a PHERAstar; PHERAstar Plus or PHERAstar FS reader.
PHERAstar FS readers are connected to the computer using a USB connection. If more than one reader is connected to the computer, you can select the reader from a pull down box. Use the ‘Connection check’ button to check the communication.
PHERAstar and PHERAstar Plus readers are connected to the computer using a RS232 connection. You must select the corresponding communication port of the PC and check the communication status between the instrument and the PC. You can only select COM ports which are available on the PC. If there is no communication between the PC and the instrument, check that the power to the instrument is switched on. If there is still no communication, try a different COM port.
BMG LABTECH PHERAstar Software Manual – Part II: Control Software
2010-03-15 0470F0026A 17/138
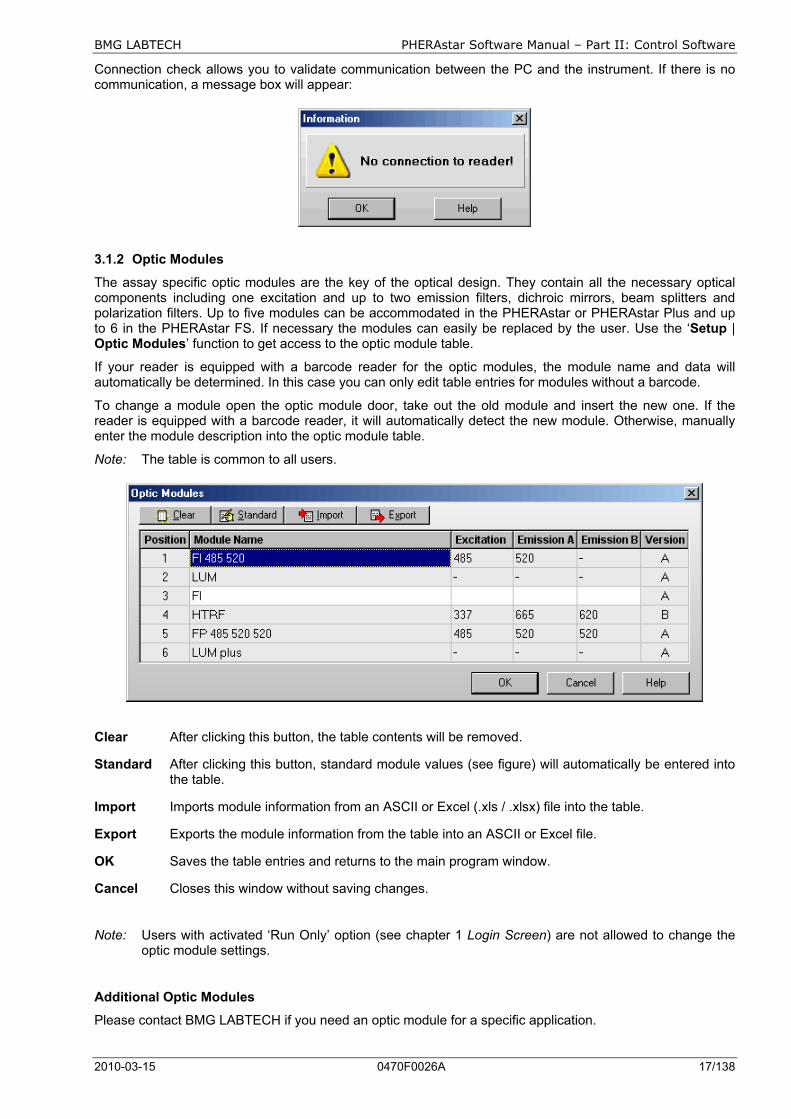
Connection check allows you to validate communication between the PC and the instrument. If there is no communication, a message box will appear:
3.1.2 Optic Modules
The assay specific optic modules are the key of the optical design. They contain all the necessary optical components including one excitation and up to two emission filters, dichroic mirrors, beam splitters and polarization filters. Up to five modules can be accommodated in the PHERAstar or PHERAstar Plus and up to 6 in the PHERAstar FS. If necessary the modules can easily be replaced by the user. Use the ‘Setup | Optic Modules’ function to get access to the optic module table.
If your reader is equipped with a barcode reader for the optic modules, the module name and data will automatically be determined. In this case you can only edit table entries for modules without a barcode.
To change a module open the optic module door, take out the old module and insert the new one. If the reader is equipped with a barcode reader, it will automatically detect the new module. Otherwise, manually enter the module description into the optic module table.
Note: The table is common to all users.
Clear After clicking this button, the table contents will be removed.
Standard After clicking this button, standard module values (see figure) will automatically be entered into the table.
Import Imports module information from an ASCII or Excel (.xls / .xlsx) file into the table.
Export Exports the module information from the table into an ASCII or Excel file.
OK Saves the table entries and returns to the main program window.
Cancel Closes this window without saving changes.
Note: Users with activated ‘Run Only’ option (see chapter 1 Login Screen) are not allowed to change the optic module settings.
Additional Optic Modules
Please contact BMG LABTECH if you need an optic module for a specific application.
PHERAstar Software Manual – Part II: Control Software BMG LABTECH
18/138 0470F0026A 2010-03-15
3.1.3 Reader Offsets
Every PHERAstar is accurately calibrated at the factory and has individually defined offset values. The offset values correspond to the home position of the microplate carrier or of the optic unit. Correct offset values are important for optimal measurement results. The offset values are stored in the reader EEPROM. The determination of the offset values should only be carried out by a qualified service technician. If the plate carrier is removed or replaced, the transport system offset values should be re-calibrated.
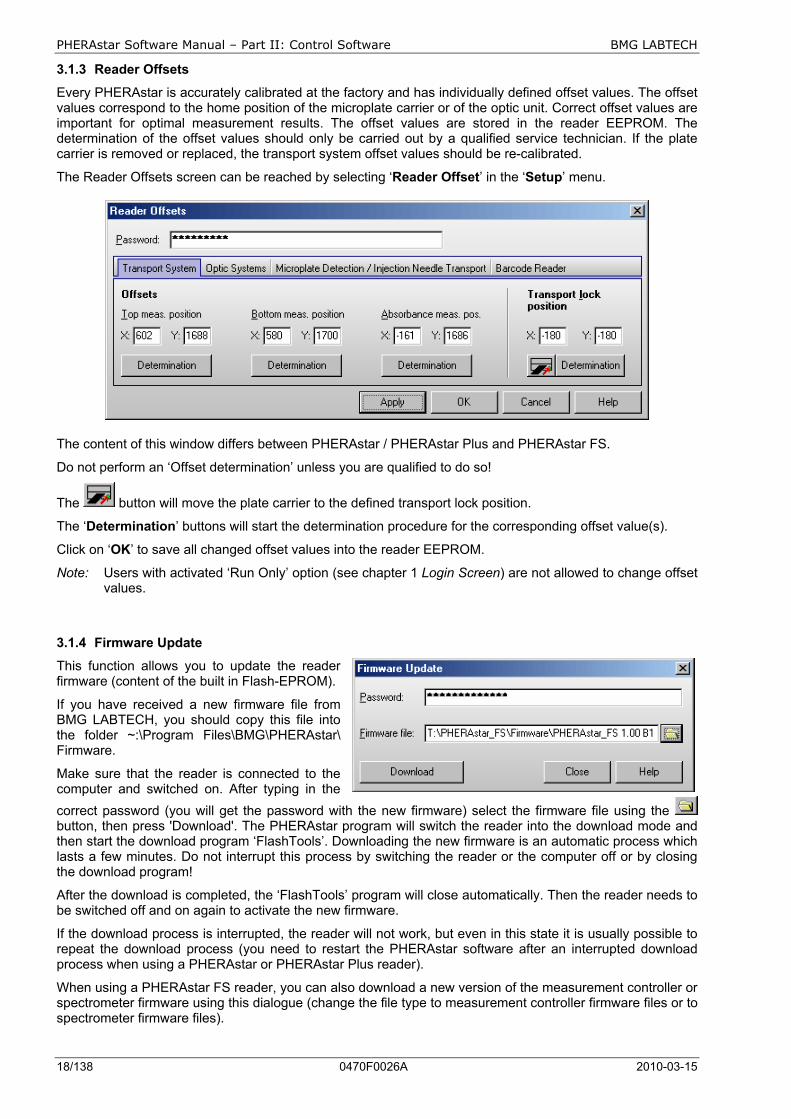
The Reader Offsets screen can be reached by selecting ‘Reader Offset’ in the ‘Setup’ menu.
The content of this window differs between PHERAstar / PHERAstar Plus and PHERAstar FS.
Do not perform an ‘Offset determination’ unless you are qualified to do so!
The button will move the plate carrier to the defined transport lock position.
The ‘Determination’ buttons will start the determination procedure for the corresponding offset value(s).
Click on ‘OK’ to save all changed offset values into the reader EEPROM.
Note: Users with activated ‘Run Only’ option (see chapter 1 Login Screen) are not allowed to change offset values.
3.1.4 Firmware Update
This function allows you to update the reader firmware (content of the built in Flash-EPROM).
If you have received a new firmware file from BMG LABTECH, you should copy this file into the folder ~:\Program Files\BMG\PHERAstar\ Firmware.
Make sure that the reader is connected to the computer and switched on. After typing in the correct password (you will get the password with the new firmware) select the firmware file using the button, then press 'Download'. The PHERAstar program will switch the reader into the download mode and then start the download program ‘FlashTools’. Downloading the new firmware is an automatic process which lasts a few minutes. Do not interrupt this process by switching the reader or the computer off or by closing the download program!
After the download is completed, the ‘FlashTools’ program will close automatically. Then the reader needs to be switched off and on again to activate the new firmware.
If the download process is interrupted, the reader will not work, but even in this state it is usually possible to repeat the download process (you need to restart the PHERAstar software after an interrupted download process when using a PHERAstar or PHERAstar Plus reader).
When using a PHERAstar FS reader, you can also download a new version of the measurement controller or spectrometer firmware using this dialogue (change the file type to measurement controller firmware files or to spectrometer firmware files).
BMG LABTECH PHERAstar Software Manual – Part II: Control Software
2010-03-15 0470F0026A 19/138
3.2 Stacker Configuration This function is only available if a stacker is attached to the reader and connected via a direct serial connection between reader and stacker. If the stacker is not connected to the reader but connected to the PC, it can only be controlled by the Stacker Control software. In this case you will need to use the configuration functions of Stacker Control.
3.2.1 Position Alignment
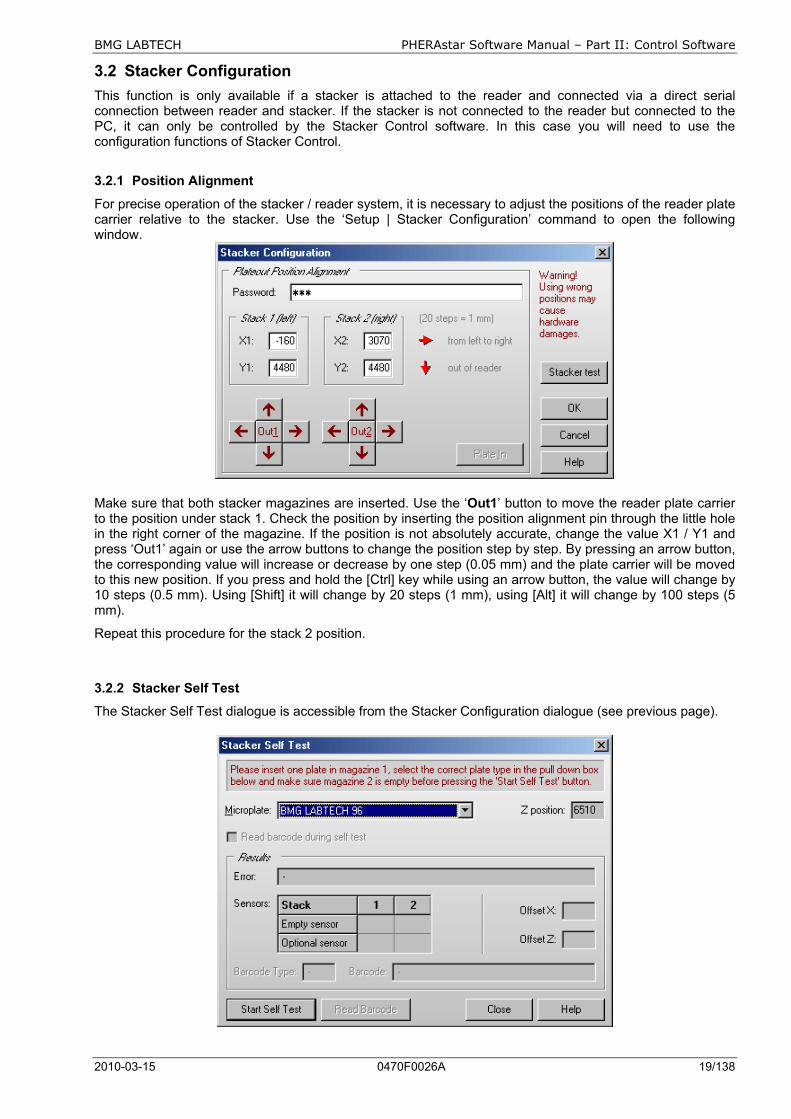
For precise operation of the stacker / reader system, it is necessary to adjust the positions of the reader plate carrier relative to the stacker. Use the ‘Setup | Stacker Configuration’ command to open the following window.
Make sure that both stacker magazines are inserted. Use the ‘Out1’ button to move the reader plate carrier to the position under stack 1. Check the position by inserting the position alignment pin through the little hole in the right corner of the magazine. If the position is not absolutely accurate, change the value X1 / Y1 and press ‘Out1’ again or use the arrow buttons to change the position step by step. By pressing an arrow button, the corresponding value will increase or decrease by one step (0.05 mm) and the plate carrier will be moved to this new position. If you press and hold the [Ctrl] key while using an arrow button, the value will change by 10 steps (0.5 mm). Using [Shift] it will change by 20 steps (1 mm), using [Alt] it will change by 100 steps (5 mm).
Repeat this procedure for the stack 2 position.
3.2.2 Stacker Self Test
The Stacker Self Test dialogue is accessible from the Stacker Configuration dialogue (see previous page).

PHERAstar Software Manual – Part II: Control Software BMG LABTECH
20/138 0470F0026A 2010-03-15
Please insert one microplate in magazine 1 and make sure that magazine 2 is empty. Make sure that both magazines are locked. Select the correct microplate type.
After pressing the ‘Start Self Test’ button, the Stacker will perform a complete self test procedure (including the barcode reader, if installed, and if the ‘Read barcode during self test’ option is selected). If an error occurs, a message will be displayed.
The table below the error message box shows the status of built-in sensors. The empty sensor detects if there are plates in a stack (1 = no plates in). The optional sensor is used only for stack 1 in this version. It works as a sensor to check whether or not the reader plate carrier is empty.
During the self-test procedure, the x and z transport systems will be calibrated. The measured offset values will be shown.
If a barcode reader is built in, it will be used to read the barcode of the inserted plate.
When you press the ‘Read Barcode’ button, the barcode reader is triggered. You can use this function to align the barcode reader or test its function (you will see the red laser beam). As there is no plate movement to the barcode read position, a built in barcode reader will not read a barcode value using this function.
BMG LABTECH PHERAstar Software Manual – Part II: Control Software
2010-03-15 0470F0026A 21/138
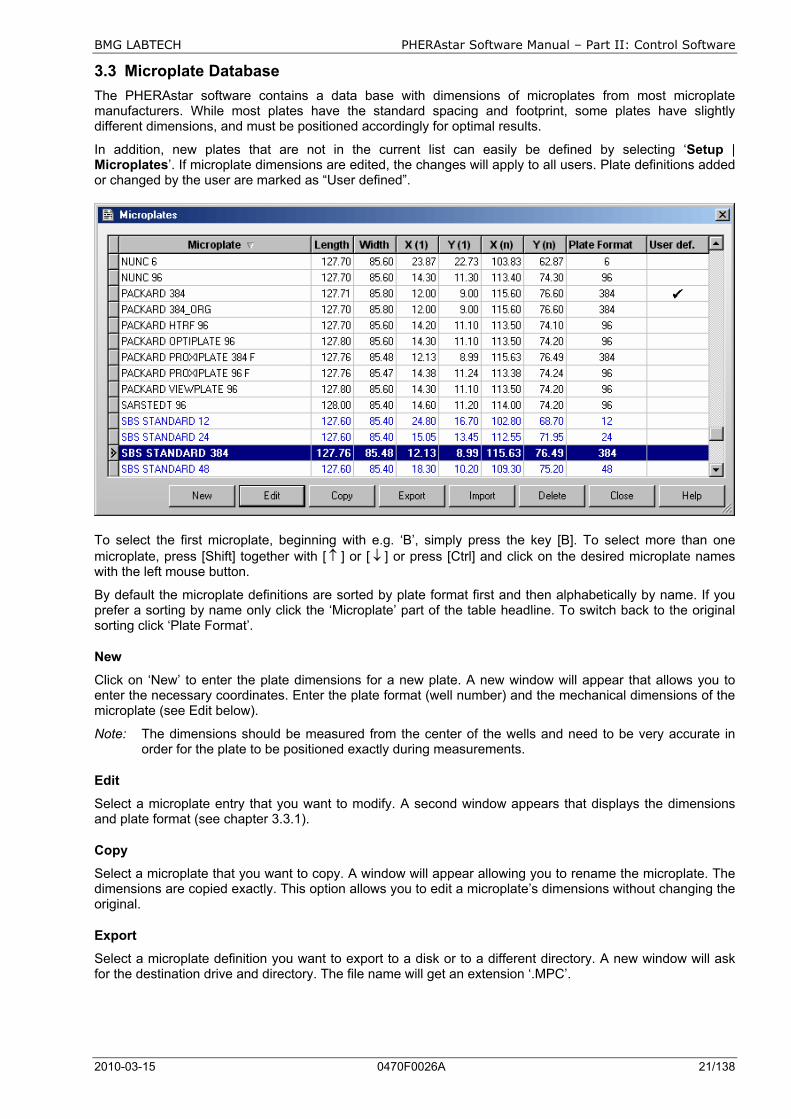
3.3 Microplate Database The PHERAstar software contains a data base with dimensions of microplates from most microplate manufacturers. While most plates have the standard spacing and footprint, some plates have slightly different dimensions, and must be positioned accordingly for optimal results.
In addition, new plates that are not in the current list can easily be defined by selecting ‘Setup | Microplates’. If microplate dimensions are edited, the changes will apply to all users. Plate definitions added or changed by the user are marked as “User defined”.
To select the first microplate, beginning with e.g. ‘B’, simply press the key [B]. To select more than one microplate, press [Shift] together with [ ↑ ] or [ ↓ ] or press [Ctrl] and click on the desired microplate names with the left mouse button.
By default the microplate definitions are sorted by plate format first and then alphabetically by name. If you prefer a sorting by name only click the ‘Microplate’ part of the table headline. To switch back to the original sorting click ‘Plate Format’.
New
Click on ‘New’ to enter the plate dimensions for a new plate. A new window will appear that allows you to enter the necessary coordinates. Enter the plate format (well number) and the mechanical dimensions of the microplate (see Edit below).
Note: The dimensions should be measured from the center of the wells and need to be very accurate in order for the plate to be positioned exactly during measurements.
Edit
Select a microplate entry that you want to modify. A second window appears that displays the dimensions and plate format (see chapter 3.3.1).
Copy
Select a microplate that you want to copy. A window will appear allowing you to rename the microplate. The dimensions are copied exactly. This option allows you to edit a microplate’s dimensions without changing the original.
Export
Select a microplate definition you want to export to a disk or to a different directory. A new window will ask for the destination drive and directory. The file name will get an extension ‘.MPC’.
PHERAstar Software Manual – Part II: Control Software BMG LABTECH
22/138 0470F0026A 2010-03-15
Import
Imports microplate definition from a disk or another directory and adds it to the existing data base. The extension for the microplate file must be ‘.MPC’ or ‘.MPL’ (microplate definitions exported from other / older BMG LABTECH programs).
Delete
Removes an existing microplate and its dimensions from the data base.
Close
Closes this window.
Notes: Exporting the microplate table into a Excel (.xls / .xlsx), text or HTML file is possible after right
clicking the table.
Users with activated ‘Run Only’ option (see chapter 1 Login Screen) are not allowed to edit, copy or import microplate definitions.
3.3.1 Define a Microplate
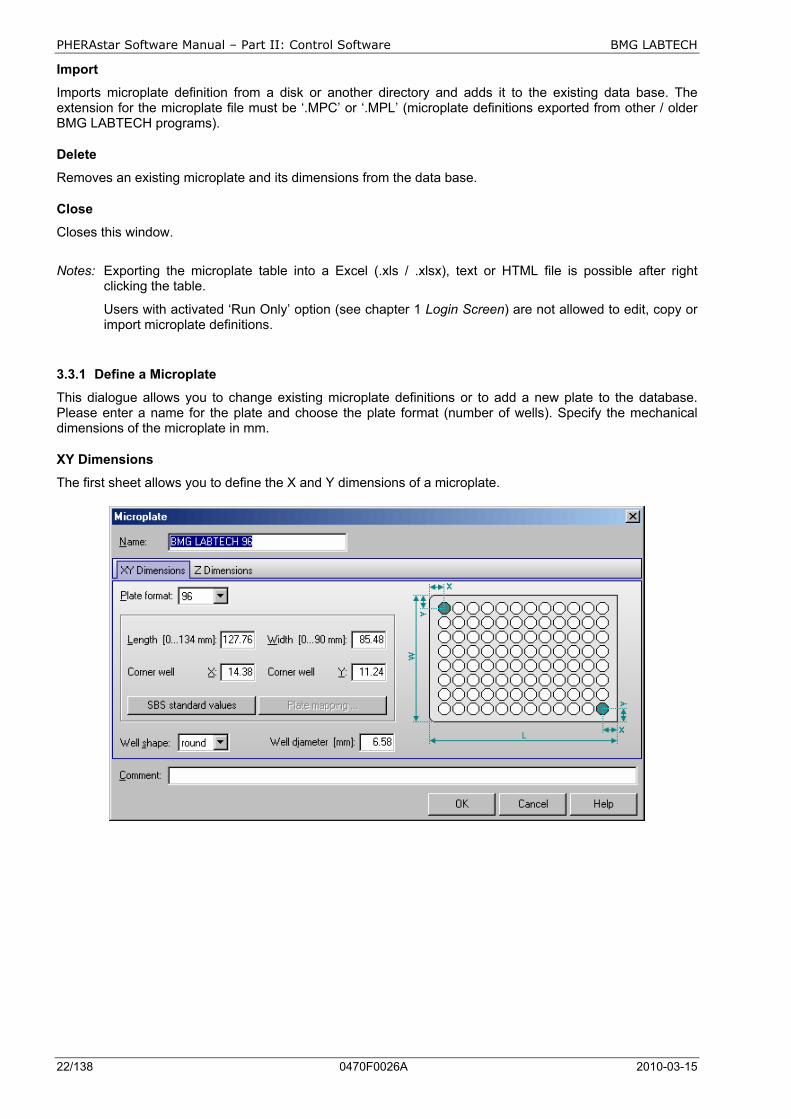
This dialogue allows you to change existing microplate definitions or to add a new plate to the database. Please enter a name for the plate and choose the plate format (number of wells). Specify the mechanical dimensions of the microplate in mm.
XY Dimensions
The first sheet allows you to define the X and Y dimensions of a microplate.
BMG LABTECH PHERAstar Software Manual – Part II: Control Software
2010-03-15 0470F0026A 23/138
Name Name of the new microplate
Plate Format Select the total number of wells in the plate – 3456 *, 1536, 384, 96, 48, 24, 12 or 6 wells.
Length The outer length of the entire microplate, from border to border.
Width Outer width of entire microplate, from top to bottom.
Corner well X
Distance from the left border of the microplate to the center of a well in the first column = distance from the center of a well in the last column to the right border of the microplate. **
Corner well Y
Distance from the top border of the microplate to the center of a well in the first row = distance from the center of a well in the last row to the bottom border of the microplate. **
Well shape Select between round and square. This information is necessary for well scanning.
Well diameter Diameter of a well. This information is necessary for well scanning.
* 3456 well plates can only be measured using a PHERAstar FS reader.
** The software shows by default only one X and Y distance for the corner wells, based on the assumption that the plate is symmetrical.
It you want to define asymmetrical plates, use the key combination [Ctrl]+[U] or click the plate drawing. The dialogue will then show input boxes for the distance to the top left well (X(1), Y(1)) and to the bottom right well (X(n), Y(n)). When opening an existing asymmetrical plate definition, the dialogue will also open in the "asymmetrical" version. When you define a new microplate using this mode, the values for X(n) and Y(n) will be pre-calculated as soon as the length and X(1) or the width and Y(1) are entered. It is possible to override the pre-calculated values. Please note: this calculation will only take place as long as there are 0 values inserted for X(n) and Y(n).
SBS standard values
After clicking this button the SBS (Society for Biomolecular Screening) standard X and Y dimensions for the selected plate format will be entered. Please select the well shape and define the well diameter / width.
Plate mapping
For microplates using the 96 to 3456 well formats it is possible to automatically determine the positions of the corner wells (see chapter 3.3.2).
PHERAstar Software Manual – Part II: Control Software BMG LABTECH
24/138 0470F0026A 2010-03-15
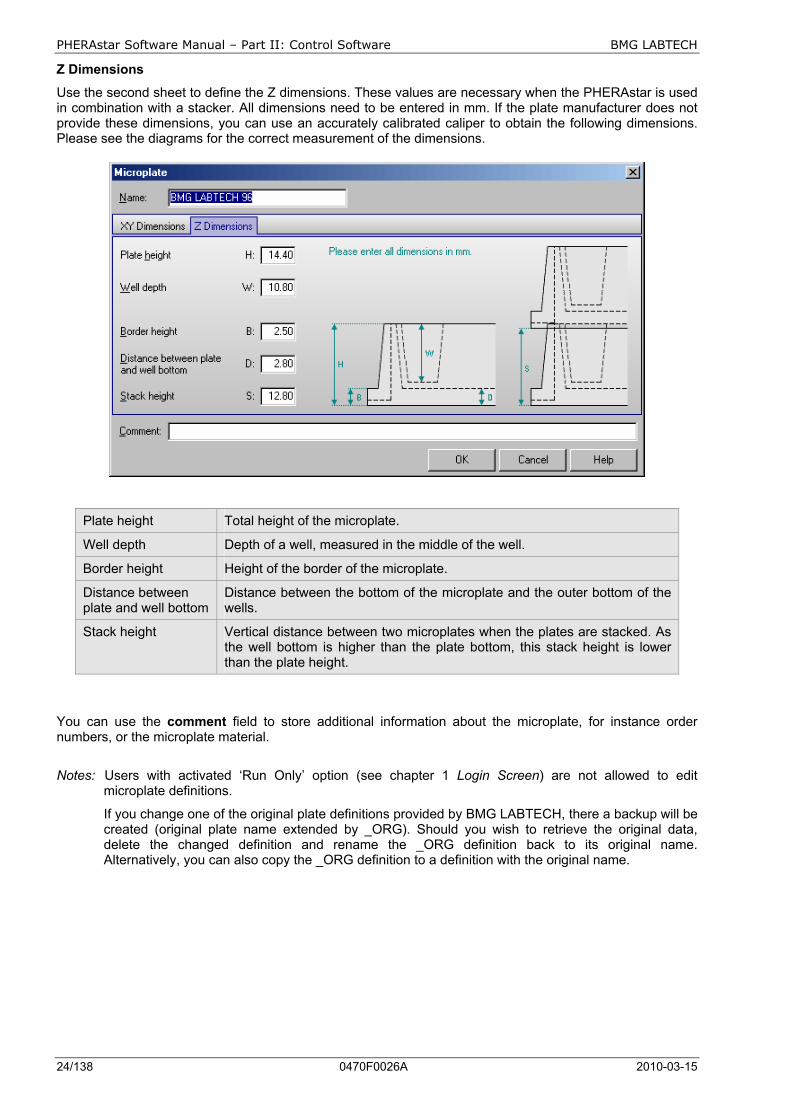
Z Dimensions
Use the second sheet to define the Z dimensions. These values are necessary when the PHERAstar is used in combination with a stacker. All dimensions need to be entered in mm. If the plate manufacturer does not provide these dimensions, you can use an accurately calibrated caliper to obtain the following dimensions. Please see the diagrams for the correct measurement of the dimensions.
Plate height Total height of the microplate.
Well depth Depth of a well, measured in the middle of the well.
Border height Height of the border of the microplate.
Distance between plate and well bottom
Distance between the bottom of the microplate and the outer bottom of the wells.
Stack height Vertical distance between two microplates when the plates are stacked. As the well bottom is higher than the plate bottom, this stack height is lower than the plate height.
You can use the comment field to store additional information about the microplate, for instance order numbers, or the microplate material.
Notes: Users with activated ‘Run Only’ option (see chapter 1 Login Screen) are not allowed to edit
microplate definitions.
If you change one of the original plate definitions provided by BMG LABTECH, there a backup will be created (original plate name extended by _ORG). Should you wish to retrieve the original data, delete the changed definition and rename the _ORG definition back to its original name. Alternatively, you can also copy the _ORG definition to a definition with the original name.
BMG LABTECH PHERAstar Software Manual – Part II: Control Software
2010-03-15 0470F0026A 25/138
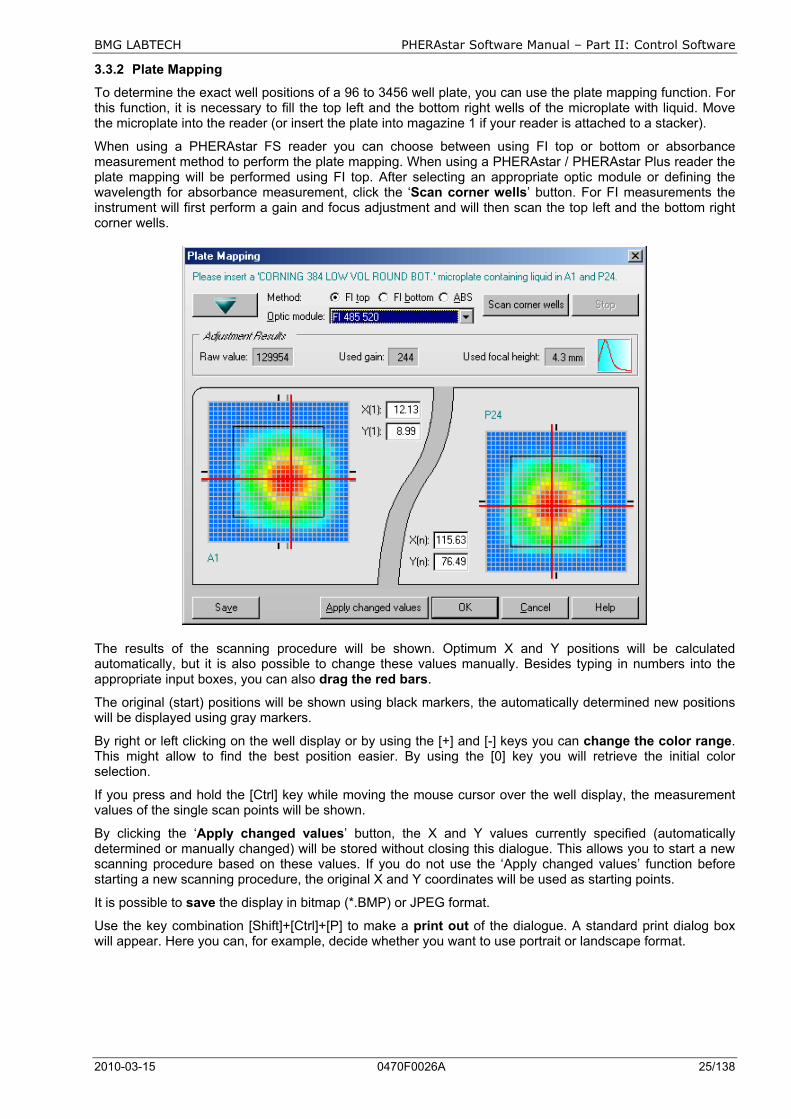
3.3.2 Plate Mapping
To determine the exact well positions of a 96 to 3456 well plate, you can use the plate mapping function. For this function, it is necessary to fill the top left and the bottom right wells of the microplate with liquid. Move the microplate into the reader (or insert the plate into magazine 1 if your reader is attached to a stacker).
When using a PHERAstar FS reader you can choose between using FI top or bottom or absorbance measurement method to perform the plate mapping. When using a PHERAstar / PHERAstar Plus reader the plate mapping will be performed using FI top. After selecting an appropriate optic module or defining the wavelength for absorbance measurement, click the ‘Scan corner wells’ button. For FI measurements the instrument will first perform a gain and focus adjustment and will then scan the top left and the bottom right corner wells.
The results of the scanning procedure will be shown. Optimum X and Y positions will be calculated automatically, but it is also possible to change these values manually. Besides typing in numbers into the appropriate input boxes, you can also drag the red bars.
The original (start) positions will be shown using black markers, the automatically determined new positions will be displayed using gray markers.
By right or left clicking on the well display or by using the [+] and [-] keys you can change the color range. This might allow to find the best position easier. By using the [0] key you will retrieve the initial color selection.
If you press and hold the [Ctrl] key while moving the mouse cursor over the well display, the measurement values of the single scan points will be shown.
By clicking the ‘Apply changed values’ button, the X and Y values currently specified (automatically determined or manually changed) will be stored without closing this dialogue. This allows you to start a new scanning procedure based on these values. If you do not use the ‘Apply changed values’ function before starting a new scanning procedure, the original X and Y coordinates will be used as starting points.
It is possible to save the display in bitmap (*.BMP) or JPEG format.
Use the key combination [Shift]+[Ctrl]+[P] to make a print out of the dialogue. A standard print dialog box will appear. Here you can, for example, decide whether you want to use portrait or landscape format.

PHERAstar Software Manual – Part II: Control Software BMG LABTECH
26/138 0470F0026A 2010-03-15
3.4 Program Configuration Program Configuration allows the user to modify the appearance of the software. You can activate a feature by ticking the box next to the statement.
3.4.1 Preferences Sheet
In the first sheet you can select how the measurement data should be stored. Here you can also define some general program behavior settings.
Save measurement data in ASCII format
By default all measurement data is saved in dBase format in the specified user directory (see chapters 3.6 Login and 3.7 Data Path). This type of data can be used with the BMG LABTECH Data Analysis software. If you prefer to use a different data analysis software package which will not work with dBase formats, then it is also possible to store the data in ASCII format. If you select this option then the ‘Define Format for ASCII Export’ window becomes available (see chapter 3.5).
Save measurement data in dBase format
If this option is selected, all measurement data is stored in a set of dbase files in the data directory of the user logged in, e.g. ‘~:\Program Files\BMG\OPTIMA\<Username>\Data’. The data is saved in a dBase file format that can be used with the BMG LABTECH data analysis software (with both, the Excel based Evaluation Software and the new generation Data Analysis Software MARS). If you would rather use a different data analysis software package which will not work with dBase formats, then it is possible to get an ASCII file (see above).
Note: It is possible to use both formats simultaneously.
Allow protocol specific output settings
If this option is checked, there will be an extra sheet ‘Output’ in all protocol editors. Using this sheet you might define specific output settings (e.g. a special ASCII output directory or file format) for each test protocol. All protocols where no specific settings have been defined will use the standard settings defined here inside the Program Configuration dialogue.
Auto login
If you choose the option ‘Automatic login as user “USER” at program start’ there will be no login screen at program start, instead you will be logged in as the default user ‘USER’. It is still possible to use the login function later (‘Setup | Login’).
Note: Setting this option is only possible if you are logged in as “USER” and if the administrator has not disabled this function (see chapter 1 Login Screen).
Return to selection window after editing microplates or test protocols
The selection window for tests and microplates contains previously defined setups and options to edit, export, import, etc.. By default, you can return to the main control software after creating or editing a test or microplate definition without returning to the selection window. If you wish to see the selection window for the microplates or test protocol definitions again, check the box in the ‘Program Configuration’ window.
BMG LABTECH PHERAstar Software Manual – Part II: Control Software
2010-03-15 0470F0026A 27/138
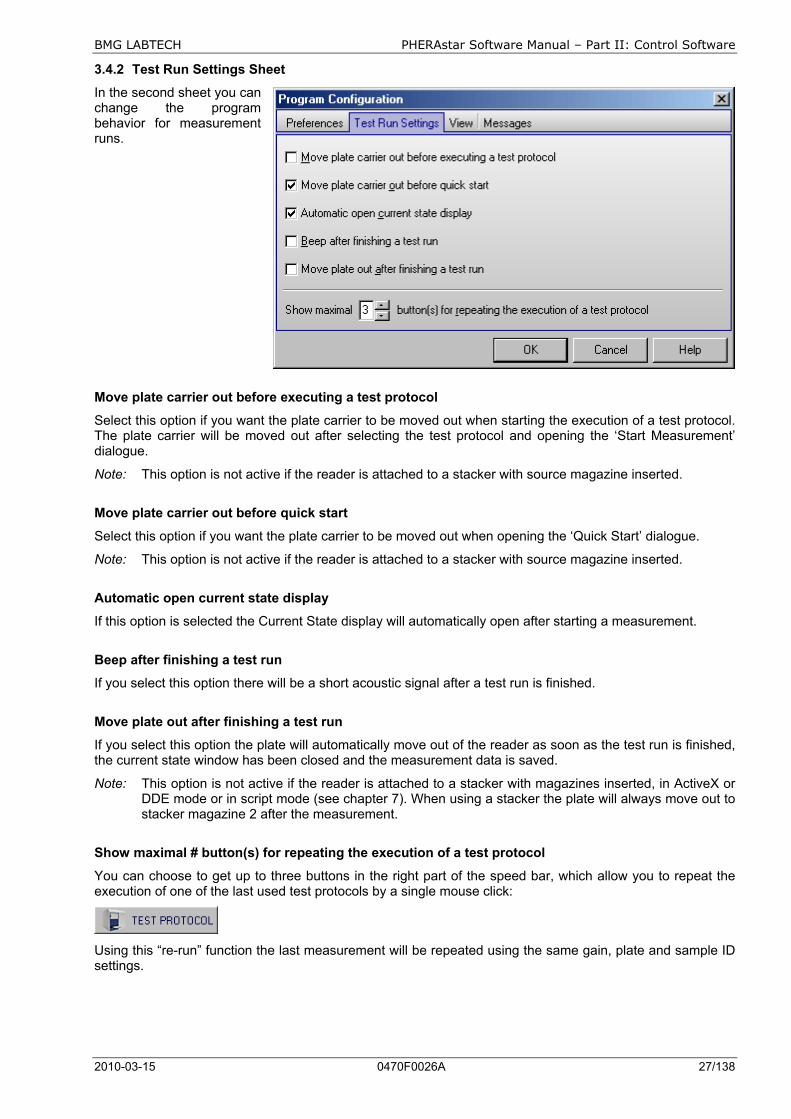
3.4.2 Test Run Settings Sheet
In the second sheet you can change the program behavior for measurement runs.
Move plate carrier out before executing a test protocol
Select this option if you want the plate carrier to be moved out when starting the execution of a test protocol. The plate carrier will be moved out after selecting the test protocol and opening the ‘Start Measurement’ dialogue.
Note: This option is not active if the reader is attached to a stacker with source magazine inserted.
Move plate carrier out before quick start
Select this option if you want the plate carrier to be moved out when opening the ‘Quick Start’ dialogue.
Note: This option is not active if the reader is attached to a stacker with source magazine inserted.
Automatic open current state display
If this option is selected the Current State display will automatically open after starting a measurement.
Beep after finishing a test run
If you select this option there will be a short acoustic signal after a test run is finished.
Move plate out after finishing a test run
If you select this option the plate will automatically move out of the reader as soon as the test run is finished, the current state window has been closed and the measurement data is saved.
Note: This option is not active if the reader is attached to a stacker with magazines inserted, in ActiveX or DDE mode or in script mode (see chapter 7). When using a stacker the plate will always move out to stacker magazine 2 after the measurement.
Show maximal # button(s) for repeating the execution of a test protocol
You can choose to get up to three buttons in the right part of the speed bar, which allow you to repeat the execution of one of the last used test protocols by a single mouse click:
Using this “re-run” function the last measurement will be repeated using the same gain, plate and sample ID settings.
PHERAstar Software Manual – Part II: Control Software BMG LABTECH
28/138 0470F0026A 2010-03-15
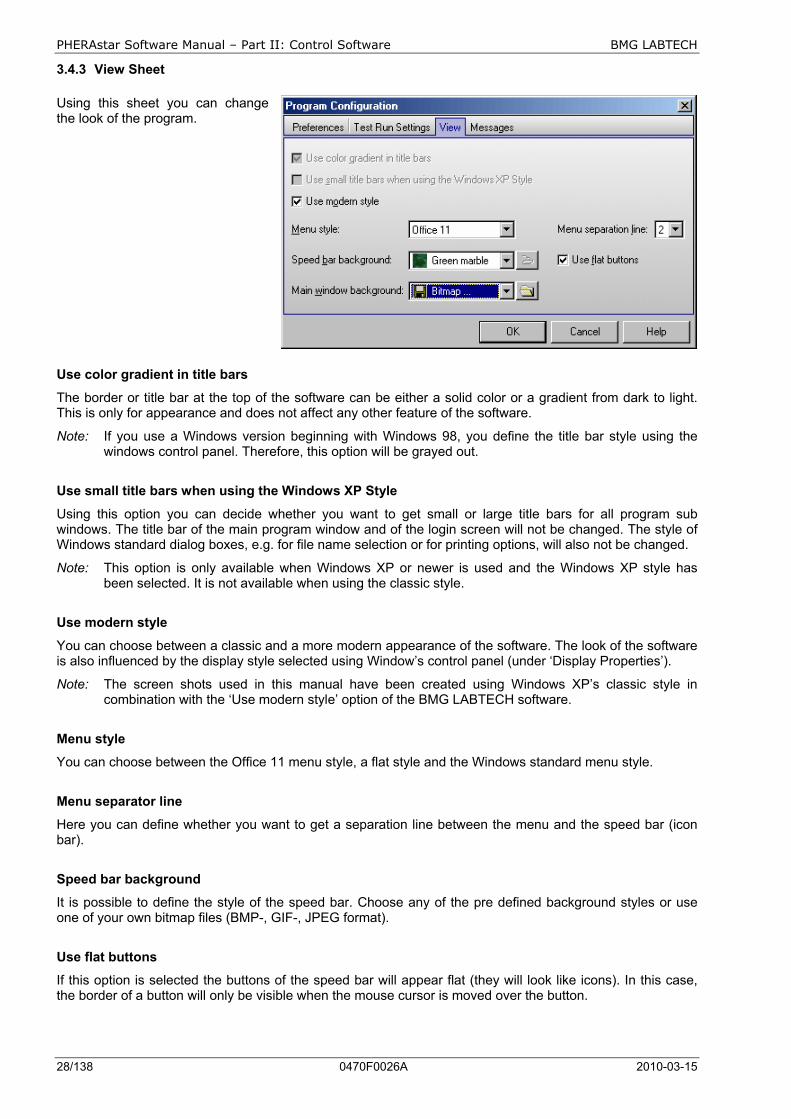
3.4.3 View Sheet
Using this sheet you can change the look of the program.
Use color gradient in title bars
The border or title bar at the top of the software can be either a solid color or a gradient from dark to light. This is only for appearance and does not affect any other feature of the software.
Note: If you use a Windows version beginning with Windows 98, you define the title bar style using the windows control panel. Therefore, this option will be grayed out.
Use small title bars when using the Windows XP Style
Using this option you can decide whether you want to get small or large title bars for all program sub windows. The title bar of the main program window and of the login screen will not be changed. The style of Windows standard dialog boxes, e.g. for file name selection or for printing options, will also not be changed.
Note: This option is only available when Windows XP or newer is used and the Windows XP style has been selected. It is not available when using the classic style.
Use modern style
You can choose between a classic and a more modern appearance of the software. The look of the software is also influenced by the display style selected using Window’s control panel (under ‘Display Properties’).
Note: The screen shots used in this manual have been created using Windows XP’s classic style in combination with the ‘Use modern style’ option of the BMG LABTECH software.
Menu style
You can choose between the Office 11 menu style, a flat style and the Windows standard menu style.
Menu separator line
Here you can define whether you want to get a separation line between the menu and the speed bar (icon bar).
Speed bar background
It is possible to define the style of the speed bar. Choose any of the pre defined background styles or use one of your own bitmap files (BMP-, GIF-, JPEG format).
Use flat buttons
If this option is selected the buttons of the speed bar will appear flat (they will look like icons). In this case, the border of a button will only be visible when the mouse cursor is moved over the button.

BMG LABTECH PHERAstar Software Manual – Part II: Control Software
2010-03-15 0470F0026A 29/138
Main window background
Similar to the speed bar it is also possible to define the background of the main program window. Choose any of the pre defined background styles or use one of your own bitmap files. If you use a bitmap with dimensions different to the size of the program main window it will be scaled to this size.
3.4.4 Messages Sheet
The last sheet allows you to configure which messages should be shown or not.
You can for example define to get a warning message displayed when trying to execute a test protocol with an inappropriate gain value or injection speed.
Perform an additional microplate search at program end
If a stacker is attached to the reader there will be a plate search performed at program start. Using this option you can activate an additional search at program end. If a plate is found inside the reader plate carrier or on the stacker table, it will be moved to magazine 2.
Show a warning message if a microplate is inside the reader at program end
If no stacker is attached to the reader, you can get an optional warning message if a microplate is inside the reader at program end. You will then be asked whether you want the plate been moved out or not.
Note: This feature is only available for PHERAstar FS readers and will only work if the plate has been moved in after initializing the reader or if a measurement has been performed.
Confirm program exit
If you deselect this option there will be no confirmation window when exiting the program.
Note: All settings from the program configuration window besides the Auto Login option are user specific, therefore, each user can select the preferences independently.
PHERAstar Software Manual – Part II: Control Software BMG LABTECH
30/138 0470F0026A 2010-03-15
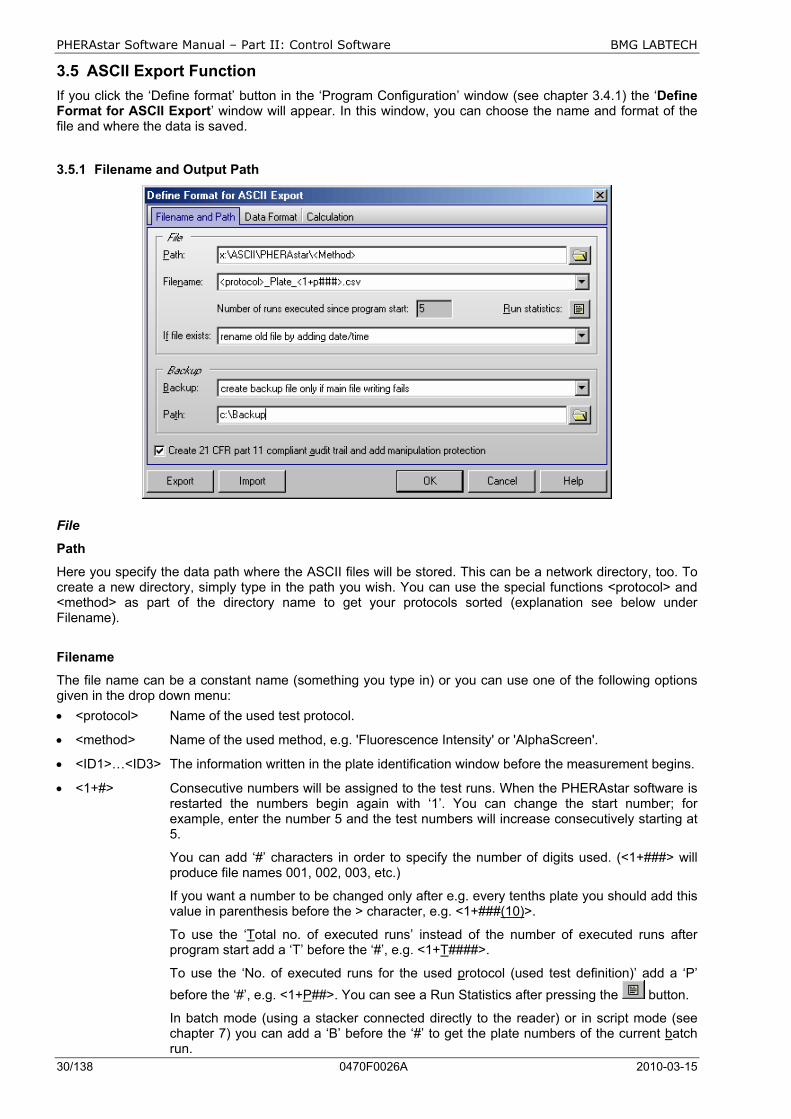
3.5 ASCII Export Function If you click the ‘Define format’ button in the ‘Program Configuration’ window (see chapter 3.4.1) the ‘Define Format for ASCII Export’ window will appear. In this window, you can choose the name and format of the file and where the data is saved.
3.5.1 Filename and Output Path
File
Path
Here you specify the data path where the ASCII files will be stored. This can be a network directory, too. To create a new directory, simply type in the path you wish. You can use the special functions <protocol> and <method> as part of the directory name to get your protocols sorted (explanation see below under Filename).
Filename
The file name can be a constant name (something you type in) or you can use one of the following options given in the drop down menu: • <protocol> Name of the used test protocol.
• <method> Name of the used method, e.g. 'Fluorescence Intensity' or 'AlphaScreen'.
• <ID1>…<ID3> The information written in the plate identification window before the measurement begins.
• <1+#> Consecutive numbers will be assigned to the test runs. When the PHERAstar software is restarted the numbers begin again with ‘1’. You can change the start number; for example, enter the number 5 and the test numbers will increase consecutively starting at 5.
You can add ‘#’ characters in order to specify the number of digits used. (<1+###> will produce file names 001, 002, 003, etc.)
If you want a number to be changed only after e.g. every tenths plate you should add this value in parenthesis before the > character, e.g. <1+###(10)>.
To use the ‘Total no. of executed runs’ instead of the number of executed runs after program start add a ‘T’ before the ‘#’, e.g. <1+T####>.
To use the ‘No. of executed runs for the used protocol (used test definition)’ add a ‘P’ before the ‘#’, e.g. <1+P##>. You can see a Run Statistics after pressing the button.
In batch mode (using a stacker connected directly to the reader) or in script mode (see chapter 7) you can add a ‘B’ before the ‘#’ to get the plate numbers of the current batch run.
BMG LABTECH PHERAstar Software Manual – Part II: Control Software
2010-03-15 0470F0026A 31/138
Counting down is also possible, use a ‘-‘ instead of the ‘+’.
• <A+#> Identical to consecutive numbers except now the file name will be consecutive alphabetical letters. The number of letters used can be modified (i.e. <A+###> will result in AAA, AAB, AAC, etc).
• <date> Current date You can specify the date format if you add a format description after “<date:” using yy or
yyyy for the year, m or mm for the month and d or dd for the day: yy year with two digits (1999 => 99, 2000 => 00) yyyy year with four digits m one or two digits for the month (January => 1, December => 12) mm month with two digits (January => 01) mmm abbreviated name of the month (January => Jan.) mmmm full name of the month d day with one or two digits dd day always with two digits ddd abbreviated name of the day (Monday => Mo.) dddd full name of the day ddddd date in the format defined as “Short Date Format” under windows
(‘Settings | Control Panel | Regional Settings’) dddddd date in the format defined as “Long Date Format”
Example: <date:yyyy_mm_dd>
If you do not specify the format “yyyymmdd” will be used.
• <time> Current time
You can specify the time format if you add a format description after “<time:”: h or hh for the hour (one or always two digits) m or mm for the minute s or ss for the second t time in the format defined as “Short Time Format” under windows (‘Settings | Control
Panel | Regional Settings’) tt time in the format defined as “Long Time Format” am/pm or a/p or AM/PM or Am/Pm use 12 hours format and show am or pm (a or p...)
Example: <time:hh.mm.ss>
If you do not specify the format “hhmmss” will be used.
• <ser_number> Serial number of the reader used • <barcode> Barcode of the current plate (only available if the reader is directly connected to a
stacker equipped with a barcode reader and only available for measurements using the stacker, not for single plate measurements without stacker magazine 1 inserted). If you use a stacker in combination with the Stacker Control software, you can select <barcode> in the Stacker Control software for one ID number and select this ID in this program to name the output file according to the plate barcode.
• <barcode_left>, <barcode_front>, <barcode_right> Barcode attached to the left / front / right side of the current plate (this option will use the internal barcode readers of the PHERAstar FS and is, therefore, only available when using a PHERAstar FS).
You can use more than one of these parameters at one time in the filename (example: <protocol> plate <1+###>.dat). If a file extension is not specified then ‘.DAT’ is added automatically.
Number of executed runs
The ‘counter’ tracks the number of measurements that were performed after the program was started. You can manually type in a starting number. This number will be used in the filename options <1+#> and <A+#>.
To see a Run Statistics press the button (see chapter 3.5.4).
PHERAstar Software Manual – Part II: Control Software BMG LABTECH
32/138 0470F0026A 2010-03-15
If file exists:
If a file with the same name already exists, then there are several options:
• Rename the old file by adding date and time to distinguish it from the more recent file.
• Overwrite old file.
• Append the new data to the existing file (it will list separate tests in the same file; each test can be separated by a dashed line. See also the ‘Separate data blocks with an empty line’ option described below).
Backup
Here you can choose what to do if the data storage to the above defined directory fails:
• no backup file Show an error message when creation / writing into the defined ASCII file failed. The measurement results are still available in the database files (dBase format, for usage with e.g. Excel).
• create backup file only if main file writing fails If creation / writing into the defined ASCII file failed the ASCII file will be stored in the specified backup directory (same filename and behavior if file already exists as defined above). If writing into the backup file fails too, then there will be an error message. This setting is recommended if the main path is on a network drive.
• always create backup file The ASCII file will be stored using the specified main path. A second copy will be stored in the backup directory (same filename and behavior if file already exists as defined above). There will be no error message when writing into the main file failed. But there will be an error message if writing into the backup file fails.
• always create backup file (no error message when this fails) The ASCII file will be stored in the specified main directory. A second copy will be stored in the backup directory (same filename and behavior if file already exists as defined above). There will be no error message when writing into the main and/or backup file failed.
Path
Specify the path for storing the backup copy of the ASCII file.
Create 21 CFR part 11 compliant audit trail and add manipulation protection
If you use this option, there will be an additional file created for each ASCII file (same file name, but with additional file extension ‘.at’). This file will contain an anti manipulation hash value and the audit trail for the data stored in the connected ASCII file. The anti manipulation hash value will protect the whole ASCII file and the audit trail entries (see software manual part IV: FDA 21 CFR part 11).
The hash value will be created when the control part of the BMG LABTECH software creates the ASCII data file. It can be checked using the “Check Data Integrity” tool (see software manual part IV).
Export / Import
It is possible to export and re-import the whole set of ASCII settings. This might be especially useful when using protocol specific output settings (see chapter 4.3.16) to transfer the settings from one protocol to another.
BMG LABTECH PHERAstar Software Manual – Part II: Control Software
2010-03-15 0470F0026A 33/138
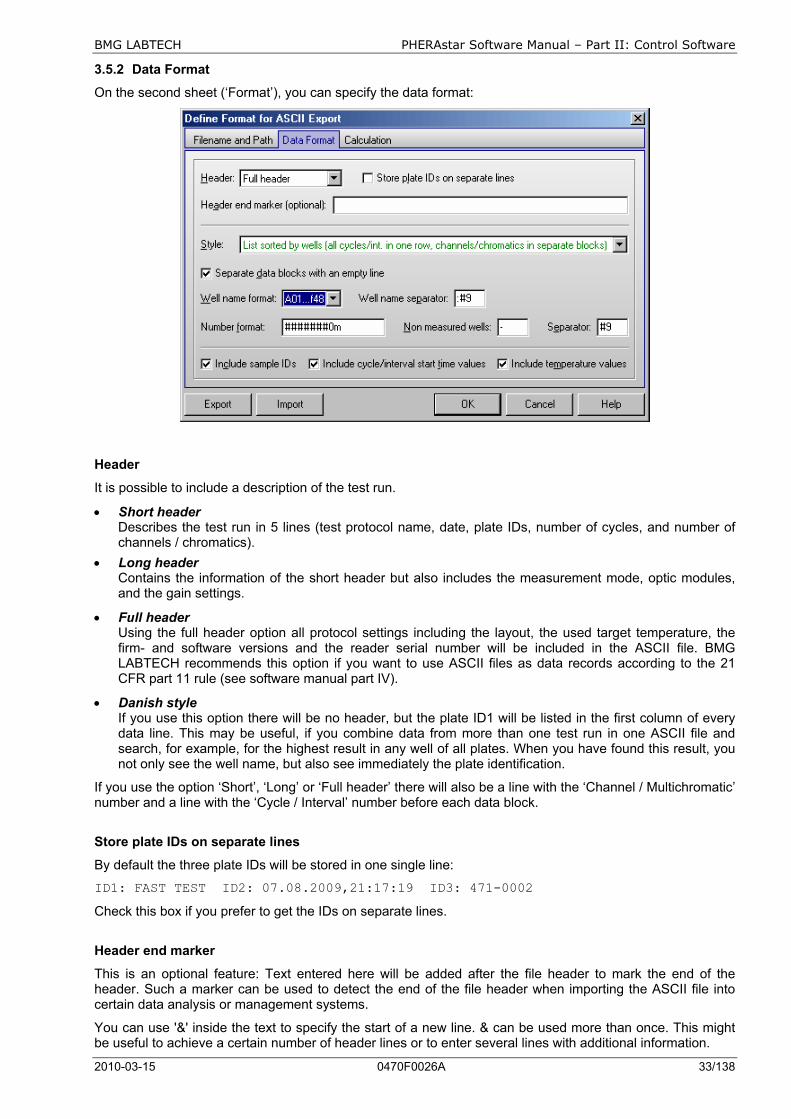
3.5.2 Data Format
On the second sheet (‘Format’), you can specify the data format:
Header
It is possible to include a description of the test run.
• Short header Describes the test run in 5 lines (test protocol name, date, plate IDs, number of cycles, and number of channels / chromatics).
• Long header Contains the information of the short header but also includes the measurement mode, optic modules, and the gain settings.
• Full header Using the full header option all protocol settings including the layout, the used target temperature, the firm- and software versions and the reader serial number will be included in the ASCII file. BMG LABTECH recommends this option if you want to use ASCII files as data records according to the 21 CFR part 11 rule (see software manual part IV).
• Danish style If you use this option there will be no header, but the plate ID1 will be listed in the first column of every data line. This may be useful, if you combine data from more than one test run in one ASCII file and search, for example, for the highest result in any well of all plates. When you have found this result, you not only see the well name, but also see immediately the plate identification.
If you use the option ‘Short’, ‘Long’ or ‘Full header’ there will also be a line with the ‘Channel / Multichromatic’ number and a line with the ‘Cycle / Interval’ number before each data block.
Store plate IDs on separate lines
By default the three plate IDs will be stored in one single line:
ID1: FAST TEST ID2: 07.08.2009,21:17:19 ID3: 471-0002
Check this box if you prefer to get the IDs on separate lines.
Header end marker
This is an optional feature: Text entered here will be added after the file header to mark the end of the header. Such a marker can be used to detect the end of the file header when importing the ASCII file into certain data analysis or management systems.
You can use '&' inside the text to specify the start of a new line. & can be used more than once. This might be useful to achieve a certain number of header lines or to enter several lines with additional information.
PHERAstar Software Manual – Part II: Control Software BMG LABTECH
34/138 0470F0026A 2010-03-15
Style
The data can appear as a ‘Table’ (raw data side by side in a matrix) or a column (‘List’). It is possible to include the well numbers and to exclude non measured wells.
If you choose the option ‘Table with well numbers in plate layout style’ you will get the data represented in a table, where the well names are shown similar to what is printed on a microplate: 1 2 3 4 …
A 28672 22726 24340 25977 B 22908 23479 25483 27633 C 23722 23839 23020 23503 …
Tests that have more than one cycle or interval will have data blocks representing the results from each cycle / interval. Multichromatic measurements will appear with the data from the first optic module used, followed by the data from the second module, etc.
Using this style by default the well name separator will not be added in front of the line with the well column numbers (as it would look strange if there, for example, a comma would appear before the 1). On the other hand it might be useful to get the separator also in this line, e.g. if you intend to import a comma separated file into Excel. To get this separator please add the following line to the section [Configuration] of the PHERAstar.ini file: IncludeWellNameSeparatorInColumnNumbersRowForASCIIFiles=True
You can use the key combination [Shift]+[Ctrl]+[I] from the main screen of the PHERAstar Control software to open the PHERAstar.ini file. If the section [Configuration] does not yet exists, please add it to the end of the file.
If you choose the option ‘List sorted by wells’, you will get the measurement results for all cycles in one line per well, but if your test uses more than one optic module you will still get a separate data block for each chromatic (for each optic module used). Depending on the calculation method selected (see chapter 3.5.3) you will also get separate data blocks for each channel when using dual emission or fluorescence polarization methods and / or a data block for the ratio or the polarization values.
If you choose the option ‘List sorted by wells 2’, you will get all measurement results for one well in one line per well. Depending on the protocol executed and on the selection in the Calculation sheet (see below), the line will contain first the values of the first cycle/interval for the first chromatic (for a dual emission protocol this might be one value for channel A, one value for channel B and a ratio) and then the values for the second chromatic and so on. After this, the values of the second cycle/interval will follow and so on. When you perform a dual chromatic dual emission protocol and would like to store raw data and ratio, you will get the data in the following order:
First cycle 1A, 1B, Ratio-1, 2A, 2B, Ratio-2, second cycle 1A, 1B, Ratio-1, 2A, 2B, Ratio-2, third cycle …
To make the usage easier, the selections are grouped and each group will be shown in a different color. In addition, a hint (which appears when moving the mouse cursor to the style selection pull down box) will show a short example of the file format to be expected.
Separate data blocks with an empty line
If you use multichromatics or test protocols using two channels or if you use test protocols with more than one cycle / interval you will get more than one block of data in your ASCII file. By checking this box these blocks are separated by an empty line. There will also be an empty line separating the data from different test runs if you use the ‘Append data’ option (see above).
Well name format
Select whether or not you want the well name always to consist of two digit number (e.g. A09 instead of A9). If you prefer the well name with a one digit number, you might choose to get a trailing blank in front of the well names for column 1 to 9 to achieve an equally aligned layout.
Note: When using the ‘Table with well numbers in plate layout style’ it is not possible to define a well name format, as the well identification is done in a way similar to what is printed on a microplate.
Well name separator
Select how the well name should be separated from the following measurement values: use for example a comma, a semi colon or back slash. By selecting ‘#9’, a tab will be inserted.
BMG LABTECH PHERAstar Software Manual – Part II: Control Software
2010-03-15 0470F0026A 35/138
Number format
Select the number of digits before and after the decimal point. A position described with a # symbol will be a number or a space; a position described with a zero will be a number or a zero.
For absorbance tests, you should specify a format of 0.000 because the OD values can range from 0.000 to 4.500. By adding a ‘m’ to the format string (e.g. ‘###0m’) the numbers will be expressed in milliOD (0 to 4500 mOD).
Non-measured wells
Select the appearance of a non-measured well, for example: hyphen (-), backslash (/), n.a., or a zero (0).
Separator
Select how the individual raw data number will be separated: use, for example, a comma, a semi colon or back slash. By selecting ‘#9’, a tab will be used.
Include sample IDs
Store the sample IDs (see chapter 6.4) also in the ASCII file (after the measurement value).
Include cycle/interval start time values
If this option is selected, the cycle start times (plate mode) or the interval start times (well mode) will also be included. The time values will be stored in a separate line in front of each measurement values block or in one line before the data when using a ‘List sorted by wells’ style. If you have decided to include a header, the time information is preceded by ‘Time [s]: ’, otherwise only the numbers will be stored.
Include temperature values
Store the temperature which was measured during the measurement of each cycle (plate mode) or during the measurement of each well (well mode).
Note: For this function it is necessary that the built in incubator is switched on or that the temperature monitoring function is used (see chapter 5).
Note: If you enter spaces, for example into the separator input box, a small dot will be shown instead of the
space to make it easier to check the input.
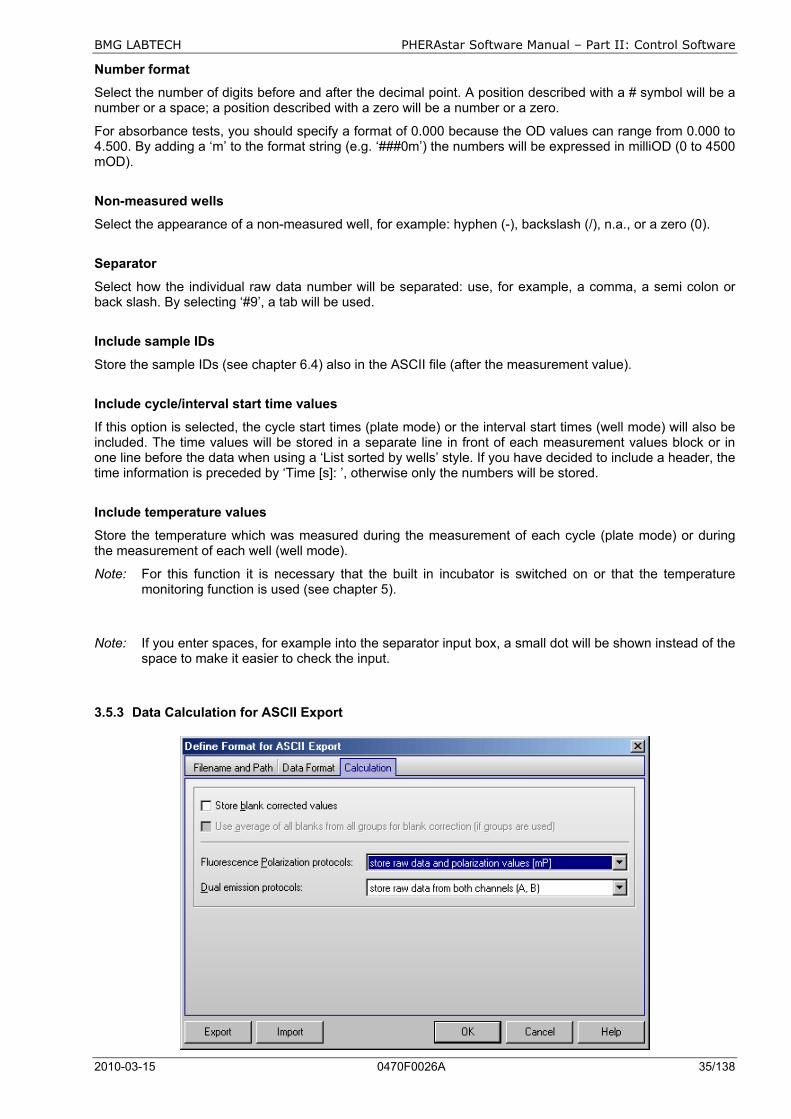
3.5.3 Data Calculation for ASCII Export
PHERAstar Software Manual – Part II: Control Software BMG LABTECH
36/138 0470F0026A 2010-03-15
Store blank corrected values
If this option is selected, the measurement values stored in the ASCII file will be blank corrected.
Use average of all blanks from all groups for blank correction
This option is only important when different layout groups (see chapter 4.3.9 Using Layout Groups) are used. If this option is not selected the measurement values of a group will be corrected using only blanks from the same group. If you select this option, the correction will be done using the average of all blanks from all groups.
Fluorescence Polarization protocols
For fluorescence polarization tests you can decide whether you want the raw data for both channels to be stored or the polarization or anisotropy values or a combination of raw data and polarization or anisotropy values. The polarization value will be calculated and stored in mP, the anisotropy values in mA.
Polarization values: P = Ch.A - Ch.B Ch.A + Ch.B
Anisotropy values: A = Ch.A - Ch.B Ch.A + 2(Ch.B)
Dual emission protocols
For dual emission tests you can decide whether you want to store the raw data for the two channels (order A, B or B, A) or the ratio of the two channels (A / B or B / A). It is also possible to store both the raw data and the ratio.
Note: All settings from the ‘Define Format for ASCII Export’ window are user specific, therefore, each user
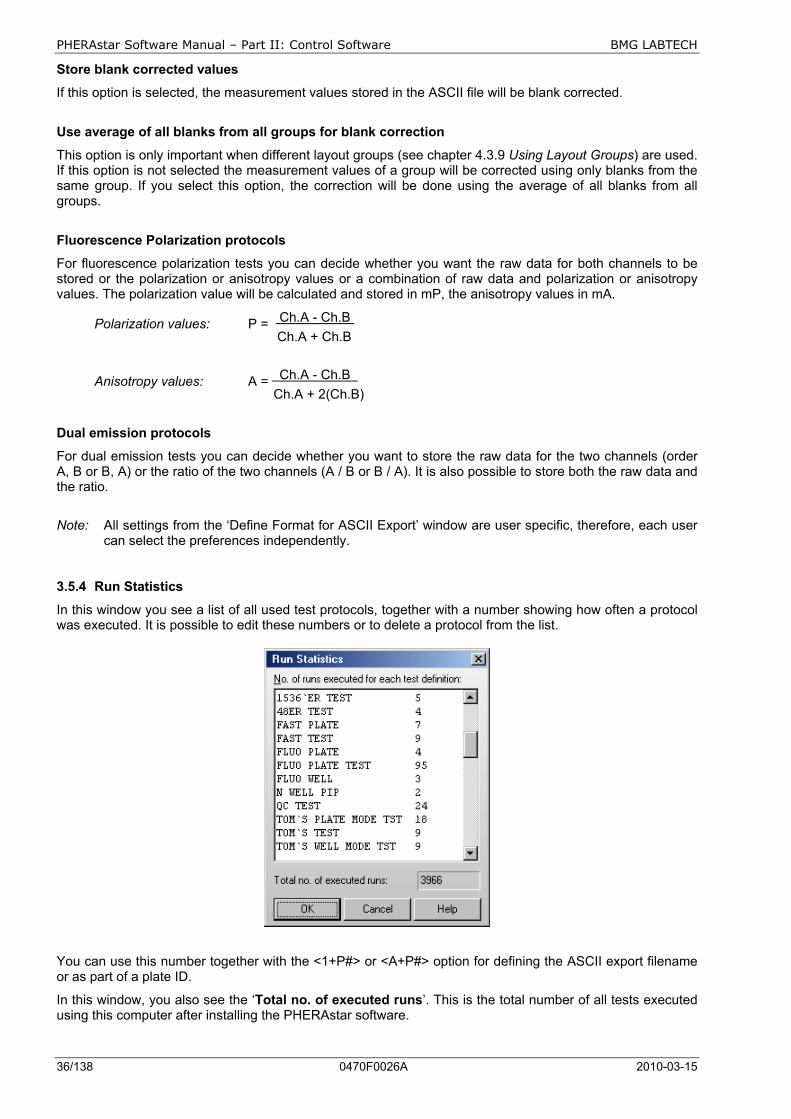
can select the preferences independently. 3.5.4 Run Statistics
In this window you see a list of all used test protocols, together with a number showing how often a protocol was executed. It is possible to edit these numbers or to delete a protocol from the list.
You can use this number together with the <1+P#> or <A+P#> option for defining the ASCII export filename or as part of a plate ID.
In this window, you also see the ‘Total no. of executed runs’. This is the total number of all tests executed using this computer after installing the PHERAstar software.
BMG LABTECH PHERAstar Software Manual – Part II: Control Software
2010-03-15 0470F0026A 37/138
3.6 Login The login function is described in chapter 1 Login Screen.
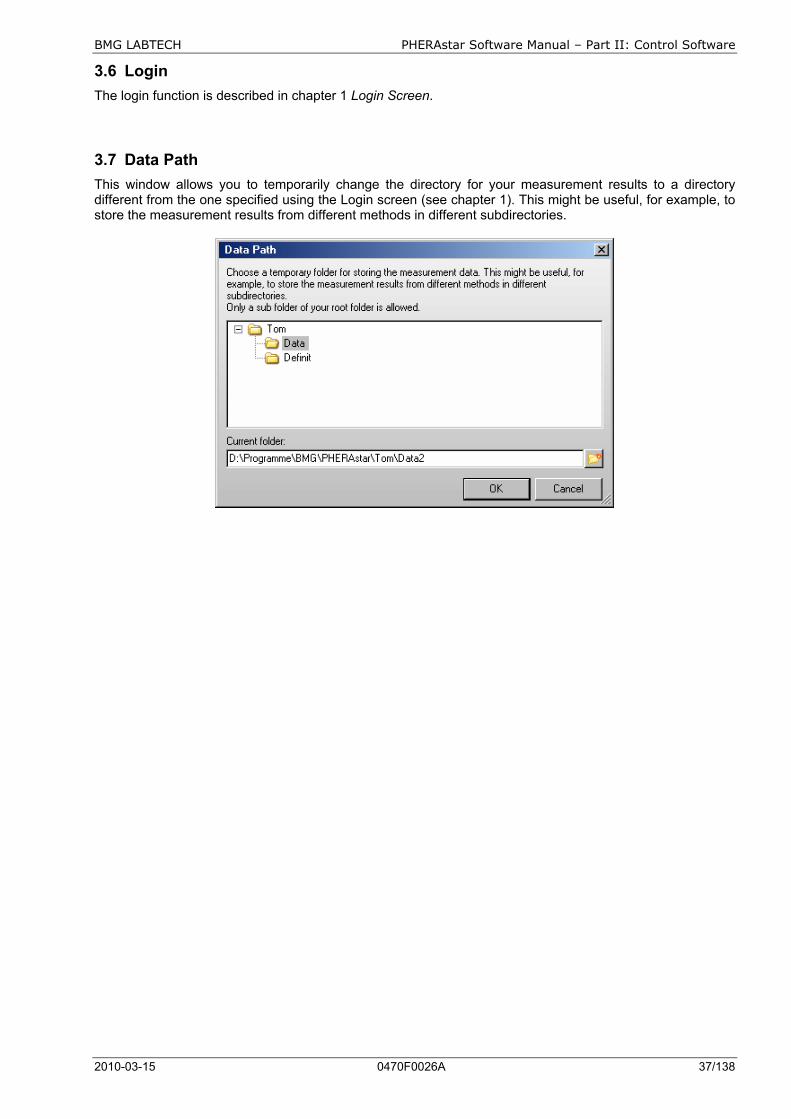
3.7 Data Path This window allows you to temporarily change the directory for your measurement results to a directory different from the one specified using the Login screen (see chapter 1). This might be useful, for example, to store the measurement results from different methods in different subdirectories.

PHERAstar Software Manual – Part II: Control Software BMG LABTECH
38/138 0470F0026A 2010-03-15
4 Defining Protocols 4.1 Protocol Selection Window
To create or edit a protocol click on or select ‘Test Protocol’ from the ‘Test Setup’ menu.
The PHERAstar can measure fluorescence intensity, fluorescence polarization, luminescence, absorbance, AlphaScreen and optional time resolved fluorescence.
The ‘Test Protocols’ window lists all previously defined protocols and gives you options for creating new test protocols or modifying existing protocols.
By default the protocols are sorted by method first and then alphabetically by name. If you prefer sorting by name, click the ‘Protocol Name’ part of the table headline. To switch back to the original sorting click ‘Method’. It is also possible to get the list sorted by the mode or the microplate used. Simply click on the ‘Mode’ or ‘Microplate’ part of the table headline. Besides displaying all available protocols you might select to see only protocols using a certain measurement method by clicking one of the radio buttons on the left side of this dialogue box.
To select the first test protocol, beginning with e.g. ‘T’, simply press the key [T]. To select more than one protocol (e.g. for export) use [Shift] together with [ ↑ ] or [ ↓ ] or press [Ctrl] and click on the desired protocol names with the left mouse button.
New
Define a new test protocol. See section 4.2.1.
Edit
Modify an existing test protocol. Select the protocol and click on ‘Edit’ or double click on the test name.
Copy
Select the protocol you want to duplicate. A new dialogue appears and asks for a name of the copy. The duplicate will appear on the test protocol list under the new name. Making a duplicate protocol means that you can modify a protocol without changing the original.
Export
Using the export function, you can export test protocols onto a diskette or a hard drive folder of your choice. Select the protocol(s) you want to export then click on ‘Export’. A dialogue box will ask for the destination drive and folder and a name for the file. The exported file will get the file name extension ‘.TSC’.
BMG LABTECH PHERAstar Software Manual – Part II: Control Software
2010-03-15 0470F0026A 39/138
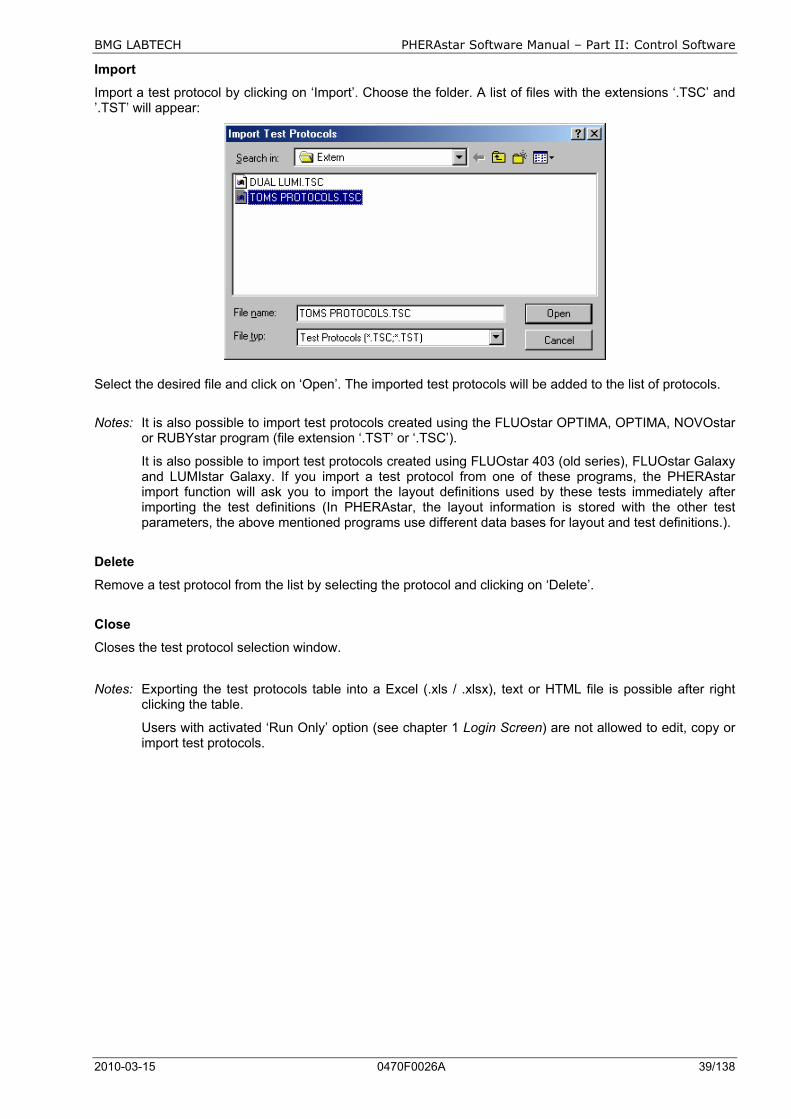
Import
Import a test protocol by clicking on ‘Import’. Choose the folder. A list of files with the extensions ‘.TSC’ and ’.TST’ will appear:
Select the desired file and click on ‘Open’. The imported test protocols will be added to the list of protocols.
Notes: It is also possible to import test protocols created using the FLUOstar OPTIMA, OPTIMA, NOVOstar
or RUBYstar program (file extension ‘.TST’ or ‘.TSC’).
It is also possible to import test protocols created using FLUOstar 403 (old series), FLUOstar Galaxy and LUMIstar Galaxy. If you import a test protocol from one of these programs, the PHERAstar import function will ask you to import the layout definitions used by these tests immediately after importing the test definitions (In PHERAstar, the layout information is stored with the other test parameters, the above mentioned programs use different data bases for layout and test definitions.).
Delete
Remove a test protocol from the list by selecting the protocol and clicking on ‘Delete’.
Close
Closes the test protocol selection window. Notes: Exporting the test protocols table into a Excel (.xls / .xlsx), text or HTML file is possible after right
clicking the table.
Users with activated ‘Run Only’ option (see chapter 1 Login Screen) are not allowed to edit, copy or import test protocols.
PHERAstar Software Manual – Part II: Control Software BMG LABTECH
40/138 0470F0026A 2010-03-15
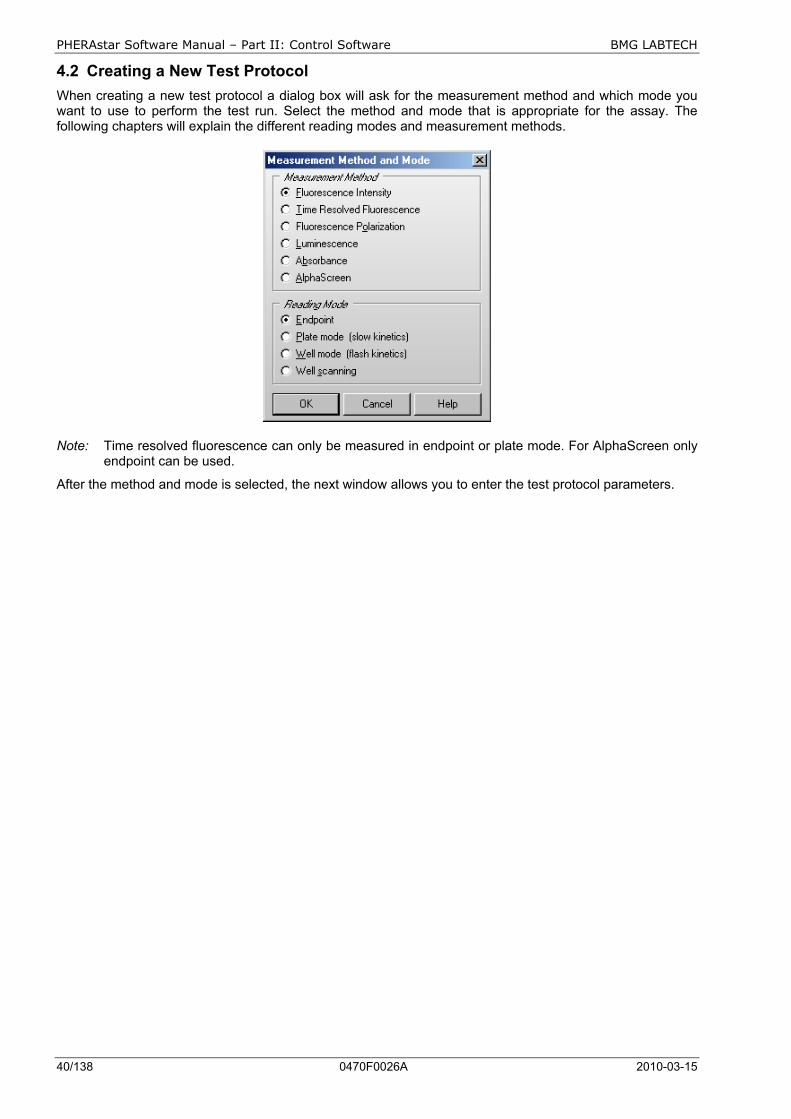
4.2 Creating a New Test Protocol When creating a new test protocol a dialog box will ask for the measurement method and which mode you want to use to perform the test run. Select the method and mode that is appropriate for the assay. The following chapters will explain the different reading modes and measurement methods.
Note: Time resolved fluorescence can only be measured in endpoint or plate mode. For AlphaScreen only endpoint can be used.
After the method and mode is selected, the next window allows you to enter the test protocol parameters.

BMG LABTECH PHERAstar Software Manual – Part II: Control Software
2010-03-15 0470F0026A 41/138
4.3 Fluorescence Intensity Protocols 4.3.1 Basic Parameters – Endpoint
If you want to measure each well only once (if you do not expect a kinetic reaction) and if you do not want to perform well scanning (see chapter 4.3.4), you should define the test protocol in endpoint mode.
Test name
Assign a test name as you would like it to appear on the list of test protocols.
Microplate
Use the pull-down menu to select the microplate used in the assay. All microplates defined under ‘Setup | Microplates’ will be listed. To select the first microplate, beginning with e.g. ‘B’, simply press the key [B] after opening the pull-down box (using e.g. [ ↓ ]).
Focal height
The height adjustment for the focal point of the optical system ensures the best signal-to-noise ratio for every plate, every application and every volume. You can enter a value here or perform an automatic focus adjustment before the measurement (see chapter 6.3).
General Settings
Positioning delay
You can define a waiting period after a well of the microplate moved to the measurement position before the measurement begins. The delay time allows the liquid to settle and the surface to become stable so that the measurement is more accurate. For homogeneous fluorescence assays BMG LABTECH recommends a delay time of 0.1 s. For fluorescence measurements of cell based assays, a delay time of 0.5 s is adequate. Liquid movements and hence delay time are influenced by viscosity.
Note: If you enter 0 here, the firmware will use 20 ms as smallest possible delay time. See also flying mode.
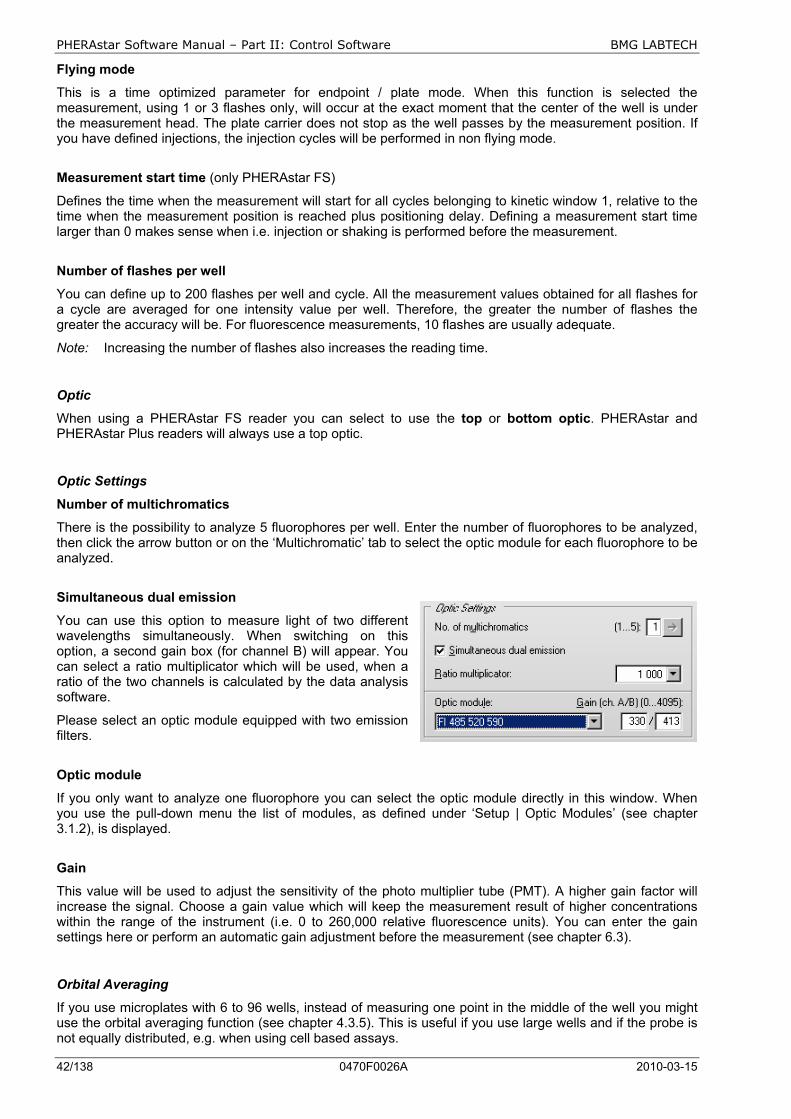
PHERAstar Software Manual – Part II: Control Software BMG LABTECH
42/138 0470F0026A 2010-03-15
Flying mode
This is a time optimized parameter for endpoint / plate mode. When this function is selected the measurement, using 1 or 3 flashes only, will occur at the exact moment that the center of the well is under the measurement head. The plate carrier does not stop as the well passes by the measurement position. If you have defined injections, the injection cycles will be performed in non flying mode.
Measurement start time (only PHERAstar FS)
Defines the time when the measurement will start for all cycles belonging to kinetic window 1, relative to the time when the measurement position is reached plus positioning delay. Defining a measurement start time larger than 0 makes sense when i.e. injection or shaking is performed before the measurement.
Number of flashes per well
You can define up to 200 flashes per well and cycle. All the measurement values obtained for all flashes for a cycle are averaged for one intensity value per well. Therefore, the greater the number of flashes the greater the accuracy will be. For fluorescence measurements, 10 flashes are usually adequate.
Note: Increasing the number of flashes also increases the reading time.
Optic
When using a PHERAstar FS reader you can select to use the top or bottom optic. PHERAstar and PHERAstar Plus readers will always use a top optic.
Optic Settings
Number of multichromatics
There is the possibility to analyze 5 fluorophores per well. Enter the number of fluorophores to be analyzed, then click the arrow button or on the ‘Multichromatic’ tab to select the optic module for each fluorophore to be analyzed.
Simultaneous dual emission
You can use this option to measure light of two different wavelengths simultaneously. When switching on this option, a second gain box (for channel B) will appear. You can select a ratio multiplicator which will be used, when a ratio of the two channels is calculated by the data analysis software.
Please select an optic module equipped with two emission filters.
Optic module
If you only want to analyze one fluorophore you can select the optic module directly in this window. When you use the pull-down menu the list of modules, as defined under ‘Setup | Optic Modules’ (see chapter 3.1.2), is displayed.
Gain
This value will be used to adjust the sensitivity of the photo multiplier tube (PMT). A higher gain factor will increase the signal. Choose a gain value which will keep the measurement result of higher concentrations within the range of the instrument (i.e. 0 to 260,000 relative fluorescence units). You can enter the gain settings here or perform an automatic gain adjustment before the measurement (see chapter 6.3).
Orbital Averaging
If you use microplates with 6 to 96 wells, instead of measuring one point in the middle of the well you might use the orbital averaging function (see chapter 4.3.5). This is useful if you use large wells and if the probe is not equally distributed, e.g. when using cell based assays.
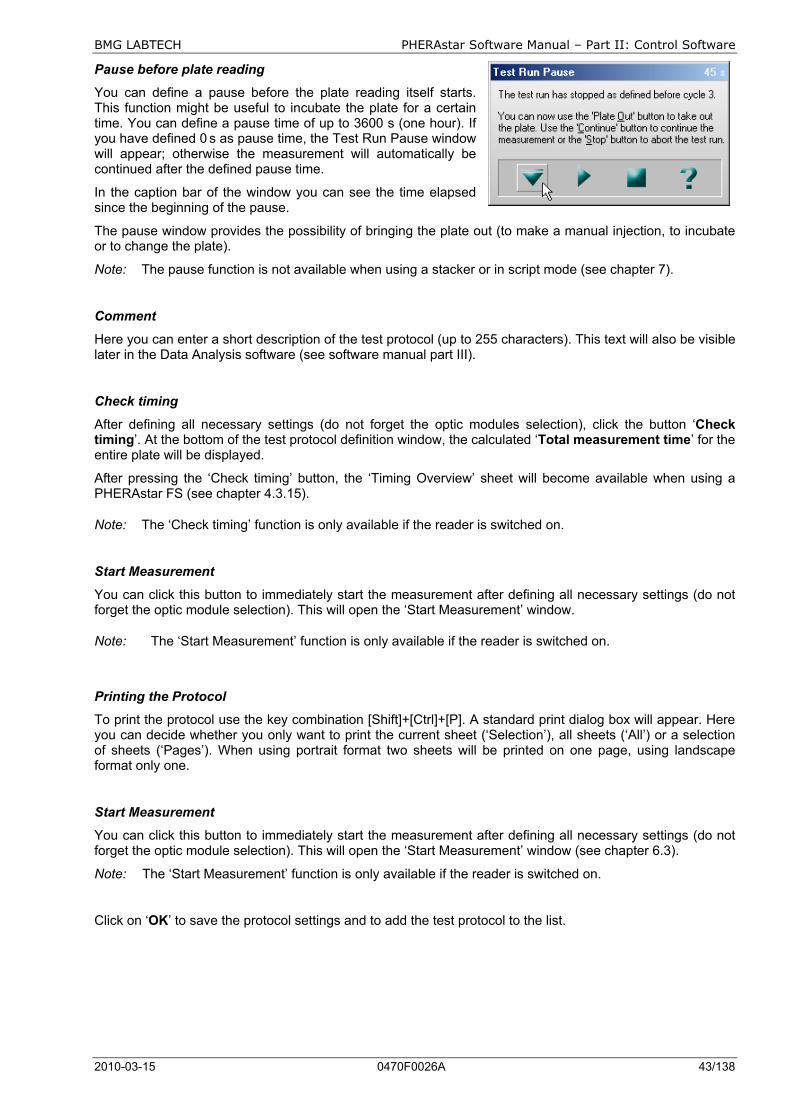
BMG LABTECH PHERAstar Software Manual – Part II: Control Software
2010-03-15 0470F0026A 43/138
Pause before plate reading
You can define a pause before the plate reading itself starts. This function might be useful to incubate the plate for a certain time. You can define a pause time of up to 3600 s (one hour). If you have defined 0 s as pause time, the Test Run Pause window will appear; otherwise the measurement will automatically be continued after the defined pause time.
In the caption bar of the window you can see the time elapsed since the beginning of the pause.
The pause window provides the possibility of bringing the plate out (to make a manual injection, to incubate or to change the plate).
Note: The pause function is not available when using a stacker or in script mode (see chapter 7).
Comment
Here you can enter a short description of the test protocol (up to 255 characters). This text will also be visible later in the Data Analysis software (see software manual part III).
Check timing
After defining all necessary settings (do not forget the optic modules selection), click the button ‘Check timing’. At the bottom of the test protocol definition window, the calculated ‘Total measurement time’ for the entire plate will be displayed.
After pressing the ‘Check timing’ button, the ‘Timing Overview’ sheet will become available when using a PHERAstar FS (see chapter 4.3.15).
Note: The ‘Check timing’ function is only available if the reader is switched on.
Start Measurement
You can click this button to immediately start the measurement after defining all necessary settings (do not forget the optic module selection). This will open the ‘Start Measurement’ window.
Note: The ‘Start Measurement’ function is only available if the reader is switched on.
Printing the Protocol
To print the protocol use the key combination [Shift]+[Ctrl]+[P]. A standard print dialog box will appear. Here you can decide whether you only want to print the current sheet (‘Selection’), all sheets (‘All’) or a selection of sheets (‘Pages’). When using portrait format two sheets will be printed on one page, using landscape format only one.
Start Measurement
You can click this button to immediately start the measurement after defining all necessary settings (do not forget the optic module selection). This will open the ‘Start Measurement’ window (see chapter 6.3).
Note: The ‘Start Measurement’ function is only available if the reader is switched on.
Click on ‘OK’ to save the protocol settings and to add the test protocol to the list.
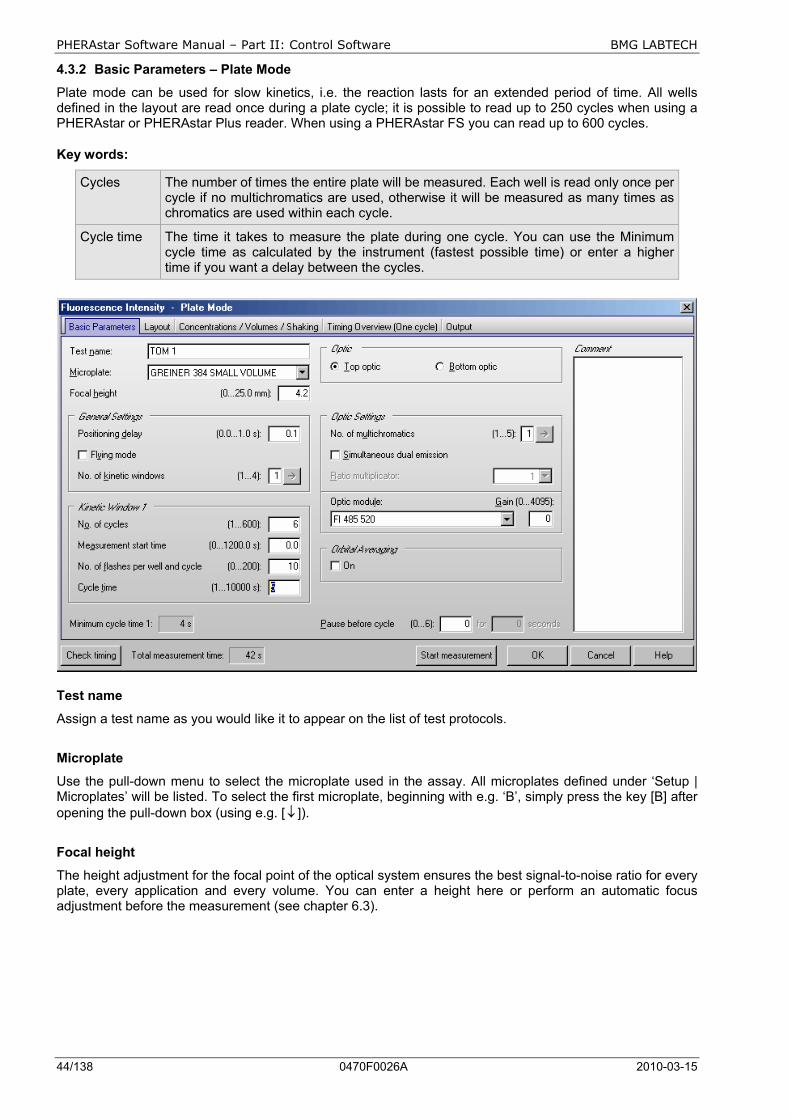
PHERAstar Software Manual – Part II: Control Software BMG LABTECH
44/138 0470F0026A 2010-03-15
4.3.2 Basic Parameters – Plate Mode
Plate mode can be used for slow kinetics, i.e. the reaction lasts for an extended period of time. All wells defined in the layout are read once during a plate cycle; it is possible to read up to 250 cycles when using a PHERAstar or PHERAstar Plus reader. When using a PHERAstar FS you can read up to 600 cycles.
Key words:
Cycles The number of times the entire plate will be measured. Each well is read only once per cycle if no multichromatics are used, otherwise it will be measured as many times as chromatics are used within each cycle.
Cycle time The time it takes to measure the plate during one cycle. You can use the Minimum cycle time as calculated by the instrument (fastest possible time) or enter a higher time if you want a delay between the cycles.
Test name
Assign a test name as you would like it to appear on the list of test protocols.
Microplate
Use the pull-down menu to select the microplate used in the assay. All microplates defined under ‘Setup | Microplates’ will be listed. To select the first microplate, beginning with e.g. ‘B’, simply press the key [B] after opening the pull-down box (using e.g. [ ↓ ]).
Focal height
The height adjustment for the focal point of the optical system ensures the best signal-to-noise ratio for every plate, every application and every volume. You can enter a height here or perform an automatic focus adjustment before the measurement (see chapter 6.3).
BMG LABTECH PHERAstar Software Manual – Part II: Control Software
2010-03-15 0470F0026A 45/138
General Settings
Positioning delay
You can define a waiting period after a well of the microplate moved to the measurement position before the measurement begins. The delay time allows the liquid to settle and the surface to become stable so that the measurement is more accurate. For homogeneous fluorescence assays BMG LABTECH recommends a delay time of 0.1 s. For fluorescence measurements of cell based assays, a delay time of 0.5 s is adequate. Liquid movements and hence delay time are influenced by viscosity.
Note: If you enter 0 here, the firmware will use 20 ms as smallest possible delay time. See also flying mode.
Flying mode
This is a time optimized parameter for endpoint / plate mode. When this function is selected the measurement, using 1 or 3 flashes only, will occur at the exact moment that the center of the well is under the measurement head. The plate carrier does not stop as the well passes by the measurement position.
Number of kinetic windows (only PHERAstar FS)
You can split the measurement into up to 4 kinetic windows. You can define the number of cycles, the measurement start time, the number of flashes and the cycle time independently for each kinetic window. Therefore, it is possible to have denser measurement points on more interesting parts of the kinetic curve. If you choose to use more than one kinetic window here, a new sheet ‘Kinetic Windows’ will become available, where you can define the parameters for all kinetic windows (see chapter 4.3.6). To switch to this sheet, click the arrow button or on the ‘Kinetic Windows’ tab. If you use only one kinetic window, you can define all necessary parameters on the ‘Basic Parameters’ sheet.
Kinetic Window 1
Number of cycles
This is the amount of times the entire plate will be measured for kinetic window 1. Each well defined in the layout will be measured once per cycle if no multichromatics are used, otherwise it will be measured as many times as chromatics are used within each cycle. You can define up to 250 cycles (PHERAstar FS: up to 600) (this is the total number for all kinetic windows).
Measurement start time (only PHERAstar FS)
Defines the time when the measurement will start for all cycles belonging to kinetic window 1, relative to the time when the measurement position is reached plus positioning delay. Defining a measurement start time larger than 0 makes sense when i.e. injection or shaking is performed before the measurement.
Number of flashes per well and cycle
You can define up to 200 flashes per well and cycle. All the measurement values obtained for all flashes for a cycle are averaged for one intensity value per well. Therefore, the greater the number of flashes the greater the accuracy will be. For fluorescence measurements, 10 flashes are usually adequate.
Note: Increasing the number of flashes also increases the minimum cycle time and, therefore, the reading time.
Cycle time
You can define the duration of each cycle from 1 to 10 000 seconds. When the instrument is switched on, you can click the ‘Check timing’ button and the cycle time is automatically validated by the instrument (You will see the minimum cycle time below this group box. If the cycle time you have defined is smaller than this minimum cycle time, it will be automatically corrected to the minimum time.). If you want to increase the cycle time (if you want a delay between cycles), you can manually enter a time greater than the minimum cycle time calculated by the ‘Check timing’ function.
For example, the instrument gives a time of 25 seconds per cycle, but you can change this to 85 seconds so that there will be a delay of 60 seconds between cycles.
Note: For protocols using only one measurement = one cycle (endpoint tests), this time value does not matter, therefore, this input box will be disabled. For defining endpoint test protocols you can also use the special endpoint mode, see chapter 4.3.1.
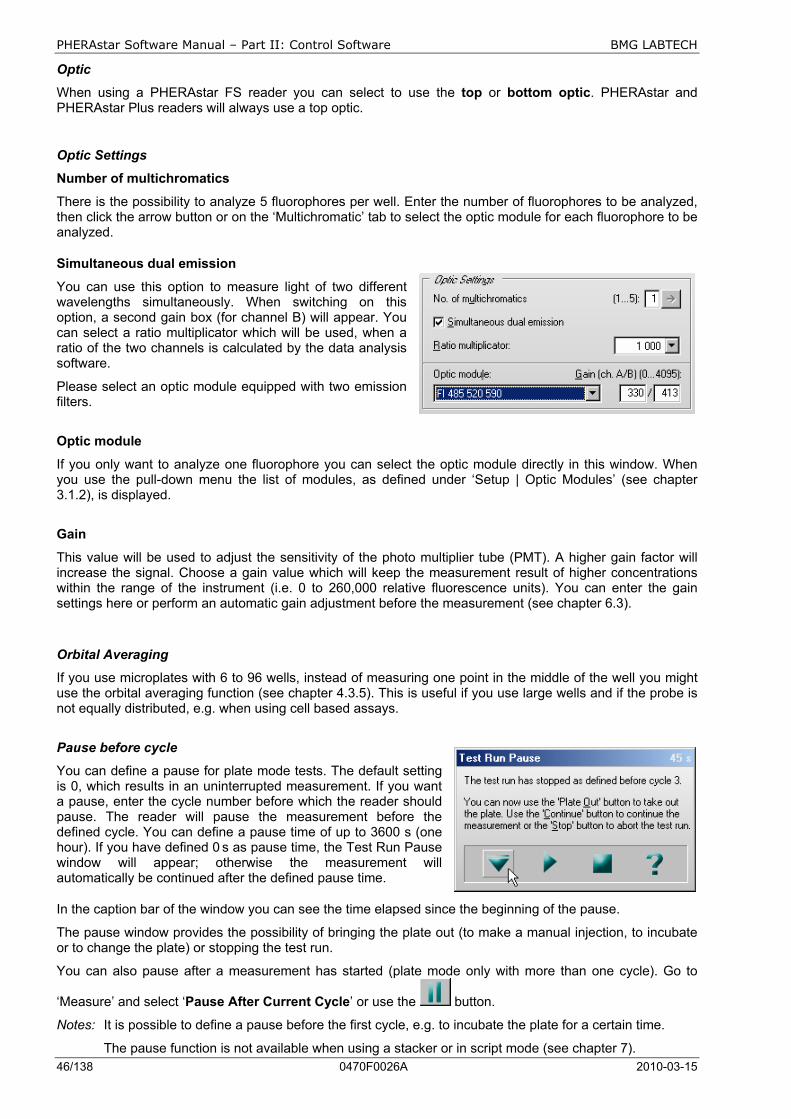
PHERAstar Software Manual – Part II: Control Software BMG LABTECH
46/138 0470F0026A 2010-03-15
Optic
When using a PHERAstar FS reader you can select to use the top or bottom optic. PHERAstar and PHERAstar Plus readers will always use a top optic.
Optic Settings
Number of multichromatics
There is the possibility to analyze 5 fluorophores per well. Enter the number of fluorophores to be analyzed, then click the arrow button or on the ‘Multichromatic’ tab to select the optic module for each fluorophore to be analyzed.
Simultaneous dual emission
You can use this option to measure light of two different wavelengths simultaneously. When switching on this option, a second gain box (for channel B) will appear. You can select a ratio multiplicator which will be used, when a ratio of the two channels is calculated by the data analysis software.
Please select an optic module equipped with two emission filters.
Optic module
If you only want to analyze one fluorophore you can select the optic module directly in this window. When you use the pull-down menu the list of modules, as defined under ‘Setup | Optic Modules’ (see chapter 3.1.2), is displayed.
Gain
This value will be used to adjust the sensitivity of the photo multiplier tube (PMT). A higher gain factor will increase the signal. Choose a gain value which will keep the measurement result of higher concentrations within the range of the instrument (i.e. 0 to 260,000 relative fluorescence units). You can enter the gain settings here or perform an automatic gain adjustment before the measurement (see chapter 6.3).
Orbital Averaging
If you use microplates with 6 to 96 wells, instead of measuring one point in the middle of the well you might use the orbital averaging function (see chapter 4.3.5). This is useful if you use large wells and if the probe is not equally distributed, e.g. when using cell based assays.
Pause before cycle
You can define a pause for plate mode tests. The default setting is 0, which results in an uninterrupted measurement. If you want a pause, enter the cycle number before which the reader should pause. The reader will pause the measurement before the defined cycle. You can define a pause time of up to 3600 s (one hour). If you have defined 0 s as pause time, the Test Run Pause window will appear; otherwise the measurement will automatically be continued after the defined pause time.
In the caption bar of the window you can see the time elapsed since the beginning of the pause.
The pause window provides the possibility of bringing the plate out (to make a manual injection, to incubate or to change the plate) or stopping the test run.
You can also pause after a measurement has started (plate mode only with more than one cycle). Go to
‘Measure’ and select ‘Pause After Current Cycle’ or use the button.
Notes: It is possible to define a pause before the first cycle, e.g. to incubate the plate for a certain time.
The pause function is not available when using a stacker or in script mode (see chapter 7).
BMG LABTECH PHERAstar Software Manual – Part II: Control Software
2010-03-15 0470F0026A 47/138
Comment
Here you can enter a short description of the test protocol (up to 255 characters). This text will also be visible later in the Data Analysis software (see software manual part III).
Check timing
Minimum cycle time 1
The minimum cycle time can only be calculated by the reader. After defining all necessary settings (do not forget the optic modules selection), click the button ‘Check timing’. The shortest possible cycle time will be displayed. If you have defined a cycle time, which is shorter than this minimum time, it will automatically be corrected. At the bottom of the test protocol definition window, the calculated ‘Total measurement time’ for the entire plate will be displayed.
After pressing the ‘Check timing’ button, the ‘Timing Overview’ sheet will become available when using a PHERAstar FS (see chapter 4.3.15).
Note: The ‘Check timing’ function is only available if the reader is switched on.
Printing the Protocol
To print the protocol use the key combination [Shift]+[Ctrl]+[P]. A standard print dialog box will appear. Here you can decide whether you only want to print the current sheet (‘Selection’), all sheets (‘All’) or a selection of sheets (‘Pages’). When using portrait format two sheets will be printed on one page, using landscape format only one.
Start Measurement
You can click this button to immediately start the measurement after defining all necessary settings (do not forget the optic module selection). This will open the ‘Start Measurement’ window (see chapter 6.3).
Note: The ‘Start Measurement’ function is only available if the reader is switched on.
Click on ‘OK’ to save the protocol settings and to add the test protocol to the list.
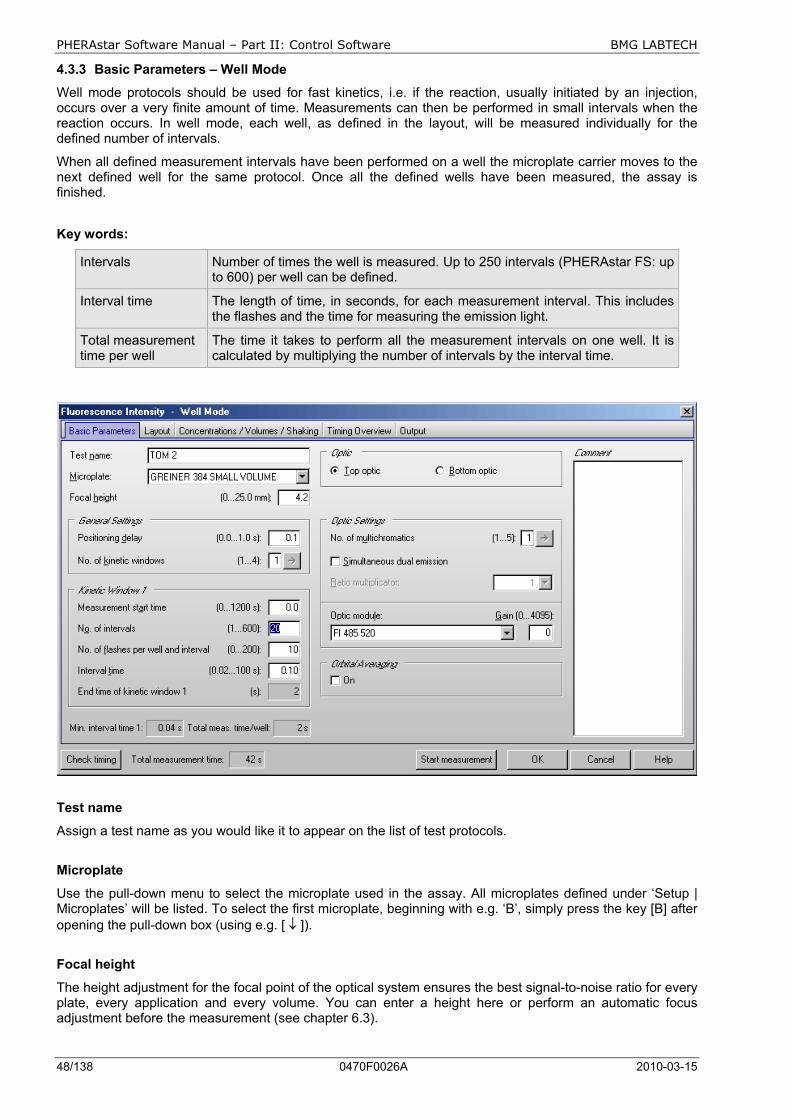
PHERAstar Software Manual – Part II: Control Software BMG LABTECH
48/138 0470F0026A 2010-03-15
4.3.3 Basic Parameters – Well Mode
Well mode protocols should be used for fast kinetics, i.e. if the reaction, usually initiated by an injection, occurs over a very finite amount of time. Measurements can then be performed in small intervals when the reaction occurs. In well mode, each well, as defined in the layout, will be measured individually for the defined number of intervals.
When all defined measurement intervals have been performed on a well the microplate carrier moves to the next defined well for the same protocol. Once all the defined wells have been measured, the assay is finished.
Key words:
Intervals Number of times the well is measured. Up to 250 intervals (PHERAstar FS: up to 600) per well can be defined.
Interval time The length of time, in seconds, for each measurement interval. This includes the flashes and the time for measuring the emission light.
Total measurement time per well
The time it takes to perform all the measurement intervals on one well. It is calculated by multiplying the number of intervals by the interval time.
Test name
Assign a test name as you would like it to appear on the list of test protocols.
Microplate
Use the pull-down menu to select the microplate used in the assay. All microplates defined under ‘Setup | Microplates’ will be listed. To select the first microplate, beginning with e.g. ‘B’, simply press the key [B] after opening the pull-down box (using e.g. [ ↓ ]).
Focal height
The height adjustment for the focal point of the optical system ensures the best signal-to-noise ratio for every plate, every application and every volume. You can enter a height here or perform an automatic focus adjustment before the measurement (see chapter 6.3).
BMG LABTECH PHERAstar Software Manual – Part II: Control Software
2010-03-15 0470F0026A 49/138
General Settings
Positioning delay
You can define a waiting period after a well of the microplate moved to the measurement position before the measurement begins. The delay time allows the liquid to settle and the surface to become stable so that the measurement is more accurate. For homogeneous fluorescence assays, BMG LABTECH recommends a delay time of 0.1 s. For fluorescence measurements of cell based assays, a delay time of 0.5 s is adequate. Liquid movements, and hence delay time, are influenced by viscosity.
Number of kinetic windows (only for PHERAstar FS)
You can split the measurement into up to 4 kinetic windows. You can define the number of intervals, the interval time and the start time independently for each kinetic window. Therefore, it is possible to have denser measurement points on more interesting parts of the kinetic curve. If you choose to use more than one kinetic window, a new sheet ‘Kinetic Windows’ (see chapter 4.3.7) will become available, where you can define the parameters for all kinetic windows. To switch to this sheet, click the arrow button or on the ‘Kinetic Windows’ tab. If you use only one kinetic window, you can define all necessary parameters on the 'Basic Parameters' sheet.
Kinetic Window 1
Measurement start time (only for PHERAstar FS)
= Start time for kinetic window 1. Defines the time when the measurement will start, relative to the time when the measurement position is reached plus position delay.
Example - measurement start time 5 seconds: After the reader plate carrier reaches the measurement position, the defined positioning delay time starts. After this, there will be an additional delay of 5 seconds before the measurement itself starts.
Using this measurement start time, it is possible to start the measurement after an injection.
Number of intervals
This is the amount of times a measurement will be successively taken on each well (equals the number of readings on each well). You can define up to 250 intervals (PHERAstar FS: up to 600). This is typically used for kinetic assays when the dynamics of a reaction change very quickly over time. Each interval is plotted as a kinetic point displaying the change over time.
Number of flashes per well and interval
You can define up to 200 flashes per measurement interval. All the measurement values from the flashes defined for one interval are averaged to produce one intensity value per well. Therefore, the greater the number of flashes the greater the accuracy will be. For fluorescence measurements, 10 flashes are usually adequate.
Note: Increasing the number of flashes also increases the reading time.
Interval time
You can define the duration of each interval from 0.02 to 100 seconds. When the instrument is active, you can click the ‘Check timing’ button (see below) and the interval time is automatically validated by the instrument. If you want to increase the interval time (if you want a delay between the intervals), you can manually enter a time. If you have defined an interval time which is shorter than the respective minimum interval time, it will automatically be corrected to the shortest possible time.
The minimum interval time depends on the number of flashes (1 flash equals 0.0033 seconds, 100 flashes equals 0.333 seconds, etc.) and on the usage of multichromatics. This time will be rounded up to the next 0.02 second.
For example, the instrument gives a minimum interval time of 0.4 seconds, but you can change this to 5 seconds so that there will be a delay of 4.6 seconds between intervals.
Note: For end-point tests (tests using only one measurement = one interval), the time value defined here does not matter, therefore, this input box will be disabled.
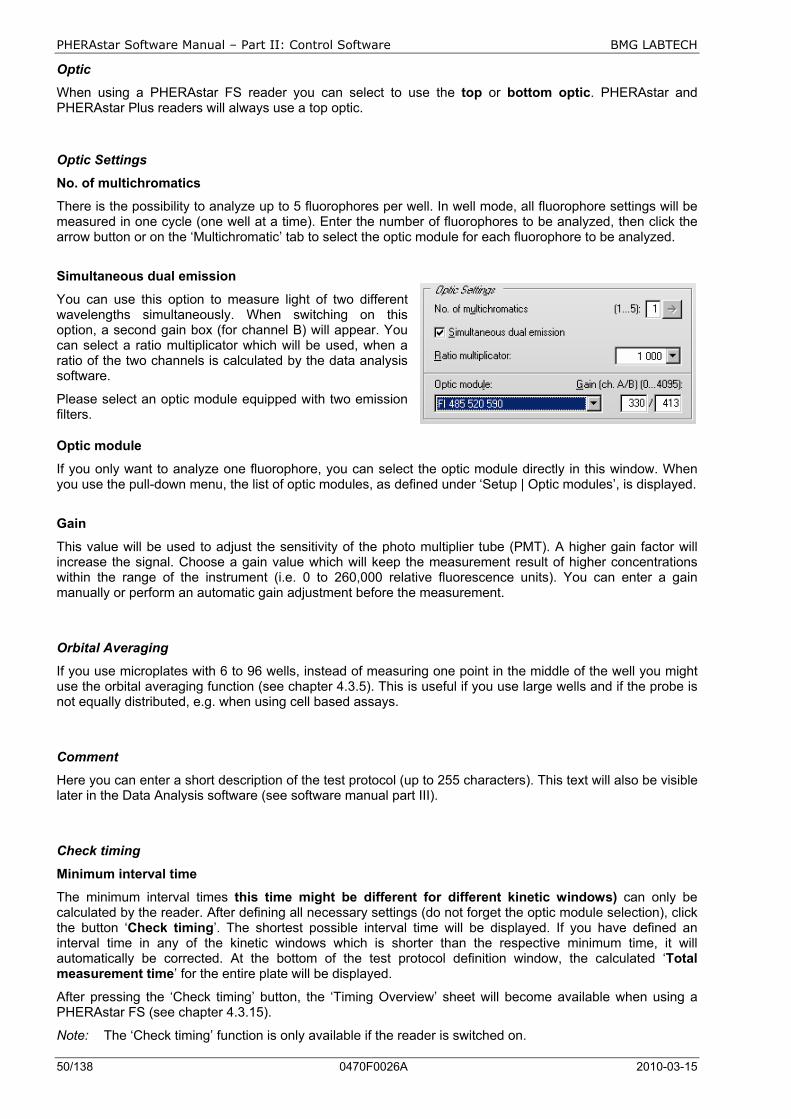
PHERAstar Software Manual – Part II: Control Software BMG LABTECH
50/138 0470F0026A 2010-03-15
Optic
When using a PHERAstar FS reader you can select to use the top or bottom optic. PHERAstar and PHERAstar Plus readers will always use a top optic.
Optic Settings
No. of multichromatics
There is the possibility to analyze up to 5 fluorophores per well. In well mode, all fluorophore settings will be measured in one cycle (one well at a time). Enter the number of fluorophores to be analyzed, then click the arrow button or on the ‘Multichromatic’ tab to select the optic module for each fluorophore to be analyzed.
Simultaneous dual emission
You can use this option to measure light of two different wavelengths simultaneously. When switching on this option, a second gain box (for channel B) will appear. You can select a ratio multiplicator which will be used, when a ratio of the two channels is calculated by the data analysis software.
Please select an optic module equipped with two emission filters.
Optic module
If you only want to analyze one fluorophore, you can select the optic module directly in this window. When you use the pull-down menu, the list of optic modules, as defined under ‘Setup | Optic modules’, is displayed.
Gain
This value will be used to adjust the sensitivity of the photo multiplier tube (PMT). A higher gain factor will increase the signal. Choose a gain value which will keep the measurement result of higher concentrations within the range of the instrument (i.e. 0 to 260,000 relative fluorescence units). You can enter a gain manually or perform an automatic gain adjustment before the measurement.
Orbital Averaging
If you use microplates with 6 to 96 wells, instead of measuring one point in the middle of the well you might use the orbital averaging function (see chapter 4.3.5). This is useful if you use large wells and if the probe is not equally distributed, e.g. when using cell based assays.
Comment
Here you can enter a short description of the test protocol (up to 255 characters). This text will also be visible later in the Data Analysis software (see software manual part III).
Check timing
Minimum interval time
The minimum interval times this time might be different for different kinetic windows) can only be calculated by the reader. After defining all necessary settings (do not forget the optic module selection), click the button ‘Check timing’. The shortest possible interval time will be displayed. If you have defined an interval time in any of the kinetic windows which is shorter than the respective minimum time, it will automatically be corrected. At the bottom of the test protocol definition window, the calculated ‘Total measurement time’ for the entire plate will be displayed.
After pressing the ‘Check timing’ button, the ‘Timing Overview’ sheet will become available when using a PHERAstar FS (see chapter 4.3.15).
Note: The ‘Check timing’ function is only available if the reader is switched on.
BMG LABTECH PHERAstar Software Manual – Part II: Control Software
2010-03-15 0470F0026A 51/138
Total measurement time per well
This time will be calculated using the settings in the protocol, i.e. the interval time and the number of intervals and the measurement start time for all kinetic windows. If the defined interval time for the last interval (in the last kinetic window) is higher than the minimum interval time, the calculated total measurement time per well will show a value slightly too high, since the reader, when the last interval is finished, will not wait for the defined interval time before it goes on to the next well. If you have defined an injection which will last longer than the last measurement (which usually makes no sense), this time will be too short. (The total measurement time calculated by the reader will always be correct.)
Printing the Protocol
To print the protocol use the key combination [Shift]+[Ctrl]+[P]. A standard print dialog box will appear. Here you can decide whether you only want to print the current sheet (‘Selection’), all sheets (‘All’) or a selection of sheets (‘Pages’). When using portrait format two sheets will be printed on one page, using landscape format only one.
Start Measurement
You can click this button to immediately start the measurement after defining all necessary settings (do not forget the optic module selection). This will open the ‘Start Measurement’ window (see chapter 6.3).
Note: The ‘Start Measurement’ function is only available if the reader is switched on.
Click on ‘OK’ to save the protocol settings and to add the test protocol to the list.
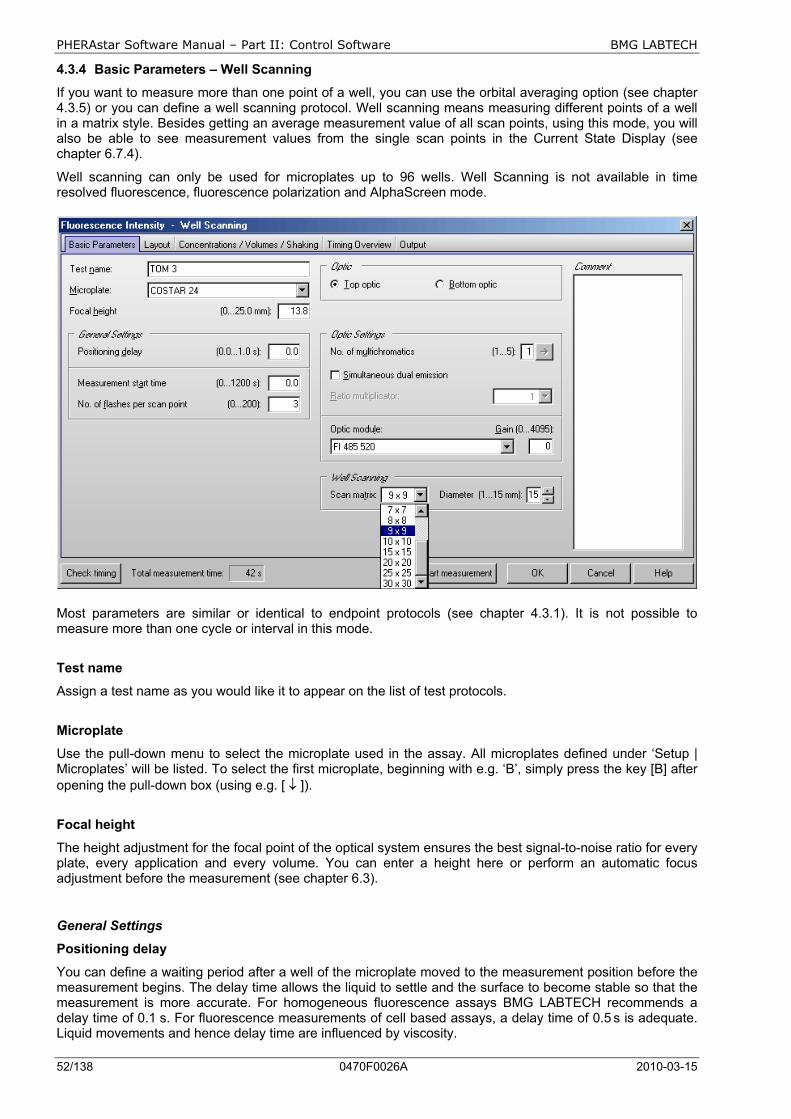
PHERAstar Software Manual – Part II: Control Software BMG LABTECH
52/138 0470F0026A 2010-03-15
4.3.4 Basic Parameters – Well Scanning
If you want to measure more than one point of a well, you can use the orbital averaging option (see chapter 4.3.5) or you can define a well scanning protocol. Well scanning means measuring different points of a well in a matrix style. Besides getting an average measurement value of all scan points, using this mode, you will also be able to see measurement values from the single scan points in the Current State Display (see chapter 6.7.4).
Well scanning can only be used for microplates up to 96 wells. Well Scanning is not available in time resolved fluorescence, fluorescence polarization and AlphaScreen mode.
Most parameters are similar or identical to endpoint protocols (see chapter 4.3.1). It is not possible to measure more than one cycle or interval in this mode.
Test name
Assign a test name as you would like it to appear on the list of test protocols.
Microplate
Use the pull-down menu to select the microplate used in the assay. All microplates defined under ‘Setup | Microplates’ will be listed. To select the first microplate, beginning with e.g. ‘B’, simply press the key [B] after opening the pull-down box (using e.g. [ ↓ ]).
Focal height
The height adjustment for the focal point of the optical system ensures the best signal-to-noise ratio for every plate, every application and every volume. You can enter a height here or perform an automatic focus adjustment before the measurement (see chapter 6.3).
General Settings
Positioning delay
You can define a waiting period after a well of the microplate moved to the measurement position before the measurement begins. The delay time allows the liquid to settle and the surface to become stable so that the measurement is more accurate. For homogeneous fluorescence assays BMG LABTECH recommends a delay time of 0.1 s. For fluorescence measurements of cell based assays, a delay time of 0.5 s is adequate. Liquid movements and hence delay time are influenced by viscosity.
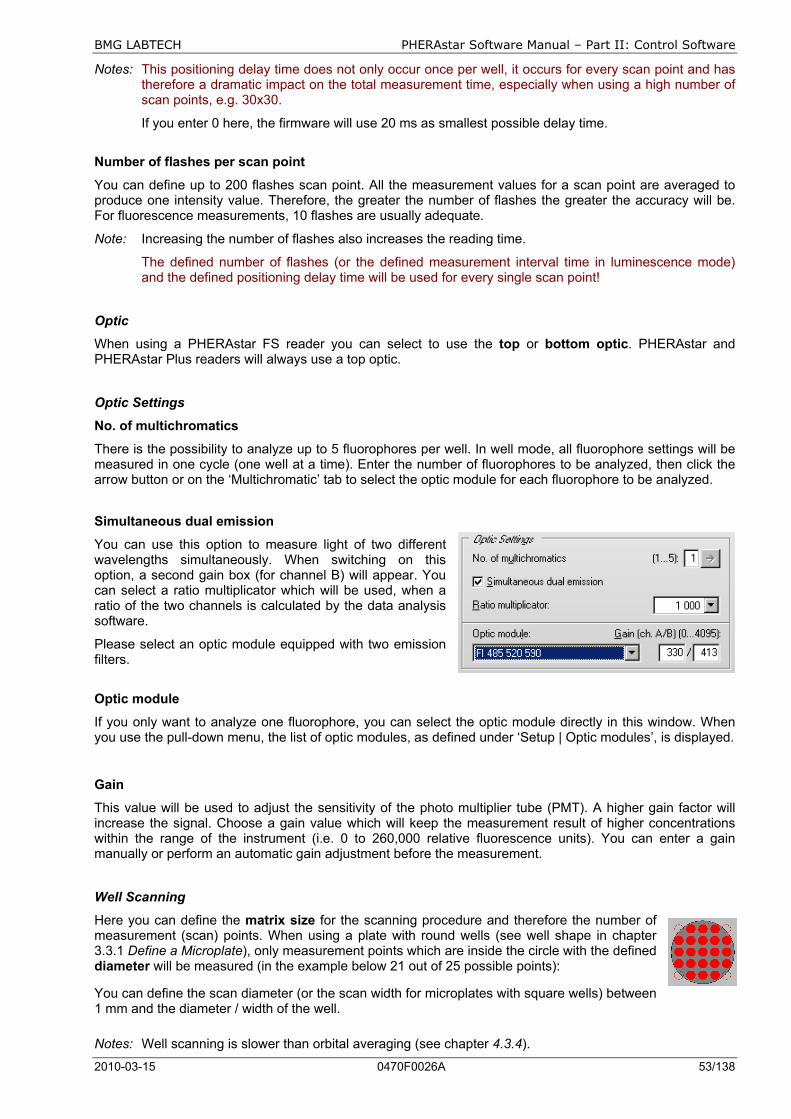
BMG LABTECH PHERAstar Software Manual – Part II: Control Software
2010-03-15 0470F0026A 53/138
Notes: This positioning delay time does not only occur once per well, it occurs for every scan point and has therefore a dramatic impact on the total measurement time, especially when using a high number of scan points, e.g. 30x30.
If you enter 0 here, the firmware will use 20 ms as smallest possible delay time.
Number of flashes per scan point
You can define up to 200 flashes scan point. All the measurement values for a scan point are averaged to produce one intensity value. Therefore, the greater the number of flashes the greater the accuracy will be. For fluorescence measurements, 10 flashes are usually adequate.
Note: Increasing the number of flashes also increases the reading time.
The defined number of flashes (or the defined measurement interval time in luminescence mode) and the defined positioning delay time will be used for every single scan point!
Optic
When using a PHERAstar FS reader you can select to use the top or bottom optic. PHERAstar and PHERAstar Plus readers will always use a top optic.
Optic Settings
No. of multichromatics
There is the possibility to analyze up to 5 fluorophores per well. In well mode, all fluorophore settings will be measured in one cycle (one well at a time). Enter the number of fluorophores to be analyzed, then click the arrow button or on the ‘Multichromatic’ tab to select the optic module for each fluorophore to be analyzed.
Simultaneous dual emission
You can use this option to measure light of two different wavelengths simultaneously. When switching on this option, a second gain box (for channel B) will appear. You can select a ratio multiplicator which will be used, when a ratio of the two channels is calculated by the data analysis software.
Please select an optic module equipped with two emission filters.
Optic module
If you only want to analyze one fluorophore, you can select the optic module directly in this window. When you use the pull-down menu, the list of optic modules, as defined under ‘Setup | Optic modules’, is displayed.
Gain
This value will be used to adjust the sensitivity of the photo multiplier tube (PMT). A higher gain factor will increase the signal. Choose a gain value which will keep the measurement result of higher concentrations within the range of the instrument (i.e. 0 to 260,000 relative fluorescence units). You can enter a gain manually or perform an automatic gain adjustment before the measurement.
Well Scanning
Here you can define the matrix size for the scanning procedure and therefore the number of measurement (scan) points. When using a plate with round wells (see well shape in chapter 3.3.1 Define a Microplate), only measurement points which are inside the circle with the defined diameter will be measured (in the example below 21 out of 25 possible points):
You can define the scan diameter (or the scan width for microplates with square wells) between 1 mm and the diameter / width of the well.
Notes: Well scanning is slower than orbital averaging (see chapter 4.3.4).
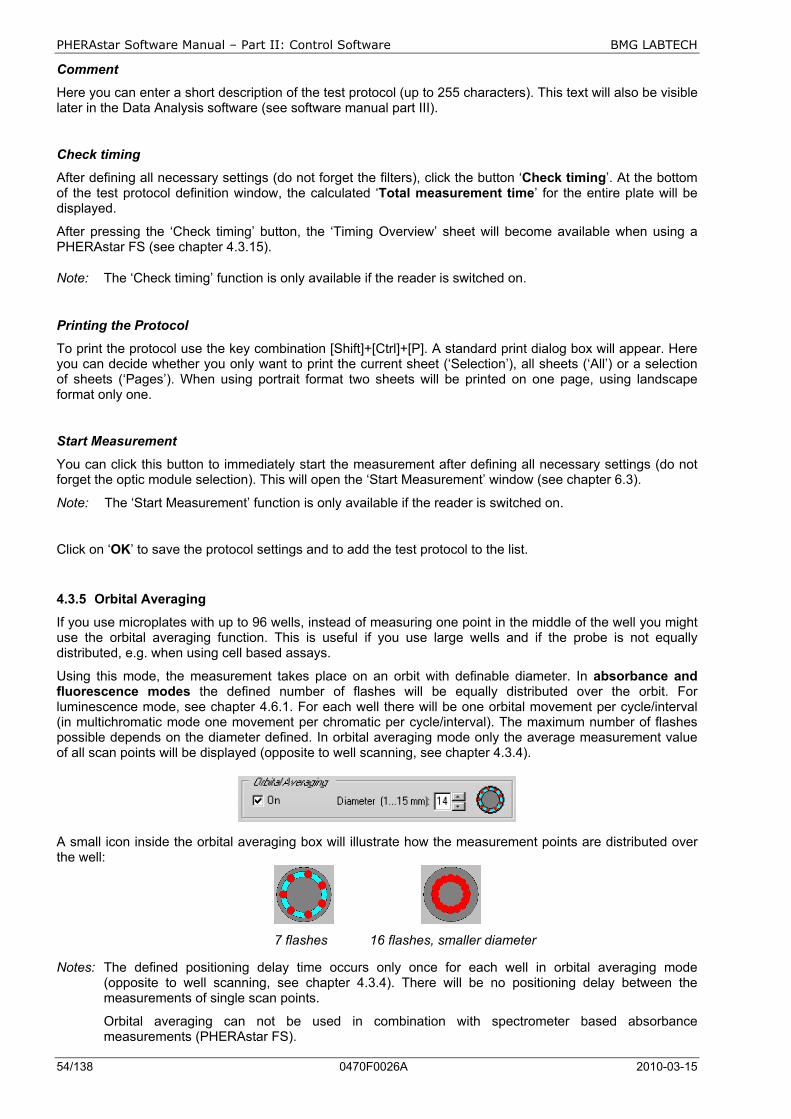
PHERAstar Software Manual – Part II: Control Software BMG LABTECH
54/138 0470F0026A 2010-03-15
Comment
Here you can enter a short description of the test protocol (up to 255 characters). This text will also be visible later in the Data Analysis software (see software manual part III).
Check timing
After defining all necessary settings (do not forget the filters), click the button ‘Check timing’. At the bottom of the test protocol definition window, the calculated ‘Total measurement time’ for the entire plate will be displayed.
After pressing the ‘Check timing’ button, the ‘Timing Overview’ sheet will become available when using a PHERAstar FS (see chapter 4.3.15).
Note: The ‘Check timing’ function is only available if the reader is switched on.
Printing the Protocol
To print the protocol use the key combination [Shift]+[Ctrl]+[P]. A standard print dialog box will appear. Here you can decide whether you only want to print the current sheet (‘Selection’), all sheets (‘All’) or a selection of sheets (‘Pages’). When using portrait format two sheets will be printed on one page, using landscape format only one.
Start Measurement
You can click this button to immediately start the measurement after defining all necessary settings (do not forget the optic module selection). This will open the ‘Start Measurement’ window (see chapter 6.3).
Note: The ‘Start Measurement’ function is only available if the reader is switched on.
Click on ‘OK’ to save the protocol settings and to add the test protocol to the list.
4.3.5 Orbital Averaging
If you use microplates with up to 96 wells, instead of measuring one point in the middle of the well you might use the orbital averaging function. This is useful if you use large wells and if the probe is not equally distributed, e.g. when using cell based assays.
Using this mode, the measurement takes place on an orbit with definable diameter. In absorbance and fluorescence modes the defined number of flashes will be equally distributed over the orbit. For luminescence mode, see chapter 4.6.1. For each well there will be one orbital movement per cycle/interval (in multichromatic mode one movement per chromatic per cycle/interval). The maximum number of flashes possible depends on the diameter defined. In orbital averaging mode only the average measurement value of all scan points will be displayed (opposite to well scanning, see chapter 4.3.4).
A small icon inside the orbital averaging box will illustrate how the measurement points are distributed over the well:
7 flashes 16 flashes, smaller diameter
Notes: The defined positioning delay time occurs only once for each well in orbital averaging mode (opposite to well scanning, see chapter 4.3.4). There will be no positioning delay between the measurements of single scan points.
Orbital averaging can not be used in combination with spectrometer based absorbance measurements (PHERAstar FS).
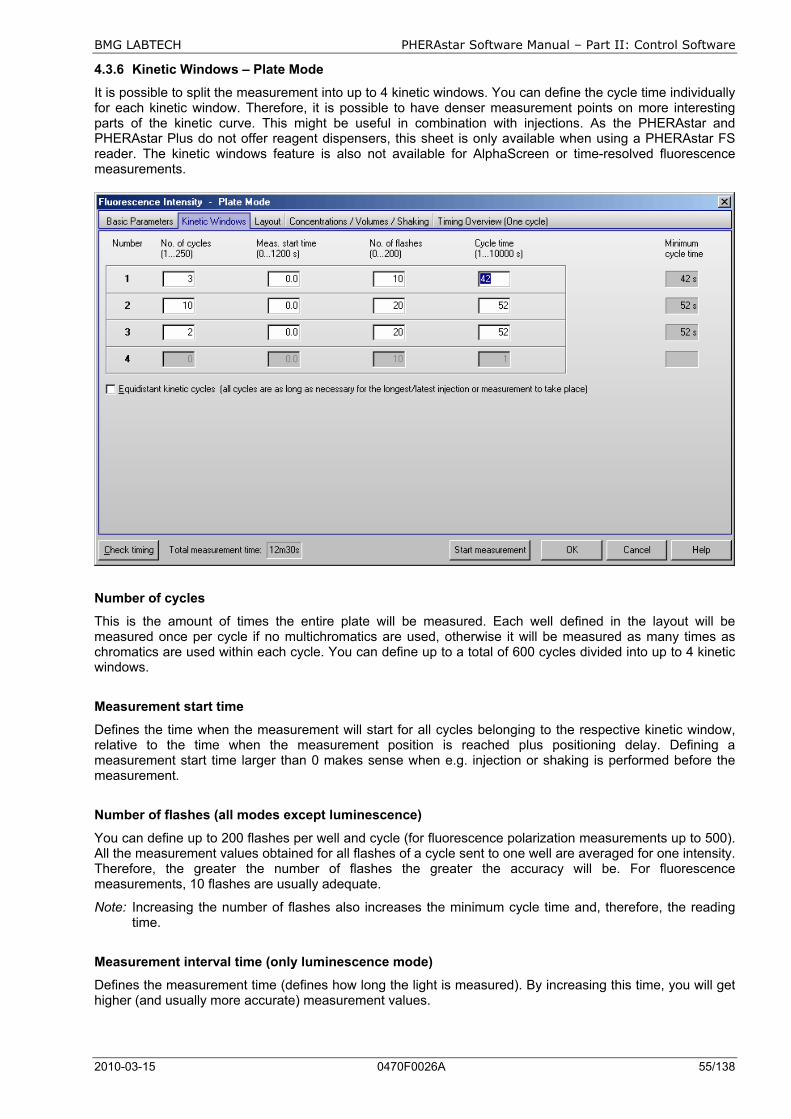
BMG LABTECH PHERAstar Software Manual – Part II: Control Software
2010-03-15 0470F0026A 55/138
4.3.6 Kinetic Windows – Plate Mode
It is possible to split the measurement into up to 4 kinetic windows. You can define the cycle time individually for each kinetic window. Therefore, it is possible to have denser measurement points on more interesting parts of the kinetic curve. This might be useful in combination with injections. As the PHERAstar and PHERAstar Plus do not offer reagent dispensers, this sheet is only available when using a PHERAstar FS reader. The kinetic windows feature is also not available for AlphaScreen or time-resolved fluorescence measurements.
Number of cycles
This is the amount of times the entire plate will be measured. Each well defined in the layout will be measured once per cycle if no multichromatics are used, otherwise it will be measured as many times as chromatics are used within each cycle. You can define up to a total of 600 cycles divided into up to 4 kinetic windows.
Measurement start time
Defines the time when the measurement will start for all cycles belonging to the respective kinetic window, relative to the time when the measurement position is reached plus positioning delay. Defining a measurement start time larger than 0 makes sense when e.g. injection or shaking is performed before the measurement.
Number of flashes (all modes except luminescence)
You can define up to 200 flashes per well and cycle (for fluorescence polarization measurements up to 500). All the measurement values obtained for all flashes of a cycle sent to one well are averaged for one intensity. Therefore, the greater the number of flashes the greater the accuracy will be. For fluorescence measurements, 10 flashes are usually adequate.
Note: Increasing the number of flashes also increases the minimum cycle time and, therefore, the reading time.
Measurement interval time (only luminescence mode)
Defines the measurement time (defines how long the light is measured). By increasing this time, you will get higher (and usually more accurate) measurement values.

PHERAstar Software Manual – Part II: Control Software BMG LABTECH
56/138 0470F0026A 2010-03-15
Cycle time
You can define the duration of each cycle from 1 to 10000 seconds (=2hr46min40s). When the instrument is switched on, you can click the ‘Check timing’ button and the cycle time is automatically validated by the instrument. If you want to increase the cycle time (if you want a delay between cycles), you can enter a time greater than the minimum cycle time calculated by the ‘Check timing’ function.
For example, if the instrument gives a minimum cycle time of 25 seconds and you change this to 85 seconds, there will be a delay of 60 seconds between cycles.
Equidistant kinetic cycles
If you use this option, the minimum cycle time for all cycles is as long as the cycle with the latest / longest injection or measurement requires.
If you do not use this option, the time for cycles with injection can be different from cycles without injection and the minimum cycle time for each kinetic window can be different. This allows very short sampling rates in kinetic areas with a fast change in signal.
Note: Even if you choose this option, it is possible to define different kinetic cycle times for different kinetic windows, but the software will ensure that the timing of all wells is equal by adding waiting times after processing each well.
Minimum cycle time
The minimum cycle times can only be calculated by the reader. If you do not use the Equidistant kinetic cycles option, the Minimum cycle time can be different in different kinetic windows (depending on the Measurement start time and the Number of flashes). After defining all necessary settings (do not forget the filters), click the button ‘Check timing’. The shortest possible cycle times will be displayed. If you have defined a cycle time in any of the kinetic windows which is shorter than the corresponding minimum time, it will automatically be corrected. At the bottom of the test protocol definition window, the calculated ‘Total measurement time’ for the entire plate will be displayed.
Note: The ‘Check timing’ function is only available if the reader is switched on.
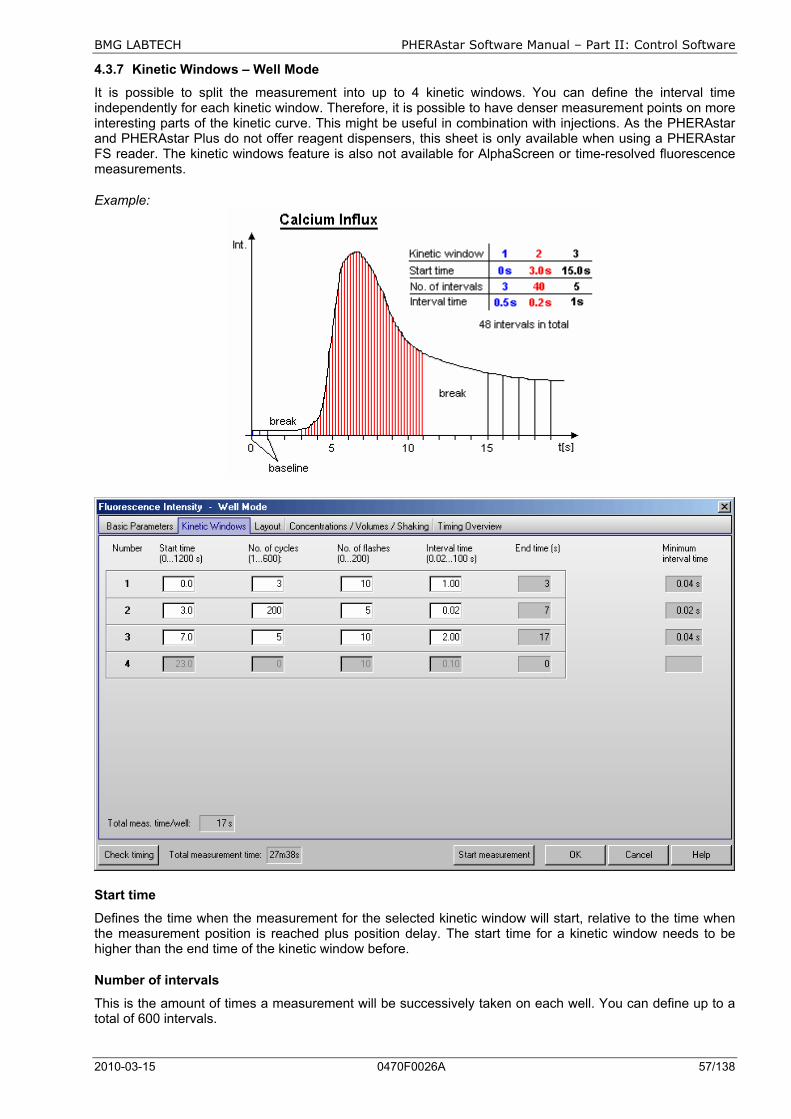
BMG LABTECH PHERAstar Software Manual – Part II: Control Software
2010-03-15 0470F0026A 57/138
4.3.7 Kinetic Windows – Well Mode
It is possible to split the measurement into up to 4 kinetic windows. You can define the interval time independently for each kinetic window. Therefore, it is possible to have denser measurement points on more interesting parts of the kinetic curve. This might be useful in combination with injections. As the PHERAstar and PHERAstar Plus do not offer reagent dispensers, this sheet is only available when using a PHERAstar FS reader. The kinetic windows feature is also not available for AlphaScreen or time-resolved fluorescence measurements.
Example:
Start time
Defines the time when the measurement for the selected kinetic window will start, relative to the time when the measurement position is reached plus position delay. The start time for a kinetic window needs to be higher than the end time of the kinetic window before.
Number of intervals
This is the amount of times a measurement will be successively taken on each well. You can define up to a total of 600 intervals.
PHERAstar Software Manual – Part II: Control Software BMG LABTECH
58/138 0470F0026A 2010-03-15
Number of flashes (all modes except luminescence)
You can define up to 200 flashes per measurement interval (for fluorescence polarization measurements up to 500). All measurement values obtained for all flashes defined for one interval are averaged to produce one intensity value per well. Therefore, the greater the number of flashes the greater the accuracy will be. For fluorescence measurements, 10 flashes are usually adequate.
Note: Increasing the number of flashes also increases the reading time.
Measurement interval time (only luminescence mode)
Defines the measurement time (defines how long the light is measured). By increasing this time, you will get higher (and usually more accurate) measurement values.
Interval time
You can define the duration of each interval from 0.02 to 100.0 seconds. When the instrument is switched on, you can click the ‘Check timing’ button and the interval times are automatically validated by the instrument. If you want to increase an interval time (if you want a delay between the intervals), you can manually enter a time.
For example, the instrument gives a time of 0.4 seconds but you can change this to 5 seconds so that there will be a delay of 4.6 seconds between intervals.
End time
This value is automatically calculated (Start time plus Number of intervals multiplied by Interval time). The start time for the next kinetic window needs to be higher than this end time.
Minimum interval time
The minimum interval times (this time value might be different for different kinetic windows) can only be calculated by the reader. After defining all necessary settings press the button ‘Check timing’. The shortest possible interval times will be displayed. If you have defined an interval time in any of the kinetic windows which is shorter than the respective minimum time, it will automatically be corrected. If necessary, the start times for all following kinetic windows will also be corrected. At the bottom of the test protocol definition window, the calculated ‘Total measurement time’ for the entire plate will be displayed.
Note: The ‘Check timing’ function is only available if the reader is switched on.
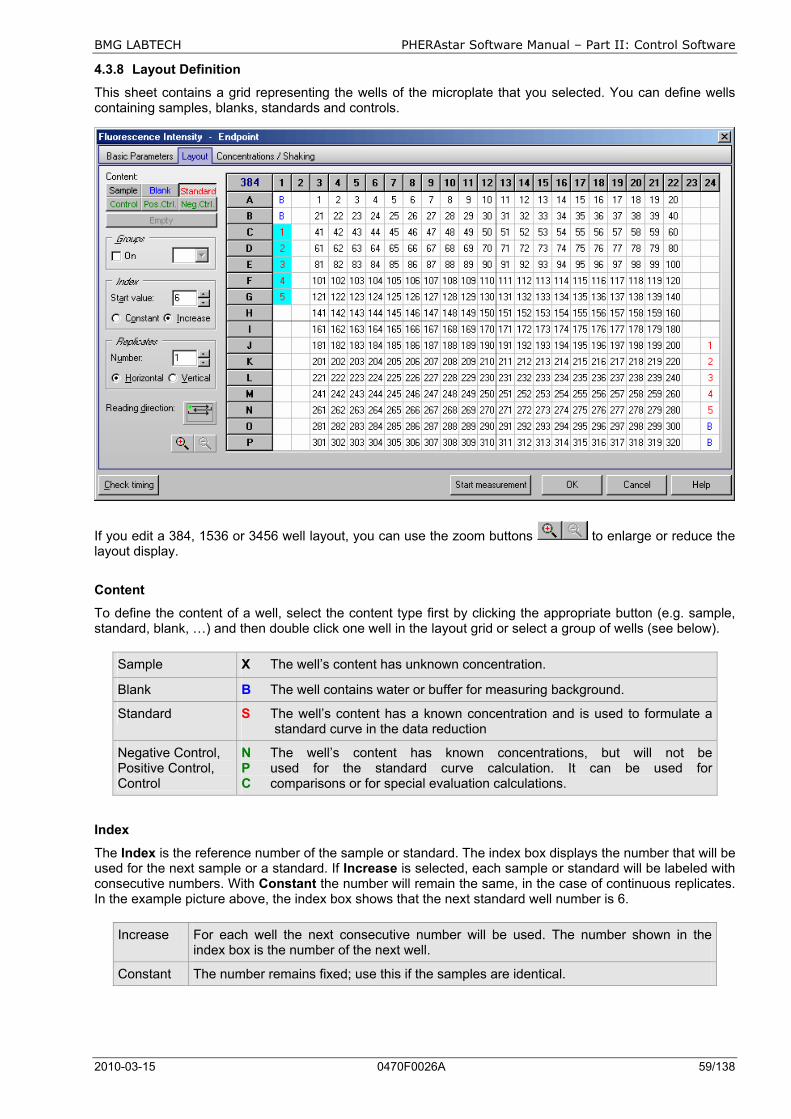
BMG LABTECH PHERAstar Software Manual – Part II: Control Software
2010-03-15 0470F0026A 59/138
4.3.8 Layout Definition
This sheet contains a grid representing the wells of the microplate that you selected. You can define wells containing samples, blanks, standards and controls.
If you edit a 384, 1536 or 3456 well layout, you can use the zoom buttons to enlarge or reduce the layout display.
Content
To define the content of a well, select the content type first by clicking the appropriate button (e.g. sample, standard, blank, …) and then double click one well in the layout grid or select a group of wells (see below).
Sample X The well’s content has unknown concentration.
Blank B The well contains water or buffer for measuring background.
Standard S The well’s content has a known concentration and is used to formulate a standard curve in the data reduction
Negative Control, Positive Control, Control
N The well’s content has known concentrations, but will not beP used for the standard curve calculation. It can be used for C comparisons or for special evaluation calculations.
Index
The Index is the reference number of the sample or standard. The index box displays the number that will be used for the next sample or a standard. If Increase is selected, each sample or standard will be labeled with consecutive numbers. With Constant the number will remain the same, in the case of continuous replicates. In the example picture above, the index box shows that the next standard well number is 6.
Increase For each well the next consecutive number will be used. The number shown in the index box is the number of the next well.
Constant The number remains fixed; use this if the samples are identical.

PHERAstar Software Manual – Part II: Control Software BMG LABTECH
60/138 0470F0026A 2010-03-15
Replicates
Replicates are the number of repeated samples. If you have duplicates of a sample on the microplate then select ‘2’ and label either in the horizontal or vertical direction.
Methods of Labeling (Auto Fill-Out Function)
1. Select the appropriate content type and then double click on each well of that type.
2. If the samples are in successive rows or columns, select increase if the samples should be labeled with consecutive numbers, or choose constant if they are continuous replicates. Click on the first well with the left mouse key and drag across the wells containing the samples, standards, controls or blanks.
3. If a row or column contains the same contents (samples, standards, ...) click the row letter or the column number and all wells of that row / column will be labeled.
4. To fill the entire microplate select the appropriate content (samples, standards, ...) and click on the format number (e.g. ‘96’) in the top left corner.
Notes: You can export and re-import a complete layout (containing also the standard concentration values,
see chapter 4.3.10) using the context menu of the layout grid (right click on the grid). Exporting only the layout grid into a Excel (.xls / .xlsx), text or HTML file is also possible.
You can undo the last 5 layout changes using the context popup menu or using the key combination [Ctrl]+[Z].
Reading direction
After pressing the reading direction button (
), you can choose between horizontal or vertical reading (horizontal: the plate carrier will move from left to right reading across successive columns, vertical: the plate carrier will move up and down reading in successive rows).
It is also possible to select a bidirectional or unidirectional reading mode. Example: Using a bidirectional horizontal reading of a full 96 well plate, the reading will continue after reading A1 ... A12 with B12 and then go back via B11, B10, ... to B1. If you choose unidirectional reading, the plate carrier would move to B1 after A12 and continue reading with B2, B3, ... .
It is possible to start the reading from any of the four corners.
Note: The reading direction has no bearing on the measurements; it is intended to optimize the time it takes to read the plate.
Possible reading modes:

BMG LABTECH PHERAstar Software Manual – Part II: Control Software
2010-03-15 0470F0026A 61/138
4.3.9 Using Layout Groups
It is possible to use up to 26 independent layout groups (sets of samples, blanks, controls and standards). Each group can be individually blank corrected and it is possible to calculate a separate standard curve for each group (see software manual part III: Data Analysis).
To activate the usage of groups activate the ‘On’ check box in the groups box. Use the pull down box next to this check box to select one of the 12 possible groups (A...L). Now enter samples, blanks and standards as described above. The group will be shown in the layout grid using different background colors and by inserting the group letter between content type identifier (e.g. B for blank, S for standard and X for sample) and index.
Notes: When switching on the group mode, all existing layout entries will be converted to group A.
When switching off the group mode, all layout entries not belonging to group A will be erased.
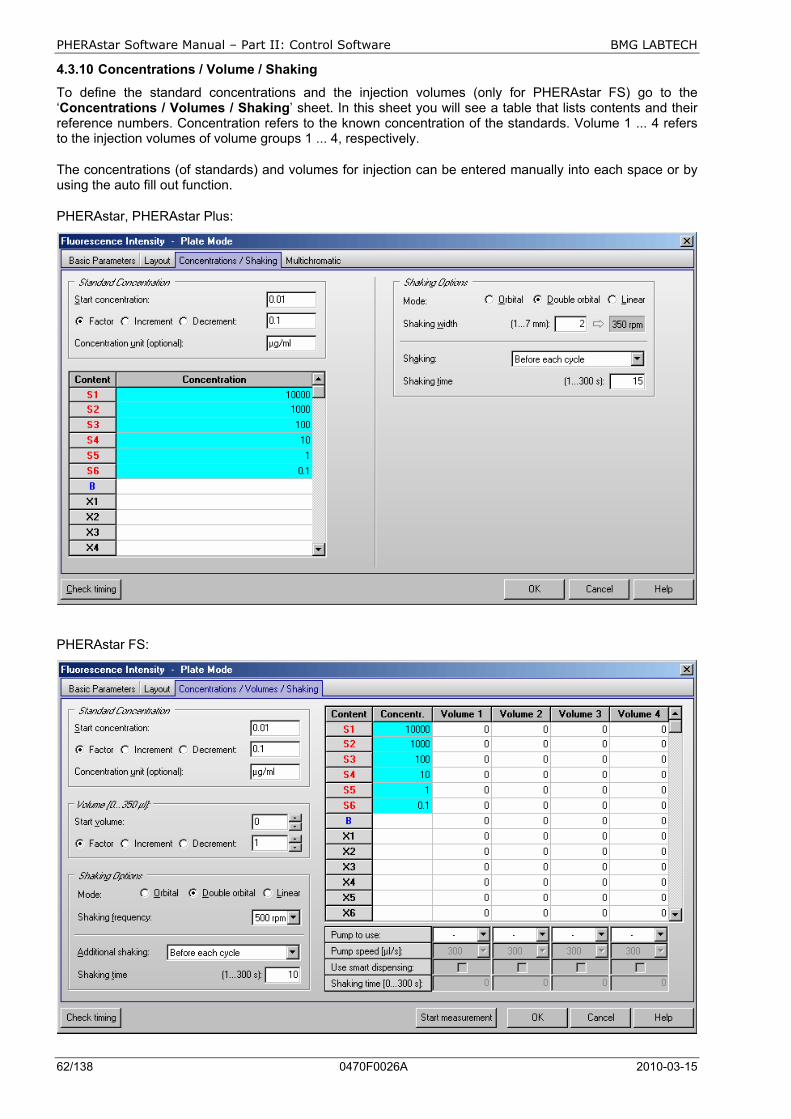
PHERAstar Software Manual – Part II: Control Software BMG LABTECH
62/138 0470F0026A 2010-03-15
4.3.10 Concentrations / Volume / Shaking
To define the standard concentrations and the injection volumes (only for PHERAstar FS) go to the ‘Concentrations / Volumes / Shaking’ sheet. In this sheet you will see a table that lists contents and their reference numbers. Concentration refers to the known concentration of the standards. Volume 1 ... 4 refers to the injection volumes of volume groups 1 ... 4, respectively.
The concentrations (of standards) and volumes for injection can be entered manually into each space or by using the auto fill out function.
PHERAstar, PHERAstar Plus:
PHERAstar FS:

BMG LABTECH PHERAstar Software Manual – Part II: Control Software
2010-03-15 0470F0026A 63/138
The Auto fill out function can be used to define the concentrations and volumes without entering them manually. This function works very similar to the layout definition auto fill out function. The concentrations or volumes will automatically be calculated using the given Start value and a number to be multiplied (Factor), added (Increment) or subtracted (Decrement).
Click with the left mouse button on the table headline ‘Concentration’ or ‘Volume 1’ ... ‘Volume 4’. You can also select a specific set of wells by finding the first (last) well and clicking and scrolling down (or up) with the left mouse button or using the cursor keys [ ↓ ] and [ ↑ ] together with [Shift]. The calculated values will automatically be entered into the table.
Standard Concentration
If you have defined standards in you plate layout it is necessary that you enter the standard concentrations here. These concentrations will later be used to calculate a standard curve and to calculate the concentrations of the samples (unknowns) in the Data Analysis software (see software manual part III).
Optionally you can define the unit for the concentration values. This unit will then be shown in the Data Analysis software.
Volume (only for PHERAstar FS)
You can use up to 4 injection or volume groups in one test protocol. Please enter the injection volumes you want to use into the table. Besides entering the volumes manually you can also use the auto fill out function (see above). It is not necessary to use all volume groups consecutive (you can for example use only volume 2 and 4).
You can enter the volumes in steps of 0.5 µl. If you prefer steps of 0.166 µl (1/6 µl = minimum step of the injectors) add the following line to the [Configuration] section of the ‘PHERAstar.ini’ file: MinVolumeStep=6, for minimum steps of 1 µl use MinVolumeStep=1. You will find this configuration file in the Omega main installation directory, usually ‘~\Program Files\BMG\PHERAstar\’.
Limitations for Injection
The maximum amount per injection is 500 µl (6, 12, 24 and 48 well plates), when using a standard 500 µl syringe or a larger syringe. When using a 250 µl syringe or a 100 µl syringe the volume per injection must not exceed the syringe size. The maximum amount per well (Volume 1 + Volume 2 + Volume 3 + Volume 4) is 350 µl for 96 well plates and 100 µl for 384 well plates respectively. Injection is not possible in 1536 or 3456 well plates.
BMG LABTECH does not recommend using volumes below 2.5 µl for a 500 µl syringe. If a 1 ml syringe is installed do not use volumes below 5 µl and for a 2.5 ml syringe use a minimum of 15 µl.
Pump to use
Select which pump should be used to inject the defined volume(s). It is possible to use the same pump in different volume groups.
Pump speed
The pump can dispense at different speeds. The injection speed is defined in µl / second. The default speed is 300 µl / second which should be appropriate for most assays. There are pre-defined speeds available by using the pull-down menu.
Factors determining pump speed:
Viscosity: Liquids, such as water and buffer, can be dispensed at higher speeds. For highly viscous solutions you should use a slower speed to ensure higher precision and lower the risk of air bubbles.
Cells: Solutions containing cells should have a lower speed because it causes less stress on the cells.
Volume: Higher speeds are necessary for small volumes (below 3...5 µl) to ensure the best performance.
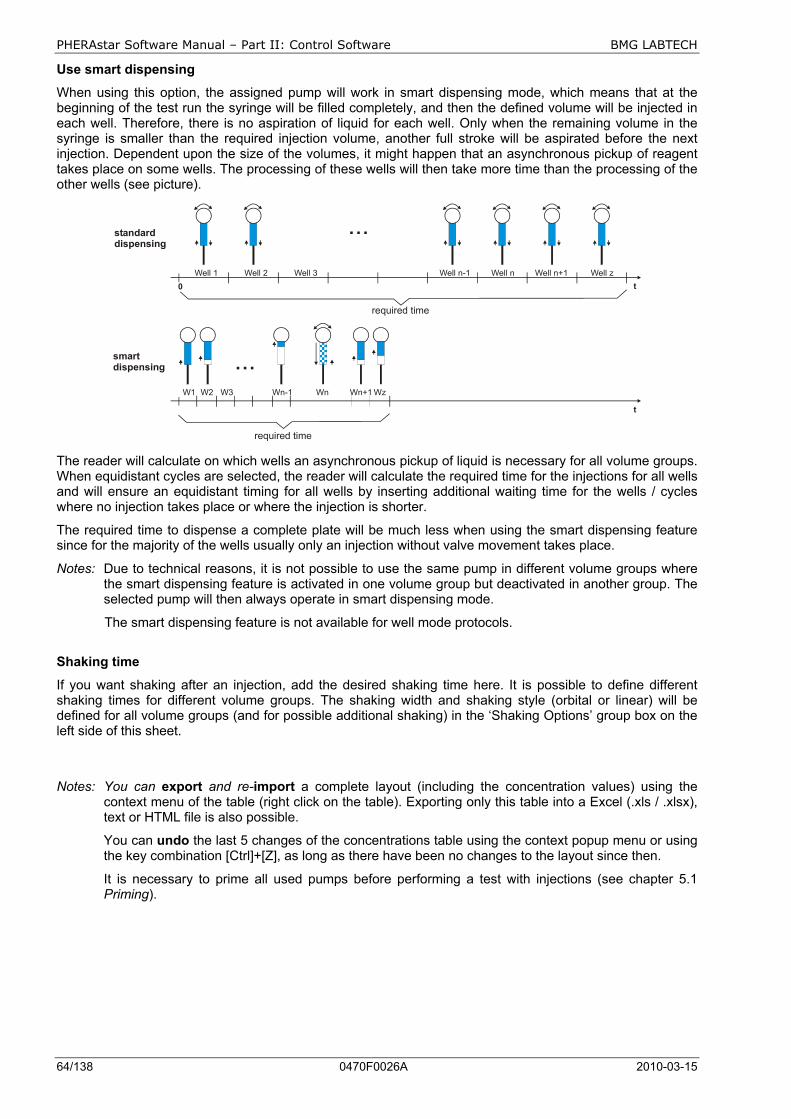
PHERAstar Software Manual – Part II: Control Software BMG LABTECH
64/138 0470F0026A 2010-03-15
Use smart dispensing
When using this option, the assigned pump will work in smart dispensing mode, which means that at the beginning of the test run the syringe will be filled completely, and then the defined volume will be injected in each well. Therefore, there is no aspiration of liquid for each well. Only when the remaining volume in the syringe is smaller than the required injection volume, another full stroke will be aspirated before the next injection. Dependent upon the size of the volumes, it might happen that an asynchronous pickup of reagent takes place on some wells. The processing of these wells will then take more time than the processing of the other wells (see picture).
W1 W2 W3 Wn-1 Wn Wn+1
Well 2Well 1 Well 3
standard dispensing
smart dispensing
t0
...
...Well n-1 Well n Well n+1 Well z
Wz
t
required time
required time The reader will calculate on which wells an asynchronous pickup of liquid is necessary for all volume groups. When equidistant cycles are selected, the reader will calculate the required time for the injections for all wells and will ensure an equidistant timing for all wells by inserting additional waiting time for the wells / cycles where no injection takes place or where the injection is shorter.
The required time to dispense a complete plate will be much less when using the smart dispensing feature since for the majority of the wells usually only an injection without valve movement takes place.
Notes: Due to technical reasons, it is not possible to use the same pump in different volume groups where the smart dispensing feature is activated in one volume group but deactivated in another group. The selected pump will then always operate in smart dispensing mode.
The smart dispensing feature is not available for well mode protocols.
Shaking time
If you want shaking after an injection, add the desired shaking time here. It is possible to define different shaking times for different volume groups. The shaking width and shaking style (orbital or linear) will be defined for all volume groups (and for possible additional shaking) in the ‘Shaking Options’ group box on the left side of this sheet.
Notes: You can export and re-import a complete layout (including the concentration values) using the context menu of the table (right click on the table). Exporting only this table into a Excel (.xls / .xlsx), text or HTML file is also possible.
You can undo the last 5 changes of the concentrations table using the context popup menu or using the key combination [Ctrl]+[Z], as long as there have been no changes to the layout since then.
It is necessary to prime all used pumps before performing a test with injections (see chapter 5.1 Priming).
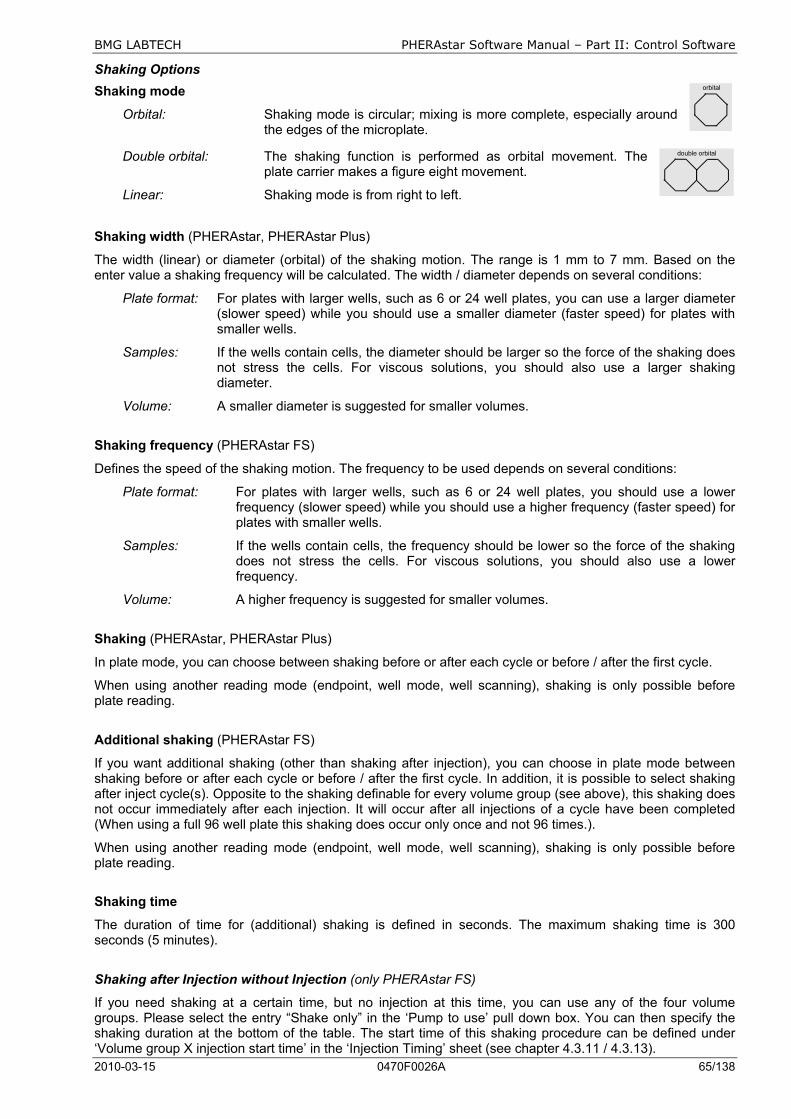
BMG LABTECH PHERAstar Software Manual – Part II: Control Software
2010-03-15 0470F0026A 65/138
Shaking Options Shaking mode
Orbital: Shaking mode is circular; mixing is more complete, especially around the edges of the microplate.
Double orbital: The shaking function is performed as orbital movement. The plate carrier makes a figure eight movement.
Linear: Shaking mode is from right to left. Shaking width (PHERAstar, PHERAstar Plus)
The width (linear) or diameter (orbital) of the shaking motion. The range is 1 mm to 7 mm. Based on the enter value a shaking frequency will be calculated. The width / diameter depends on several conditions:
Plate format: For plates with larger wells, such as 6 or 24 well plates, you can use a larger diameter (slower speed) while you should use a smaller diameter (faster speed) for plates with smaller wells.
Samples: If the wells contain cells, the diameter should be larger so the force of the shaking does not stress the cells. For viscous solutions, you should also use a larger shaking diameter.
Volume: A smaller diameter is suggested for smaller volumes.
Shaking frequency (PHERAstar FS)
Defines the speed of the shaking motion. The frequency to be used depends on several conditions:
Plate format: For plates with larger wells, such as 6 or 24 well plates, you should use a lower frequency (slower speed) while you should use a higher frequency (faster speed) for plates with smaller wells.
Samples: If the wells contain cells, the frequency should be lower so the force of the shaking does not stress the cells. For viscous solutions, you should also use a lower frequency.
Volume: A higher frequency is suggested for smaller volumes.
Shaking (PHERAstar, PHERAstar Plus)
In plate mode, you can choose between shaking before or after each cycle or before / after the first cycle.
When using another reading mode (endpoint, well mode, well scanning), shaking is only possible before plate reading.
Additional shaking (PHERAstar FS)
If you want additional shaking (other than shaking after injection), you can choose in plate mode between shaking before or after each cycle or before / after the first cycle. In addition, it is possible to select shaking after inject cycle(s). Opposite to the shaking definable for every volume group (see above), this shaking does not occur immediately after each injection. It will occur after all injections of a cycle have been completed (When using a full 96 well plate this shaking does occur only once and not 96 times.).
When using another reading mode (endpoint, well mode, well scanning), shaking is only possible before plate reading.
Shaking time
The duration of time for (additional) shaking is defined in seconds. The maximum shaking time is 300 seconds (5 minutes).
Shaking after Injection without Injection (only PHERAstar FS)
If you need shaking at a certain time, but no injection at this time, you can use any of the four volume groups. Please select the entry “Shake only” in the ‘Pump to use’ pull down box. You can then specify the shaking duration at the bottom of the table. The start time of this shaking procedure can be defined under ‘Volume group X injection start time’ in the ‘Injection Timing’ sheet (see chapter 4.3.11 / 4.3.13).
orbital
double orbital
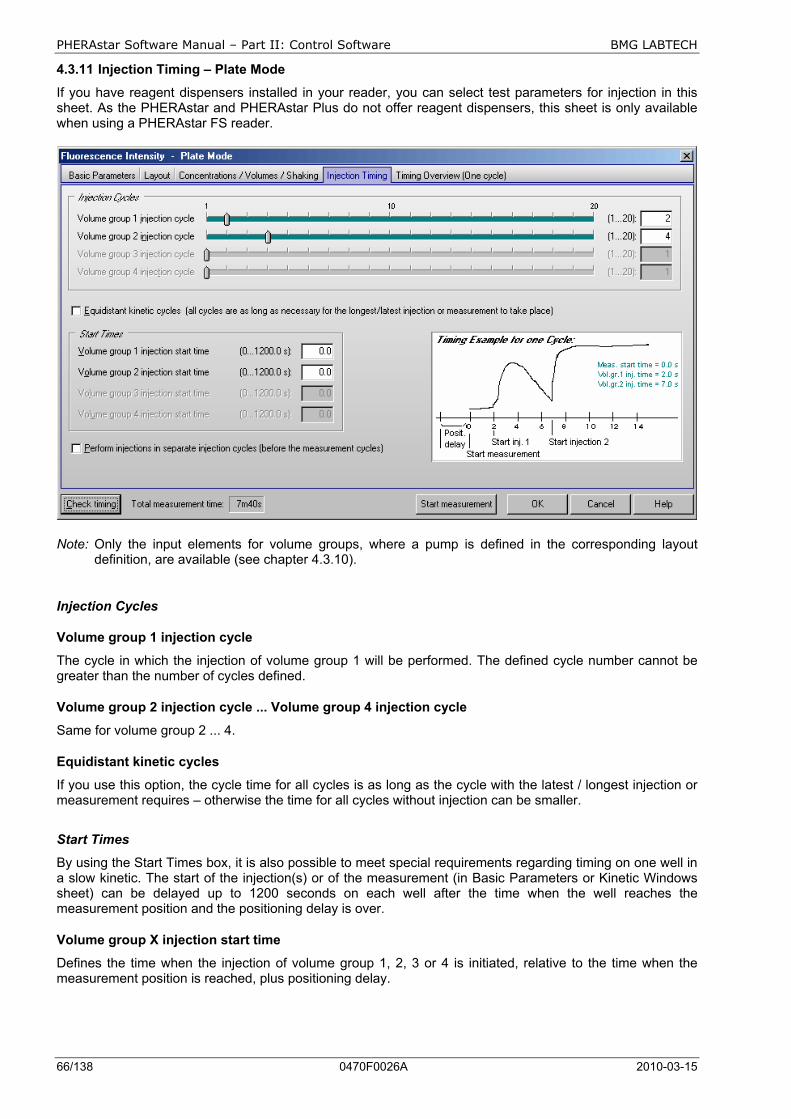
PHERAstar Software Manual – Part II: Control Software BMG LABTECH
66/138 0470F0026A 2010-03-15
4.3.11 Injection Timing – Plate Mode
If you have reagent dispensers installed in your reader, you can select test parameters for injection in this sheet. As the PHERAstar and PHERAstar Plus do not offer reagent dispensers, this sheet is only available when using a PHERAstar FS reader.
Note: Only the input elements for volume groups, where a pump is defined in the corresponding layout definition, are available (see chapter 4.3.10).
Injection Cycles
Volume group 1 injection cycle
The cycle in which the injection of volume group 1 will be performed. The defined cycle number cannot be greater than the number of cycles defined.
Volume group 2 injection cycle ... Volume group 4 injection cycle
Same for volume group 2 ... 4.
Equidistant kinetic cycles
If you use this option, the cycle time for all cycles is as long as the cycle with the latest / longest injection or measurement requires – otherwise the time for all cycles without injection can be smaller.
Start Times
By using the Start Times box, it is also possible to meet special requirements regarding timing on one well in a slow kinetic. The start of the injection(s) or of the measurement (in Basic Parameters or Kinetic Windows sheet) can be delayed up to 1200 seconds on each well after the time when the well reaches the measurement position and the positioning delay is over.
Volume group X injection start time
Defines the time when the injection of volume group 1, 2, 3 or 4 is initiated, relative to the time when the measurement position is reached, plus positioning delay.
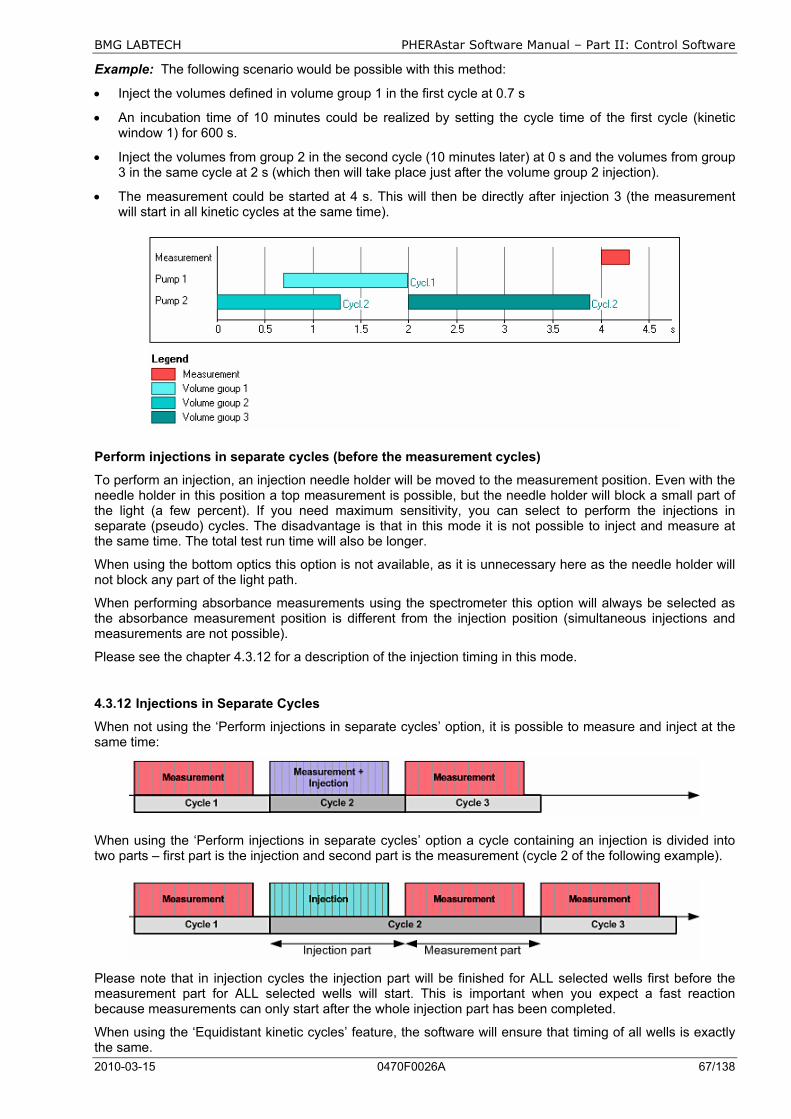
BMG LABTECH PHERAstar Software Manual – Part II: Control Software
2010-03-15 0470F0026A 67/138
Example: The following scenario would be possible with this method:
• Inject the volumes defined in volume group 1 in the first cycle at 0.7 s
• An incubation time of 10 minutes could be realized by setting the cycle time of the first cycle (kinetic window 1) for 600 s.
• Inject the volumes from group 2 in the second cycle (10 minutes later) at 0 s and the volumes from group 3 in the same cycle at 2 s (which then will take place just after the volume group 2 injection).
• The measurement could be started at 4 s. This will then be directly after injection 3 (the measurement will start in all kinetic cycles at the same time).
Perform injections in separate cycles (before the measurement cycles)
To perform an injection, an injection needle holder will be moved to the measurement position. Even with the needle holder in this position a top measurement is possible, but the needle holder will block a small part of the light (a few percent). If you need maximum sensitivity, you can select to perform the injections in separate (pseudo) cycles. The disadvantage is that in this mode it is not possible to inject and measure at the same time. The total test run time will also be longer.
When using the bottom optics this option is not available, as it is unnecessary here as the needle holder will not block any part of the light path.
When performing absorbance measurements using the spectrometer this option will always be selected as the absorbance measurement position is different from the injection position (simultaneous injections and measurements are not possible).
Please see the chapter 4.3.12 for a description of the injection timing in this mode.
4.3.12 Injections in Separate Cycles
When not using the ‘Perform injections in separate cycles’ option, it is possible to measure and inject at the same time:
When using the ‘Perform injections in separate cycles’ option a cycle containing an injection is divided into two parts – first part is the injection and second part is the measurement (cycle 2 of the following example).
Please note that in injection cycles the injection part will be finished for ALL selected wells first before the measurement part for ALL selected wells will start. This is important when you expect a fast reaction because measurements can only start after the whole injection part has been completed.
When using the ‘Equidistant kinetic cycles’ feature, the software will ensure that timing of all wells is exactly the same.
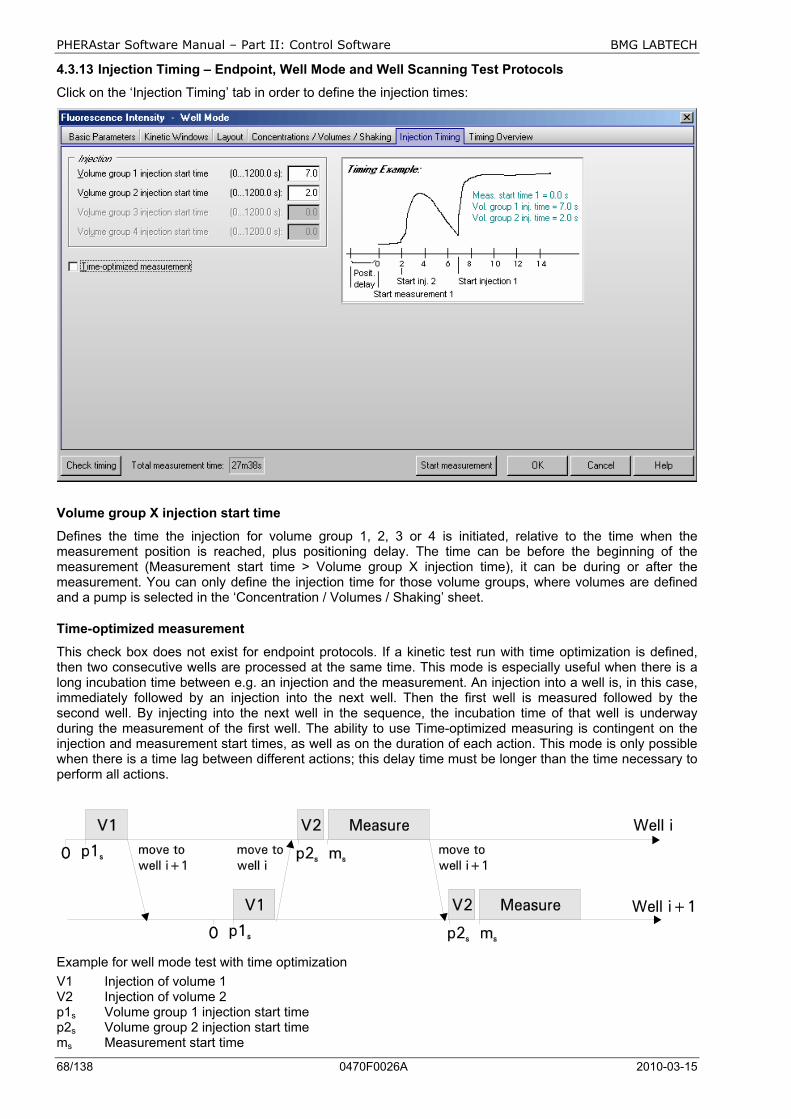
PHERAstar Software Manual – Part II: Control Software BMG LABTECH
68/138 0470F0026A 2010-03-15
4.3.13 Injection Timing – Endpoint, Well Mode and Well Scanning Test Protocols
Click on the ‘Injection Timing’ tab in order to define the injection times:
Volume group X injection start time
Defines the time the injection for volume group 1, 2, 3 or 4 is initiated, relative to the time when the measurement position is reached, plus positioning delay. The time can be before the beginning of the measurement (Measurement start time > Volume group X injection time), it can be during or after the measurement. You can only define the injection time for those volume groups, where volumes are defined and a pump is selected in the ‘Concentration / Volumes / Shaking’ sheet.
Time-optimized measurement
This check box does not exist for endpoint protocols. If a kinetic test run with time optimization is defined, then two consecutive wells are processed at the same time. This mode is especially useful when there is a long incubation time between e.g. an injection and the measurement. An injection into a well is, in this case, immediately followed by an injection into the next well. Then the first well is measured followed by the second well. By injecting into the next well in the sequence, the incubation time of that well is underway during the measurement of the first well. The ability to use Time-optimized measuring is contingent on the injection and measurement start times, as well as on the duration of each action. This mode is only possible when there is a time lag between different actions; this delay time must be longer than the time necessary to perform all actions.
Example for well mode test with time optimization V1 Injection of volume 1 V2 Injection of volume 2 p1s Volume group 1 injection start time p2s Volume group 2 injection start time ms Measurement start time
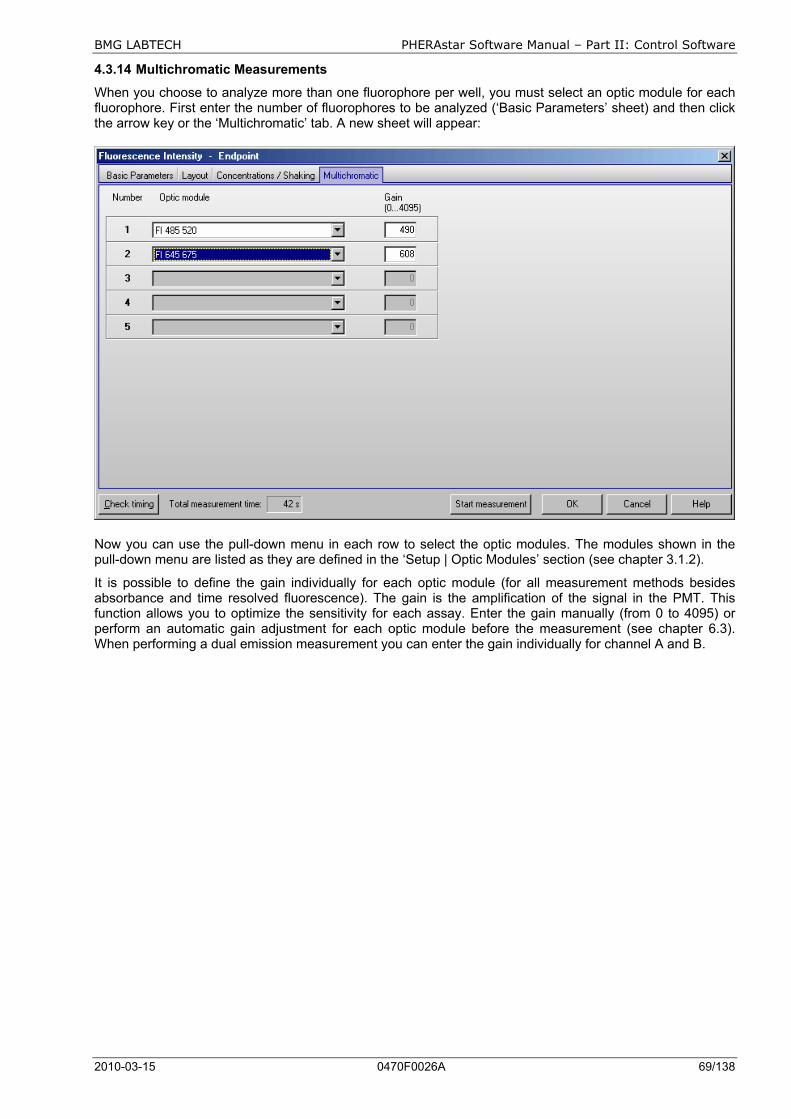
BMG LABTECH PHERAstar Software Manual – Part II: Control Software
2010-03-15 0470F0026A 69/138
4.3.14 Multichromatic Measurements
When you choose to analyze more than one fluorophore per well, you must select an optic module for each fluorophore. First enter the number of fluorophores to be analyzed (‘Basic Parameters’ sheet) and then click the arrow key or the ‘Multichromatic’ tab. A new sheet will appear:
Now you can use the pull-down menu in each row to select the optic modules. The modules shown in the pull-down menu are listed as they are defined in the ‘Setup | Optic Modules’ section (see chapter 3.1.2).
It is possible to define the gain individually for each optic module (for all measurement methods besides absorbance and time resolved fluorescence). The gain is the amplification of the signal in the PMT. This function allows you to optimize the sensitivity for each assay. Enter the gain manually (from 0 to 4095) or perform an automatic gain adjustment for each optic module before the measurement (see chapter 6.3). When performing a dual emission measurement you can enter the gain individually for channel A and B.

PHERAstar Software Manual – Part II: Control Software BMG LABTECH
70/138 0470F0026A 2010-03-15
4.3.15 Timing Overview
The timing overview offers a graphic display of the measurement and injection timing. As the PHERAstar and PHERAstar Plus do not offer injections, this sheet is only available when using a PHERAstar FS reader.
After clicking the ‘Check timing’ button (lower left corner of the test protocol definition window), the following sheet will become available:
In this sheet, you can see a graphic overview of the measurement and all injections for one well. (For plate mode tests, all actions are displayed in the timing overview of one cycle. The displayed injections may occur in different cycles, as defined under ‘Injection / Timing’. The cycle used will be listed behind each injection bar.)
If there is a timing problem, e.g. overlapping injections using the same pump this will be marked by an exclamation mark and a description will inform you about the origin of the timing problem.
In addition, you will see tables containing the timing for measurements and the injection times. If you use the ‘Shaking after injection’ option (definable in the ‘Concentrations / Volumes / Shaking’ sheet), you will see these times as well.
You can change the timing by moving the timing bars using the mouse (left click a bar and drag it to its new position). Time values changed by moving a bar will be displayed in cyan. You can also change a time value by clicking the value inside the table. This will bring you to the protocol definition sheet where this time value can either be directly entered or influenced (e.g. the kinetic window stop time can be change by changing the number of intervals).
An injection action can contain different steps:
Note: The pump action times listed include the time for shaking.
Injections are not possible during shaking.
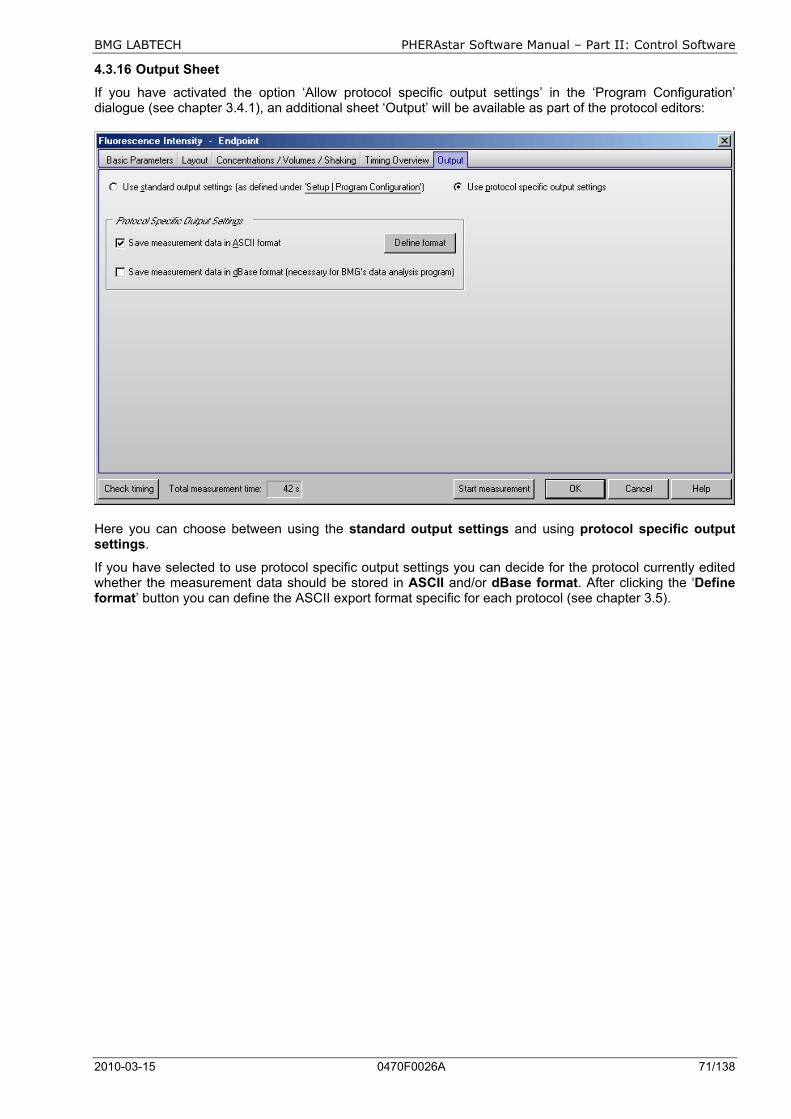
BMG LABTECH PHERAstar Software Manual – Part II: Control Software
2010-03-15 0470F0026A 71/138
4.3.16 Output Sheet
If you have activated the option ‘Allow protocol specific output settings’ in the ‘Program Configuration’ dialogue (see chapter 3.4.1), an additional sheet ‘Output’ will be available as part of the protocol editors:
Here you can choose between using the standard output settings and using protocol specific output settings.
If you have selected to use protocol specific output settings you can decide for the protocol currently edited whether the measurement data should be stored in ASCII and/or dBase format. After clicking the ‘Define format’ button you can define the ASCII export format specific for each protocol (see chapter 3.5).
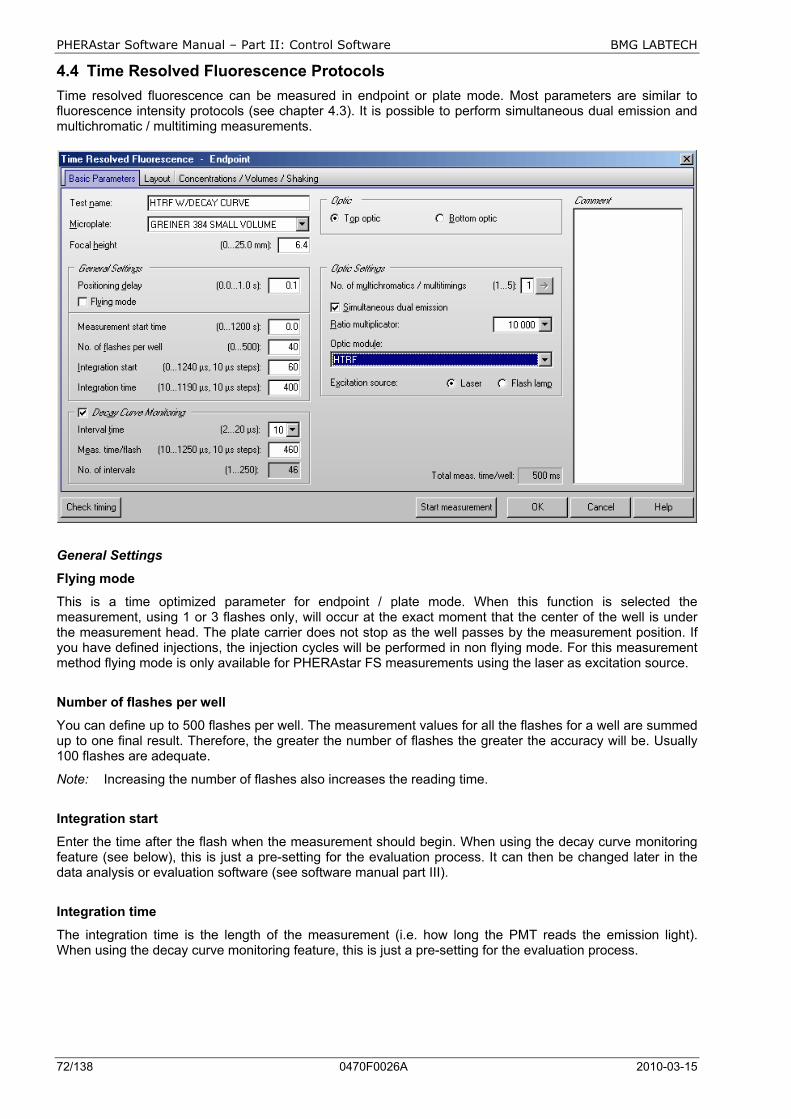
PHERAstar Software Manual – Part II: Control Software BMG LABTECH
72/138 0470F0026A 2010-03-15
4.4 Time Resolved Fluorescence Protocols Time resolved fluorescence can be measured in endpoint or plate mode. Most parameters are similar to fluorescence intensity protocols (see chapter 4.3). It is possible to perform simultaneous dual emission and multichromatic / multitiming measurements.
General Settings
Flying mode
This is a time optimized parameter for endpoint / plate mode. When this function is selected the measurement, using 1 or 3 flashes only, will occur at the exact moment that the center of the well is under the measurement head. The plate carrier does not stop as the well passes by the measurement position. If you have defined injections, the injection cycles will be performed in non flying mode. For this measurement method flying mode is only available for PHERAstar FS measurements using the laser as excitation source.
Number of flashes per well
You can define up to 500 flashes per well. The measurement values for all the flashes for a well are summed up to one final result. Therefore, the greater the number of flashes the greater the accuracy will be. Usually 100 flashes are adequate.
Note: Increasing the number of flashes also increases the reading time.
Integration start
Enter the time after the flash when the measurement should begin. When using the decay curve monitoring feature (see below), this is just a pre-setting for the evaluation process. It can then be changed later in the data analysis or evaluation software (see software manual part III).
Integration time
The integration time is the length of the measurement (i.e. how long the PMT reads the emission light). When using the decay curve monitoring feature, this is just a pre-setting for the evaluation process.
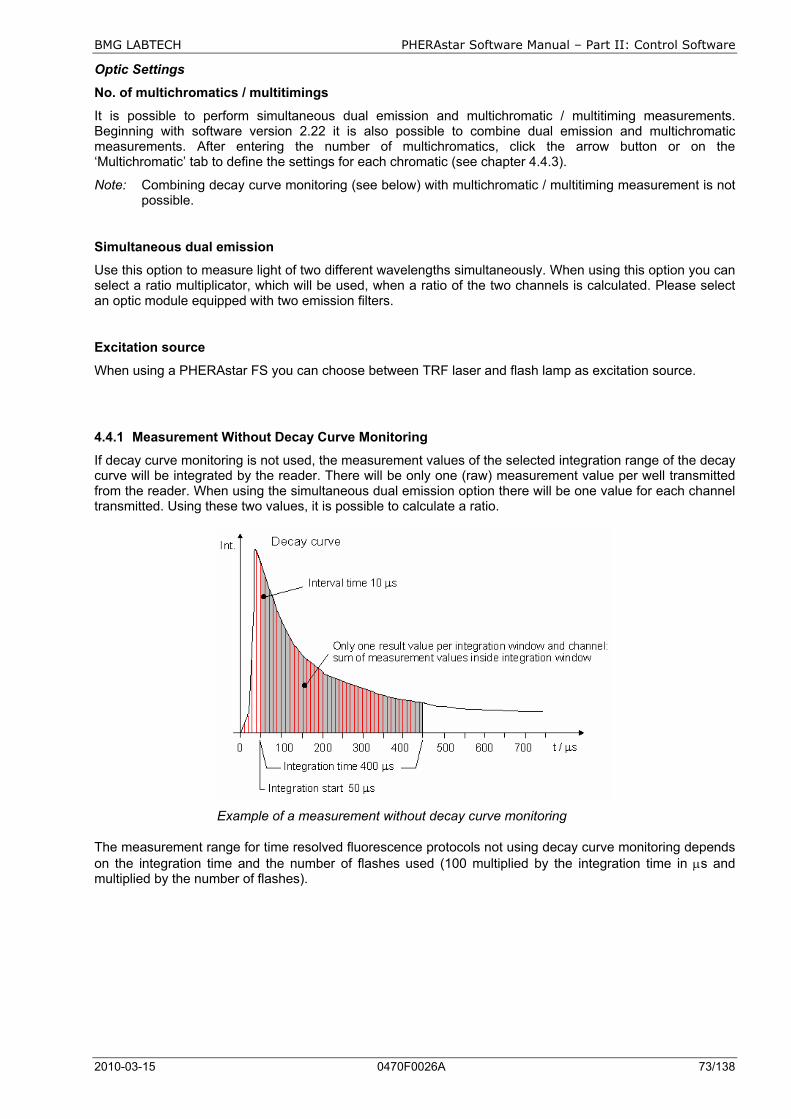
BMG LABTECH PHERAstar Software Manual – Part II: Control Software
2010-03-15 0470F0026A 73/138
Optic Settings
No. of multichromatics / multitimings
It is possible to perform simultaneous dual emission and multichromatic / multitiming measurements. Beginning with software version 2.22 it is also possible to combine dual emission and multichromatic measurements. After entering the number of multichromatics, click the arrow button or on the ‘Multichromatic’ tab to define the settings for each chromatic (see chapter 4.4.3).
Note: Combining decay curve monitoring (see below) with multichromatic / multitiming measurement is not possible.
Simultaneous dual emission
Use this option to measure light of two different wavelengths simultaneously. When using this option you can select a ratio multiplicator, which will be used, when a ratio of the two channels is calculated. Please select an optic module equipped with two emission filters.
Excitation source
When using a PHERAstar FS you can choose between TRF laser and flash lamp as excitation source.
4.4.1 Measurement Without Decay Curve Monitoring
If decay curve monitoring is not used, the measurement values of the selected integration range of the decay curve will be integrated by the reader. There will be only one (raw) measurement value per well transmitted from the reader. When using the simultaneous dual emission option there will be one value for each channel transmitted. Using these two values, it is possible to calculate a ratio.
Example of a measurement without decay curve monitoring
The measurement range for time resolved fluorescence protocols not using decay curve monitoring depends on the integration time and the number of flashes used (100 multiplied by the integration time in µs and multiplied by the number of flashes).
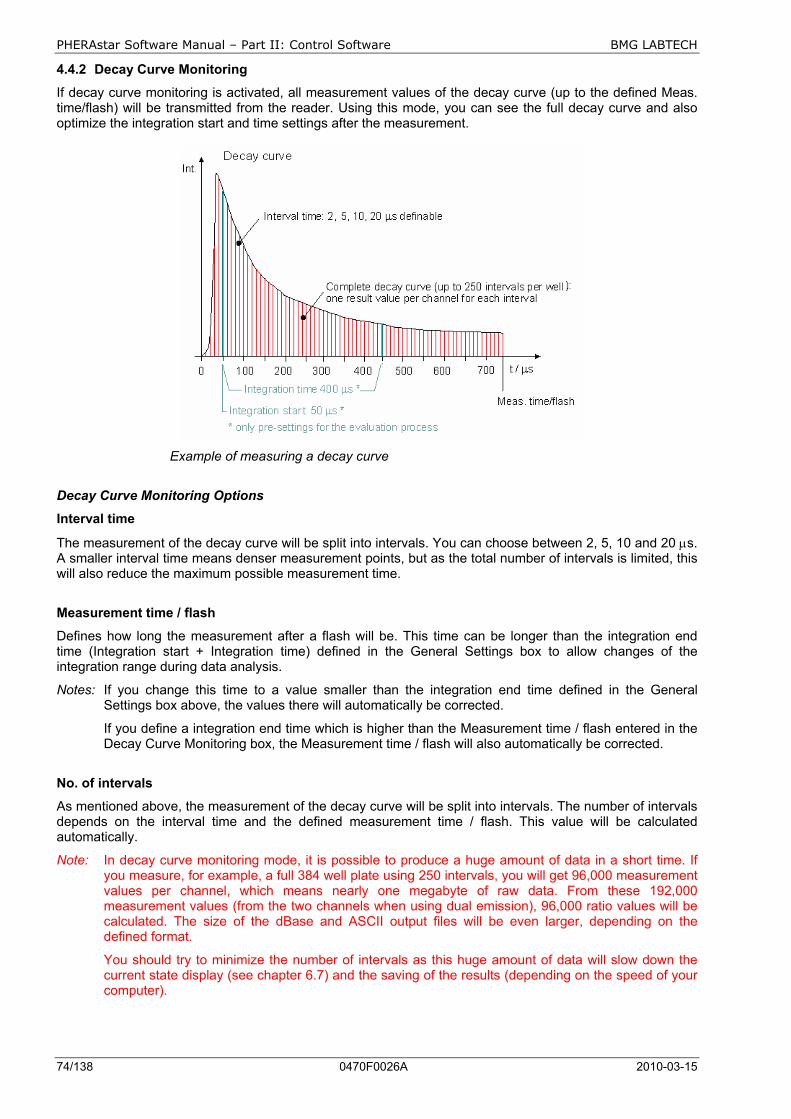
PHERAstar Software Manual – Part II: Control Software BMG LABTECH
74/138 0470F0026A 2010-03-15
4.4.2 Decay Curve Monitoring
If decay curve monitoring is activated, all measurement values of the decay curve (up to the defined Meas. time/flash) will be transmitted from the reader. Using this mode, you can see the full decay curve and also optimize the integration start and time settings after the measurement.
Example of measuring a decay curve
Decay Curve Monitoring Options
Interval time
The measurement of the decay curve will be split into intervals. You can choose between 2, 5, 10 and 20 µs. A smaller interval time means denser measurement points, but as the total number of intervals is limited, this will also reduce the maximum possible measurement time.
Measurement time / flash
Defines how long the measurement after a flash will be. This time can be longer than the integration end time (Integration start + Integration time) defined in the General Settings box to allow changes of the integration range during data analysis.
Notes: If you change this time to a value smaller than the integration end time defined in the General Settings box above, the values there will automatically be corrected.
If you define a integration end time which is higher than the Measurement time / flash entered in the Decay Curve Monitoring box, the Measurement time / flash will also automatically be corrected.
No. of intervals
As mentioned above, the measurement of the decay curve will be split into intervals. The number of intervals depends on the interval time and the defined measurement time / flash. This value will be calculated automatically.
Note: In decay curve monitoring mode, it is possible to produce a huge amount of data in a short time. If you measure, for example, a full 384 well plate using 250 intervals, you will get 96,000 measurement values per channel, which means nearly one megabyte of raw data. From these 192,000 measurement values (from the two channels when using dual emission), 96,000 ratio values will be calculated. The size of the dBase and ASCII output files will be even larger, depending on the defined format.
You should try to minimize the number of intervals as this huge amount of data will slow down the current state display (see chapter 6.7) and the saving of the results (depending on the speed of your computer).
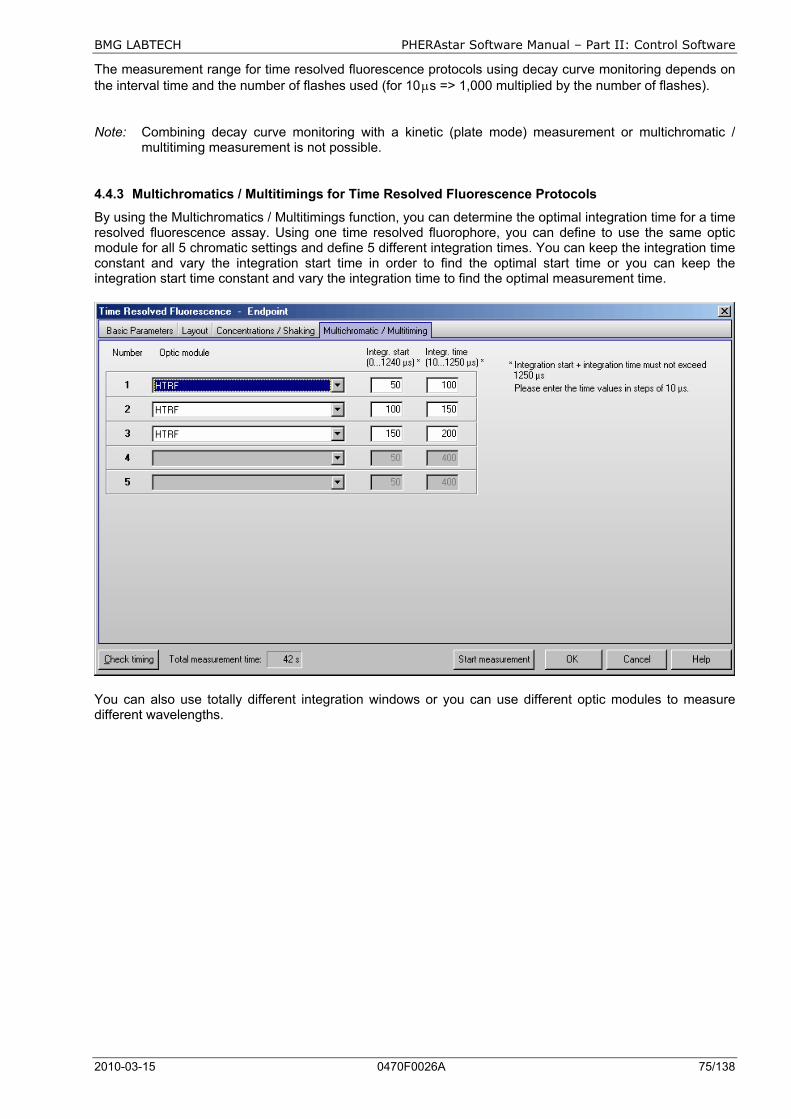
BMG LABTECH PHERAstar Software Manual – Part II: Control Software
2010-03-15 0470F0026A 75/138
The measurement range for time resolved fluorescence protocols using decay curve monitoring depends on the interval time and the number of flashes used (for 10 µs => 1,000 multiplied by the number of flashes).
Note: Combining decay curve monitoring with a kinetic (plate mode) measurement or multichromatic /
multitiming measurement is not possible.
4.4.3 Multichromatics / Multitimings for Time Resolved Fluorescence Protocols
By using the Multichromatics / Multitimings function, you can determine the optimal integration time for a time resolved fluorescence assay. Using one time resolved fluorophore, you can define to use the same optic module for all 5 chromatic settings and define 5 different integration times. You can keep the integration time constant and vary the integration start time in order to find the optimal start time or you can keep the integration start time constant and vary the integration time to find the optimal measurement time.
You can also use totally different integration windows or you can use different optic modules to measure different wavelengths.

PHERAstar Software Manual – Part II: Control Software BMG LABTECH
76/138 0470F0026A 2010-03-15
4.5 Fluorescence Polarization Protocols In fluorescence polarization mode, 2 PMTs (photo multiplier tubes) are used for measuring two different channels. Channel A measures parallel polarized light and channel B measures perpendicular polarized light.
Fluorescence polarization can be measured in endpoint, plate or well mode. Most parameters are similar to fluorescence protocols (see chapter 4.3). Multichromatic measurements are not possible.
Optic module
The optic modules for fluorescence polarization measurement are equipped with one excitation and two emission filters with identical wave length.
Gain
You can specify gain values for both channels. The necessary gain may differ slightly between the channels. It is best to perform an automatic gain adjustment just before the test start (see chapter 6.3 Focus and Gain Adjustment).
Positioning delay
The positioning delay in fluorescence polarization tests is recommended to be at least 0.3 seconds, so that the surface of the liquid is stable before measurement.
No. of flashes
BMG LABTECH recommends 50 for the number of flashes for the most accurate results. All flashes are averaged for one intensity value.
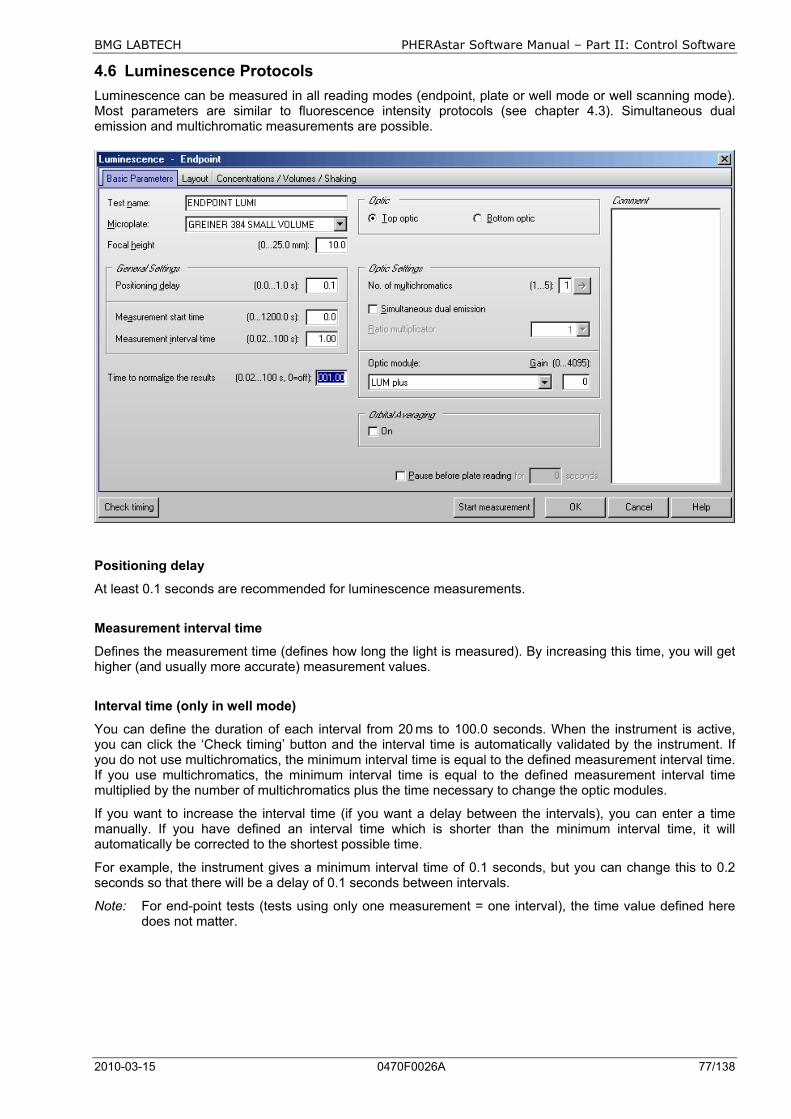
BMG LABTECH PHERAstar Software Manual – Part II: Control Software
2010-03-15 0470F0026A 77/138
4.6 Luminescence Protocols Luminescence can be measured in all reading modes (endpoint, plate or well mode or well scanning mode). Most parameters are similar to fluorescence intensity protocols (see chapter 4.3). Simultaneous dual emission and multichromatic measurements are possible.
Positioning delay
At least 0.1 seconds are recommended for luminescence measurements.
Measurement interval time
Defines the measurement time (defines how long the light is measured). By increasing this time, you will get higher (and usually more accurate) measurement values.
Interval time (only in well mode)
You can define the duration of each interval from 20 ms to 100.0 seconds. When the instrument is active, you can click the ‘Check timing’ button and the interval time is automatically validated by the instrument. If you do not use multichromatics, the minimum interval time is equal to the defined measurement interval time. If you use multichromatics, the minimum interval time is equal to the defined measurement interval time multiplied by the number of multichromatics plus the time necessary to change the optic modules.
If you want to increase the interval time (if you want a delay between the intervals), you can enter a time manually. If you have defined an interval time which is shorter than the minimum interval time, it will automatically be corrected to the shortest possible time.
For example, the instrument gives a minimum interval time of 0.1 seconds, but you can change this to 0.2 seconds so that there will be a delay of 0.1 seconds between intervals.
Note: For end-point tests (tests using only one measurement = one interval), the time value defined here does not matter.
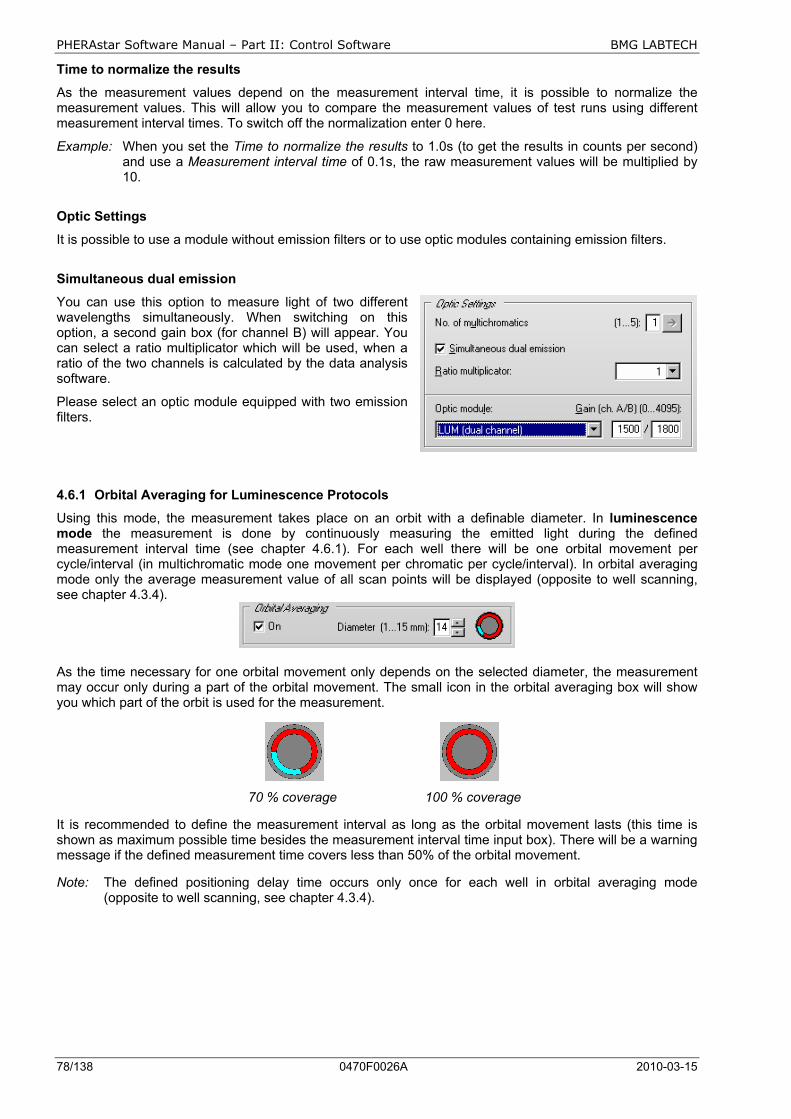
PHERAstar Software Manual – Part II: Control Software BMG LABTECH
78/138 0470F0026A 2010-03-15
Time to normalize the results
As the measurement values depend on the measurement interval time, it is possible to normalize the measurement values. This will allow you to compare the measurement values of test runs using different measurement interval times. To switch off the normalization enter 0 here.
Example: When you set the Time to normalize the results to 1.0s (to get the results in counts per second) and use a Measurement interval time of 0.1s, the raw measurement values will be multiplied by 10.
Optic Settings
It is possible to use a module without emission filters or to use optic modules containing emission filters.
Simultaneous dual emission
You can use this option to measure light of two different wavelengths simultaneously. When switching on this option, a second gain box (for channel B) will appear. You can select a ratio multiplicator which will be used, when a ratio of the two channels is calculated by the data analysis software.
Please select an optic module equipped with two emission filters.
4.6.1 Orbital Averaging for Luminescence Protocols
Using this mode, the measurement takes place on an orbit with a definable diameter. In luminescence mode the measurement is done by continuously measuring the emitted light during the defined measurement interval time (see chapter 4.6.1). For each well there will be one orbital movement per cycle/interval (in multichromatic mode one movement per chromatic per cycle/interval). In orbital averaging mode only the average measurement value of all scan points will be displayed (opposite to well scanning, see chapter 4.3.4).
As the time necessary for one orbital movement only depends on the selected diameter, the measurement may occur only during a part of the orbital movement. The small icon in the orbital averaging box will show you which part of the orbit is used for the measurement.
70 % coverage 100 % coverage
It is recommended to define the measurement interval as long as the orbital movement lasts (this time is shown as maximum possible time besides the measurement interval time input box). There will be a warning message if the defined measurement time covers less than 50% of the orbital movement.
Note: The defined positioning delay time occurs only once for each well in orbital averaging mode (opposite to well scanning, see chapter 4.3.4).
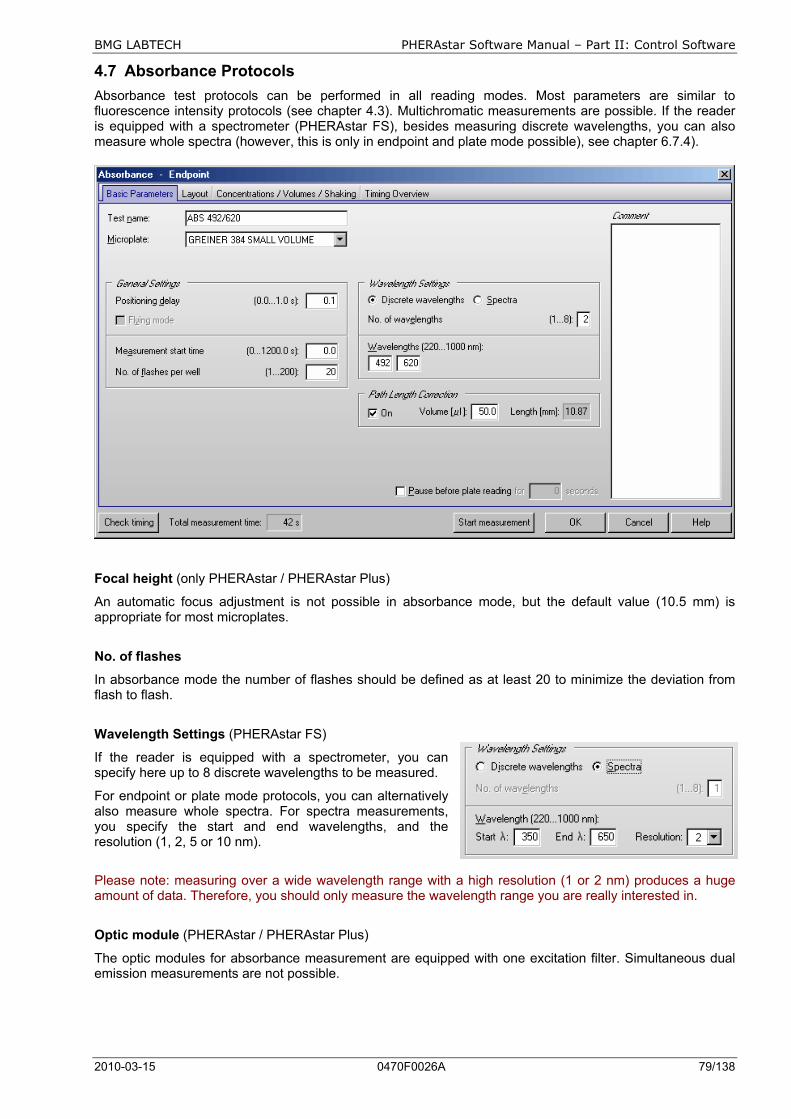
BMG LABTECH PHERAstar Software Manual – Part II: Control Software
2010-03-15 0470F0026A 79/138
4.7 Absorbance Protocols Absorbance test protocols can be performed in all reading modes. Most parameters are similar to fluorescence intensity protocols (see chapter 4.3). Multichromatic measurements are possible. If the reader is equipped with a spectrometer (PHERAstar FS), besides measuring discrete wavelengths, you can also measure whole spectra (however, this is only in endpoint and plate mode possible), see chapter 6.7.4).
Focal height (only PHERAstar / PHERAstar Plus)
An automatic focus adjustment is not possible in absorbance mode, but the default value (10.5 mm) is appropriate for most microplates.
No. of flashes
In absorbance mode the number of flashes should be defined as at least 20 to minimize the deviation from flash to flash.
Wavelength Settings (PHERAstar FS)
If the reader is equipped with a spectrometer, you can specify here up to 8 discrete wavelengths to be measured.
For endpoint or plate mode protocols, you can alternatively also measure whole spectra. For spectra measurements, you specify the start and end wavelengths, and the resolution (1, 2, 5 or 10 nm).
Please note: measuring over a wide wavelength range with a high resolution (1 or 2 nm) produces a huge amount of data. Therefore, you should only measure the wavelength range you are really interested in.
Optic module (PHERAstar / PHERAstar Plus)
The optic modules for absorbance measurement are equipped with one excitation filter. Simultaneous dual emission measurements are not possible.
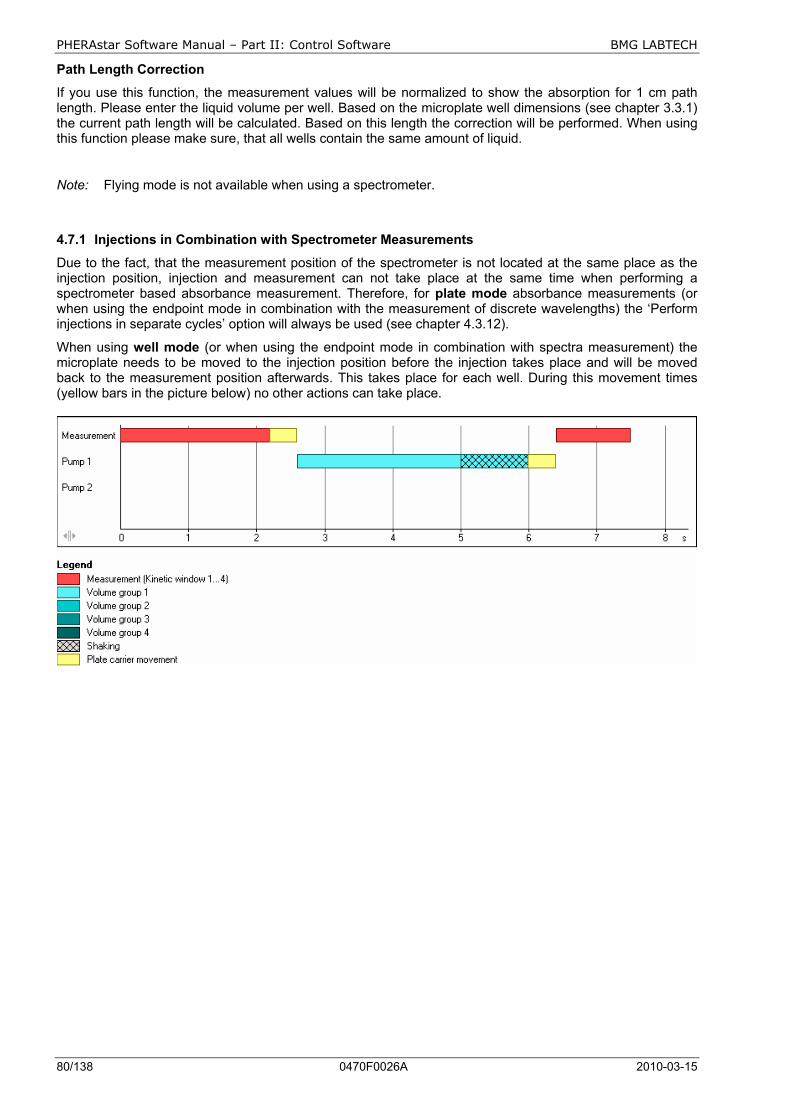
PHERAstar Software Manual – Part II: Control Software BMG LABTECH
80/138 0470F0026A 2010-03-15
Path Length Correction
If you use this function, the measurement values will be normalized to show the absorption for 1 cm path length. Please enter the liquid volume per well. Based on the microplate well dimensions (see chapter 3.3.1) the current path length will be calculated. Based on this length the correction will be performed. When using this function please make sure, that all wells contain the same amount of liquid.
Note: Flying mode is not available when using a spectrometer.
4.7.1 Injections in Combination with Spectrometer Measurements
Due to the fact, that the measurement position of the spectrometer is not located at the same place as the injection position, injection and measurement can not take place at the same time when performing a spectrometer based absorbance measurement. Therefore, for plate mode absorbance measurements (or when using the endpoint mode in combination with the measurement of discrete wavelengths) the ‘Perform injections in separate cycles’ option will always be used (see chapter 4.3.12).
When using well mode (or when using the endpoint mode in combination with spectra measurement) the microplate needs to be moved to the injection position before the injection takes place and will be moved back to the measurement position afterwards. This takes place for each well. During this movement times (yellow bars in the picture below) no other actions can take place.
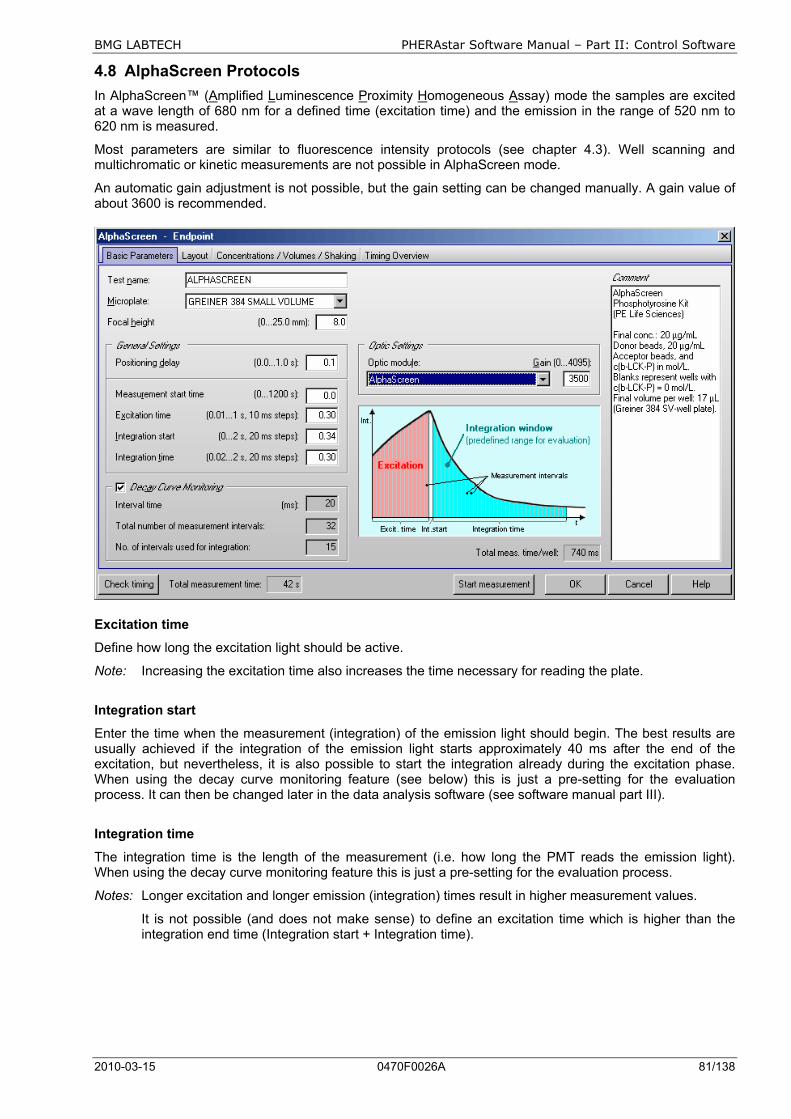
BMG LABTECH PHERAstar Software Manual – Part II: Control Software
2010-03-15 0470F0026A 81/138
4.8 AlphaScreen Protocols In AlphaScreen™ (Amplified Luminescence Proximity Homogeneous Assay) mode the samples are excited at a wave length of 680 nm for a defined time (excitation time) and the emission in the range of 520 nm to 620 nm is measured.
Most parameters are similar to fluorescence intensity protocols (see chapter 4.3). Well scanning and multichromatic or kinetic measurements are not possible in AlphaScreen mode.
An automatic gain adjustment is not possible, but the gain setting can be changed manually. A gain value of about 3600 is recommended.
Excitation time
Define how long the excitation light should be active.
Note: Increasing the excitation time also increases the time necessary for reading the plate.
Integration start
Enter the time when the measurement (integration) of the emission light should begin. The best results are usually achieved if the integration of the emission light starts approximately 40 ms after the end of the excitation, but nevertheless, it is also possible to start the integration already during the excitation phase. When using the decay curve monitoring feature (see below) this is just a pre-setting for the evaluation process. It can then be changed later in the data analysis software (see software manual part III).
Integration time
The integration time is the length of the measurement (i.e. how long the PMT reads the emission light). When using the decay curve monitoring feature this is just a pre-setting for the evaluation process.
Notes: Longer excitation and longer emission (integration) times result in higher measurement values.
It is not possible (and does not make sense) to define an excitation time which is higher than the integration end time (Integration start + Integration time).
PHERAstar Software Manual – Part II: Control Software BMG LABTECH
82/138 0470F0026A 2010-03-15
Decay Curve Monitoring
If decay curve monitoring is not used, the emission light over the whole integration time will be integrated and one measurement value per well is calculated.
If decay curve monitoring is activated, measurement data is collected every 20 ms during the whole excitation and emission period until the end of the defined integration window. This allows displaying the complete (excitation and) decay curve.
The necessary additional parameters for this mode are calculated automatically, whereas the measurement interval time is fixed (20 ms). The decay curve monitoring box shows how many intervals are measured in total and how many intervals will be used for the integration of the emission light based on the defined integration start and time values. For detailed analysis, it is possible to change the width and the position of the integration window in the data analysis software (see software manual part III).
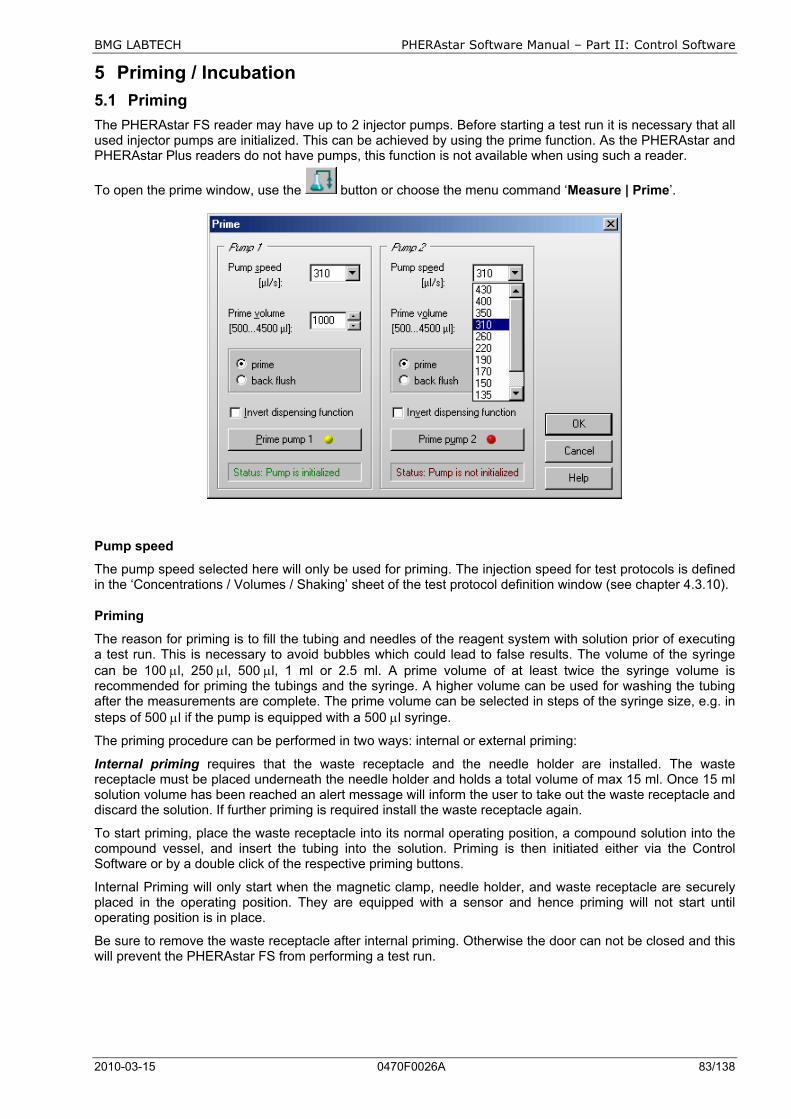
BMG LABTECH PHERAstar Software Manual – Part II: Control Software
2010-03-15 0470F0026A 83/138
5 Priming / Incubation 5.1 Priming The PHERAstar FS reader may have up to 2 injector pumps. Before starting a test run it is necessary that all used injector pumps are initialized. This can be achieved by using the prime function. As the PHERAstar and PHERAstar Plus readers do not have pumps, this function is not available when using such a reader.
To open the prime window, use the button or choose the menu command ‘Measure | Prime’.
Pump speed
The pump speed selected here will only be used for priming. The injection speed for test protocols is defined in the ‘Concentrations / Volumes / Shaking’ sheet of the test protocol definition window (see chapter 4.3.10).
Priming
The reason for priming is to fill the tubing and needles of the reagent system with solution prior of executing a test run. This is necessary to avoid bubbles which could lead to false results. The volume of the syringe can be 100 µl, 250 µl, 500 µl, 1 ml or 2.5 ml. A prime volume of at least twice the syringe volume is recommended for priming the tubings and the syringe. A higher volume can be used for washing the tubing after the measurements are complete. The prime volume can be selected in steps of the syringe size, e.g. in steps of 500 µl if the pump is equipped with a 500 µl syringe.
The priming procedure can be performed in two ways: internal or external priming:
Internal priming requires that the waste receptacle and the needle holder are installed. The waste receptacle must be placed underneath the needle holder and holds a total volume of max 15 ml. Once 15 ml solution volume has been reached an alert message will inform the user to take out the waste receptacle and discard the solution. If further priming is required install the waste receptacle again.
To start priming, place the waste receptacle into its normal operating position, a compound solution into the compound vessel, and insert the tubing into the solution. Priming is then initiated either via the Control Software or by a double click of the respective priming buttons.
Internal Priming will only start when the magnetic clamp, needle holder, and waste receptacle are securely placed in the operating position. They are equipped with a sensor and hence priming will not start until operating position is in place.
Be sure to remove the waste receptacle after internal priming. Otherwise the door can not be closed and this will prevent the PHERAstar FS from performing a test run.
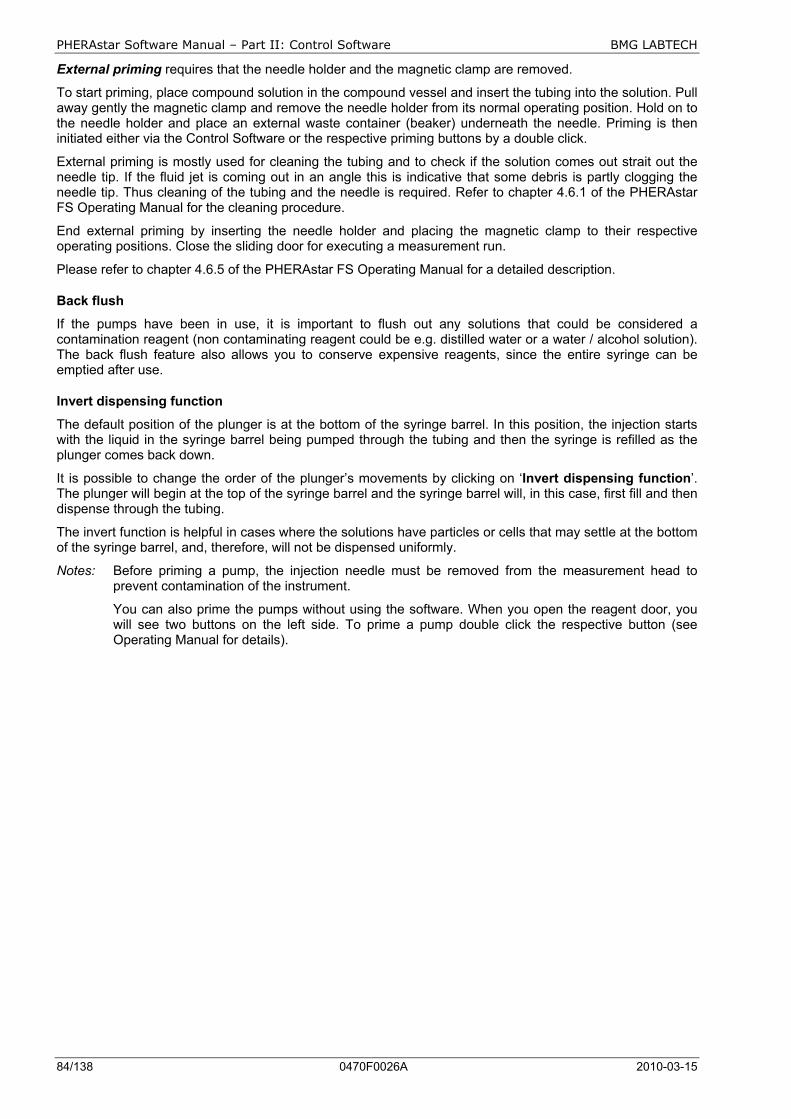
PHERAstar Software Manual – Part II: Control Software BMG LABTECH
84/138 0470F0026A 2010-03-15
External priming requires that the needle holder and the magnetic clamp are removed.
To start priming, place compound solution in the compound vessel and insert the tubing into the solution. Pull away gently the magnetic clamp and remove the needle holder from its normal operating position. Hold on to the needle holder and place an external waste container (beaker) underneath the needle. Priming is then initiated either via the Control Software or the respective priming buttons by a double click.
External priming is mostly used for cleaning the tubing and to check if the solution comes out strait out the needle tip. If the fluid jet is coming out in an angle this is indicative that some debris is partly clogging the needle tip. Thus cleaning of the tubing and the needle is required. Refer to chapter 4.6.1 of the PHERAstar FS Operating Manual for the cleaning procedure.
End external priming by inserting the needle holder and placing the magnetic clamp to their respective operating positions. Close the sliding door for executing a measurement run.
Please refer to chapter 4.6.5 of the PHERAstar FS Operating Manual for a detailed description.
Back flush
If the pumps have been in use, it is important to flush out any solutions that could be considered a contamination reagent (non contaminating reagent could be e.g. distilled water or a water / alcohol solution). The back flush feature also allows you to conserve expensive reagents, since the entire syringe can be emptied after use.
Invert dispensing function
The default position of the plunger is at the bottom of the syringe barrel. In this position, the injection starts with the liquid in the syringe barrel being pumped through the tubing and then the syringe is refilled as the plunger comes back down.
It is possible to change the order of the plunger’s movements by clicking on ‘Invert dispensing function’. The plunger will begin at the top of the syringe barrel and the syringe barrel will, in this case, first fill and then dispense through the tubing.
The invert function is helpful in cases where the solutions have particles or cells that may settle at the bottom of the syringe barrel, and, therefore, will not be dispensed uniformly.
Notes: Before priming a pump, the injection needle must be removed from the measurement head to prevent contamination of the instrument.
You can also prime the pumps without using the software. When you open the reagent door, you will see two buttons on the left side. To prime a pump double click the respective button (see Operating Manual for details).
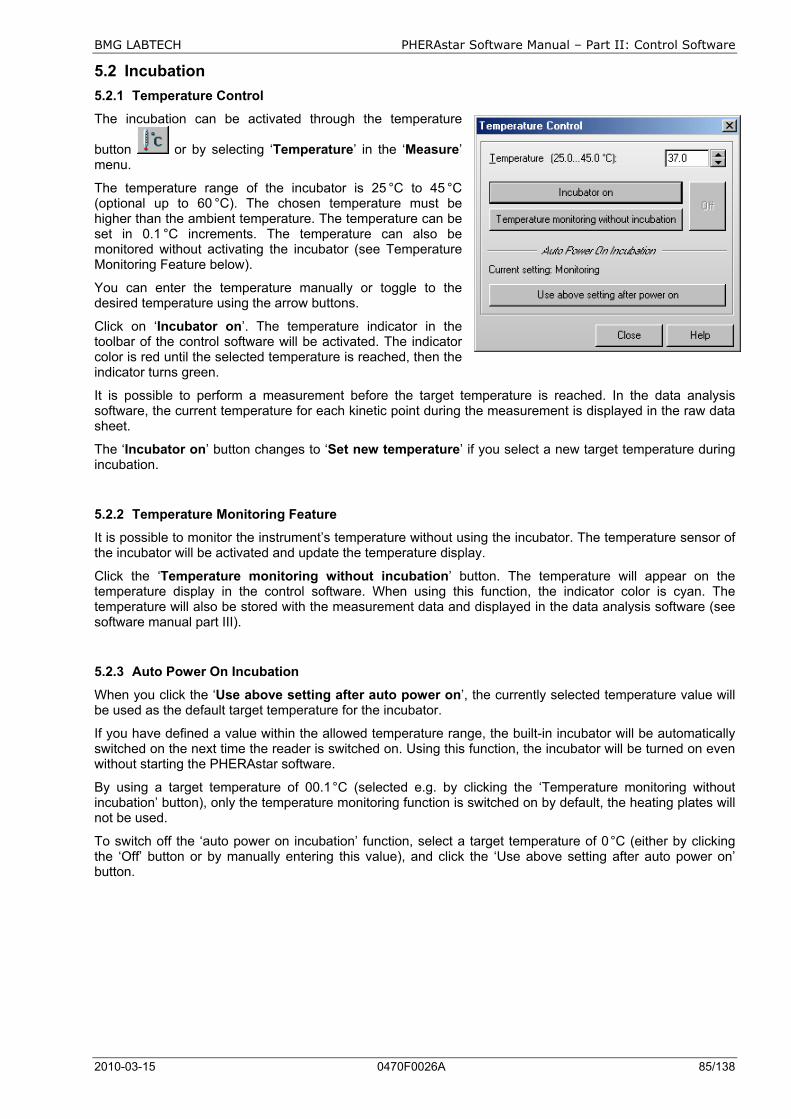
BMG LABTECH PHERAstar Software Manual – Part II: Control Software
2010-03-15 0470F0026A 85/138
5.2 Incubation 5.2.1 Temperature Control
The incubation can be activated through the temperature
button or by selecting ‘Temperature’ in the ‘Measure’ menu.
The temperature range of the incubator is 25 °C to 45 °C (optional up to 60 °C). The chosen temperature must be higher than the ambient temperature. The temperature can be set in 0.1 °C increments. The temperature can also be monitored without activating the incubator (see Temperature Monitoring Feature below).
You can enter the temperature manually or toggle to the desired temperature using the arrow buttons.
Click on ‘Incubator on’. The temperature indicator in the toolbar of the control software will be activated. The indicator color is red until the selected temperature is reached, then the indicator turns green.
It is possible to perform a measurement before the target temperature is reached. In the data analysis software, the current temperature for each kinetic point during the measurement is displayed in the raw data sheet.
The ‘Incubator on’ button changes to ‘Set new temperature’ if you select a new target temperature during incubation.
5.2.2 Temperature Monitoring Feature
It is possible to monitor the instrument’s temperature without using the incubator. The temperature sensor of the incubator will be activated and update the temperature display.
Click the ‘Temperature monitoring without incubation’ button. The temperature will appear on the temperature display in the control software. When using this function, the indicator color is cyan. The temperature will also be stored with the measurement data and displayed in the data analysis software (see software manual part III).
5.2.3 Auto Power On Incubation
When you click the ‘Use above setting after auto power on’, the currently selected temperature value will be used as the default target temperature for the incubator.
If you have defined a value within the allowed temperature range, the built-in incubator will be automatically switched on the next time the reader is switched on. Using this function, the incubator will be turned on even without starting the PHERAstar software.
By using a target temperature of 00.1 °C (selected e.g. by clicking the ‘Temperature monitoring without incubation’ button), only the temperature monitoring function is switched on by default, the heating plates will not be used.
To switch off the ‘auto power on incubation’ function, select a target temperature of 0 °C (either by clicking the ‘Off’ button or by manually entering this value), and click the ‘Use above setting after auto power on’ button.
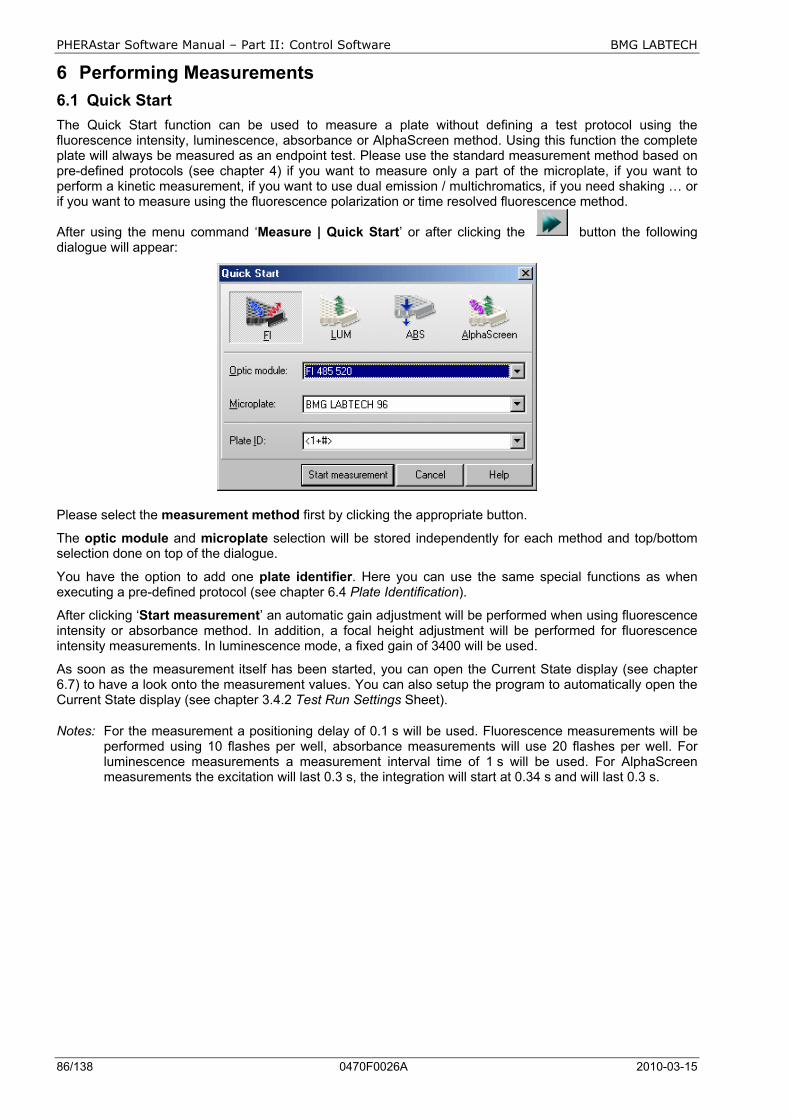
PHERAstar Software Manual – Part II: Control Software BMG LABTECH
86/138 0470F0026A 2010-03-15
6 Performing Measurements 6.1 Quick Start The Quick Start function can be used to measure a plate without defining a test protocol using the fluorescence intensity, luminescence, absorbance or AlphaScreen method. Using this function the complete plate will always be measured as an endpoint test. Please use the standard measurement method based on pre-defined protocols (see chapter 4) if you want to measure only a part of the microplate, if you want to perform a kinetic measurement, if you want to use dual emission / multichromatics, if you need shaking … or if you want to measure using the fluorescence polarization or time resolved fluorescence method.
After using the menu command ‘Measure | Quick Start’ or after clicking the button the following dialogue will appear:
Please select the measurement method first by clicking the appropriate button.
The optic module and microplate selection will be stored independently for each method and top/bottom selection done on top of the dialogue.
You have the option to add one plate identifier. Here you can use the same special functions as when executing a pre-defined protocol (see chapter 6.4 Plate Identification).
After clicking ‘Start measurement’ an automatic gain adjustment will be performed when using fluorescence intensity or absorbance method. In addition, a focal height adjustment will be performed for fluorescence intensity measurements. In luminescence mode, a fixed gain of 3400 will be used.
As soon as the measurement itself has been started, you can open the Current State display (see chapter 6.7) to have a look onto the measurement values. You can also setup the program to automatically open the Current State display (see chapter 3.4.2 Test Run Settings Sheet).
Notes: For the measurement a positioning delay of 0.1 s will be used. Fluorescence measurements will be performed using 10 flashes per well, absorbance measurements will use 20 flashes per well. For luminescence measurements a measurement interval time of 1 s will be used. For AlphaScreen measurements the excitation will last 0.3 s, the integration will start at 0.34 s and will last 0.3 s.
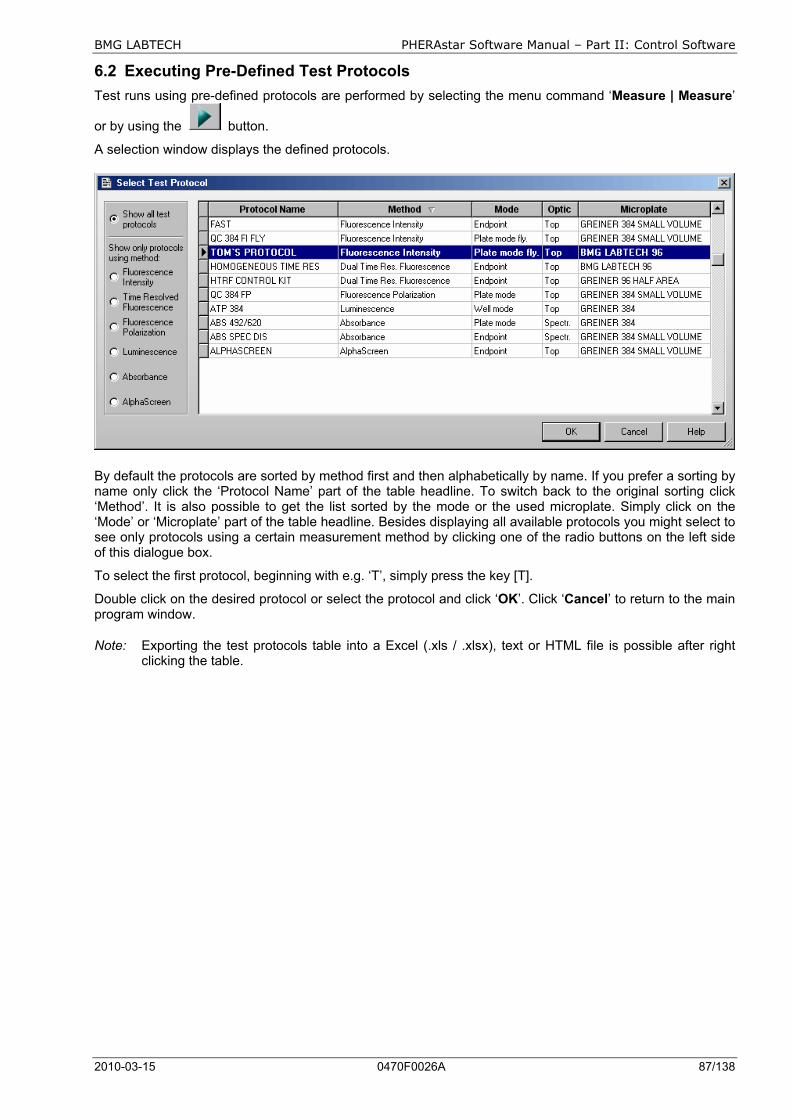
BMG LABTECH PHERAstar Software Manual – Part II: Control Software
2010-03-15 0470F0026A 87/138
6.2 Executing Pre-Defined Test Protocols Test runs using pre-defined protocols are performed by selecting the menu command ‘Measure | Measure’
or by using the button.
A selection window displays the defined protocols.
By default the protocols are sorted by method first and then alphabetically by name. If you prefer a sorting by name only click the ‘Protocol Name’ part of the table headline. To switch back to the original sorting click ‘Method’. It is also possible to get the list sorted by the mode or the used microplate. Simply click on the ‘Mode’ or ‘Microplate’ part of the table headline. Besides displaying all available protocols you might select to see only protocols using a certain measurement method by clicking one of the radio buttons on the left side of this dialogue box.
To select the first protocol, beginning with e.g. ‘T’, simply press the key [T].
Double click on the desired protocol or select the protocol and click ‘OK’. Click ‘Cancel’ to return to the main program window.
Note: Exporting the test protocols table into a Excel (.xls / .xlsx), text or HTML file is possible after right clicking the table.
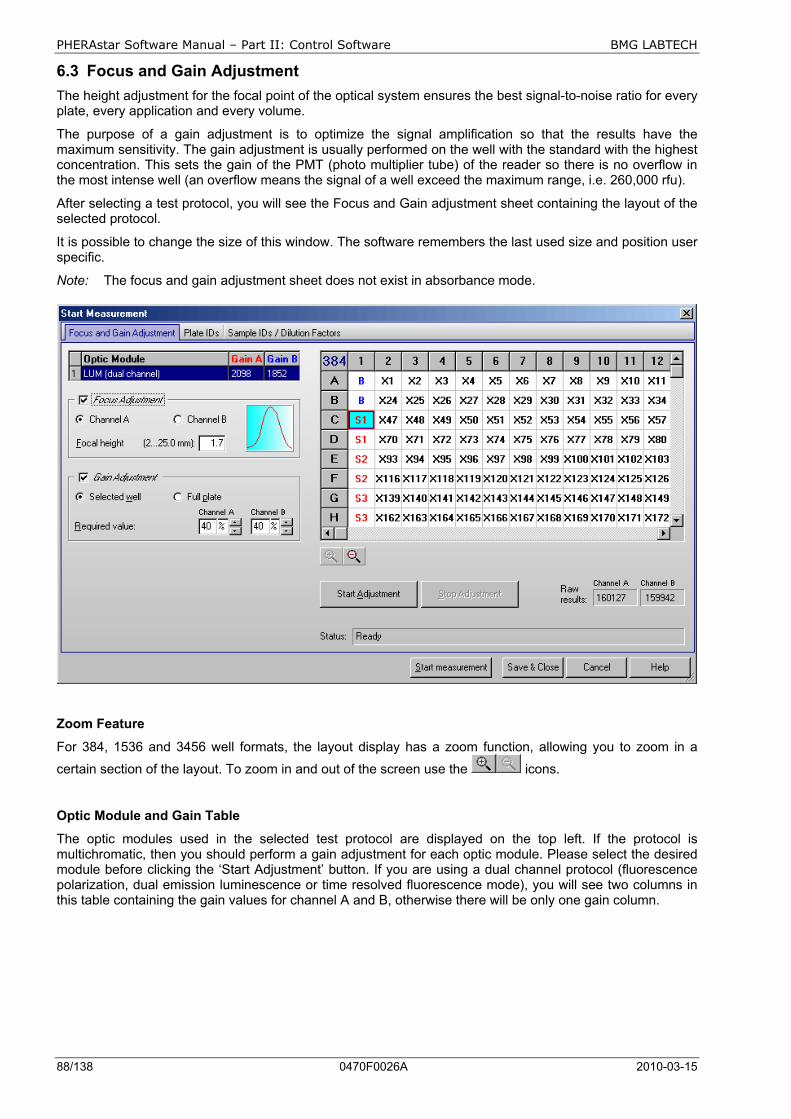
PHERAstar Software Manual – Part II: Control Software BMG LABTECH
88/138 0470F0026A 2010-03-15
6.3 Focus and Gain Adjustment The height adjustment for the focal point of the optical system ensures the best signal-to-noise ratio for every plate, every application and every volume.
The purpose of a gain adjustment is to optimize the signal amplification so that the results have the maximum sensitivity. The gain adjustment is usually performed on the well with the standard with the highest concentration. This sets the gain of the PMT (photo multiplier tube) of the reader so there is no overflow in the most intense well (an overflow means the signal of a well exceed the maximum range, i.e. 260,000 rfu).
After selecting a test protocol, you will see the Focus and Gain adjustment sheet containing the layout of the selected protocol.
It is possible to change the size of this window. The software remembers the last used size and position user specific.
Note: The focus and gain adjustment sheet does not exist in absorbance mode.
Zoom Feature
For 384, 1536 and 3456 well formats, the layout display has a zoom function, allowing you to zoom in a
certain section of the layout. To zoom in and out of the screen use the icons.
Optic Module and Gain Table
The optic modules used in the selected test protocol are displayed on the top left. If the protocol is multichromatic, then you should perform a gain adjustment for each optic module. Please select the desired module before clicking the ‘Start Adjustment’ button. If you are using a dual channel protocol (fluorescence polarization, dual emission luminescence or time resolved fluorescence mode), you will see two columns in this table containing the gain values for channel A and B, otherwise there will be only one gain column.
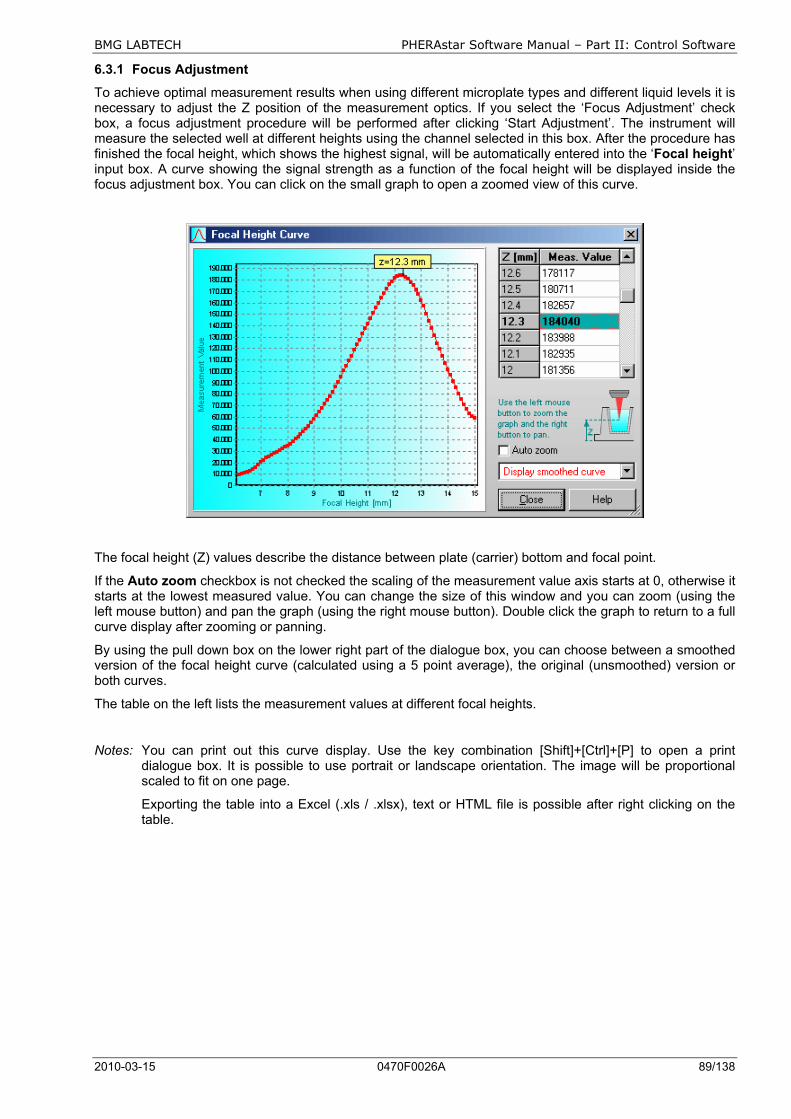
BMG LABTECH PHERAstar Software Manual – Part II: Control Software
2010-03-15 0470F0026A 89/138
6.3.1 Focus Adjustment
To achieve optimal measurement results when using different microplate types and different liquid levels it is necessary to adjust the Z position of the measurement optics. If you select the ‘Focus Adjustment’ check box, a focus adjustment procedure will be performed after clicking ‘Start Adjustment’. The instrument will measure the selected well at different heights using the channel selected in this box. After the procedure has finished the focal height, which shows the highest signal, will be automatically entered into the ‘Focal height’ input box. A curve showing the signal strength as a function of the focal height will be displayed inside the focus adjustment box. You can click on the small graph to open a zoomed view of this curve.
The focal height (Z) values describe the distance between plate (carrier) bottom and focal point.
If the Auto zoom checkbox is not checked the scaling of the measurement value axis starts at 0, otherwise it starts at the lowest measured value. You can change the size of this window and you can zoom (using the left mouse button) and pan the graph (using the right mouse button). Double click the graph to return to a full curve display after zooming or panning.
By using the pull down box on the lower right part of the dialogue box, you can choose between a smoothed version of the focal height curve (calculated using a 5 point average), the original (unsmoothed) version or both curves.
The table on the left lists the measurement values at different focal heights.
Notes: You can print out this curve display. Use the key combination [Shift]+[Ctrl]+[P] to open a print dialogue box. It is possible to use portrait or landscape orientation. The image will be proportional scaled to fit on one page.
Exporting the table into a Excel (.xls / .xlsx), text or HTML file is possible after right clicking on the table.
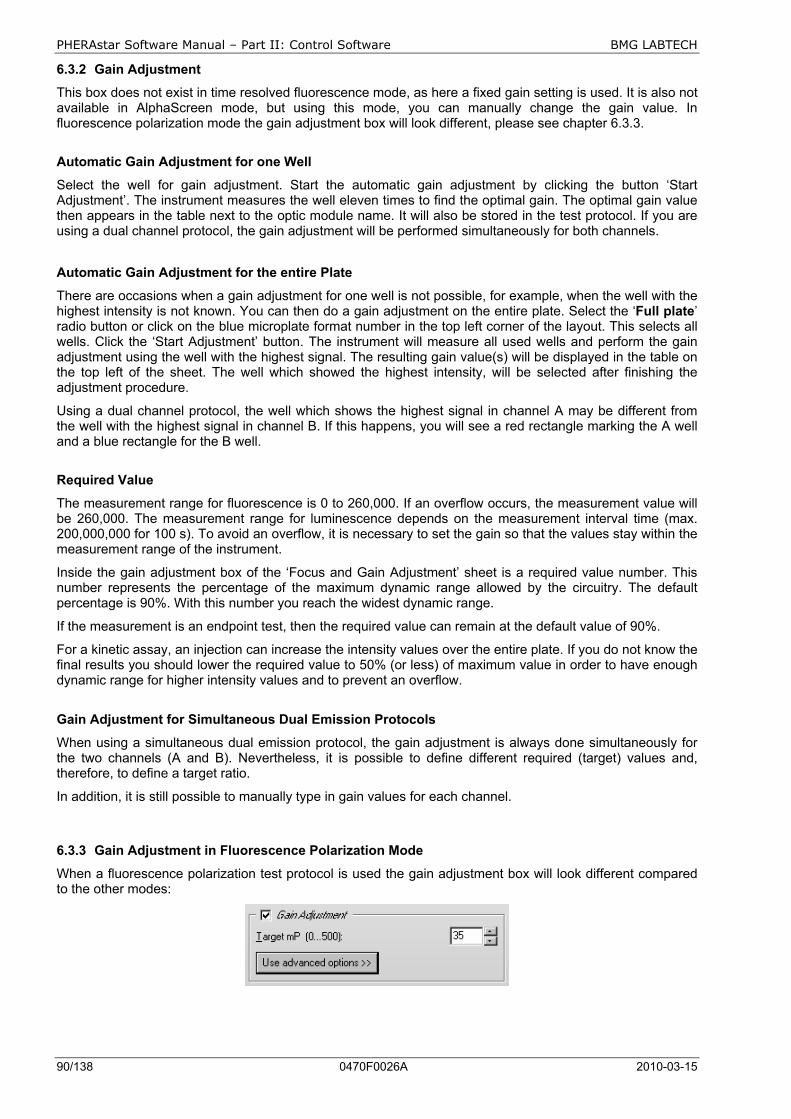
PHERAstar Software Manual – Part II: Control Software BMG LABTECH
90/138 0470F0026A 2010-03-15
6.3.2 Gain Adjustment
This box does not exist in time resolved fluorescence mode, as here a fixed gain setting is used. It is also not available in AlphaScreen mode, but using this mode, you can manually change the gain value. In fluorescence polarization mode the gain adjustment box will look different, please see chapter 6.3.3.
Automatic Gain Adjustment for one Well
Select the well for gain adjustment. Start the automatic gain adjustment by clicking the button ‘Start Adjustment’. The instrument measures the well eleven times to find the optimal gain. The optimal gain value then appears in the table next to the optic module name. It will also be stored in the test protocol. If you are using a dual channel protocol, the gain adjustment will be performed simultaneously for both channels.
Automatic Gain Adjustment for the entire Plate
There are occasions when a gain adjustment for one well is not possible, for example, when the well with the highest intensity is not known. You can then do a gain adjustment on the entire plate. Select the ‘Full plate’ radio button or click on the blue microplate format number in the top left corner of the layout. This selects all wells. Click the ‘Start Adjustment’ button. The instrument will measure all used wells and perform the gain adjustment using the well with the highest signal. The resulting gain value(s) will be displayed in the table on the top left of the sheet. The well which showed the highest intensity, will be selected after finishing the adjustment procedure.
Using a dual channel protocol, the well which shows the highest signal in channel A may be different from the well with the highest signal in channel B. If this happens, you will see a red rectangle marking the A well and a blue rectangle for the B well.
Required Value
The measurement range for fluorescence is 0 to 260,000. If an overflow occurs, the measurement value will be 260,000. The measurement range for luminescence depends on the measurement interval time (max. 200,000,000 for 100 s). To avoid an overflow, it is necessary to set the gain so that the values stay within the measurement range of the instrument.
Inside the gain adjustment box of the ‘Focus and Gain Adjustment’ sheet is a required value number. This number represents the percentage of the maximum dynamic range allowed by the circuitry. The default percentage is 90%. With this number you reach the widest dynamic range.
If the measurement is an endpoint test, then the required value can remain at the default value of 90%.
For a kinetic assay, an injection can increase the intensity values over the entire plate. If you do not know the final results you should lower the required value to 50% (or less) of maximum value in order to have enough dynamic range for higher intensity values and to prevent an overflow.
Gain Adjustment for Simultaneous Dual Emission Protocols
When using a simultaneous dual emission protocol, the gain adjustment is always done simultaneously for the two channels (A and B). Nevertheless, it is possible to define different required (target) values and, therefore, to define a target ratio.
In addition, it is still possible to manually type in gain values for each channel.
6.3.3 Gain Adjustment in Fluorescence Polarization Mode
When a fluorescence polarization test protocol is used the gain adjustment box will look different compared to the other modes:
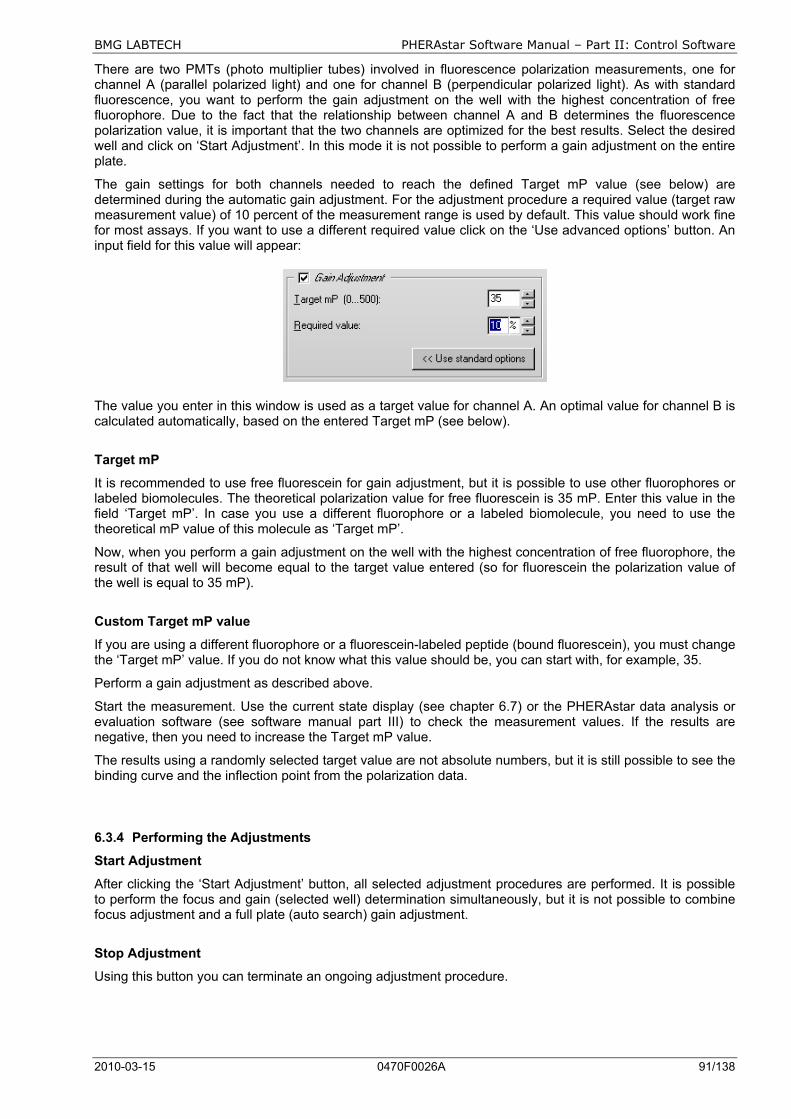
BMG LABTECH PHERAstar Software Manual – Part II: Control Software
2010-03-15 0470F0026A 91/138
There are two PMTs (photo multiplier tubes) involved in fluorescence polarization measurements, one for channel A (parallel polarized light) and one for channel B (perpendicular polarized light). As with standard fluorescence, you want to perform the gain adjustment on the well with the highest concentration of free fluorophore. Due to the fact that the relationship between channel A and B determines the fluorescence polarization value, it is important that the two channels are optimized for the best results. Select the desired well and click on ‘Start Adjustment’. In this mode it is not possible to perform a gain adjustment on the entire plate.
The gain settings for both channels needed to reach the defined Target mP value (see below) are determined during the automatic gain adjustment. For the adjustment procedure a required value (target raw measurement value) of 10 percent of the measurement range is used by default. This value should work fine for most assays. If you want to use a different required value click on the ‘Use advanced options’ button. An input field for this value will appear:
The value you enter in this window is used as a target value for channel A. An optimal value for channel B is calculated automatically, based on the entered Target mP (see below).
Target mP
It is recommended to use free fluorescein for gain adjustment, but it is possible to use other fluorophores or labeled biomolecules. The theoretical polarization value for free fluorescein is 35 mP. Enter this value in the field ‘Target mP’. In case you use a different fluorophore or a labeled biomolecule, you need to use the theoretical mP value of this molecule as ‘Target mP’.
Now, when you perform a gain adjustment on the well with the highest concentration of free fluorophore, the result of that well will become equal to the target value entered (so for fluorescein the polarization value of the well is equal to 35 mP).
Custom Target mP value
If you are using a different fluorophore or a fluorescein-labeled peptide (bound fluorescein), you must change the ‘Target mP’ value. If you do not know what this value should be, you can start with, for example, 35.
Perform a gain adjustment as described above.
Start the measurement. Use the current state display (see chapter 6.7) or the PHERAstar data analysis or evaluation software (see software manual part III) to check the measurement values. If the results are negative, then you need to increase the Target mP value.
The results using a randomly selected target value are not absolute numbers, but it is still possible to see the binding curve and the inflection point from the polarization data.
6.3.4 Performing the Adjustments
Start Adjustment
After clicking the ‘Start Adjustment’ button, all selected adjustment procedures are performed. It is possible to perform the focus and gain (selected well) determination simultaneously, but it is not possible to combine focus adjustment and a full plate (auto search) gain adjustment.
Stop Adjustment
Using this button you can terminate an ongoing adjustment procedure.

PHERAstar Software Manual – Part II: Control Software BMG LABTECH
92/138 0470F0026A 2010-03-15
6.4 Plate Identification Using the second sheet you can assign specific identifying features to the plate such as a title, a description, or the barcode from the microplate. Three identifiers with up to 100 alphanumeric characters are possible.
The drop down menu for each identifier allows you to choose several options for the IDs or you can manually type in a description.
ID Options
<barcode_left>, <barcode_front>, <barcode_right> Barcode attached to the left / front / right side of the current plate (this option will use the internal barcode readers of the PHERAstar FS and is, therefore, only available when using a PHERAstar FS).
<barcode> Barcode of the current plate (only available if the reader is directly connected to a stacker equipped with a barcode reader and only available for measurements using the stacker, not for single plate measurements without stacker magazine 1 inserted).
<protocol> The name of the used test protocol will be entered.
<method> Name of the used method, e.g. 'Fluorescence Intensity' or 'AlphaScreen'.
<1+#> Consecutive numbers for each test run (with the same test name) will be automatically entered. You can manually change the start number in the space ‘Number of executed runs since program start.’ The number of digits to be used can be changed by adding ‘#’ characters, i.e. using <1+###> 001, 002, 003, etc. will be generated.
If you want a number to be changed only after e.g. every tenths plate you should add this value in parenthesis before the > character, e.g. <1+###(10)>.
In batch mode (using a stacker connected directly to the reader) or in script mode (see chapter 7) you can add a ‘B’ before the ‘#’ to get the plate numbers of the current batch run, e.g. <1+B####>.
To use the ‘Total number of executed runs’ instead of the number of executed runs after program start, add a ‘T’ before the ‘#’, e.g. <1+T####>.
To use the ‘No. of executed runs for the used test protocol’, add a ‘P’ before the ‘#’, e.g. <1+P##>. You can see a Run Statistics after pressing the button (see section 3.5.4).
Counting down is also possible, use a ‘-’ instead of the ‘+’.
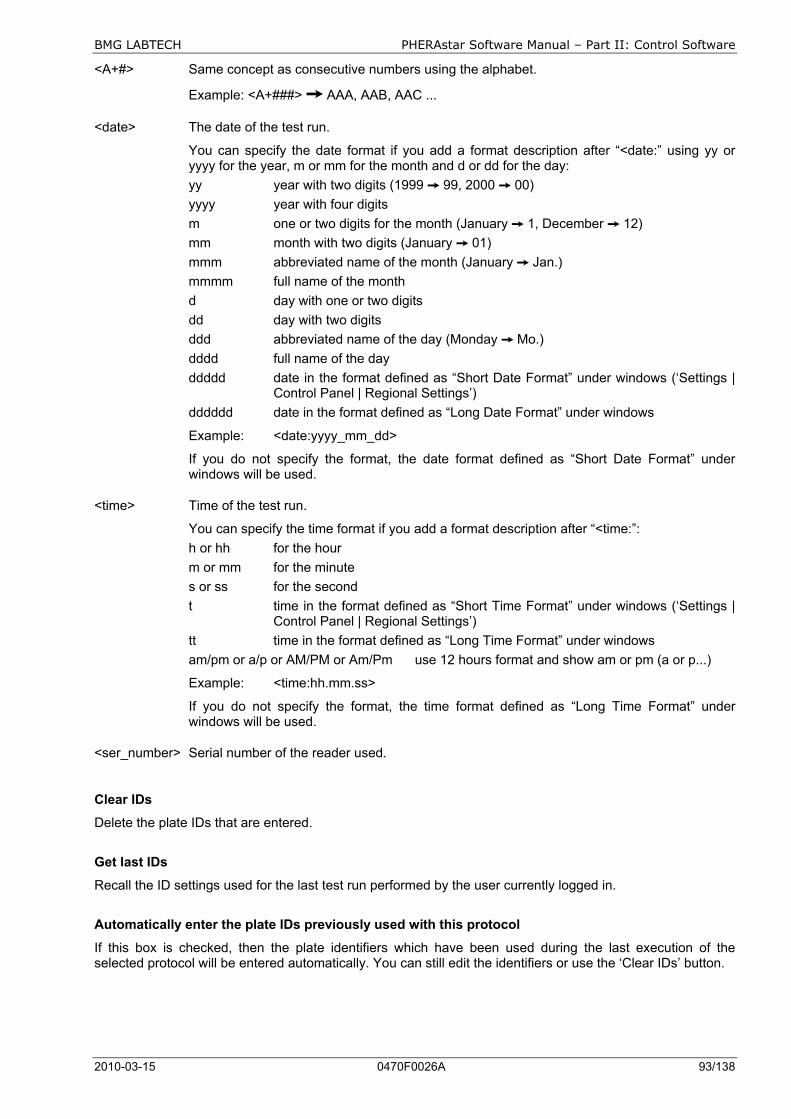
BMG LABTECH PHERAstar Software Manual – Part II: Control Software
2010-03-15 0470F0026A 93/138
<A+#> Same concept as consecutive numbers using the alphabet.
Example: <A+###> AAA, AAB, AAC ...
<date> The date of the test run.
You can specify the date format if you add a format description after “<date:” using yy or yyyy for the year, m or mm for the month and d or dd for the day:
yy year with two digits (1999 99, 2000 00) yyyy year with four digits m one or two digits for the month (January 1, December 12) mm month with two digits (January 01) mmm abbreviated name of the month (January Jan.) mmmm full name of the month d day with one or two digits dd day with two digits ddd abbreviated name of the day (Monday Mo.) dddd full name of the day ddddd date in the format defined as “Short Date Format” under windows (‘Settings |
Control Panel | Regional Settings’) dddddd date in the format defined as “Long Date Format” under windows
Example: <date:yyyy_mm_dd>
If you do not specify the format, the date format defined as “Short Date Format” under windows will be used.
<time> Time of the test run.
You can specify the time format if you add a format description after “<time:”: h or hh for the hour m or mm for the minute s or ss for the second t time in the format defined as “Short Time Format” under windows (‘Settings |
Control Panel | Regional Settings’) tt time in the format defined as “Long Time Format” under windows am/pm or a/p or AM/PM or Am/Pm use 12 hours format and show am or pm (a or p...)
Example: <time:hh.mm.ss>
If you do not specify the format, the time format defined as “Long Time Format” under windows will be used.
<ser_number> Serial number of the reader used.
Clear IDs
Delete the plate IDs that are entered.
Get last IDs
Recall the ID settings used for the last test run performed by the user currently logged in.
Automatically enter the plate IDs previously used with this protocol
If this box is checked, then the plate identifiers which have been used during the last execution of the selected protocol will be entered automatically. You can still edit the identifiers or use the ‘Clear IDs’ button.

PHERAstar Software Manual – Part II: Control Software BMG LABTECH
94/138 0470F0026A 2010-03-15
6.4.1 Barcode List
The barcode list window shows all the barcode values read so far. To open the barcode list window, use the command ‘Measure | Barcode List’. This function is only enabled if the instrument is equipped with internal barcode readers (PHERAstar FS) or if the reader is directly connected to a stacker equipped with a barcode reader and at least one barcode has been read.
You can edit the barcode list. It is possible to save the barcode list as a pure text file or to print out the list.
When using the internal barcode readers of the PHERAstar FS each line will contain three entries: the barcodes from the left, front and right side of a plate. If a barcode reader has not been used the corresponding entry will contain -. If a barcode could not be read it will contain <no barcode detected>.
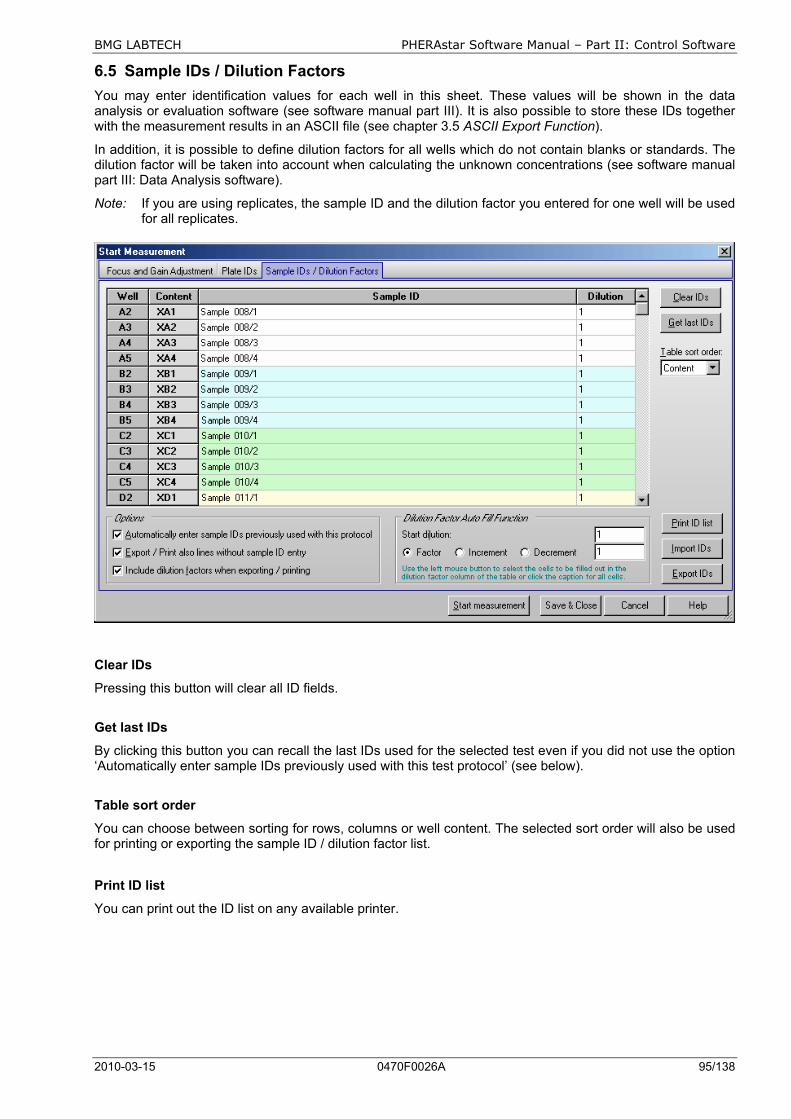
BMG LABTECH PHERAstar Software Manual – Part II: Control Software
2010-03-15 0470F0026A 95/138
6.5 Sample IDs / Dilution Factors You may enter identification values for each well in this sheet. These values will be shown in the data analysis or evaluation software (see software manual part III). It is also possible to store these IDs together with the measurement results in an ASCII file (see chapter 3.5 ASCII Export Function).
In addition, it is possible to define dilution factors for all wells which do not contain blanks or standards. The dilution factor will be taken into account when calculating the unknown concentrations (see software manual part III: Data Analysis software).
Note: If you are using replicates, the sample ID and the dilution factor you entered for one well will be used for all replicates.
Clear IDs
Pressing this button will clear all ID fields.
Get last IDs
By clicking this button you can recall the last IDs used for the selected test even if you did not use the option ‘Automatically enter sample IDs previously used with this test protocol’ (see below).
Table sort order
You can choose between sorting for rows, columns or well content. The selected sort order will also be used for printing or exporting the sample ID / dilution factor list.
Print ID list
You can print out the ID list on any available printer.
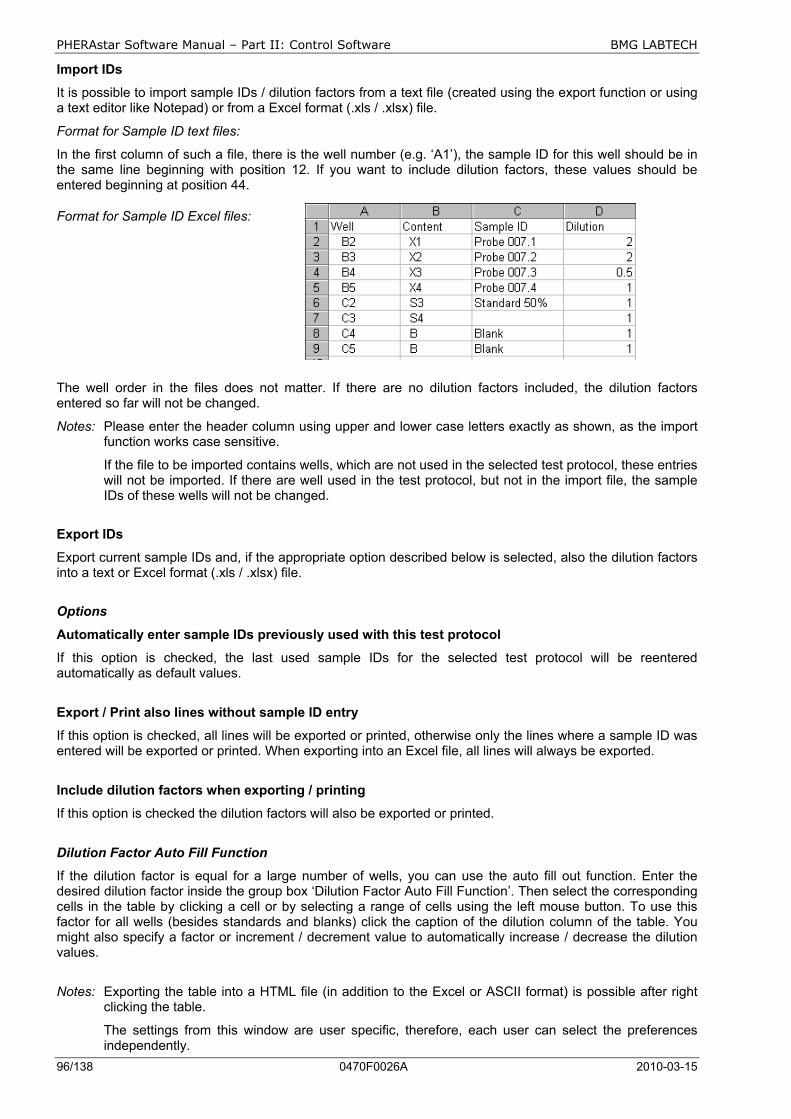
PHERAstar Software Manual – Part II: Control Software BMG LABTECH
96/138 0470F0026A 2010-03-15
Import IDs
It is possible to import sample IDs / dilution factors from a text file (created using the export function or using a text editor like Notepad) or from a Excel format (.xls / .xlsx) file.
Format for Sample ID text files:
In the first column of such a file, there is the well number (e.g. ‘A1’), the sample ID for this well should be in the same line beginning with position 12. If you want to include dilution factors, these values should be entered beginning at position 44.
Format for Sample ID Excel files:
The well order in the files does not matter. If there are no dilution factors included, the dilution factors entered so far will not be changed.
Notes: Please enter the header column using upper and lower case letters exactly as shown, as the import function works case sensitive.
If the file to be imported contains wells, which are not used in the selected test protocol, these entries will not be imported. If there are well used in the test protocol, but not in the import file, the sample IDs of these wells will not be changed.
Export IDs
Export current sample IDs and, if the appropriate option described below is selected, also the dilution factors into a text or Excel format (.xls / .xlsx) file.
Options
Automatically enter sample IDs previously used with this test protocol
If this option is checked, the last used sample IDs for the selected test protocol will be reentered automatically as default values.
Export / Print also lines without sample ID entry
If this option is checked, all lines will be exported or printed, otherwise only the lines where a sample ID was entered will be exported or printed. When exporting into an Excel file, all lines will always be exported.
Include dilution factors when exporting / printing
If this option is checked the dilution factors will also be exported or printed.
Dilution Factor Auto Fill Function
If the dilution factor is equal for a large number of wells, you can use the auto fill out function. Enter the desired dilution factor inside the group box ‘Dilution Factor Auto Fill Function’. Then select the corresponding cells in the table by clicking a cell or by selecting a range of cells using the left mouse button. To use this factor for all wells (besides standards and blanks) click the caption of the dilution column of the table. You might also specify a factor or increment / decrement value to automatically increase / decrease the dilution values.
Notes: Exporting the table into a HTML file (in addition to the Excel or ASCII format) is possible after right clicking the table.
The settings from this window are user specific, therefore, each user can select the preferences independently.
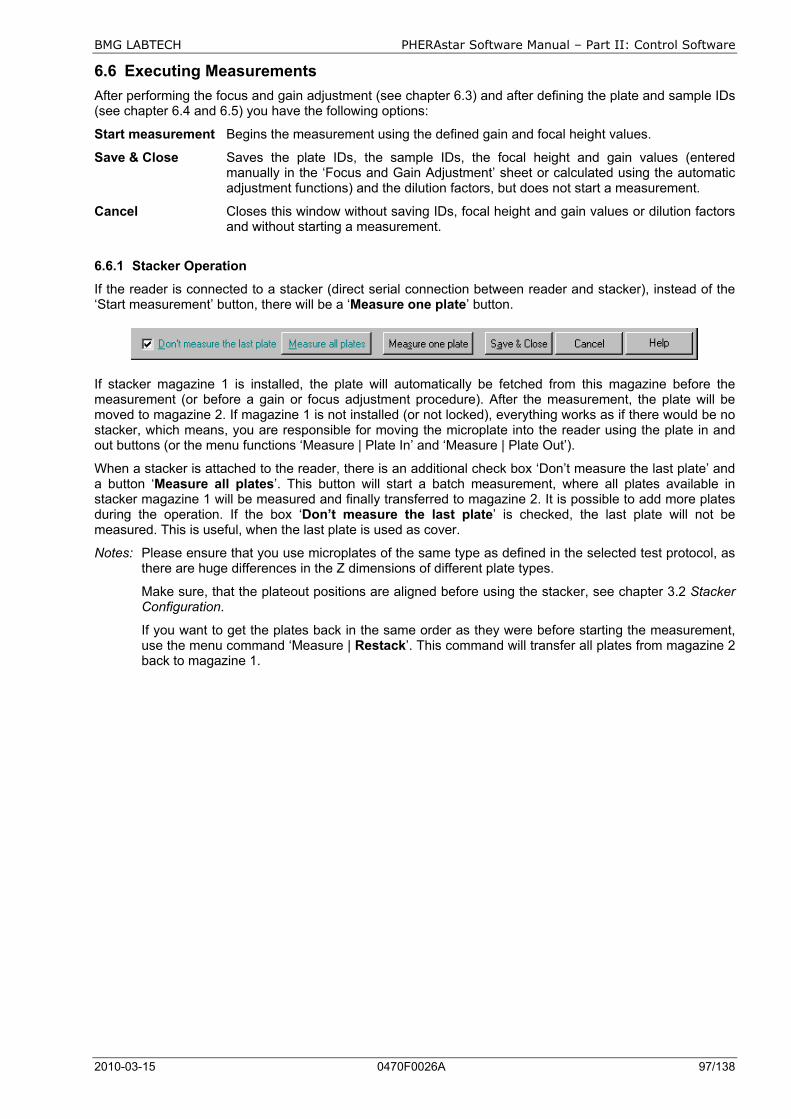
BMG LABTECH PHERAstar Software Manual – Part II: Control Software
2010-03-15 0470F0026A 97/138
6.6 Executing Measurements After performing the focus and gain adjustment (see chapter 6.3) and after defining the plate and sample IDs (see chapter 6.4 and 6.5) you have the following options:
Start measurement Begins the measurement using the defined gain and focal height values.
Save & Close Saves the plate IDs, the sample IDs, the focal height and gain values (entered manually in the ‘Focus and Gain Adjustment’ sheet or calculated using the automatic adjustment functions) and the dilution factors, but does not start a measurement.
Cancel Closes this window without saving IDs, focal height and gain values or dilution factors and without starting a measurement.
6.6.1 Stacker Operation
If the reader is connected to a stacker (direct serial connection between reader and stacker), instead of the ‘Start measurement’ button, there will be a ‘Measure one plate’ button.
If stacker magazine 1 is installed, the plate will automatically be fetched from this magazine before the measurement (or before a gain or focus adjustment procedure). After the measurement, the plate will be moved to magazine 2. If magazine 1 is not installed (or not locked), everything works as if there would be no stacker, which means, you are responsible for moving the microplate into the reader using the plate in and out buttons (or the menu functions ‘Measure | Plate In’ and ‘Measure | Plate Out’).
When a stacker is attached to the reader, there is an additional check box ‘Don’t measure the last plate’ and a button ‘Measure all plates’. This button will start a batch measurement, where all plates available in stacker magazine 1 will be measured and finally transferred to magazine 2. It is possible to add more plates during the operation. If the box ‘Don’t measure the last plate’ is checked, the last plate will not be measured. This is useful, when the last plate is used as cover.
Notes: Please ensure that you use microplates of the same type as defined in the selected test protocol, as there are huge differences in the Z dimensions of different plate types.
Make sure, that the plateout positions are aligned before using the stacker, see chapter 3.2 Stacker Configuration.
If you want to get the plates back in the same order as they were before starting the measurement, use the menu command ‘Measure | Restack’. This command will transfer all plates from magazine 2 back to magazine 1.

PHERAstar Software Manual – Part II: Control Software BMG LABTECH
98/138 0470F0026A 2010-03-15
6.6.2 Test Run Information
On top of the main program window, there is a time gauge indicating the elapsed time of the test. The remaining time will be displayed above the time gauge. It is updated dynamically during the measurement.
If you move the mouse cursor to the time gauge, a small window with additional timing information will appear:
If you perform a plate mode kinetic measurement the quick start button will change into a pause button
. This button has the same function as the menu entry ‘Measure | Pause After Current Cycle’: the active test run will pause after finishing the current cycle and a pause / continue window will appear (see chapter 4.3.1). You can take out the plate for incubating the plate or injecting a compound.
Note: This option is not available when using a stacker or using script mode. Due to technical reasons this pause function is also not available when performing absorbance spectra plate mode measurements.
6.6.3 Stopping the Measurement
It is possible to stop a measurement procedure after it has started by clicking the stop button or by using the menu command ‘Measure | Stop Now’. If there is already measurement data available, a dialogue box appears and you can choose to save the incomplete data.
In batch mode (using a stacker directly connected to the reader) or in script mode (see chapter 7), you can use this function to immediately stop any activity. Depending on the state of the system when you use the stop function, it might be necessary to reinitialize the stacker and the reader (the software will tell you this). If, during this moment, there is a plate inside the reader, a dialogue will appear asking you whether this plate should be moved out to stacker magazine 1 or 2.
In batch mode, there is also an additional menu command ‘Measure | Stop After Current Plate’ available. When you use this command, the measurement of the current plate will be finished and the plate will be moved out to magazine 2 before the batch processing is terminated.
Note: If you use a stacker and want to get the plates back in the same order as they were before starting the measurement, use the menu command ‘Measure | Restack’. This command will transfer all plates from magazine 2 back to magazine 1.
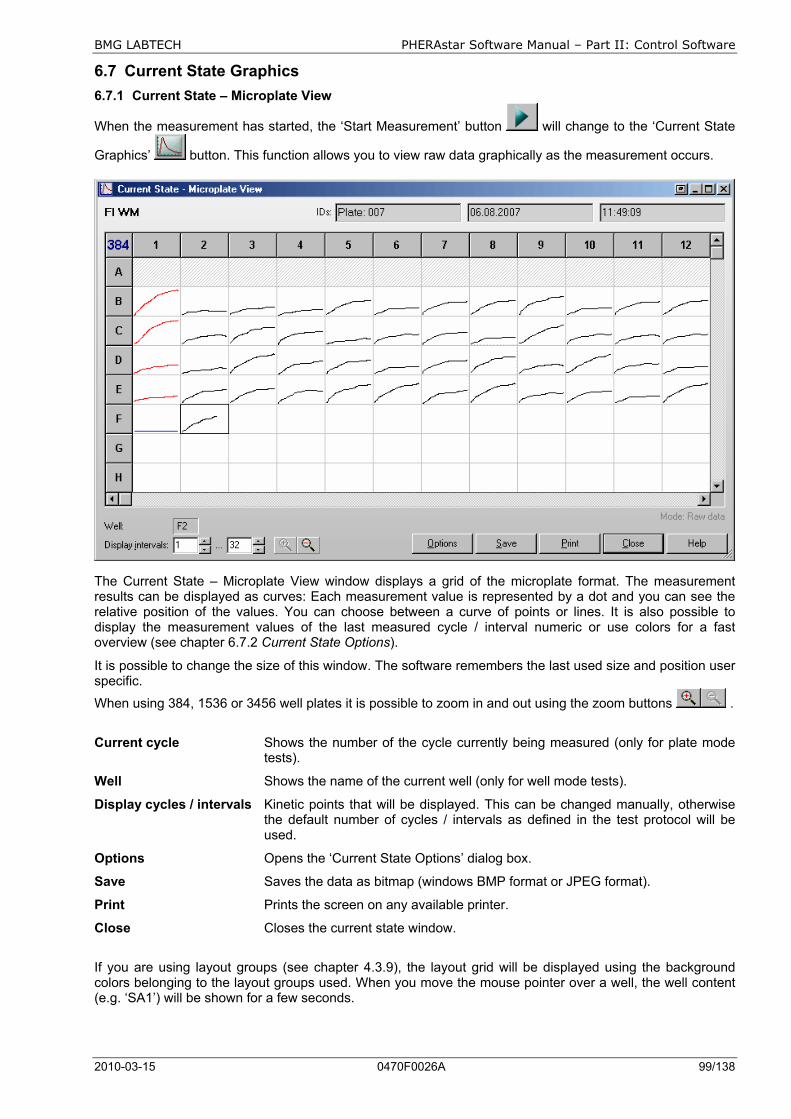
BMG LABTECH PHERAstar Software Manual – Part II: Control Software
2010-03-15 0470F0026A 99/138
6.7 Current State Graphics 6.7.1 Current State – Microplate View
When the measurement has started, the ‘Start Measurement’ button will change to the ‘Current State
Graphics’ button. This function allows you to view raw data graphically as the measurement occurs.
The Current State – Microplate View window displays a grid of the microplate format. The measurement results can be displayed as curves: Each measurement value is represented by a dot and you can see the relative position of the values. You can choose between a curve of points or lines. It is also possible to display the measurement values of the last measured cycle / interval numeric or use colors for a fast overview (see chapter 6.7.2 Current State Options).
It is possible to change the size of this window. The software remembers the last used size and position user specific.
When using 384, 1536 or 3456 well plates it is possible to zoom in and out using the zoom buttons .
Current cycle Shows the number of the cycle currently being measured (only for plate mode tests).
Well Shows the name of the current well (only for well mode tests).
Display cycles / intervals Kinetic points that will be displayed. This can be changed manually, otherwise the default number of cycles / intervals as defined in the test protocol will be used.
Options Opens the ‘Current State Options’ dialog box.
Save Saves the data as bitmap (windows BMP format or JPEG format).
Print Prints the screen on any available printer.
Close Closes the current state window.
If you are using layout groups (see chapter 4.3.9), the layout grid will be displayed using the background colors belonging to the layout groups used. When you move the mouse pointer over a well, the well content (e.g. ‘SA1’) will be shown for a few seconds.
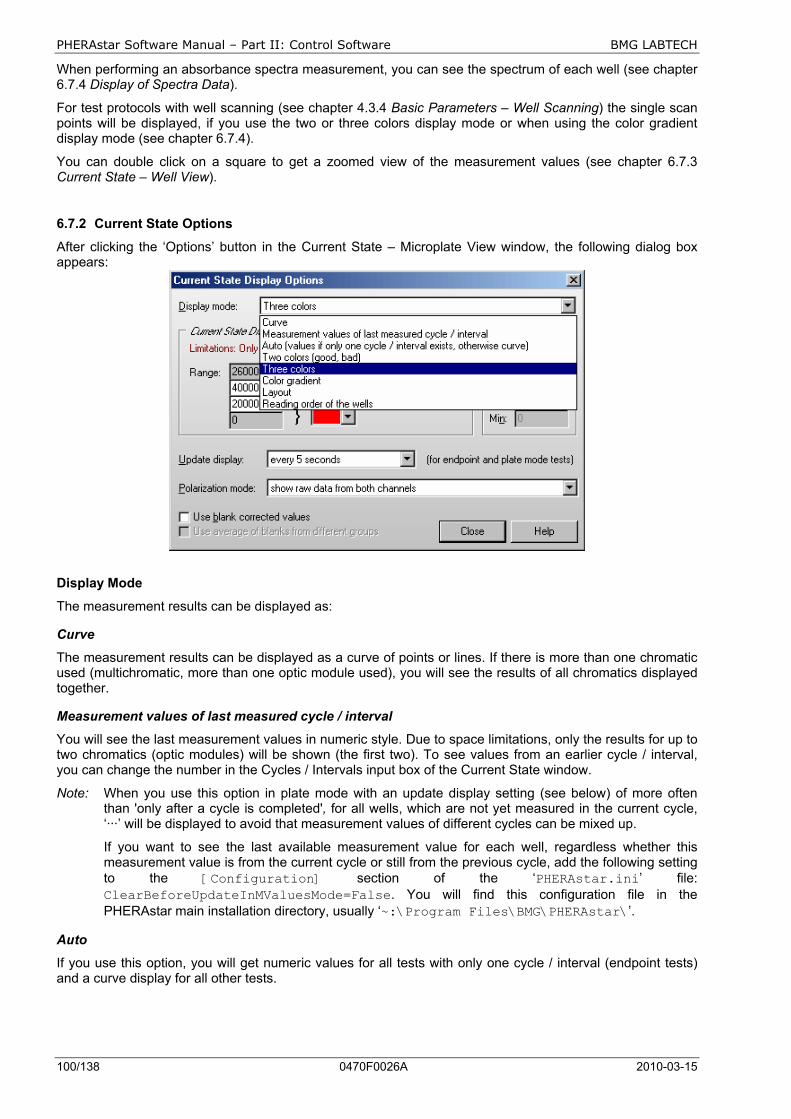
PHERAstar Software Manual – Part II: Control Software BMG LABTECH
100/138 0470F0026A 2010-03-15
When performing an absorbance spectra measurement, you can see the spectrum of each well (see chapter 6.7.4 Display of Spectra Data).
For test protocols with well scanning (see chapter 4.3.4 Basic Parameters – Well Scanning) the single scan points will be displayed, if you use the two or three colors display mode or when using the color gradient display mode (see chapter 6.7.4).
You can double click on a square to get a zoomed view of the measurement values (see chapter 6.7.3 Current State – Well View).
6.7.2 Current State Options
After clicking the ‘Options’ button in the Current State – Microplate View window, the following dialog box appears:
Display Mode
The measurement results can be displayed as:
Curve
The measurement results can be displayed as a curve of points or lines. If there is more than one chromatic used (multichromatic, more than one optic module used), you will see the results of all chromatics displayed together.
Measurement values of last measured cycle / interval
You will see the last measurement values in numeric style. Due to space limitations, only the results for up to two chromatics (optic modules) will be shown (the first two). To see values from an earlier cycle / interval, you can change the number in the Cycles / Intervals input box of the Current State window.
Note: When you use this option in plate mode with an update display setting (see below) of more often than 'only after a cycle is completed', for all wells, which are not yet measured in the current cycle, ‘···’ will be displayed to avoid that measurement values of different cycles can be mixed up.
If you want to see the last available measurement value for each well, regardless whether this measurement value is from the current cycle or still from the previous cycle, add the following setting to the [Configuration] section of the ‘PHERAstar.ini’ file: ClearBeforeUpdateInMValuesMode=False. You will find this configuration file in the PHERAstar main installation directory, usually ‘~:\Program Files\BMG\PHERAstar\’.
Auto
If you use this option, you will get numeric values for all tests with only one cycle / interval (endpoint tests) and a curve display for all other tests.

BMG LABTECH PHERAstar Software Manual – Part II: Control Software
2010-03-15 0470F0026A 101/138
Two colors
If you are only interested in a good / bad decision, you should choose the option to display different colors for all values under a certain limit and for all values above the limit. You can select the two colors and change the limit value. Only the results from one chromatic / channel will be displayed, but if your test uses multichromatics you can decide which chromatic should be used for the current state display.
Three colors
Same concept as ‘Two colors’, but here you can also define a range ‘in-between’ to be displayed in a third color.
Color gradient
The measurement values will be displayed in different shades of colors or gray levels.
You can select a start and an end color. It is also possible to use colors from the rainbow spectrum. If your measurement values use only a part of the total measurement range (i.e. 0...30000), it might be useful to change the start and/or end value to enlarge the used range of the color gradient. Alternatively use the auto scale option. Similar to the Two and Three colors option, it is only possible to display the results from one chromatic / channel.
Note: For this option, it is important to use a graphic mode with more than 256 colors (windows control panel).
Layout
Shows which wells are used for samples, standards and blanks.
Reading order of the wells
Shows in which order the wells are measured.
Curve Display
The settings in this group will be used for the Curve display in the Current State window and for the Current State Zooming window.
Auto scale The limits for the graph will be selected automatically according to the measurement results.

PHERAstar Software Manual – Part II: Control Software BMG LABTECH
102/138 0470F0026A 2010-03-15
Manual scale This option allows you to personally specify the graph limits. You can use this function to enlarge parts of the graph of special interest.
Max Maximum value displayed
Min Minimum value displayed
Update display Here you can specify how often the display is updated. In well mode the display is updated at least after finishing the measurement of a well, in plate mode it is updated at least after each cycle. If you select any of the ‘Update every X seconds’ options, there will be updates even for unfinished cycles / wells showing the already available measurement values.
Notes: For updating the Current State – Microplate View and the Current State – Well View window, a large amount of computing power is necessary, especially for tests with a large number of cycles / intervals or multichromatics. If the computer is too slow to redraw the current state display between two measurement values, the update sequence will be lowered automatically.
The update display modes for well mode tests and plate mode tests (including time resolved fluorescence and AlphaScreen standard mode) are independent.
When a time resolved fluorescence or AlphaScreen advanced mode protocol is used, the display will always be updated after completion of the measurement of a well.
This option is not available for well mode endpoint test runs without multichromatics, as here only one value per well (two for simultaneous dual emission protocols) will be transmitted. When using the well scanning feature all scan points will also be transmitted at once, therefore, the update function does not make sense in these cases. Due to technical reasons the display will only be updated after a cycle is completed when performing absorbance spectra plate mode measurements.
Absorbance mode The measurement results from absorbance mode test runs can be displayed in • OD units • mOD units
Polarization mode The measurement results from fluorescence polarization tests can be displayed as • Raw data from both channels • Polarization values in mP units
These values are calculated from the results of channel A and channel B:
P = Ch.A - Ch.B Ch.A + Ch.B
• Anisotropy values in mA units
A = Ch.A - Ch.B Ch.A + 2(Ch.B)
Time resolved fluorescence The measurement results from dual emission time resolved fluorescence tests can be displayed as • Raw data from both channels • Ratio of channel A / B multiplied by the ratio multiplicator defined as part of the test protocol
Use blank corrected values If you use this option, all results will be blank corrected before display.
BMG LABTECH PHERAstar Software Manual – Part II: Control Software
2010-03-15 0470F0026A 103/138
Notes: If you use this option during well mode tests, measurement results cannot be displayed before the first “Blank” well is measured. Therefore, it might be a good idea to place at least one blank at the beginning of reading (depending on the selected reading direction, see chapter 4.3.8 Layout Definition) if you are interested in the current state display. As soon as the measurement values of additional blanks become available, the entire current state display will be recalculated and updated.
If you use this option during plate mode tests, the current state display will only be updated when a cycle is finished (regardless of the selection under ‘Update display’).
Use average of all blanks from all groups for blank correction This option is only available when different layout groups (see chapter 4.3.9 Using Layout Groups) are used. If this option is not selected, the measurement values of a group will be corrected using only blanks from the same group. If you select this option, the correction will be done using the average of all blanks from all groups.
Note: All settings from this window are user specific, therefore, each user can select the preferences independently.
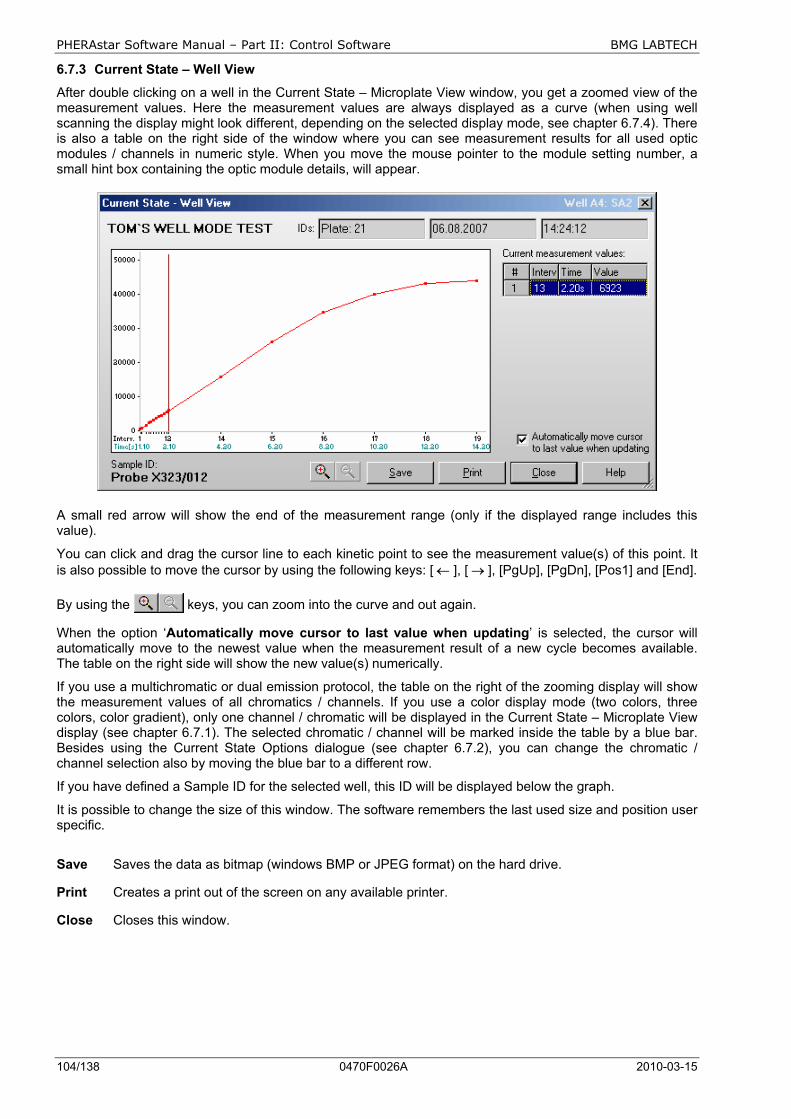
PHERAstar Software Manual – Part II: Control Software BMG LABTECH
104/138 0470F0026A 2010-03-15
6.7.3 Current State – Well View
After double clicking on a well in the Current State – Microplate View window, you get a zoomed view of the measurement values. Here the measurement values are always displayed as a curve (when using well scanning the display might look different, depending on the selected display mode, see chapter 6.7.4). There is also a table on the right side of the window where you can see measurement results for all used optic modules / channels in numeric style. When you move the mouse pointer to the module setting number, a small hint box containing the optic module details, will appear.
A small red arrow will show the end of the measurement range (only if the displayed range includes this value).
You can click and drag the cursor line to each kinetic point to see the measurement value(s) of this point. It is also possible to move the cursor by using the following keys: [ ← ], [ → ], [PgUp], [PgDn], [Pos1] and [End].
By using the keys, you can zoom into the curve and out again.
When the option ‘Automatically move cursor to last value when updating’ is selected, the cursor will automatically move to the newest value when the measurement result of a new cycle becomes available. The table on the right side will show the new value(s) numerically.
If you use a multichromatic or dual emission protocol, the table on the right of the zooming display will show the measurement values of all chromatics / channels. If you use a color display mode (two colors, three colors, color gradient), only one channel / chromatic will be displayed in the Current State – Microplate View display (see chapter 6.7.1). The selected chromatic / channel will be marked inside the table by a blue bar. Besides using the Current State Options dialogue (see chapter 6.7.2), you can change the chromatic / channel selection also by moving the blue bar to a different row.
If you have defined a Sample ID for the selected well, this ID will be displayed below the graph.
It is possible to change the size of this window. The software remembers the last used size and position user specific.
Save Saves the data as bitmap (windows BMP or JPEG format) on the hard drive.
Print Creates a print out of the screen on any available printer.
Close Closes this window.
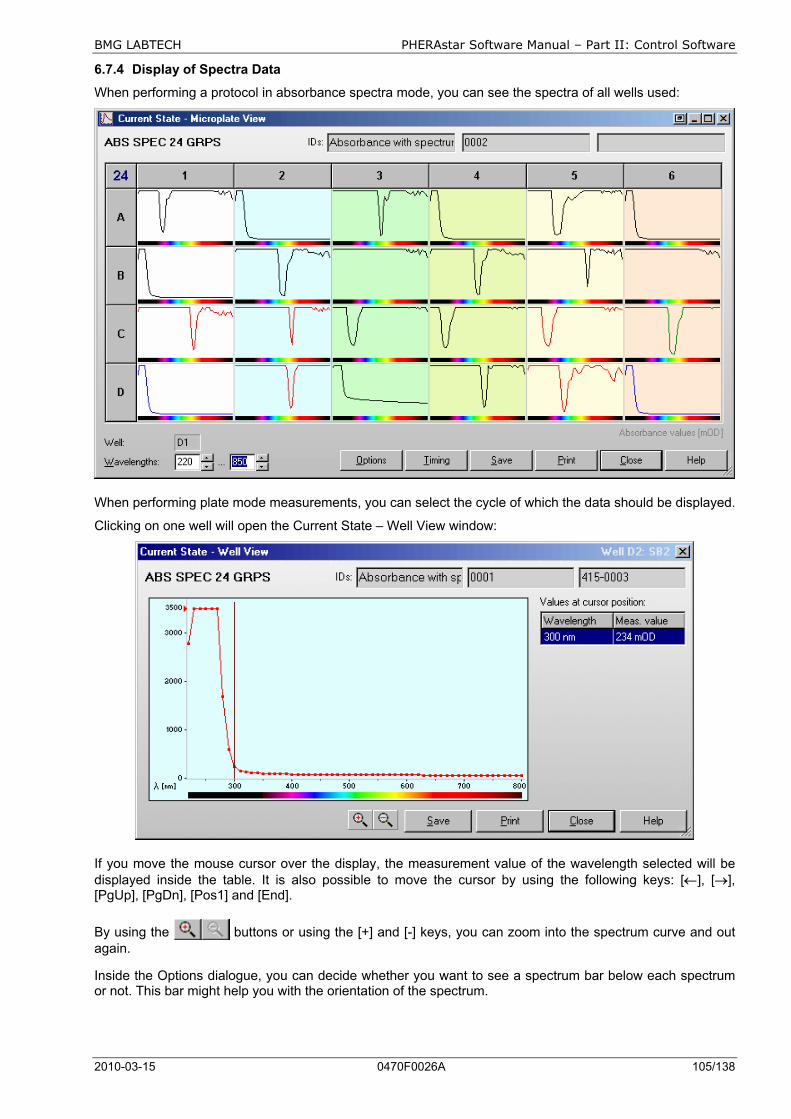
BMG LABTECH PHERAstar Software Manual – Part II: Control Software
2010-03-15 0470F0026A 105/138
6.7.4 Display of Spectra Data
When performing a protocol in absorbance spectra mode, you can see the spectra of all wells used:
When performing plate mode measurements, you can select the cycle of which the data should be displayed.
Clicking on one well will open the Current State – Well View window:
If you move the mouse cursor over the display, the measurement value of the wavelength selected will be displayed inside the table. It is also possible to move the cursor by using the following keys: [←], [→], [PgUp], [PgDn], [Pos1] and [End].
By using the buttons or using the [+] and [-] keys, you can zoom into the spectrum curve and out again.
Inside the Options dialogue, you can decide whether you want to see a spectrum bar below each spectrum or not. This bar might help you with the orientation of the spectrum.
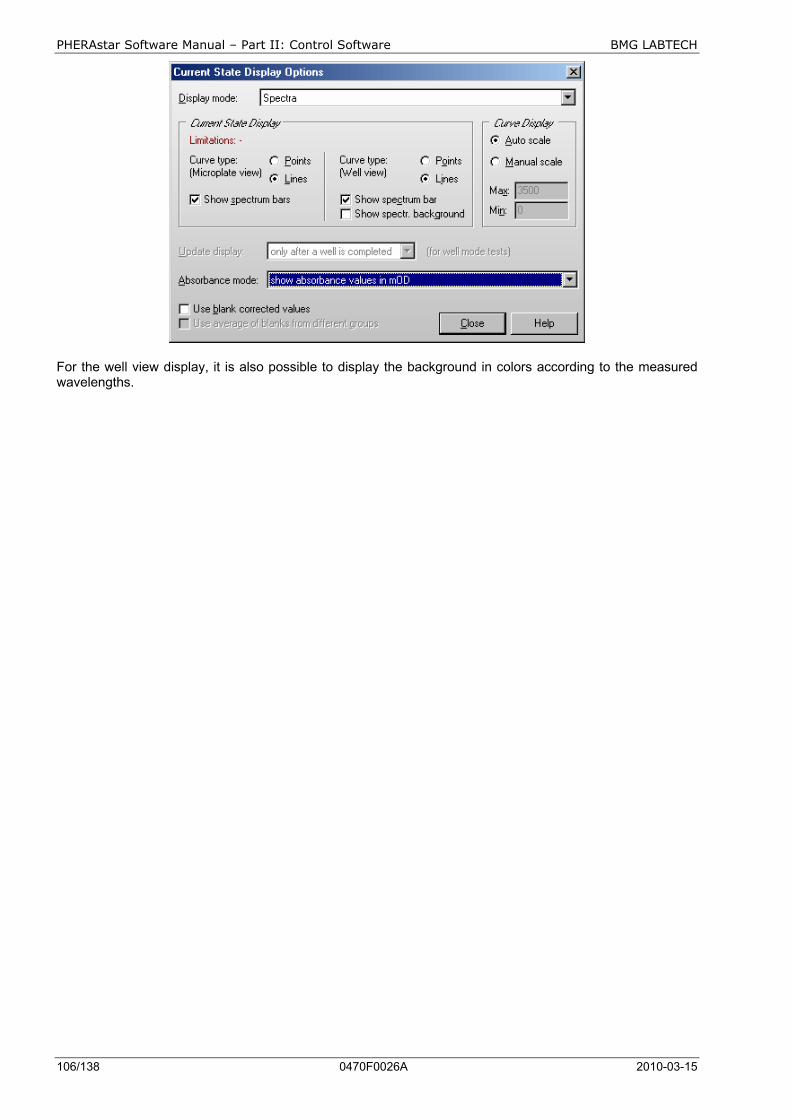
PHERAstar Software Manual – Part II: Control Software BMG LABTECH
106/138 0470F0026A 2010-03-15
For the well view display, it is also possible to display the background in colors according to the measured wavelengths.
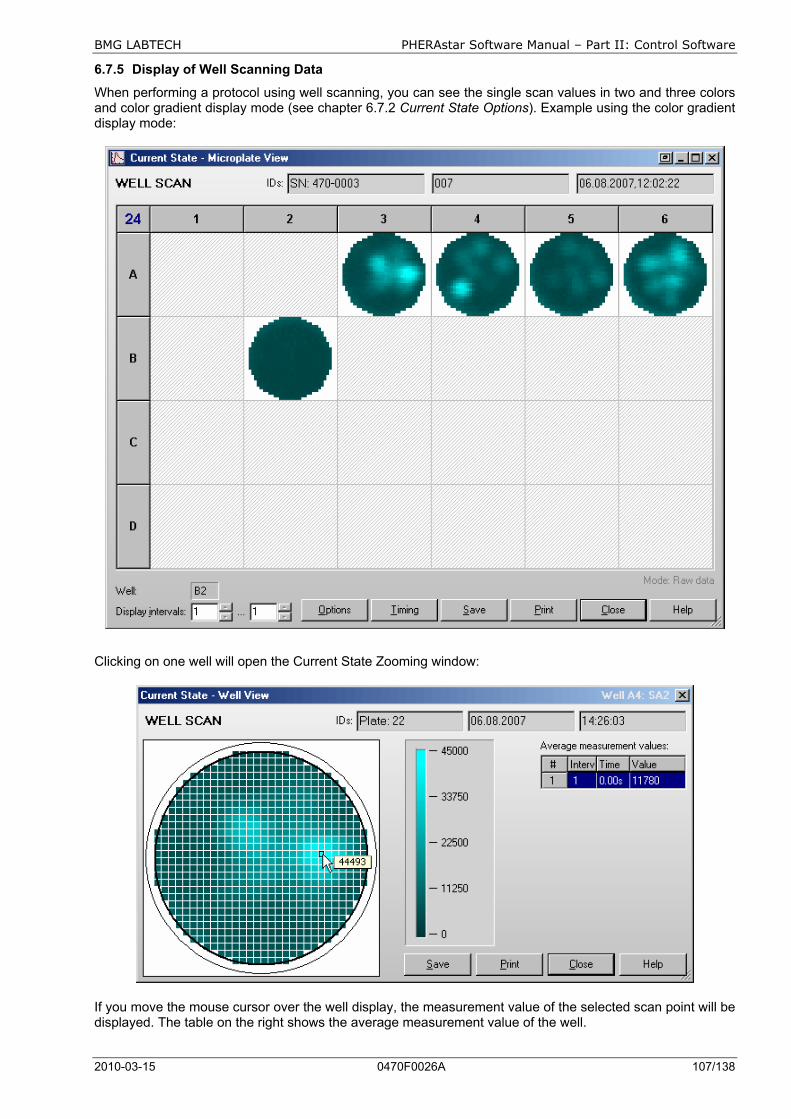
BMG LABTECH PHERAstar Software Manual – Part II: Control Software
2010-03-15 0470F0026A 107/138
6.7.5 Display of Well Scanning Data
When performing a protocol using well scanning, you can see the single scan values in two and three colors and color gradient display mode (see chapter 6.7.2 Current State Options). Example using the color gradient display mode:
Clicking on one well will open the Current State Zooming window:
If you move the mouse cursor over the well display, the measurement value of the selected scan point will be displayed. The table on the right shows the average measurement value of the well.
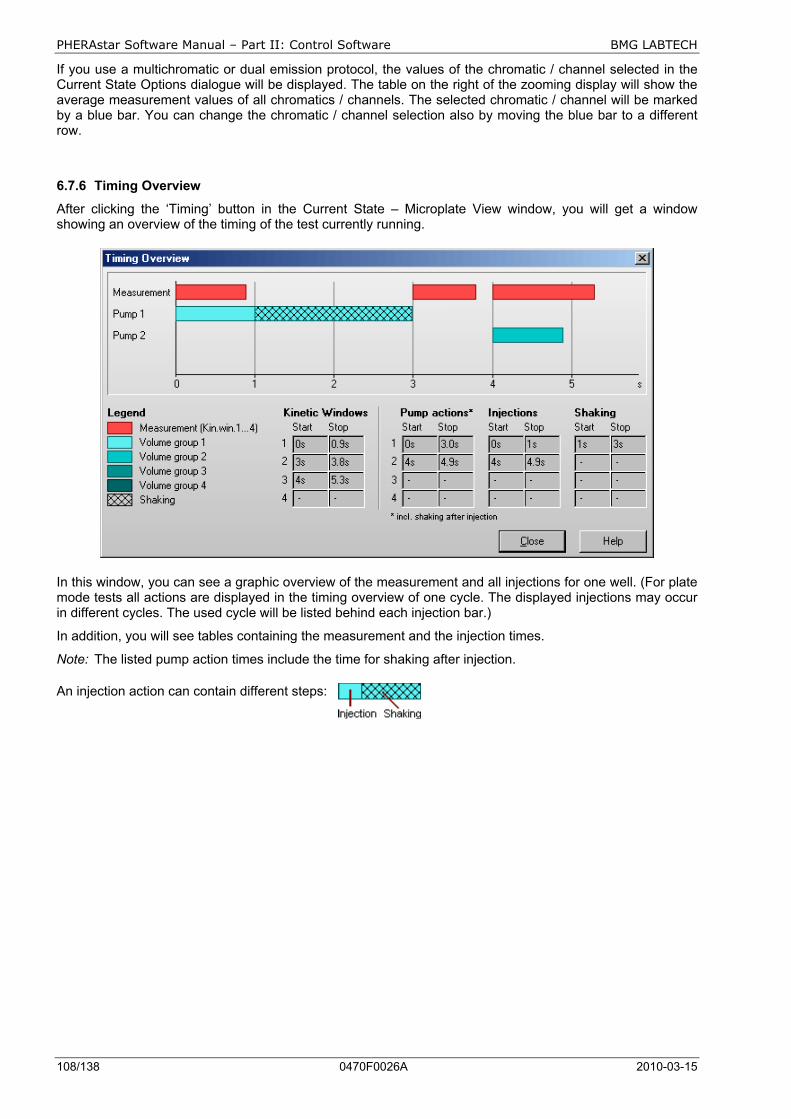
PHERAstar Software Manual – Part II: Control Software BMG LABTECH
108/138 0470F0026A 2010-03-15
If you use a multichromatic or dual emission protocol, the values of the chromatic / channel selected in the Current State Options dialogue will be displayed. The table on the right of the zooming display will show the average measurement values of all chromatics / channels. The selected chromatic / channel will be marked by a blue bar. You can change the chromatic / channel selection also by moving the blue bar to a different row.
6.7.6 Timing Overview
After clicking the ‘Timing’ button in the Current State – Microplate View window, you will get a window showing an overview of the timing of the test currently running.
In this window, you can see a graphic overview of the measurement and all injections for one well. (For plate mode tests all actions are displayed in the timing overview of one cycle. The displayed injections may occur in different cycles. The used cycle will be listed behind each injection bar.)
In addition, you will see tables containing the measurement and the injection times.
Note: The listed pump action times include the time for shaking after injection.
An injection action can contain different steps:
BMG LABTECH PHERAstar Software Manual – Part II: Control Software
2010-03-15 0470F0026A 109/138
6.8 Repeating the Execution of a Test Protocol (“Re run”) It is possible to repeat the execution of the test protocol used last by a single mouse click onto the “re run” button:
Using the program configuration dialogue (see chapter 3.4.2) you can choose to get one, two, three or no re run button.
After right clicking this button a context menu will appear, where you find functions to edit the protocol, to open the normal start measurement window (to change gain values or IDs) and to remove the protocol from the re run list.
The button at the right end of the icon bar ( ) provides a list containing the up to ten last used test protocols. Use this list to repeat the execution of one of these protocols.
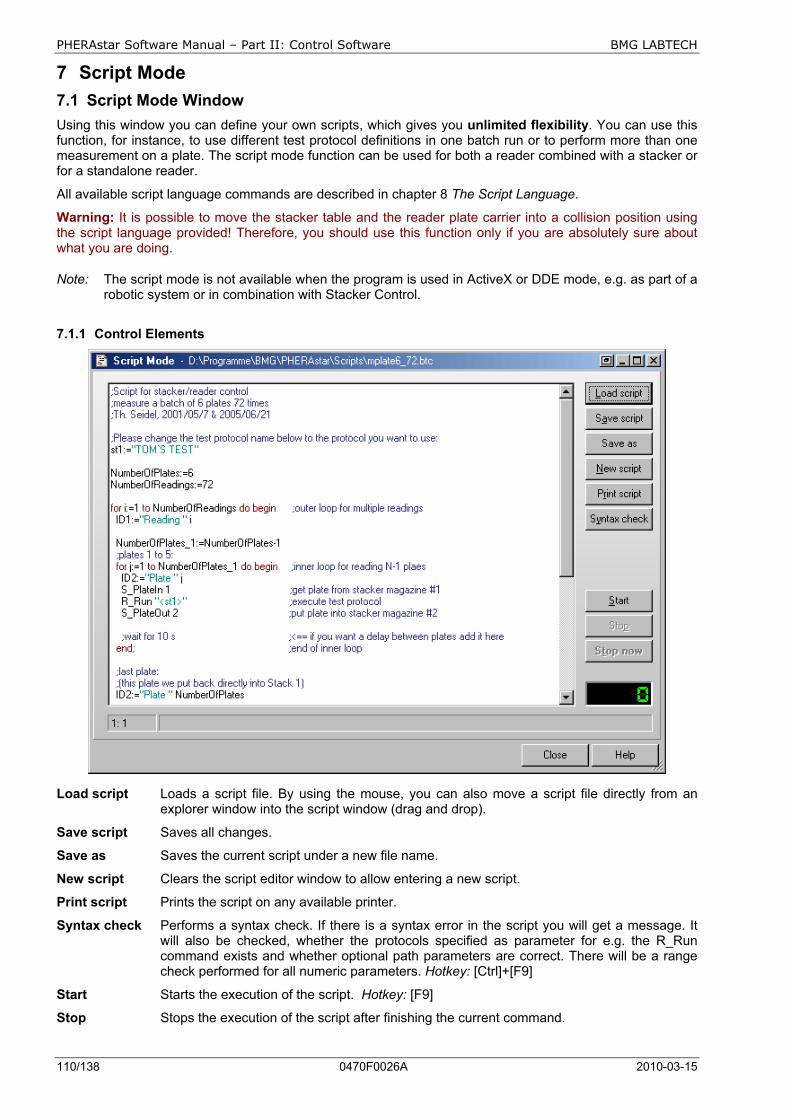
PHERAstar Software Manual – Part II: Control Software BMG LABTECH
110/138 0470F0026A 2010-03-15
7 Script Mode 7.1 Script Mode Window Using this window you can define your own scripts, which gives you unlimited flexibility. You can use this function, for instance, to use different test protocol definitions in one batch run or to perform more than one measurement on a plate. The script mode function can be used for both a reader combined with a stacker or for a standalone reader.
All available script language commands are described in chapter 8 The Script Language.
Warning: It is possible to move the stacker table and the reader plate carrier into a collision position using the script language provided! Therefore, you should use this function only if you are absolutely sure about what you are doing.
Note: The script mode is not available when the program is used in ActiveX or DDE mode, e.g. as part of a robotic system or in combination with Stacker Control.
7.1.1 Control Elements
Load script Loads a script file. By using the mouse, you can also move a script file directly from an explorer window into the script window (drag and drop).
Save script Saves all changes.
Save as Saves the current script under a new file name.
New script Clears the script editor window to allow entering a new script.
Print script Prints the script on any available printer.
Syntax check Performs a syntax check. If there is a syntax error in the script you will get a message. It will also be checked, whether the protocols specified as parameter for e.g. the R_Run command exists and whether optional path parameters are correct. There will be a range check performed for all numeric parameters. Hotkey: [Ctrl]+[F9]
Start Starts the execution of the script. Hotkey: [F9]
Stop Stops the execution of the script after finishing the current command.
BMG LABTECH PHERAstar Software Manual – Part II: Control Software
2010-03-15 0470F0026A 111/138
Stop now Stops the execution of the script immediately (the command currently processed will be terminated). Hotkey: [Ctrl]+[F2]
Close Closes this window. You can close (and reopen) this window even when the script is currently executed.
Clicking the button beside the ‘Minimize’ and ‘Maximize’ button (only available when using Windows’ classic display style) or using the system menu function ‘Default position and size’ will bring the script mode window back to its default size and position. To open the system menu, use [Alt]+[ ], click on the form’s icon or right click on the form’s caption. You can also double click the form’s background to activate this function.
In the left part of the script mode window status section you will see the current cursor position (line: column) while editing the script.
The software will automatically remember the last script used (user specific) and will reopen the script the next time you open the script mode window.
The script mode window is resizable. The size and position used will be stored user specifically.
7.1.2 Editor Functions
To undo the last change of the script use the key combination [Ctrl]+[P] or [Alt]+[Back].
Block indent / outdent function: After selecting one or more lines and using the key combination [Ctrl]+[K] or [Ctrl]+[Tab], two spaces will be inserted on the beginning of the selected lines. (The selected block will be indented by 2 characters.) To outdent a block, use [Ctrl]+[U] or [Ctrl]+[Shift]+[Tab].
It is possible to search text forward or backward beginning from the cursor position or from the top / end of the editor content. The following key combinations can be used to activate the search function:
1. Borland Style: To open the search parameters window use [Ctrl]+[Q], [F], to repeat the last search (in the defined search direction) use [Ctrl]+[L]. Use [Shift]+[Ctrl]+[L] to search against the defined direction, e.g. to go back to the previous occurrence.
2. Microsoft Style: To open the search parameters window use [Ctrl]+[F], to search the next occurrence in forward direction use [F3], for backward direction use [Shift]+[F3].
If you select something before using the [Ctrl]+[Q], [F] / [Ctrl]+[F] key combination, this selection will be used as default search string, otherwise if the cursor is positioned onto a word this word will be taken as default value.
Note: Searching something, which includes line breaks, is not possible. You might change the width of the window to remove soft line breaks.
All above mentioned functions are also available using the pull-up menu (right click into the editor window).
[Ctrl]+[Y] will delete the cursor line, [Ctrl]+[Q],[Y] will delete everything in the current line after the cursor position.
[Ctrl]+[F1] will provide context sensitive help, as this key combination will open the Script Language chapter of the online help. If the word at the cursor position is a known command / language element, the page of the online help containing this element will be opened (it might be necessary to scroll down some lines to see the description).
7.1.3 Syntax Highlight Function
To ease the reading of script code, a syntax highlight function has been implemented. Reserved words (as for example for, to, do, begin, end) are displayed in red. String constants are shown using cyan. Blue will be used for comments.
Example: for i:=1 to NumberOfReadings do begin ;loop for multiple readings ID1:="Reading " i ;define plate ID S_PlateIn 1 ;get plate from stacker magazine #1 R_Run "TOM´S PROTOCOL" ;execute test protocol S_PlateOut 2 ;put plate into stacker magazine #2 end; ;end of loop
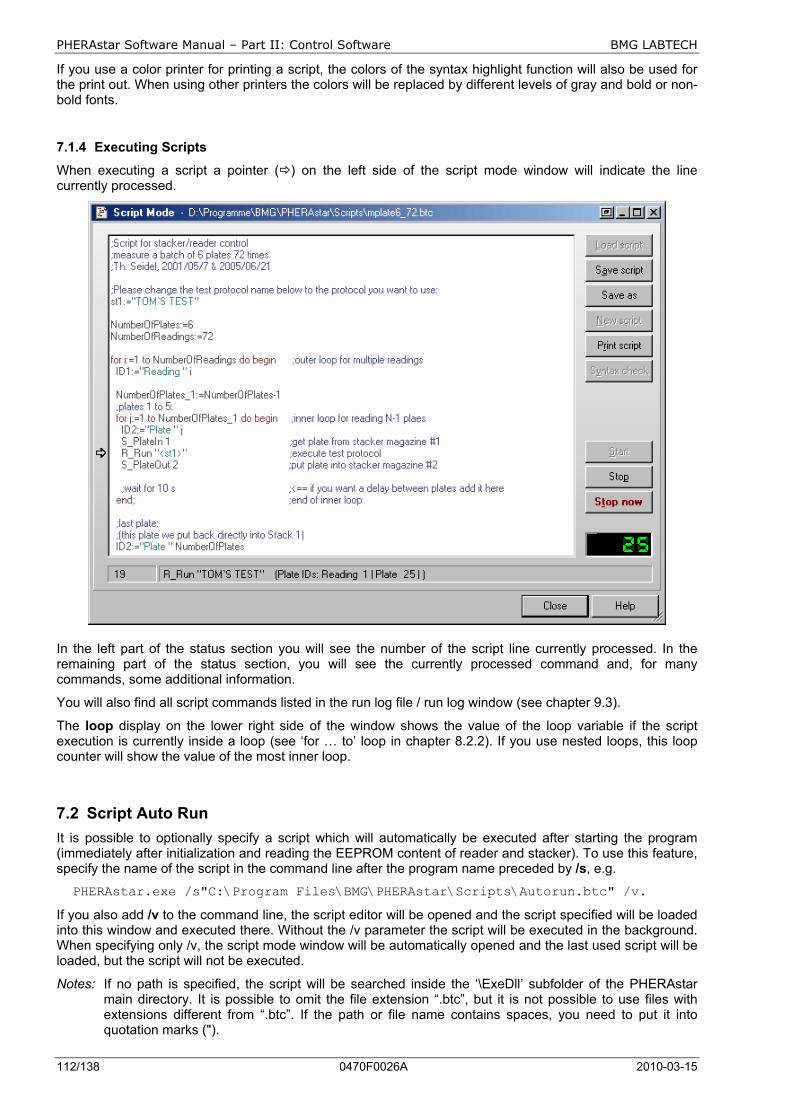
PHERAstar Software Manual – Part II: Control Software BMG LABTECH
112/138 0470F0026A 2010-03-15
If you use a color printer for printing a script, the colors of the syntax highlight function will also be used for the print out. When using other printers the colors will be replaced by different levels of gray and bold or non-bold fonts.
7.1.4 Executing Scripts
When executing a script a pointer ( ) on the left side of the script mode window will indicate the line currently processed.
In the left part of the status section you will see the number of the script line currently processed. In the remaining part of the status section, you will see the currently processed command and, for many commands, some additional information.
You will also find all script commands listed in the run log file / run log window (see chapter 9.3).
The loop display on the lower right side of the window shows the value of the loop variable if the script execution is currently inside a loop (see ‘for … to’ loop in chapter 8.2.2). If you use nested loops, this loop counter will show the value of the most inner loop.
7.2 Script Auto Run It is possible to optionally specify a script which will automatically be executed after starting the program (immediately after initialization and reading the EEPROM content of reader and stacker). To use this feature, specify the name of the script in the command line after the program name preceded by /s, e.g.
PHERAstar.exe /s"C:\Program Files\BMG\PHERAstar\Scripts\Autorun.btc" /v.
If you also add /v to the command line, the script editor will be opened and the script specified will be loaded into this window and executed there. Without the /v parameter the script will be executed in the background. When specifying only /v, the script mode window will be automatically opened and the last used script will be loaded, but the script will not be executed.
Notes: If no path is specified, the script will be searched inside the ‘\ExeDll’ subfolder of the PHERAstar main directory. It is possible to omit the file extension “.btc”, but it is not possible to use files with extensions different from “.btc”. If the path or file name contains spaces, you need to put it into quotation marks (").
BMG LABTECH PHERAstar Software Manual – Part II: Control Software
2010-03-15 0470F0026A 113/138
8 The Script Language 8.1 Introduction The script language can be used for controlling the stacker and the reader. Scripts can either be automatically generated or written by the user using the ‘Script Mode Window’ (see chapter 7.1).
The automatically generated scripts will be saved in the file ‘PHERAstar.btc’ in the PHERAstar temp folder (usually c:\Program Files\BMG\PHERAstar\Temp). It might be a good idea to have a look at the automatically generated scripts for batch measurements. You can copy these scripts and modify them according to your needs, but be aware of the fact that there will be different batch run scripts generated, depending on the usage of <barcode> as one of the plate IDs or depending on whether or not the last plate is measured. For the automatically generated scripts, it will also be taken into account whether or not the first plate has already been moved in into the reader (for focus or gain adjustment).
You will find some example scripts in the subfolder Scripts of the PHERAstar installation directory (usually c:\Program Files\BMG\PHERAstar\).
The script language is case insensitive. Nevertheless, it is recommended to follow the writing style from this manual to ease the reading of script code.
All string values / string parameters need to be enclosed in double quotes ". Everything behind a semicolon ; is considered to be a comment. During execution of the script these comments will be ignored.
Note: If all parameters of a command do not fit in one line, you should enter a / at the end of the line and continue in the next line, e.g.:
R_GainWell "DUAL EMISSION FLUO" / "D:\Program Files\BMG\PHERAstar\Tom\Definit" / 2 5 80 40 1
8.1.1 Typographical Conventions
{ } Curly brackets are used to characterize a place holder for a command parameter. Replace the expression with an appropriate numeric or string value (depending on the parameter type) or with a variable.
( ) Round brackets enclose optional items.
Boldface Boldfaced words represent elements of the script language (commands or reserved words).
Monospace type Example code is displayed using a monospace font type (fixed pitch font).
Note: When items are shown enclosed by < >, these signs need also to be entered - opposite to the signs { } and ( ). Items enclosed by < > will be replaced by the item values when the script line containing the item is processed. These signs are used to mark system constants or variables and for conversion functions, like <IntToStr(n)>.
8.1.2 Advices
• Before using a S_PlateIn(B), S_GetPlate(B) or S_MovePlate command send a S_PrepareForPlate command, to ensure that the stacker knows the Z dimensions of the microplate used (different plate types require different handling). If you use different microplates in one script run, you need to send the S_PrepareForPlate command each time the plate type will be changed; otherwise it is enough to send this command once at the beginning of your script.
• If a stacker is connected to your reader, you should use a S_DisableMotors command at the end of your script, to switch off the stepper motors, to save energy and prevent heat built-up.
PHERAstar Software Manual – Part II: Control Software BMG LABTECH
114/138 0470F0026A 2010-03-15
8.2 Batch Control Commands 8.2.1 Wait Commands
wait for {n} s
Wait for {n} seconds before proceeding with the next line. You can specify the time in 0.1 s steps. Instead s for seconds you can also use m for minutes or h for hours.
Example: wait for 3.5 s
wait for temp >= {n} Wait for the built in incubator of the reader to reach the specified temperature before proceeding with the next line (you can specify the temperature in 0.1 °C steps).
You should use this command after switching on the incubator using the R_Temp command.
Example: R_Temp 37 wait for temp >= 36.9
wait for temp <= {n} Wait for the temperature of the reader to reach or fall below the specified temperature before proceeding with the next line. You can use this command after setting the incubator’s target temperature to a lower value using the R_Temp command or after switching off the incubation. To get temperature values transmitted even when the incubator is switched off, use the temperature monitoring function (see chapter 5.2.2) by sending a ‘R_Temp 0.1’ command.
8.2.2 Loop Commands
for i:={n} to {m} do begin {commands} ... end;
for ... to - loop: All commands between the for...to- and the end-line will be repeated {m-n+1} times. A maximum of 100 nested loops (‘begin … end’ blocks used in combination with ‘for … to’ or ‘if … then’) is possible.
Example: for i:=1 to 5 do begin R_Run “MY TEST” end;
If you use the special term <All_Plates> as part of the loop command (for i:={n} to <All_Plates> do begin), all commands between the for...to- and the end-line will be repeated as long as a S_PlateIn, S_PlateInB, S_GetPlate, S_GetPlateB or S_MovePlate command inside the loop finds a plate in the used source stack.
If used in this context, there will be no error message if the source stack is empty. Instead the script execution will be continued with the first line after the loop. This allows you to program scripts which will measure every plate available, without needing to know the plate number upfront.
Example: for i:=1 to <All_Plates> do begin S_MovePlate 1 2 1 end;
Note: There will be an error message if the S_PlateIn, S_PlateInB, S_GetPlate, S_GetPlateB command already fails for the first plate (loop counter = 1, occurs only if the loop does not start with 2), which means there has not been a single plate inserted.
break
Leave a loop and continue operation with the first command after the loop end. (When used outside a loop, this command will end the script execution.)

BMG LABTECH PHERAstar Software Manual – Part II: Control Software
2010-03-15 0470F0026A 115/138
8.2.3 Comparisons
if <Barcode_String>=“value” then ...
Perform the command after ‘then’ only if the last read barcode is equal to the declared (string) value. *
You can use <Barcode_String> for the plate barcode read by the BMG LABTECH Stacker and <Barcode_Left_String>, <Barcode_Front_String> and <Barcode_Right_String> for the plate barcodes read by the internal barcode readers of the PHERAstar FS.
Examples: if <Barcode_Left_String>=”<no barcode detected>” then ID1:=”unknown plate” if <Barcode_String> =”008” then R_Run “PROTOCOL 008”
if ID1=“value” then ... if ID2=“value” then ... if ID3=“value” then ...
Perform the command after ‘then’ only if the ID1 (2, 3) string is equal to the declared value. *
if st{n}=“value” then ...
Perform the command after ‘then’ only if the value of the string variable st{n} (st0 ... st100) is equal to the declared value. *
if st{n}=st{m} then ...
Perform the command after ‘then’ only if the values of both string variables are equal. * Instead of a string variable you can also use one of the ID values.
if Ser_Number=“value” then ...
Perform the command after ‘then’ only if the serial number of the reader currently connected is equal to the declared value. *
Example: if Ser_Number>="471-0000" then ShowMessage "Reader type is PHERAstar FS."
if {variable}=value then ...
Perform the command after ‘then’ only if the (numeric) value of the variable is equal to the declared value. *
if {variable1}={variable2} then ...
Perform the command after ‘then’ only if the (numeric) value of the variable1 is equal to the value of variable2. *
* Instead of '=' you can also use '<>' for not equal, '>' for greater than, '>=' for greater than or equal, '<' for smaller than and '<=' for smaller than or equal.
If you want to perform more than one command after the comparison, you can use ‘begin’ and ‘end;’ to define a block of commands.
Example: if A>5 then begin beep ShowMsg “Information: A is larger than 5” end;
A maximum of 100 nested ‘begin … end’ blocks (used in combination with ‘if … then’ or ‘for … to’) is possible.
Note: The string comparisons work case insensitive, e.g. “ABC”=“abc”.

PHERAstar Software Manual – Part II: Control Software BMG LABTECH
116/138 0470F0026A 2010-03-15
8.2.4 Other Batch Control Commands
beep
This command produces a short acoustic signal (you can use this, for example, to announce the end of a batch operation).
restart
Restart operation with first script line (useful e.g. for endless demos).
halt
End the execution of the script.
terminate
End the execution of the script and terminate the software. This is especially useful in combination with the script auto run function (see chapter 7.2).
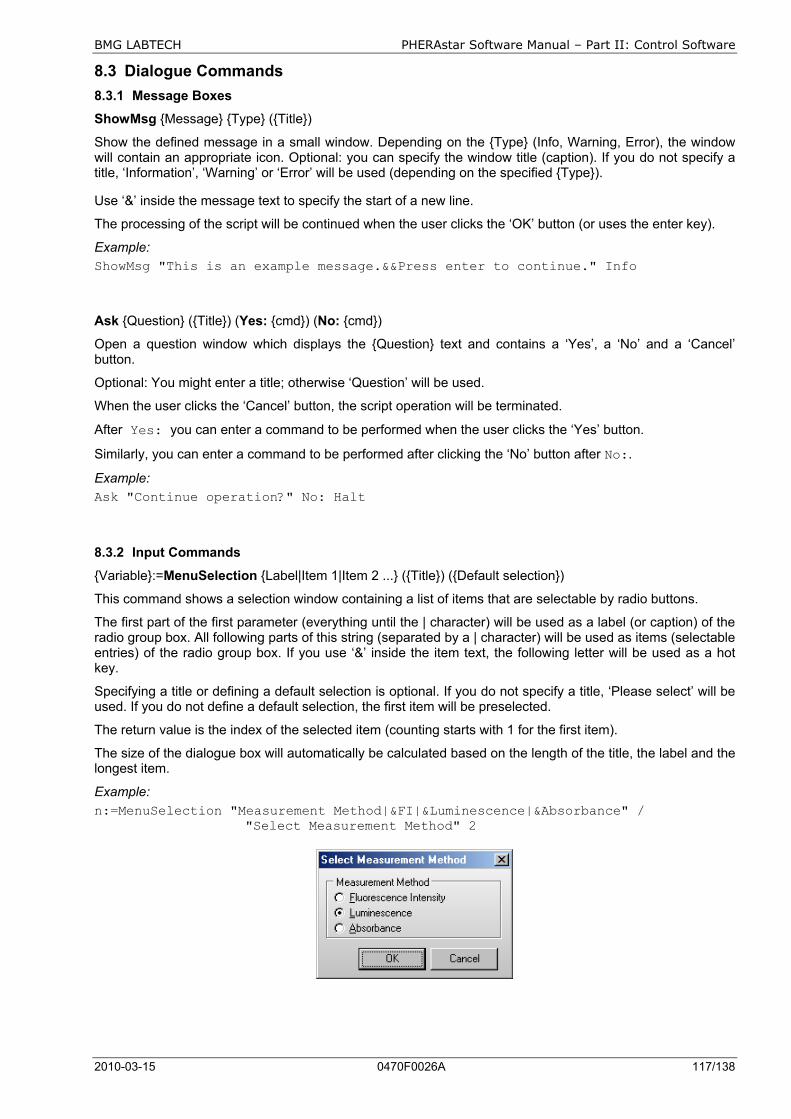
BMG LABTECH PHERAstar Software Manual – Part II: Control Software
2010-03-15 0470F0026A 117/138
8.3 Dialogue Commands 8.3.1 Message Boxes
ShowMsg {Message} {Type} ({Title})
Show the defined message in a small window. Depending on the {Type} (Info, Warning, Error), the window will contain an appropriate icon. Optional: you can specify the window title (caption). If you do not specify a title, ‘Information’, ‘Warning’ or ‘Error’ will be used (depending on the specified {Type}).
Use ‘&’ inside the message text to specify the start of a new line.
The processing of the script will be continued when the user clicks the ‘OK’ button (or uses the enter key).
Example: ShowMsg "This is an example message.&&Press enter to continue." Info
Ask {Question} ({Title}) (Yes: {cmd}) (No: {cmd})
Open a question window which displays the {Question} text and contains a ‘Yes’, a ‘No’ and a ‘Cancel’ button.
Optional: You might enter a title; otherwise ‘Question’ will be used.
When the user clicks the ‘Cancel’ button, the script operation will be terminated.
After Yes: you can enter a command to be performed when the user clicks the ‘Yes’ button.
Similarly, you can enter a command to be performed after clicking the ‘No’ button after No:.
Example: Ask "Continue operation?" No: Halt
8.3.2 Input Commands
{Variable}:=MenuSelection {Label|Item 1|Item 2 ...} ({Title}) ({Default selection})
This command shows a selection window containing a list of items that are selectable by radio buttons.
The first part of the first parameter (everything until the | character) will be used as a label (or caption) of the radio group box. All following parts of this string (separated by a | character) will be used as items (selectable entries) of the radio group box. If you use ‘&’ inside the item text, the following letter will be used as a hot key.
Specifying a title or defining a default selection is optional. If you do not specify a title, ‘Please select’ will be used. If you do not define a default selection, the first item will be preselected.
The return value is the index of the selected item (counting starts with 1 for the first item).
The size of the dialogue box will automatically be calculated based on the length of the title, the label and the longest item.
Example: n:=MenuSelection "Measurement Method|&FI|&Luminescence|&Absorbance" /
"Select Measurement Method" 2

PHERAstar Software Manual – Part II: Control Software BMG LABTECH
118/138 0470F0026A 2010-03-15
{Variable}:=InputInteger {Label} ({Title}) ({Min}) ({Max}) ({Default value})
This command shows an input box for integer values. Using the first parameter you specify the text in front of the input field. Similar to the Ask and ShowMsg command you can use ‘&’ inside the text for a line break.
If you do not specify a title, ‘Input’ will be used.
If you specify a minimum and maximum value, only input values in this range will be accepted. If the range between minimum and maximum value is not larger than 250, up/down scroll buttons will appear beside the input field.
Optionally, you can define a default value (a value, which will be pre-entered into the input field).
The value entered will be assigned to the target variable (variable specified left of :=).
Example: i:=InputInteger "Number of cycles to be performed (1...250):" / "Please enter something" 1 250 10
{Variable}:=InputFloat {Label} ({Title}) ({Min}) ({Max}) ({Default value})
This command is similar to the IntegerInput command, but will be used for floating point values.
Example: r:=InputFloat "Enter target temperature (25.0...44.5):" / "Temperature setting" 25 45.0 36.7
{Stringvariable}:=InputString {Label} ({Title}) ({Default value})
This command is similar to the IntegerInput command, but will be used for string values. As target variable, only a string variable (st0 … st100) is allowed.
Examples: st1:=InputString "Plate ID1:"
or
st1:=InputString "Plate ID1:" "Plate Identification" "Plate 08/15"
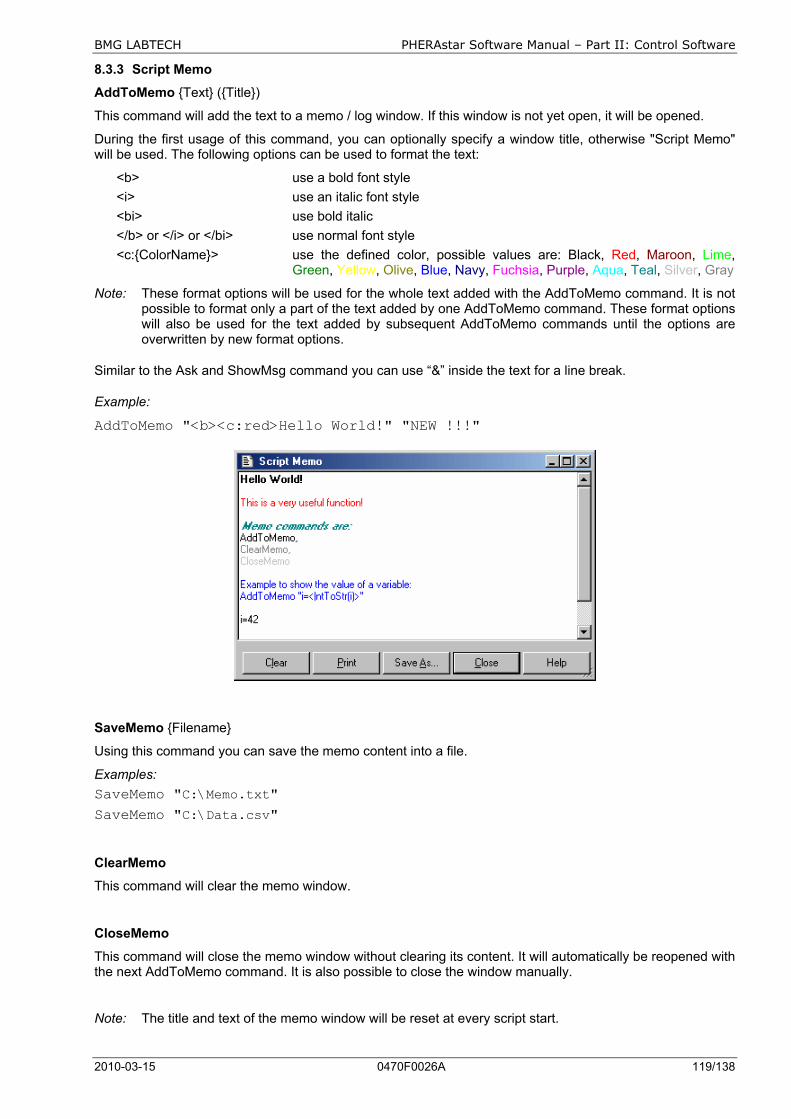
BMG LABTECH PHERAstar Software Manual – Part II: Control Software
2010-03-15 0470F0026A 119/138
8.3.3 Script Memo
AddToMemo {Text} ({Title})
This command will add the text to a memo / log window. If this window is not yet open, it will be opened.
During the first usage of this command, you can optionally specify a window title, otherwise "Script Memo" will be used. The following options can be used to format the text:
<b> use a bold font style <i> use an italic font style <bi> use bold italic </b> or </i> or </bi> use normal font style <c:{ColorName}> use the defined color, possible values are: Black, Red, Maroon, Lime,
Green, Yellow, Olive, Blue, Navy, Fuchsia, Purple, Aqua, Teal, Silver, Gray
Note: These format options will be used for the whole text added with the AddToMemo command. It is not possible to format only a part of the text added by one AddToMemo command. These format options will also be used for the text added by subsequent AddToMemo commands until the options are overwritten by new format options.
Similar to the Ask and ShowMsg command you can use “&” inside the text for a line break.
Example:
AddToMemo "<b><c:red>Hello World!" "NEW !!!"
SaveMemo {Filename}
Using this command you can save the memo content into a file.
Examples: SaveMemo "C:\Memo.txt" SaveMemo "C:\Data.csv"
ClearMemo
This command will clear the memo window.
CloseMemo
This command will close the memo window without clearing its content. It will automatically be reopened with the next AddToMemo command. It is also possible to close the window manually.
Note: The title and text of the memo window will be reset at every script start.
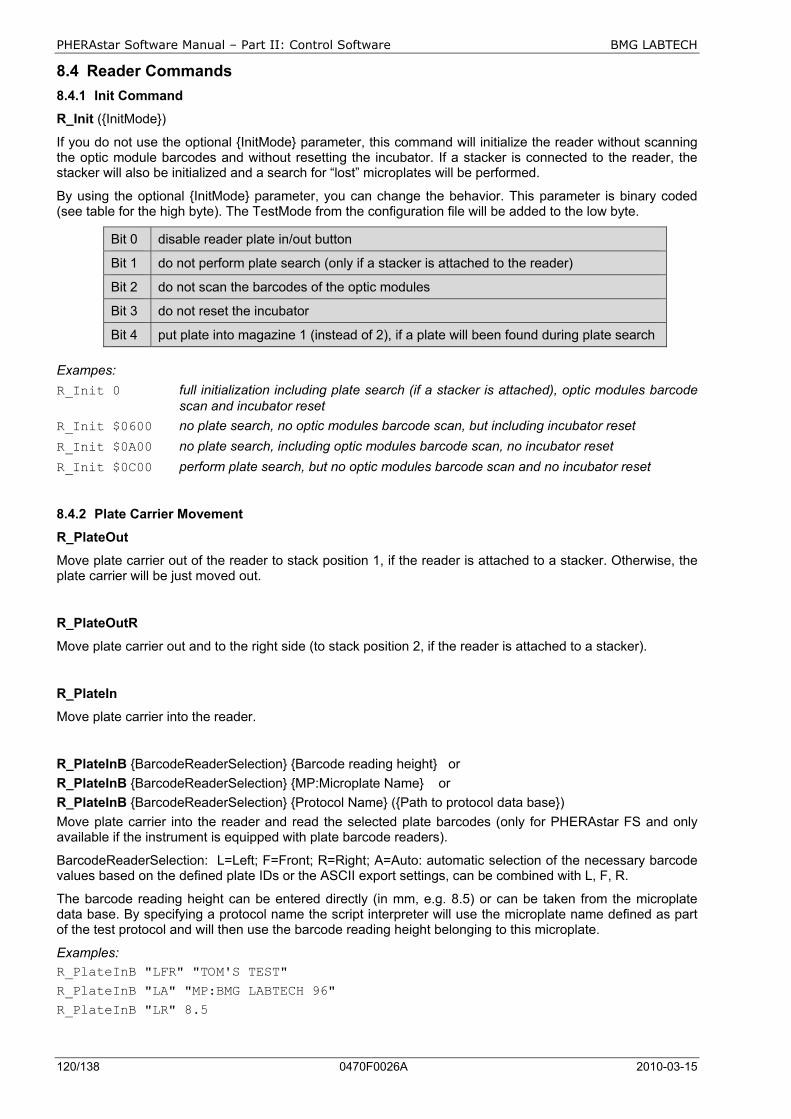
PHERAstar Software Manual – Part II: Control Software BMG LABTECH
120/138 0470F0026A 2010-03-15
8.4 Reader Commands 8.4.1 Init Command
R_Init ({InitMode})
If you do not use the optional {InitMode} parameter, this command will initialize the reader without scanning the optic module barcodes and without resetting the incubator. If a stacker is connected to the reader, the stacker will also be initialized and a search for “lost” microplates will be performed.
By using the optional {InitMode} parameter, you can change the behavior. This parameter is binary coded (see table for the high byte). The TestMode from the configuration file will be added to the low byte.
Bit 0 disable reader plate in/out button
Bit 1 do not perform plate search (only if a stacker is attached to the reader)
Bit 2 do not scan the barcodes of the optic modules
Bit 3 do not reset the incubator
Bit 4 put plate into magazine 1 (instead of 2), if a plate will been found during plate search Exampes: R_Init 0 full initialization including plate search (if a stacker is attached), optic modules barcode
scan and incubator reset R_Init $0600 no plate search, no optic modules barcode scan, but including incubator reset R_Init $0A00 no plate search, including optic modules barcode scan, no incubator reset R_Init $0C00 perform plate search, but no optic modules barcode scan and no incubator reset
8.4.2 Plate Carrier Movement
R_PlateOut
Move plate carrier out of the reader to stack position 1, if the reader is attached to a stacker. Otherwise, the plate carrier will be just moved out.
R_PlateOutR
Move plate carrier out and to the right side (to stack position 2, if the reader is attached to a stacker).
R_PlateIn
Move plate carrier into the reader.
R_PlateInB {BarcodeReaderSelection} {Barcode reading height} or R_PlateInB {BarcodeReaderSelection} {MP:Microplate Name} or R_PlateInB {BarcodeReaderSelection} {Protocol Name} ({Path to protocol data base}) Move plate carrier into the reader and read the selected plate barcodes (only for PHERAstar FS and only available if the instrument is equipped with plate barcode readers).
BarcodeReaderSelection: L=Left; F=Front; R=Right; A=Auto: automatic selection of the necessary barcode values based on the defined plate IDs or the ASCII export settings, can be combined with L, F, R.
The barcode reading height can be entered directly (in mm, e.g. 8.5) or can be taken from the microplate data base. By specifying a protocol name the script interpreter will use the microplate name defined as part of the test protocol and will then use the barcode reading height belonging to this microplate.
Examples: R_PlateInB "LFR" "TOM'S TEST" R_PlateInB "LA" "MP:BMG LABTECH 96" R_PlateInB "LR" 8.5
BMG LABTECH PHERAstar Software Manual – Part II: Control Software
2010-03-15 0470F0026A 121/138
R_BarcodeData
Use this command to transfer the barcode strings obtained using the R_PlateInB command from the reader to the computer. This command has no parameters. The barcode data can be used using <Barcode_Left_String>, <Barcode_Front_String>, <Barcode_Right_String>, <Barcode_Left_Value>, <Barcode_Front_Value>, <Barcode_Right_Value> or using the <barcode_left>, <barcode_front> and <barcode_right> options for plate IDs.
R_PlateUser {x} {y}
Move plate carrier to position x, y.
8.4.3 Incubator Control
R_Temp {n}
Switch the built in incubator of the reader on and set {n} as target temperature. The allowed temperature range for the standard incubator is 25.0 ... 45.0. If your reader is equipped with an extended incubator you can use the range 10.0 ... 60.0.
Use R_Temp 0 to switch the incubator off.
Use R_Temp 0.1 to switch the temperature monitoring function on without using the incubator.
Notes: The target temperature should be at least 5 degrees above the ambient temperature. You can use this command together with a wait for temp command.
When the incubator is switched on or the temperature monitoring function is used, the current temperature will be displayed inside the icon bar of the main program window.
8.4.4 Focus and Gain Adjustment
Notes: Focus and gain adjustment is not necessary / possible for absorbance protocols. Gain adjustment is not necessary for AlphaScreen™ and time resolved fluorescence protocols. Gain adjustment over the whole plate (R_GainPlate) is not available for fluorescence polarization protocols.
R_FocusAdjust {Protocol name} ({Path to protocol definition}) {Well column} {Well row} {Chromatic number} {Channel}
Perform a focus adjustment using the defined well, chromatic number (optic module) and channel (A or B).
Example: R_FocusAdjust "FAST TEST" / "C:\Program Files\BMG\PHERAstar\User\Definit" / 3 4 1 "A"
R_GainPlate {Protocol name} ({Path to protocol definition}) {Desired raw result for channel 1} {Desired raw result for channel 2} {Chromatic number}
Perform a gain adjustment for all measurement points of the plate using the declared parameters.
The parameter {Path to protocol definition} is optional. Use this, if you want to use a test protocol belonging to a different user account.
Please specify the desired raw result (required value) in % of the measurement range.
Example: R_GainPlate ”QC Test” 80 80 1

PHERAstar Software Manual – Part II: Control Software BMG LABTECH
122/138 0470F0026A 2010-03-15
R_GainWell {Protocol name} ({Path to protocol definition}) {Well column} {Well row} {Desired raw result for channel 1} {Desired raw result for channel 2} {Chromatic number} ({Target mP value for fluorescence polarization protocols}) ({Focus adjustment channel})
Perform a gain adjustment on the specified well using the declared parameters.
The parameter {Path to protocol definition} is optional.
You can add an optional parameter to select the channel for the focus adjustment procedure (“A” or “B”). If this parameter exists a focus adjustment procedure will be performed before the gain adjustment procedure.
Example: R_GainWell "FAST TEST" 5 2 80 0 1 "A"
(Perform focus adjustment using channel A and gain adjustment for channel A (req. value 80%) with the first optic module used in the protocol (chromatic 1) on well B5.)
R_GainWell in Fluorescence Polarization Mode
In fluorescence polarization mode you can either define the required values for both channels or you can define the required value for channel A and a target mP value (to use this mode set the required value for channel B to 0). When using the second option, the software will calculate the necessary required value for channel B itself.
Example: R_GainWell "FP PLATE" 2 2 80 0 1 35
Note: In fluorescence polarization mode a fine adjustment between the two channels will be performed automatically.
R_GetKFactor {Protocol name} ({Path to protocol definition}) {Well column} {Well row} {Chromatic No.} {Target polarization value} Calibrate the ratio between the two measurement channels (fine adjustment for fluorescence polarization tests) using the declared parameters.
Note: This fine adjustment between the two channels will also be performed automatically during the R_GainWell command.
R_SetFocalHeight {Protocol Name} ({Path to protocol data base}) {focal height value}
Change the focal height value defined in a test protocol to the specified value (range 0…25.0).
Example: R_SetFocalHeight "FP PLATE" 11.5
R_SetGain {Protocol Name} ({Path to protocol data base}) {Chromatic} {channel} {gain value}
Change the gain value defined in a test protocol to the specified value (range 0…4095).
Example: R_SetGain "FP PLATE" 1 "B" 222
(Sets the gain value for chromatic 1 (=optic module 1), channel B to 222.)
BMG LABTECH PHERAstar Software Manual – Part II: Control Software
2010-03-15 0470F0026A 123/138
8.4.5 Run Commands
n:=R_CalculateTestDuration {Protocol name} ({Path to protocol definition})
Calculate the duration of executing a test protocol and store this value (in seconds) in variable n.
ID1:=, ID2:=, ID3:=
Change the ID values used by the R_Run command. You can enter <Loop> to use the current value of the loop variable (For ...To command), e.g.: ID1:=”Batch: <Loop>”.
You can also combine numerical variables with strings, e.g.: ID1:=”Temperature=” Temp1.
Here you can use all special functions that are described in the chapter 6.4 Plate Identification.
R_SetSampleIDs {Protocol name} ({Path to protocol definition}) {Sample IDs filename}
This command can be used to load a set of sample IDs from a file (ASCII or Excel (.xls / .xlsx) format). The file content should use the same syntax as for the ‘Import IDs’ function of the Sample IDs sheet of the Start Measurement dialogue. You can use this dialogue to create the sample IDs file.
Examples: R_SetSampleIDs "FI TEST" "E:\SIDs.txt" R_SetSampleIDs "TOM’S TEST" "c:\BMG\PHERAstar\Tom\Definit" "E:\SIDs.xls"
If the sample IDs file contains dilution factors, these factors will also be imported. If the file contains entries for wells which are not used in the selected test protocol, these entries will be ignored (e.g. well A13 for a protocol using a 96 well plate). If the Sample IDs file contains invalid entries, e.g. an impossible well name like A49 or XYZ, there will be an error message.
R_ClearSampleIDs {Protocol name} ({Path to protocol definition})
The command R_ClearSampleIDs can be used to clear the sample IDs associated with the specified protocol.
R_ClearDilutionFactors {Protocol name} ({Path to protocol definition})
This command will reset all dilution factors associated with the specified protocol to 1.
R_Run {Protocol name} ({Path to protocol definition}) ({Path for measurement data})
Start a measurement using the declared parameters.
Specifying the path to the protocol definition and specifying the path for measurement data is optional (useful, if you want to perform a protocol belonging to a different user), but it is not possible to only specify the path for measurement data. If you omit these parameters, the path belonging to the user currently logged in will be used.
PHERAstar Software Manual – Part II: Control Software BMG LABTECH
124/138 0470F0026A 2010-03-15
8.5 Stacker Commands 8.5.1 Init Command
S_Init
Use this command to only initialize the stacker device.
8.5.2 Plate Handling Commands
S_PrepareForPlate {Protocol Name} ({Path to protocol data base}) or
S_PrepareForPlate {MP:Microplate Name}
This command takes the microplate name from the specified test protocol (or takes the microplate name specified directly using the second syntax version) and read the Z dimensions from the microplate data base. Based on these dimensions the Z value will be calculated, at which the Stacker should open its stoppers when inserting a plate into a magazine or should close the stopper when fetching a plate. The calculated Z value will be compared with the Z values stored inside the Stacker EEPROM. If different, the new Z value will be written into two positions of the EEPROM.
Note: You should always use this command in your scripts before the first S_PlateIn command!
S_PlateIn {n} (NotLastPlate)
Get a plate from magazine {n} and move this plate into the reader.
If you add NotLastPlate to the command line, the last plate will not be taken (this might be useful, if the top plate is used as cover).
Note: You can use the following command line to leave a loop after detecting the last plate: if <LastPlateDetected> then break
S_PlateInB {n} (NotLastPlate)
Get a plate from magazine {n}, read the barcode from this plate (using the Stacker barcode reader) and move this plate into the reader.
Note: Barcode reading is only possible when magazine 1 is used as source (and when a barcode reader is installed). Use S_BarcodeData after this command to transfer the barcode value to the computer.
S_PlateOut {n}
Move the plate out of the reader and insert it into magazine {n}.
S_GetPlate {n}
Get a plate from magazine {n}. If the reader plate carrier has been moved to the selected stack position, the plate will be inserted into the reader plate carrier, otherwise it will stay on top of the stacker table.
Recommendation: Use the command S_PlateIn instead of this command to move a plate into the reader.
S_GetPlateB {n}
Get a plate from magazine {n} and read the barcode from this plate (barcode reading is only possible when using stacker magazine 1 as source).
Recommendation: Use the command S_PlateInB instead of this command to move a plate into the reader.
S_PutPlate {n}
Put a plate from the stacker table (or from the reader plate carrier, if this has been moved under the target stack) into stacker magazine {n}.
Recommendation: Use the command S_PlateOut instead of this command to move a plate from the reader into a stacker magazine.
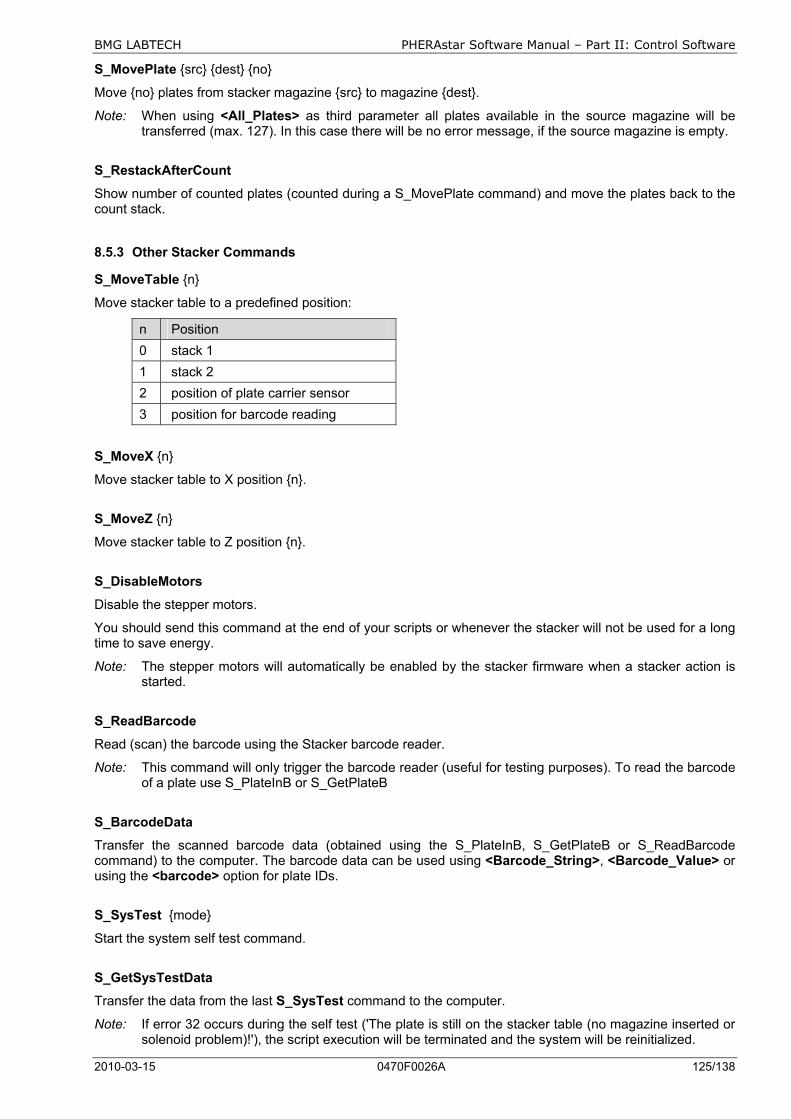
BMG LABTECH PHERAstar Software Manual – Part II: Control Software
2010-03-15 0470F0026A 125/138
S_MovePlate {src} {dest} {no}
Move {no} plates from stacker magazine {src} to magazine {dest}.
Note: When using <All_Plates> as third parameter all plates available in the source magazine will be transferred (max. 127). In this case there will be no error message, if the source magazine is empty.
S_RestackAfterCount
Show number of counted plates (counted during a S_MovePlate command) and move the plates back to the count stack.
8.5.3 Other Stacker Commands
S_MoveTable {n}
Move stacker table to a predefined position:
n Position 0 stack 1 1 stack 2 2 position of plate carrier sensor 3 position for barcode reading
S_MoveX {n}
Move stacker table to X position {n}.
S_MoveZ {n}
Move stacker table to Z position {n}.
S_DisableMotors
Disable the stepper motors.
You should send this command at the end of your scripts or whenever the stacker will not be used for a long time to save energy.
Note: The stepper motors will automatically be enabled by the stacker firmware when a stacker action is started.
S_ReadBarcode
Read (scan) the barcode using the Stacker barcode reader.
Note: This command will only trigger the barcode reader (useful for testing purposes). To read the barcode of a plate use S_PlateInB or S_GetPlateB
S_BarcodeData
Transfer the scanned barcode data (obtained using the S_PlateInB, S_GetPlateB or S_ReadBarcode command) to the computer. The barcode data can be used using <Barcode_String>, <Barcode_Value> or using the <barcode> option for plate IDs.
S_SysTest {mode}
Start the system self test command.
S_GetSysTestData
Transfer the data from the last S_SysTest command to the computer.
Note: If error 32 occurs during the self test ('The plate is still on the stacker table (no magazine inserted or solenoid problem)!'), the script execution will be terminated and the system will be reinitialized.
PHERAstar Software Manual – Part II: Control Software BMG LABTECH
126/138 0470F0026A 2010-03-15
8.6 System Constants and Variables There are a few predefined constants and variables you can use in scripts, e.g. for the S_MoveX command.
8.6.1 System Constants
<MaxX> maximum X position for S_MoveX command
<Xpos_Stack[0]>, X position for stack 1 and 2 <Xpos_Stack[1]>
<Xpos_MPsensor> X position to detect a microplate using the microplate carrier sensor
<Zpos_MPsensor> Z position to detect a microplate using the microplate carrier sensor
<Zpos_PlateUp> Z position to move plate up (when inserting in stack)
<Zpos_PlateDown> Z position to move plate down (when inserting in reader plate carrier)
<Zpos_Scan> Z position to scan barcode of microplate
<Zpos_Put_OpenStp> Z position to open stopper when inserting plate into stack
<Zpos_Put_CloseStp> Z position to close stopper when inserting plate into stack
<Zpos_Get_OpenStp> Z position to open stopper when fetching plate from stack
<Zpos_Get_CloseStp> Z position to close stopper when fetching plate from stack
8.6.2 Numerical System Variables
<Barcode_Value> If the plate barcode (read by the BMG LABTECH Stacker) contains a valid integer or floating point number, <Barcode_Value> will return this number, otherwise <Barcode_Value> will return 0.
(All non-numerical characters will be removed before converting the barcode string into an integer or float value.)
<Barcode_Left_Value>, <Barcode_Front_Value>, <Barcode_Right_Value> If the plate barcode (read by the internal barcode readers of the PHERAstar FS) contain a valid integer or floating point number, this numeric variables will return this number, otherwise they will return 0.
(All non-numerical characters will be removed before converting the barcode string into an integer or float value.)
<Temp> current temperature of the incubator built into the reader (floating point value with 0.1 °C resolution)
Note: To use this variable it is necessary to switch the incubator on (R_Temp {n}) or to use the temperature monitoring function (R_Temp 0.1).
After Gain / Focus Adjustment:
<GainA> gain value for channel A obtained during gain adjustment
<GainB> gain value for channel B obtained during gain adjustment
<RawResultA> row result obtained during gain adjustment for channel A
<RawResultB> row result obtained during gain adjustment for channel B
<GainAdjWellColA> column of well with highest signal found during R_GainPlate (gain adjustment over the whole plate) for channel A
<GainAdjWellRowA> row of well with highest signal found during R_GainPlate for channel A
<GainAdjWellColB> column of well with highest signal found during R_GainPlate for channel B
<GainAdjWellRowB> row of well with highest signal found during R_GainPlate for channel B
<KFactor> K factor (fine adjustment between the two channels) obtained during R_GainWell or R_GetKFactor in fluorescence polarization mode (floating point value)
BMG LABTECH PHERAstar Software Manual – Part II: Control Software
2010-03-15 0470F0026A 127/138
<FocalHeight> optimum focal height obtained with R_FocusAdjust (focus adjustment) or with R_GainWell when using the focus adjustment option
<RawResult> row result obtained during focus adjustment for the used channel at the optimum focal height
Note: To convert a column and row value into a well name (e.g. column 5, row 3 => C5), use the function <WellName(Column, Row)>.
8.6.3 String System Variable
<Barcode_String> contains the barcode value, which was read by the BMG LABTECH Stacker last, in string format
Note: The command ID1:="<Barcode_String>" will take the barcode string available at the moment of execution of this script line as a value for plate ID 1. This value will not be changed before a new ID1:=... command appears.
Contrary to this command, the ID1:="<barcode>" command means, that the last available barcode string should always be used. The barcode value will be updated with every S_BarcodeData command (The S_BarcodeData command should be used after a S_PlateInB, S_GetPlateB or S_ReadBarcode command.).
<Barcode_Left_String>, <Barcode_Front_String>, <Barcode_Right_String> contain the barcode values, which where read by the internal barcode readers of the PHERAstar FS last, in string format
Note: The command ID1:="<Barcode_#####_String>" will take the barcode string available at the moment of execution of this script line as a value for plate ID 1. This value will not be changed before a new ID1:=... command appears.
Contrary to this command, the ID1:="<barcode_#####>" command means, that the last available barcode string should always be used. The barcode value will be updated with every R_BarcodeData command (The R_BarcodeData command should be used after a R_PlateInB command.).
<User> This system variable contains the name of the user currently logged in (see chapter 1).
<ProtocolPath> and <DataPath> These variables contain the path to the test protocol definition data base and the
path for storing the measurement data in dBase format (measurement data base). Before using the R_Run command (see chapter 8.4.5) these paths are the default paths belonging to the user currently logged in (as defined in the login screen or as selected using the 'Setup | Path' command, see chapter 1 and 3.7). If you use a R_Run command inside the script in combination with the optional path parameters (e.g. R_Run "FAST" "D:\My Files\PHERAstar\Definit" "D:\My Files\PHERAstar\ Data") afterwards these system variables will show the paths used for the last run command. These variables are especially useful in combination with the Call and Execute commands (see chapter 8.11).
Example: Execute "MergeReadings.exe <DataPath> <User> H ID1"
<ASCIIPath> This variable contains the current path for storing the measurement data in ASCII format (as defined using ‘Setup | Program Configuration | Save measurement data in ASCII format | Define format’, see chapter 3.5).
When using protocol specific output settings it contains the last used value (e.g. after a R_Run command).
<Ser_Number> This variable contains the serial number of the reader currently connected.
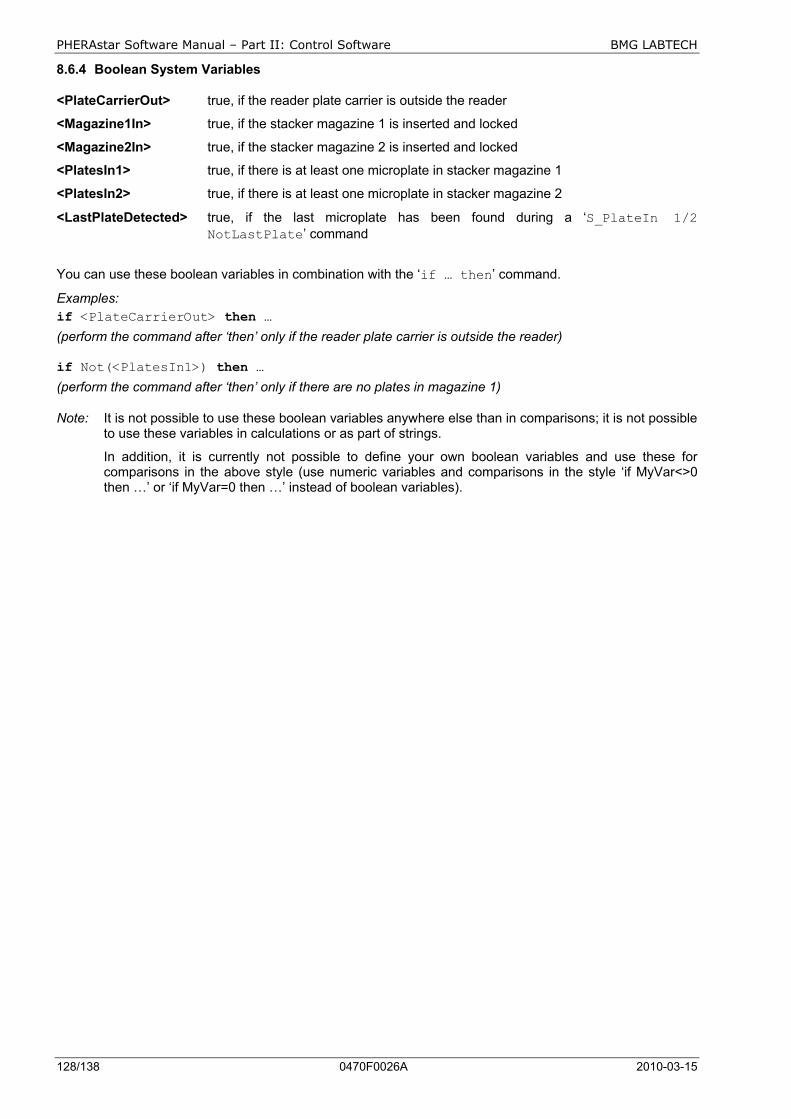
PHERAstar Software Manual – Part II: Control Software BMG LABTECH
128/138 0470F0026A 2010-03-15
8.6.4 Boolean System Variables
<PlateCarrierOut> true, if the reader plate carrier is outside the reader
<Magazine1In> true, if the stacker magazine 1 is inserted and locked
<Magazine2In> true, if the stacker magazine 2 is inserted and locked
<PlatesIn1> true, if there is at least one microplate in stacker magazine 1
<PlatesIn2> true, if there is at least one microplate in stacker magazine 2
<LastPlateDetected> true, if the last microplate has been found during a ‘S_PlateIn 1/2 NotLastPlate’ command
You can use these boolean variables in combination with the ‘if … then’ command.
Examples: if <PlateCarrierOut> then … (perform the command after ‘then’ only if the reader plate carrier is outside the reader)
if Not(<PlatesIn1>) then … (perform the command after ‘then’ only if there are no plates in magazine 1)
Note: It is not possible to use these boolean variables anywhere else than in comparisons; it is not possible to use these variables in calculations or as part of strings.
In addition, it is currently not possible to define your own boolean variables and use these for comparisons in the above style (use numeric variables and comparisons in the style ‘if MyVar<>0 then …’ or ‘if MyVar=0 then …’ instead of boolean variables).
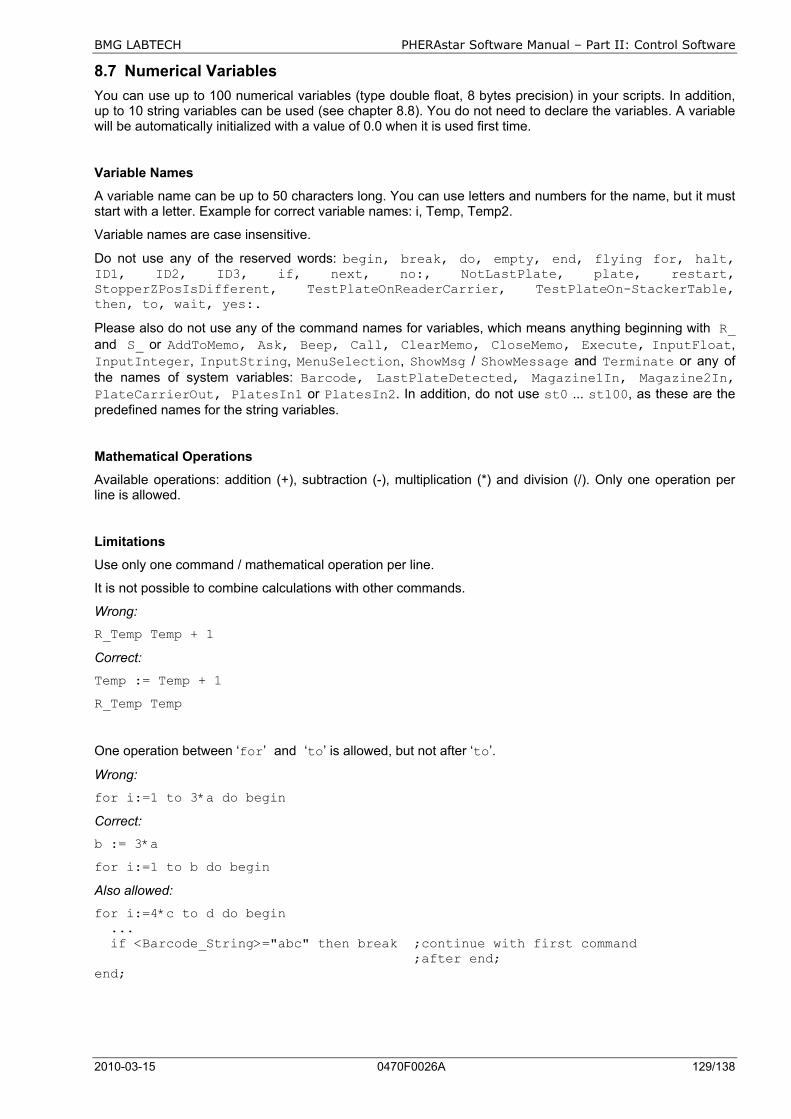
BMG LABTECH PHERAstar Software Manual – Part II: Control Software
2010-03-15 0470F0026A 129/138
8.7 Numerical Variables You can use up to 100 numerical variables (type double float, 8 bytes precision) in your scripts. In addition, up to 10 string variables can be used (see chapter 8.8). You do not need to declare the variables. A variable will be automatically initialized with a value of 0.0 when it is used first time.
Variable Names
A variable name can be up to 50 characters long. You can use letters and numbers for the name, but it must start with a letter. Example for correct variable names: i, Temp, Temp2.
Variable names are case insensitive.
Do not use any of the reserved words: begin, break, do, empty, end, flying for, halt, ID1, ID2, ID3, if, next, no:, NotLastPlate, plate, restart, StopperZPosIsDifferent, TestPlateOnReaderCarrier, TestPlateOn-StackerTable, then, to, wait, yes:.
Please also do not use any of the command names for variables, which means anything beginning with R_ and S_ or AddToMemo, Ask, Beep, Call, ClearMemo, CloseMemo, Execute, InputFloat, InputInteger, InputString, MenuSelection, ShowMsg / ShowMessage and Terminate or any of the names of system variables: Barcode, LastPlateDetected, Magazine1In, Magazine2In, PlateCarrierOut, PlatesIn1 or PlatesIn2. In addition, do not use st0 ... st100, as these are the predefined names for the string variables.
Mathematical Operations
Available operations: addition (+), subtraction (-), multiplication (*) and division (/). Only one operation per line is allowed.
Limitations
Use only one command / mathematical operation per line.
It is not possible to combine calculations with other commands.
Wrong:
R_Temp Temp + 1
Correct:
Temp := Temp + 1
R_Temp Temp
One operation between ‘for’ and ‘to’ is allowed, but not after ‘to’.
Wrong:
for i:=1 to 3*a do begin
Correct:
b := 3*a
for i:=1 to b do begin
Also allowed:
for i:=4*c to d do begin ... if <Barcode_String>="abc" then break ;continue with first command ;after end; end;

PHERAstar Software Manual – Part II: Control Software BMG LABTECH
130/138 0470F0026A 2010-03-15
8.7.1 Converting Numerical Values into String Values
To use a numerical value as part of a string value, e.g. for the test name parameter of the R_Run command, you need to use the <IntToStr(n)> or <FloatToStr(n)> conversion function.
Examples:
for i:=1 to NoOfRuns do begin R_Run "Test <IntToStr(i)>" end;
Temp:=36.5 st1:=”<FloatToStr(Temp)>"
When the variable n contains a real number, <IntToStr(n)> will return the integer part of n; that is, n rounded toward zero, and then converted into a string.
<FloatToStr(n)> will return the real number converted into a string.
For example X:=2.5 ID1:="Plate <IntToStr(X)>" ID2:="Plate <FloatToStr(X)>"
will result in ID1=Plate 2 and ID2=Plate 2.5.
You can use the <IntToStr(n)> and <FloatToStr(n)> functions in your scripts on all places where a string is used. These functions need to be inserted inside the quotation marks.
8.8 String Variables You can use up to 10 string variables in your scripts. The name of these variables need to start with ‘st’ followed by a number ‘0’... ‘100’ (st0, st1, ... st100). You do not need to declare the variables. The string variables will be initialized with an empty string.
To assign a value to a string variable you can use string constants, string variables, numerical variables or any combination of these.
Examples: st1:=”This is a string.” st2:=”Current temperature: <Temp>°C” st3:=”<st1> <st2>” st4:=”The value of n is ” n ”.” or st4:=”The value of n is <FloatToStr(n)>.” st5:=”The barcode label is <Barcode_String>.”
You can use a string variable for all commands where a string parameter is expected. You need to enter the name of the string variable in <brackets> inside the quotation marks.
Examples: ShowMsg ”<st3>!” info R_Run ”<st4>”
It is also possible, to compare strings.
Examples: if st1=”value” then halt if st2<>st3 then R_Run ”TOMS TEST”
Note: Everything, which can be done with string variables, can also be done with the three plate identifiers
ID1 ... ID3. The only difference is, that you can use some special functions for the plate IDs, as for example ID1:=”Date: <date>” (see chapter 6.4 Plate Identification).

BMG LABTECH PHERAstar Software Manual – Part II: Control Software
2010-03-15 0470F0026A 131/138
8.9 Measurement Data 8.9.1 R_GetData
To get access to the measurement data you can use the R_GetData command. This is useful, if you want to perform different actions in your script depending on the measurement values.
Syntax:
Variable := R_GetData {well name} {cycle/interval} {chromatic} {channel}
or
Variable := R_GetData {well column} {well row} {cycle/interval} {chromatic} {channel}
When the well name is computed (e.g. inside a loop) the numeric version is easier to use, but the alphanumeric version is easier to read. When using the alphanumeric version, the well name is case sensitive (the rows in 1536 well plates are named A…Z and a…f; in 3456 well plates A…Z and a…v).
The cycle/interval, the chromatic and the channel parameters are optional. If you do not specify these parameters, cycle/interval 1, chromatic 1 and channel A will be used.
Examples:
Value:=R_GetData "A1" 1 2 “B” Get the measurement value for well A1, cycle 1, chromatic 2, channel B.
Value:=R_GetData "B09" 3 Get the measurement value for well B9, cycle 3, chromatic 1, channel A.
Value:=R_GetData 4 5 3 Get the measurement value for well E4, cycle 3, chromatic 1, channel A.
Value:=R_GetData "a12" Get the measurement value for well a12 (1536 well plate), cycle 1, chromatic 1, channel A.
Note: The R_GetData command uses the dBase format measurement files and will therefore only work if the ‘Save measurement data in dBase format’ option has not been switched off (menu command ‘Setup | Program Configuration’)!
8.9.2 R_GetRawDataFileNumber
To get the file number (= name) of the latest raw data file (<Number>.dbf), you can use the R_GetRawDataFileNumber command. This might be useful in combination with the call of an external program (see chapter 8.11), which performs some operations with the measurement data, e.g. a merge of different measurement runs into a single run. Optionally it is possible to specify a data path for this command as parameter. If you do not specify the path, this command will return the last raw data file number from the Measure.dbf which was used during the last R_Run command or (if there was no R_Run command inside the script before using the R_GetRawDataFileNumber command) from the Measure.dbf inside the current measurement data path (see <DataPath> in chapter 8.6.3).
Syntax:
Variable := R_GetRawDataFileNumber {(Path to measurement data)}
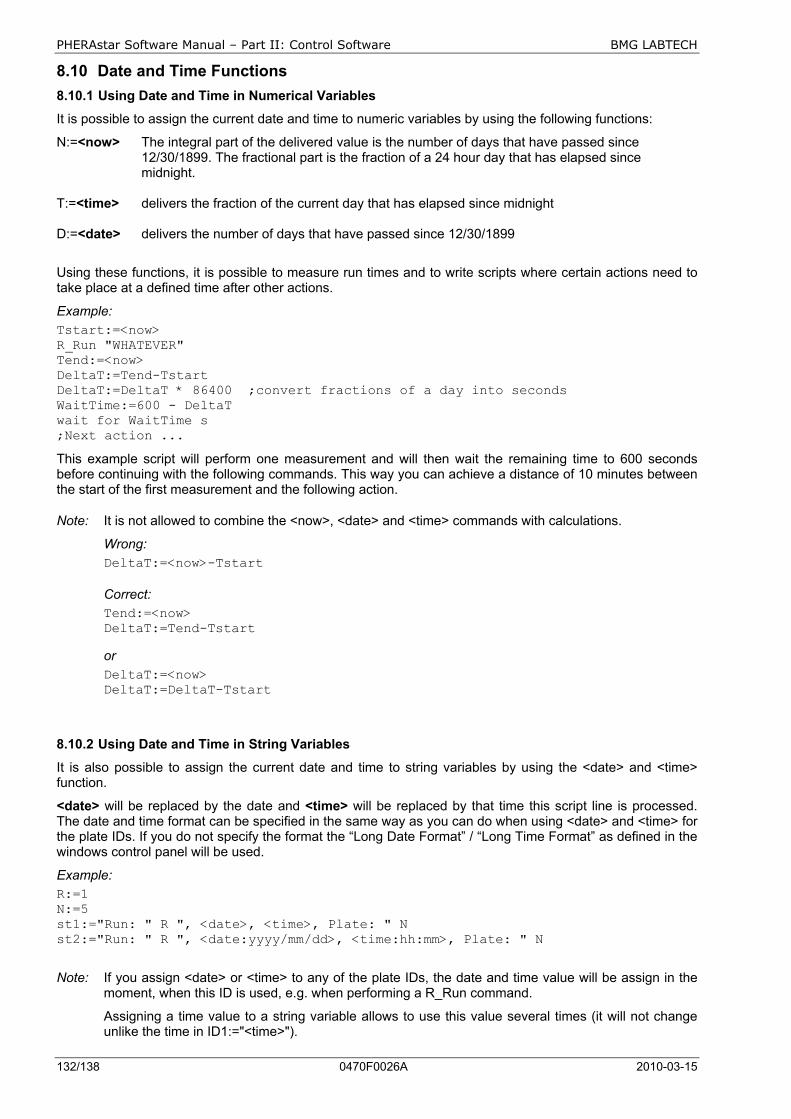
PHERAstar Software Manual – Part II: Control Software BMG LABTECH
132/138 0470F0026A 2010-03-15
8.10 Date and Time Functions 8.10.1 Using Date and Time in Numerical Variables
It is possible to assign the current date and time to numeric variables by using the following functions:
N:=<now> The integral part of the delivered value is the number of days that have passed since 12/30/1899. The fractional part is the fraction of a 24 hour day that has elapsed since midnight.
T:=<time> delivers the fraction of the current day that has elapsed since midnight D:=<date> delivers the number of days that have passed since 12/30/1899
Using these functions, it is possible to measure run times and to write scripts where certain actions need to take place at a defined time after other actions.
Example: Tstart:=<now> R_Run "WHATEVER" Tend:=<now> DeltaT:=Tend-Tstart DeltaT:=DeltaT * 86400 ;convert fractions of a day into seconds WaitTime:=600 - DeltaT wait for WaitTime s ;Next action ...
This example script will perform one measurement and will then wait the remaining time to 600 seconds before continuing with the following commands. This way you can achieve a distance of 10 minutes between the start of the first measurement and the following action.
Note: It is not allowed to combine the <now>, <date> and <time> commands with calculations.
Wrong: DeltaT:=<now>-Tstart
Correct: Tend:=<now> DeltaT:=Tend-Tstart
or DeltaT:=<now> DeltaT:=DeltaT-Tstart
8.10.2 Using Date and Time in String Variables
It is also possible to assign the current date and time to string variables by using the <date> and <time> function.
<date> will be replaced by the date and <time> will be replaced by that time this script line is processed. The date and time format can be specified in the same way as you can do when using <date> and <time> for the plate IDs. If you do not specify the format the “Long Date Format” / “Long Time Format” as defined in the windows control panel will be used.
Example: R:=1 N:=5 st1:="Run: " R ", <date>, <time>, Plate: " N st2:="Run: " R ", <date:yyyy/mm/dd>, <time:hh:mm>, Plate: " N
Note: If you assign <date> or <time> to any of the plate IDs, the date and time value will be assign in the moment, when this ID is used, e.g. when performing a R_Run command.
Assigning a time value to a string variable allows to use this value several times (it will not change unlike the time in ID1:="<time>").
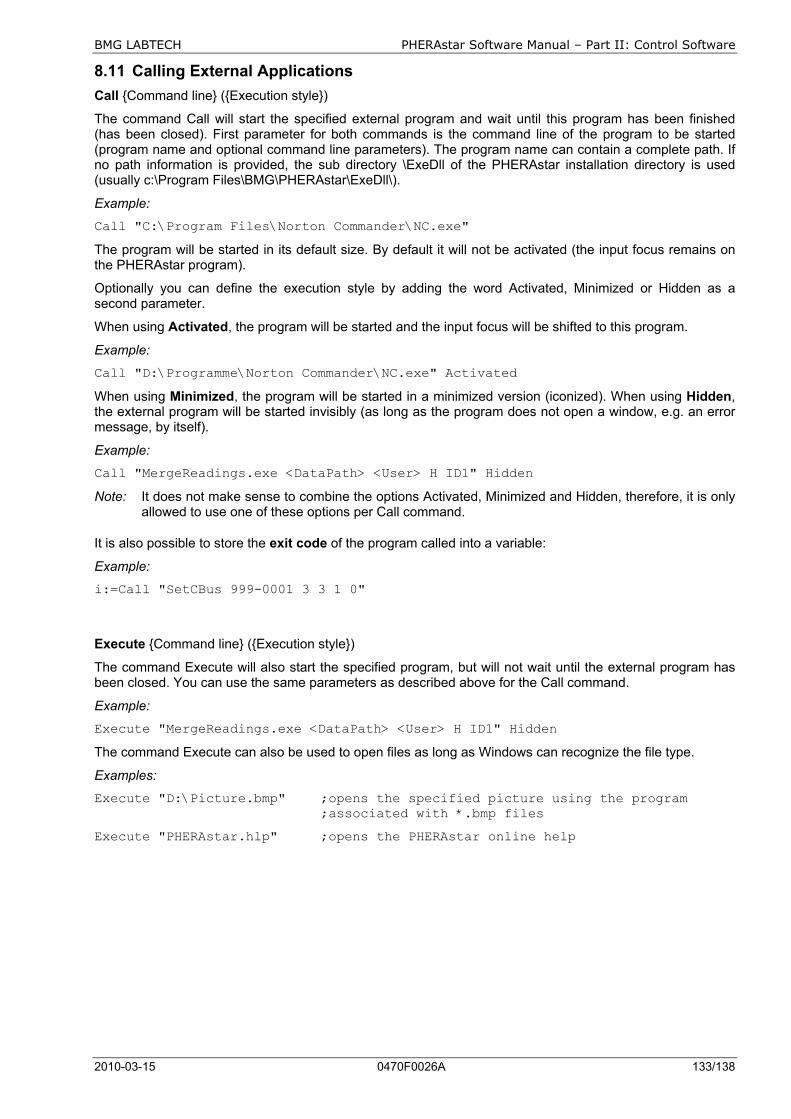
BMG LABTECH PHERAstar Software Manual – Part II: Control Software
2010-03-15 0470F0026A 133/138
8.11 Calling External Applications Call {Command line} ({Execution style})
The command Call will start the specified external program and wait until this program has been finished (has been closed). First parameter for both commands is the command line of the program to be started (program name and optional command line parameters). The program name can contain a complete path. If no path information is provided, the sub directory \ExeDll of the PHERAstar installation directory is used (usually c:\Program Files\BMG\PHERAstar\ExeDll\).
Example:
Call "C:\Program Files\Norton Commander\NC.exe"
The program will be started in its default size. By default it will not be activated (the input focus remains on the PHERAstar program).
Optionally you can define the execution style by adding the word Activated, Minimized or Hidden as a second parameter.
When using Activated, the program will be started and the input focus will be shifted to this program.
Example:
Call "D:\Programme\Norton Commander\NC.exe" Activated
When using Minimized, the program will be started in a minimized version (iconized). When using Hidden, the external program will be started invisibly (as long as the program does not open a window, e.g. an error message, by itself).
Example:
Call "MergeReadings.exe <DataPath> <User> H ID1" Hidden
Note: It does not make sense to combine the options Activated, Minimized and Hidden, therefore, it is only allowed to use one of these options per Call command.
It is also possible to store the exit code of the program called into a variable:
Example:
i:=Call "SetCBus 999-0001 3 3 1 0"
Execute {Command line} ({Execution style})
The command Execute will also start the specified program, but will not wait until the external program has been closed. You can use the same parameters as described above for the Call command.
Example:
Execute "MergeReadings.exe <DataPath> <User> H ID1" Hidden
The command Execute can also be used to open files as long as Windows can recognize the file type.
Examples:
Execute "D:\Picture.bmp" ;opens the specified picture using the program ;associated with *.bmp files
Execute "PHERAstar.hlp" ;opens the PHERAstar online help
PHERAstar Software Manual – Part II: Control Software BMG LABTECH
134/138 0470F0026A 2010-03-15
9 Known Problems and Solutions 1. Disabled Plate In / Out Buttons 2. Access Rights Problems For solutions see the following chapters.
9.1 Disabled Plate In / Out Buttons
If the plate button ( ) is disabled and there is no test run active and the communication to the reader is OK, then it is most likely that there is an incorrect setting in the configuration file ‘~\Program Files\BMG\PHERAstar\PHERAstar.ini’. The value behind ´DisablePlateCmds=´ should be ´False´. This parameter will be set to ´True´ if the reader is connected to a robotic/stacker system and the plate in/out movement will be controlled only using the robotic software.
9.2 Access Rights 9.2.1 File Access Permissions
Microsoft changed the default access permissions for all program files newly installed. In all Windows versions before Windows 2000, any standard user has access to the files installed using a standard installation program. Beginning with Windows 2000, a normal user (non-power user) has only read access by default. As we store important information in data base files, all users of the BMG LABTECH software need to have write access to certain files in the program directory (usually ~\Program Files\BMG\PHERAstar).
If you have used the option ‘Program should be usable also for non power users’ during installation (see Software manual part I), the write access rights to the necessary files will be set during the installation. If you did not use this option or if you have added new users / user groups after installation, the following error might appear:
Solution
Logon as administrator (or user with administrative rights).
Run the program ‘SetPermission’ from the PHERAstar CD-ROM (folder ~:\PHERAstar Vx.xx\).
Alternatively, you can also manually change the permissions: Open the Windows Explorer and right-click the folder where the BMG LABTECH software is installed (usually ~:\Program Files\BMG\PHERAstar). Choose ‘Properties’, then ‘Security’. Check the ‘Modify’ permission, ‘Write’ permission will be checked automatically. Uncheck the box ‘Allow inheritable permissions from parent to propagate to this object’. Now all users should be able to write to the BMG LABTECH directory and work with the software.
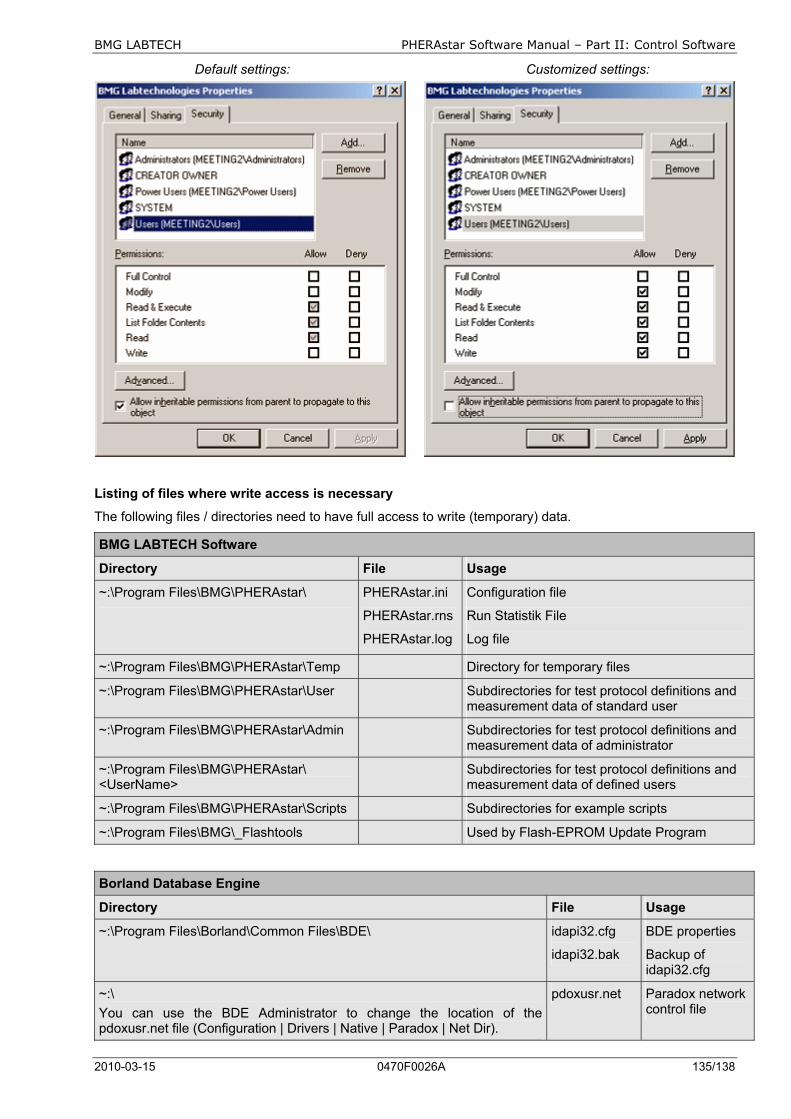
BMG LABTECH PHERAstar Software Manual – Part II: Control Software
2010-03-15 0470F0026A 135/138
Default settings: Customized settings:
Listing of files where write access is necessary
The following files / directories need to have full access to write (temporary) data.
BMG LABTECH Software
Directory File Usage
~:\Program Files\BMG\PHERAstar\ PHERAstar.ini
PHERAstar.rns
PHERAstar.log
Configuration file
Run Statistik File
Log file
~:\Program Files\BMG\PHERAstar\Temp Directory for temporary files
~:\Program Files\BMG\PHERAstar\User Subdirectories for test protocol definitions and measurement data of standard user
~:\Program Files\BMG\PHERAstar\Admin Subdirectories for test protocol definitions and measurement data of administrator
~:\Program Files\BMG\PHERAstar\ <UserName>
Subdirectories for test protocol definitions and measurement data of defined users
~:\Program Files\BMG\PHERAstar\Scripts Subdirectories for example scripts
~:\Program Files\BMG\_Flashtools Used by Flash-EPROM Update Program
Borland Database Engine
Directory File Usage
~:\Program Files\Borland\Common Files\BDE\ idapi32.cfg
idapi32.bak
BDE properties
Backup of idapi32.cfg
~:\ You can use the BDE Administrator to change the location of the pdoxusr.net file (Configuration | Drivers | Native | Paradox | Net Dir).
pdoxusr.net Paradox network control file
PHERAstar Software Manual – Part II: Control Software BMG LABTECH
136/138 0470F0026A 2010-03-15
9.2.2 Registry Access
There are two places in the registry where the BMG LABTECH software stores information:
All user specific parameters like program settings (e.g. the program window position or current state display options), are stored in the registry part HKEY_CURRENT_USER. There are no access problems to this part.
All settings which are important for all users like the selected communication port or reading mode, are stored in the HKEY_LOCAL_MACHINE part of the registry (as this part of the registry is intended for non-user specific information). For unintelligible reasons, Microsoft changed the default access permissions for this part of the registry beginning with Windows 2000. On all Windows versions before Windows 2000, every user has read and write access to this general information part of the local registry, beginning with version 2000 a standard user (non-power user), by default, only gets read access to newly generated keys in this part of the Windows registry.
This access limitation can cause the Error: ‘0509: The program has not been correctly installed or you are using W2000/XP without appropriate registry access rights.’ at program start if you did not use the option ‘Program should be usable also for non power users’ during installation (see Software manual part I).
Solution
• Logon as Administrator (or a user with administrative rights).
• Run the program ‘SetPermission’ from the PHERAstar CD-ROM (folder ~:\PHERAstar Vx.xx\Installation from CD-ROM\).
or • Start the program ‘Regedit’ (Windows 2000: ‘Regedt32’, use the ‘Run’ from windows start menu).
• Go to ‘HKEY_LOCAL_MACHINE\Software\BMG Labtechnologies’.
• Select ‘Permissions’.
• Add read and write rights for everyone to this key and all sub keys.

BMG LABTECH PHERAstar Software Manual – Part II: Control Software
2010-03-15 0470F0026A 137/138
9.3 Run Log Window The Run Log window shows all commands sent to the PHERAstar and all responses. You can open the Run Log window using the key combination [Shift]+[Ctrl]+[L] from the program main window.
It is possible to stop the process of adding new entries to the run log by checking the ‘Stop’ checkbox. You can print the entire run log or a marked part of the run log.
9.3.1 Search Function
It is possible to search the log window forward or backward beginning from the cursor position or from the top / end of the text.
The following key combinations can be used to activate the search function:
1. Borland Style: To open the search parameters window use [Ctrl]+[Q], [F], to repeat the last search (in the defined search direction) use [Ctrl]+[L]. Use [Shift]+[Ctrl]+[L] to search against the defined direction, e.g. to go back to the previous occurrence.
2. Microsoft Style: To open the search parameters window use [Ctrl]+[F], to search the next occurrence in forward direction use [F3], for backward direction use [Shift]+[F3].
If you select something before using the [Ctrl]+[Q], [F] / [Ctrl]+[F] key combination this selection will be used as default search string, otherwise if the cursor is positioned onto a word (something containing letters, not just hexadecimal numbers) this word will be taken as default value.
Note: Searching something, which includes line breaks, is not possible. You might change the width of the Run Log window to remove soft line breaks.
9.3.2 Run Log File
The run log will automatically be saved into the file ‘PHERAstar.log’ in the PHERAstar main directory (usually ‘~\Program Files\BMG\PHERAstar\’). You can switch off the generation of the run log file by changing the line ‘RunLog=true’ in the configuration file ‘~\Program Files\BMG\PHERAstar\ PHERAstar.ini’ (section [Debug]) into ‘RunLog=false’.
Note: At the next program start the existing content of this file will be erased. Whenever you need support from BMG LABTECH due to a software / firmware malfunction you should send us the log file together with a description of the nature of the problem.
PHERAstar Software Manual – Part II: Control Software BMG LABTECH
138/138 0470F0026A 2010-03-15
10 Support If you have any problems / questions regarding the software / the instruments, you should visit our web page (http://www.bmglabtech.com) and read the information on the Support page. If you can not find an answer there, please contact BMG LABTECH using the following email addresses:
• Problems / questions regarding software: [email protected]
• Problems / questions regarding the instruments: [email protected]
You can also use our on-line bug report form: http://www.bmglabtech.com/support
Note: When you need support from BMG LABTECH due to a software / firmware malfunction, you should send us the run log file (see chapter 9.3.2) together with the error description.