000 Light ENG rev6 20160901 - Yonsei Universityphylab.yonsei.ac.kr/exp_ref/209_Light_ENG.pdf · and...
15
General Physics Lab (International Campus) Department of PHYSICS YONSEI University Lab Manual Interference and Diffraction of Light Ver.20160901 Lab Office (Int’l Campus) Room 301, Building 301 (Libertas Hall B), Yonsei University 85 Songdogwahak-ro, Yeonsu-gu, Incheon 21983, KOREA (☏ +82 32 749 3430) Page 1 / 15 [International Campus Lab] Interference and Diffraction of Light Observe interference and diffraction patterns for various slits and diffraction gratings, and find the wavelengths of laser sources. Interference and diffraction are the phenomena to show the wave nature of light. Interference phenomena occur when two or more waves combine. The colors seen in oil films and soap bubbles are a result of interference between light re- flected from the front and back surfaces of a thin film of oil or soap solution. When light falls on a straightedge and casts a shadow, the edge of the shadow is never perfectly sharp. Some light ap- pears in the area that we expect to be in the shadow, and we find alternating bright and dark fringes in the illuminated area, as in Fig. 4. Such effects are referred to as diffraction. There is no specific, important physical difference between interfer- ence and diffraction. However, diffraction commonly means the result from the interference of an infinite number of waves emitted by a continuous distribution of source points. 1. Interference Interference is a phenomenon in which two or more waves superpose to form a resultant wave of greater or lower ampli- tude. When waves from two sources arrive at point in phase, as in Fig. 1(a), they reinforce each other. The amplitude of the resultant wave is the sum of the amplitudes of the individual waves. This is called constructive interference. Waves from the two sources arrive at point exactly a half-cycle out of phase, as in Fig. 1(b). A crest of one wave meets a trough of the other wave. The resultant amplitude is the difference be- tween the two individual amplitudes. This cancellation is called destructive interference. Fig. 1 Conditions for constructive and destructive interference. Objective Theory ----------------------------- Reference -------------------------- Young & Freedman, University Physics (14 th ed.), Pearson, 2016 35.1 Interference and Coherent Sources (p.1184~1187) 35.2 Two-Source Interference of Light (p.1188~1191) 36.2 Diffraction from a Single Slit (p.1212~1215) 36.3 Intensity in the Single-Slit Pattern (p.1215~1219) 36.4 Multiple Slits (p.1219~1221) 36.5 The Diffraction Grating (p.1221~1225) -----------------------------------------------------------------------------
Transcript of 000 Light ENG rev6 20160901 - Yonsei Universityphylab.yonsei.ac.kr/exp_ref/209_Light_ENG.pdf · and...

General Physics Lab (International Campus) Department of PHYSICS YONSEI University
Lab Manual
Interference and Diffraction of LightVer.20160901
Lab Office (Int’l Campus)
Room 301, Building 301 (Libertas Hall B), Yonsei University 85 Songdogwahak-ro, Yeonsu-gu, Incheon 21983, KOREA (☏ +82 32 749 3430) Page 1 / 15
[International Campus Lab]
Interference and Diffraction of Light
Observe interference and diffraction patterns for various slits and diffraction gratings, and find the wavelengths of laser sources.
Interference and diffraction are the phenomena to show the
wave nature of light. Interference phenomena occur when
two or more waves combine. The colors seen in oil films and
soap bubbles are a result of interference between light re-
flected from the front and back surfaces of a thin film of oil or
soap solution.
When light falls on a straightedge and casts a shadow, the
edge of the shadow is never perfectly sharp. Some light ap-
pears in the area that we expect to be in the shadow, and we
find alternating bright and dark fringes in the illuminated area,
as in Fig. 4. Such effects are referred to as diffraction. There
is no specific, important physical difference between interfer-
ence and diffraction. However, diffraction commonly means
the result from the interference of an infinite number of waves
emitted by a continuous distribution of source points.
1. Interference
Interference is a phenomenon in which two or more waves
superpose to form a resultant wave of greater or lower ampli-
tude.
When waves from two sources arrive at point in phase,
as in Fig. 1(a), they reinforce each other. The amplitude of the
resultant wave is the sum of the amplitudes of the individual
waves. This is called constructive interference. Waves from
the two sources arrive at point exactly a half-cycle out of
phase, as in Fig. 1(b). A crest of one wave meets a trough of
the other wave. The resultant amplitude is the difference be-
tween the two individual amplitudes. This cancellation is
called destructive interference.
Fig. 1 Conditions for constructive and destructive interference.
Objective
Theory
----------------------------- Reference --------------------------
Young & Freedman, University Physics (14th ed.), Pearson, 2016
35.1 Interference and Coherent Sources (p.1184~1187)
35.2 Two-Source Interference of Light (p.1188~1191)
36.2 Diffraction from a Single Slit (p.1212~1215)
36.3 Intensity in the Single-Slit Pattern (p.1215~1219)
36.4 Multiple Slits (p.1219~1221)
36.5 The Diffraction Grating (p.1221~1225)
-----------------------------------------------------------------------------
General Physics Lab (International Campus) Department of PHYSICS YONSEI University
Lab Manual
Interference and Diffraction of LightVer.20160901
Lab Office (Int’l Campus)
Room 301, Building 301 (Libertas Hall B), Yonsei University 85 Songdogwahak-ro, Yeonsu-gu, Incheon 21983, KOREA (☏ +82 32 749 3430) Page 2 / 15
Interference effects are most easily seen when we combine
waves from monochromatic sources of the same frequency
and with a constant phase relationship. We use the term co-
herent light to refer to the light waves emitted by two such
sources.
One of the earliest quantitative experiments to reveal the
interference of light from two sources was performed in 1800
by Thomas Young. Young’s apparatus is shown in perspec-
tive in Fig. 2. A light source emits monochromatic light; how-
ever, this light is not suitable for use in an interference exper-
iment because emissions from different parts of an ordinary
source are not synchronized. To remedy this, the light is di-
rected at a screen with a narrow slit . The light emerging
from the slit originated from only a small region of the light
source; thus behaves more nearly like the idealized
source. (In this experiment, a laser is used as a source of
coherent light, and isn’t needed.) The light from falls
on slits and . Cylindrical wave fronts spread out from
and reach and in phase because they travel equal
distances from . The waves emerging from and are
therefore also always in phase, so and are coherent
sources. The interference of waves from and produc-
es a pattern in space.
Fig. 2 (a) Young’s experiment to show interference of light passing through two slits. (b) Geometrical analysis of Young’s experiment. (c) Approximate geometry when the distance to the screen is much greater than the distance between the slits.
We assume that the distance from the slits to the screen
is so large in comparison to the distance between the slits
that the lines from and to are very nearly parallel,
as in Fig. 2(c). The difference in path length is then given by
sin (1)
Constructive interference occurs at points where the path
difference is an integral number of wavelength, . So the
bright regions on the screen in Fig. 2(a) occur at angle for
which
sin 0, 1, 2, … (2)
Similarly, destructive interference occurs at points for which
the path difference is a half-integral number of wavelengths.
sin12
0, 1, 2, … (3)
Thus the pattern on the screen is a succession of bright and
dark bands parallel to the slits. The intensity at any point can
be expressed in terms of the maximum intensity .
cos2
2
sin (3)
Fig. 3 (a) Photograph of interference fringes produced on a
screen in Young’s double-slit experiment. (b) Intensity distribution in the interference pattern from two identical slits.

General Physics Lab (International Campus) Department of PHYSICS YONSEI University
Lab Manual
Interference and Diffraction of LightVer.20160901
Lab Office (Int’l Campus)
Room 301, Building 301 (Libertas Hall B), Yonsei University 85 Songdogwahak-ro, Yeonsu-gu, Incheon 21983, KOREA (☏ +82 32 749 3430) Page 3 / 15
2. Diffraction from a single slit
Diffraction occurs when light strikes a barrier that has an
aperture or an edge. Fig. 4 shows an example of diffraction.
The phenomenon of diffraction can be understood using the
Huygens’s principle, which states that every point on a wave
front acts a source of secondary spherical waves. When the
waves pass through an aperture, each infinitesimal part of the
aperture acts as a source of waves, as shown in Fig. 5(a),
and the resulting pattern of light and dark is a result of inter-
ference among the waves emanating from these sources.
Fig. 4 An example of diffraction
Fig. 5 Diffraction by a single rectangular slit. The long sides of the slit are perpendicular to the figure.
Consider two narrow strips, one just below the top edge of
the slit and one at its center, shown in end view in Fig. 6. The
difference in path length to is 2⁄ sin . If this is equal to
2⁄ , cancellation occurs at . Similarly, the light from every
strip in the top half cancels out the light from a corresponding
strip in the bottom half. Hence a dark fringe occurs whenever
2sin
2or sin (4)
We may also divide the slit into quarters, sixths, and so on,
and use the above argument to show that a dark fringe oc-
curs whenever sin 2 ⁄ , 3 ⁄ , and so on. Thus the
condition for a dark fringe is
sin 1, 2, 3, … (5)
Note that sin 0 0 corresponds to a bright band; in
this case, light from the entire slit arrives at in phase. The
central bright fringe is wider than the others, as Fig. 7. From
Eq. (5) and Fig. 6, we obtain sin ⁄ . If is
much smaller than , is so small that the approximation
sin tan ⁄ is a very good one, and is
∙ ≪ (6)
where is the distance from slit to screen and is the
vertical distance of the th dark band from the center.
Fig. 6 Side view of a horizontal slit. When the distance to the screen is much greater than the slit width , the rays from a distance 2⁄ apart may be consid-ered parallel.

General Physics Lab (International Campus) Department of PHYSICS YONSEI University
Lab Manual
Interference and Diffraction of LightVer.20160901
Lab Office (Int’l Campus)
Room 301, Building 301 (Libertas Hall B), Yonsei University 85 Songdogwahak-ro, Yeonsu-gu, Incheon 21983, KOREA (☏ +82 32 749 3430) Page 4 / 15
Fig. 7 shows the diffraction pattern of a single slit. The inten-
sity in single-slit diffraction in terms of the angle is
sin 2⁄
2⁄
2sin (7)
From Eqs. (5) or (7), sin ⁄ . Thus the width of the cen-
tral maximum becomes wider when the slit width decreas-
es, as shown in Fig. 8.
Fig. 7 Intensity versus angle and photograph of the Fraun-hofer pattern in single-slit diffraction.
Fig. 8 The single-slit diffraction pattern depends on the ratio of the slit width to the wavelength .
3. Two Slits of Finite Width
In Figs. 2 and 3 we analyzed interference from two very
narrow slits and . In this analysis we ignored effects
due to the finite (nonzero) slit width. In the more realistic case
in which the slits have finite width, the peaks in the two-slit
interference pattern are modulated by the single slit diffraction
pattern characteristic of the width of each slit.
Fig. 9(a) shows the intensity in a single-slit diffraction pattern
with slit width . The diffraction minima are labeled by the
integer 1, 2, …. Fig. 9(b) shows the pattern formed
by two very narrow slits with distance 4 between slits.
The interference maxima are labeled by the integer
0, 1, 2, ….
Suppose we widen each of the narrow slits forming the pat-
tern of Fig. 9(b) to the same width as that of the single slit
in Fig. 9(a). Then the intensities of the two-slit peaks are
modulated by the single-slit pattern, which acts as an enve-
lope for the intensity function, as in Fig. 9(c). So the intensity
in Fig. 9(c) is proportional to the product of Eqs. (3) and (7):
cos2sin 2⁄
2⁄ (8)
2
sin 2
sin
Fig. 9 Finding the intensity pattern for two slits of finite width.

General Physics Lab (International Campus) Department of PHYSICS YONSEI University
Lab Manual
Interference and Diffraction of LightVer.20160901
Lab Office (Int’l Campus)
Room 301, Building 301 (Libertas Hall B), Yonsei University 85 Songdogwahak-ro, Yeonsu-gu, Incheon 21983, KOREA (☏ +82 32 749 3430) Page 5 / 15
4. Several Slits and Diffraction Grating
Fig. 10 shows an array of several narrow slits, with distance
between adjacent slits. Constructive interference occurs for
rays at angle to the normal that arrive at point with a
path difference between adjacent slits equal to an integer
number of wavelengths:
sin 0, 1, 2, … (9)
Fig 10 Multiple-slit diffraction.
Fig. 11 Interference patterns for equally spaced, very narrow slits. (a) Two slits. (b) Eight slits. (c) Sixteen slits. The vertical scales are different for each other.
is the maximum intensity for a single slit, and the maximum intensity for slits is . The width of each peak is proportional to 1⁄ .
Equation (9) shows that the maxima in the pattern occur at
the same positions as for two slits with the same spacing.
However, while there is exactly one intensity minimum be-
tween each pair of maxima in the two-slit pattern, there are
not the only minima in the multiple-slit pattern, as in Fig. 11.
For example, the intensity with eight slits is zero whenever
the phase difference is an integer multiple of 4⁄ , except
when is a multiple of 2 (Fig. 12). Thus there are seven
minima for every maximum as in Fig. 11(b).
When there are slits, there are 1 minima between
each pair of principal maxima. The height of each principal
maximum is proportional to and the width of each maxi-
mum is proportional to 1⁄ . Increasing the number of slits
with keeping the spacing of adjacent slits constant gives in-
terference patterns progressively narrower, so their angular
position can be measured to very high precision.
An array of a large number of slits is called a diffraction
grating. When a grating is illuminated by light, the pattern is
a series of very sharp lines at angle determined by Eq. (9).
So diffraction gratings are widely used to measure the spec-
trum of light emitted by a source.
Fig. 12 Phasor diagrams for light passing through eight narrow slits. Intensity maxima occur when the phase difference 0, 2π, 4π,…. Between the maxima at
0 and 2π are seven minima, correspond-ing to 4⁄ , 2⁄ , 3 4⁄ , , 5 4⁄ , 3 2⁄ , and 7 4⁄ .

General Physics Lab (International Campus) Department of PHYSICS YONSEI University
Lab Manual
Interference and Diffraction of LightVer.20160901
Lab Office (Int’l Campus)
Room 301, Building 301 (Libertas Hall B), Yonsei University 85 Songdogwahak-ro, Yeonsu-gu, Incheon 21983, KOREA (☏ +82 32 749 3430) Page 6 / 15
1. List
Item(s) Qty. Description
PC / Capstone software
1 Records, displays and analyzes the data measured by
various sensors.
Interface
1
Data acquisition interface designed for use with various
sensors, including power supplies which provide up to
15 watts of power.
Rotary Motion Sensor
1
Measures angles, angular velocities, etc. of a rotational
motion, and using additional accessories, measures
position, velocities. etc. of a linear motion.
Light Sensor
(Post and DIN Cable included)
1 set Measures relative light intensity.
Laser sources
(Power Adaptor included)
1 set
Emits light with a very narrow spectrum.
Red : 650nm
Green : 532 nm
Optics Bench 1 Provides stable support for holders.
Holder
Mount
(Two Thumbscrews included)
2 sets Provides stable support for optical components.
Linear Stage (Thumbscrew & Square Nut, Two Thumbscrews (for fixing Rack) included)
1 Builds a linear positioning mechanism for scanning the
light intensity of interference patterns.
Rack
1
Converts a linear motion to a rotational motion in com-
bination with the pinion gear inside the Rotary Motion
Sensor.
Equipment

General Physics Lab (International Campus) Department of PHYSICS YONSEI University
Lab Manual
Interference and Diffraction of LightVer.20160901
Lab Office (Int’l Campus)
Room 301, Building 301 (Libertas Hall B), Yonsei University 85 Songdogwahak-ro, Yeonsu-gu, Incheon 21983, KOREA (☏ +82 32 749 3430) Page 7 / 15
Items Qty. Description
Aperture Bracket
1 Acts as a mask and holder for the Light Sensor.
Slits
1 Contains several slits.
Diffraction Grating
1 set An array of a large number of parallel slits
Line spacing: 300 lines/mm, 600lines/mm
Ruler Screen
1 Black screen for observing interference patterns of dif-
fraction gratings.
2. Details
(1) Rotary Motion Sensor
The Rotary Motion Sensor is a bidirectional angle sensor
designed to measure rotational or linear position, velocity
and acceleration. (Refer to the manual of the magnetic field
experiment.)
(2) Light Sensor
The Light Sensor makes measurements of relative light
intensity using Si PIN photodiode. It is responsive across a
wide spectrum ranging from 320nm through 1100nm.
(3) Aperture Mask / Slits
Aperture Mask: narrow 1 → 6 wide
Slits:
Slit Width mm / Separation mm
Single Slits 0.02 0.04 0.08 0.16
Variable S.S. 0.02 ~ 0.20
Double Slits 0.04 / 0.25 0.04 / 0.50 0.08 / 0.25 0.08 / 0.50
Variable D.S. 0.04 / 0.125 ~ 0.75
(4) Diffraction Grating
300lines/mm, 600lines/mm

General Physics Lab (International Campus) Department of PHYSICS YONSEI University
Lab Manual
Interference and Diffraction of LightVer.20160901
Lab Office (Int’l Campus)
Room 301, Building 301 (Libertas Hall B), Yonsei University 85 Songdogwahak-ro, Yeonsu-gu, Incheon 21983, KOREA (☏ +82 32 749 3430) Page 8 / 15
Setup1. Equipment Setup
(1) Mount the Linear Stage on the left end of the optics bench
Insert the square nut in the center hole of the Linear Stage
into the T-slot located along the center of the Optics Bench.
Tighten the thumbscrew to secure the Linear Stage in posi-
tion.
(2) Mount the Rotary Motion Sensor on the Rack of the stage.
Insert the Rack into the T-slot on the side of the Rotary Mo-
tion Sensor. The teeth on the Rack go through T-slot and then
engage the gear that is on the shaft of the Rotary Motion
Sensor. Place the Rack with the senor back onto the wide
hole of the stage and tighten its thumbscrew.
(3) Use the post to fasten the Light Sensor to the aperture.
(4) Attach the Light Sensor to the Rotary Motion Sensor.
Secure the post of the Light Sensor assembly in the clamp
of the Rotary Motion Sensor. Adjust the height of the Light
Sensor assembly not to touch the pulley of the Rotary Motion
Sensor.
(5) Mount the laser on the right end of the Optics Bench.
(6) Mount the slit disk.
Attach the slit disk to the holder and mount the slit assembly
right in front of the laser with the printed side toward the laser.
Setup

General Physics Lab (International Campus) Department of PHYSICS YONSEI University
Lab Manual
Interference and Diffraction of LightVer.20160901
Lab Office (Int’l Campus)
Room 301, Building 301 (Libertas Hall B), Yonsei University 85 Songdogwahak-ro, Yeonsu-gu, Incheon 21983, KOREA (☏ +82 32 749 3430) Page 9 / 15
(7) Plug the sensors into the inputs of the interface.
(9) Set the sensitivity of the Light Sensor.
Set the Light Sensor for maximum sensitivity by sliding
[GAIN] to 100 0~5lux . If the measured light intensity
goes too high (flat line at 100% on the graph), adjust it to
10 0~50lux or 1 0~500lux . Note that lowering the
sensitivity makes the resolution of readings worse.
(10) Select an aperture.
It is recommended to use aperture #2. If required, you can
use any other aperture. If you use a narrower aperture, it is
difficult to observe the light with low intensity. If you use a
wider aperture, measured light intensity goes too high.
(11) Select a slit.
Slit Width mm / Separation mm
Single Slits 0.02 0.04 0.08 0.16
Variable S.S. 0.02 ~ 0.20
Double Slits 0.04 / 0.25 0.04 / 0.50 0.08 / 0.25 0.08 / 0.50
Variable D.S. 0.04 / 0.125 ~ 0.75
(12) Align the laser beam.
Move the sensor assembly until you can see the beam on
the aperture mask. Use the adjustment screws on the laser to
adjust the position of laser beam to pass the slit and to make
the pattern on the aperture as bright as possible.
Caution
The laser beam is so concentrated that it can cause real
damage to your retina if you look into the beam either
directly or by reflection from a shiny object. Do NOT shine
them at others or yourself.

General Physics Lab (International Campus) Department of PHYSICS YONSEI University
Lab Manual
Interference and Diffraction of LightVer.20160901
Lab Office (Int’l Campus)
Room 301, Building 301 (Libertas Hall B), Yonsei University 85 Songdogwahak-ro, Yeonsu-gu, Incheon 21983, KOREA (☏ +82 32 749 3430) Page 10 / 15
Setup2. Software (Capstone) Setup
(1) Add sensors.
The interface automatically recognizes the Rotary Motion
Sensor.
Click the input port which you plugged the Light Sensor into
and select [Light Sensor] (yellow icon) from the list.
(2) Configure the Rotary Motion Sensor.
Click the Rotary Motion Sensor icon and then click the prop-
erties button (☼).
Select [Rack & Pinion] for [Linear Accessory].
[Change Sign] switches the sign on the sensor. The sign of
collected data depends on the setup status or the rotational
direction of the shaft. Activate [Change Sign] if required.
(3) Adjust the sample rate of measurements.
Select [20.00Hz] for all sensors, or other value if required.
(4) Create a graph display.
Click and drag the [Graph] icon from the [Displays] palette
into the workbook page. Select [Position(m)] of the Rotary
Motion Sensor for the -axis and [Light Intensity(%)] of the
Light Sensor for the -axis.

General Physics Lab (International Campus) Department of PHYSICS YONSEI University
Lab Manual
Interference and Diffraction of LightVer.20160901
Lab Office (Int’l Campus)
Room 301, Building 301 (Libertas Hall B), Yonsei University 85 Songdogwahak-ro, Yeonsu-gu, Incheon 21983, KOREA (☏ +82 32 749 3430) Page 11 / 15
Experiment 1. Diffraction from a Single Slit
(1) Set up your equipment. (See Setup 1.)
(2) Set up the Capstone program. (See Setup 2.)
(3) Select a slit and record the width of the slit.
________ m
(4) Measure the distance between the slit (front side of slit
disk) and the aperture mask.
________ m
(5) Scan the interference pattern.
Click [Record].
Then slowly turn the pulley of the Rotary Motion Sensor to
scan the pattern. Hold the rear of the Rotary Motion Sensor
down against the linear stage bracket so it does not wobble
up and down as it moves.
Click [Stop] when you have finished the scan.
(6) Scale the graph.
Adjust the scale of the graph by clicking [Scale axes…] or by
dragging the mouse pointer on the graph.
Procedure
Caution
The laser beam is so concentrated that it can cause real
damage to your retina if you look into the beam either
directly or by reflection from a shiny object. Do NOT shine
them at others or yourself.
Note
If measured light intensity goes too high (it will flat line at
100% on the graph),
① Place the slit and the sensor assembly as far away as
possible.
② Choose a narrower aperture. (Note that you may not
be able to measure the light of low intensity if the aper-
ture is too narrow.)
③ Change [GAIN] switch on the Light Sensor from
100 0~5lux to 10 0~50lux . (In this case, the
resolution of readings becomes worse.)

General Physics Lab (International Campus) Department of PHYSICS YONSEI University
Lab Manual
Interference and Diffraction of LightVer.20160901
Lab Office (Int’l Campus)
Room 301, Building 301 (Libertas Hall B), Yonsei University 85 Songdogwahak-ro, Yeonsu-gu, Incheon 21983, KOREA (☏ +82 32 749 3430) Page 12 / 15
(7) Analyze the graph.
Click [Show coordinates…] to read off data points.
(8) Record your data and analyze the result.
Slit↔Pattern
m
↔ min
m
sin
⁄ sin
1
2
3
average
650nm red 532nm green reference
(9) Repeat the steps (5)-(8) for the other single-slits.
(10) Repeat the steps (3)-(9) for the other laser source.
(11) Repeat for the variable single slit.
Using your eyes, make an observation of changes in pattern
as you decrease the slit width.
Q
How does the single slit pattern change as you decrease
the slit width? What is expected if the slit width decreases
to the light wavelength level? (Refer to Eqs. (5), (7) and
Fig. 8.)
A
Note
You can modify the properties of the graph if required.
Note
The manufacturer of the slits claims the uncertainty in
the slit width is 0.005mm. This means the % uncertainty
in using the 0.02mm slit width is 20% and for the
0.16mm slit width is 3%.

General Physics Lab (International Campus) Department of PHYSICS YONSEI University
Lab Manual
Interference and Diffraction of LightVer.20160901
Lab Office (Int’l Campus)
Room 301, Building 301 (Libertas Hall B), Yonsei University 85 Songdogwahak-ro, Yeonsu-gu, Incheon 21983, KOREA (☏ +82 32 749 3430) Page 13 / 15
Experiment 2. Diffraction from Two Slits
Repeat Experiment 1 for double-slits.
Slit↔Pattern
m
↔ max
m
sin
⁄ sin
1
2
3
average
650nm red 532nm green reference
Q Your graph may be different from Fig. 3. Explain why.
A
Q Compare the patterns of different slit widths (same slit
separations) and explain why.
A
Q What is expected if the slit width decreases to the light
wavelength level?
A
Q
Compare the patterns of different slit separations (same
slit widths). Also, when you use the variable double-slit,
how does the pattern change as you decrease the slit
separation? Describe the changes and explain why.
A
Note
The manufacturer of the slits claims the uncertainty in
the slit separation is 0.01mm. This means the % uncer-
tainty in using the 0.25mm slit separation is 4% and
for the 0.50mm slit separation is 2%.
General Physics Lab (International Campus) Department of PHYSICS YONSEI University
Lab Manual
Interference and Diffraction of LightVer.20160901
Lab Office (Int’l Campus)
Room 301, Building 301 (Libertas Hall B), Yonsei University 85 Songdogwahak-ro, Yeonsu-gu, Incheon 21983, KOREA (☏ +82 32 749 3430) Page 14 / 15
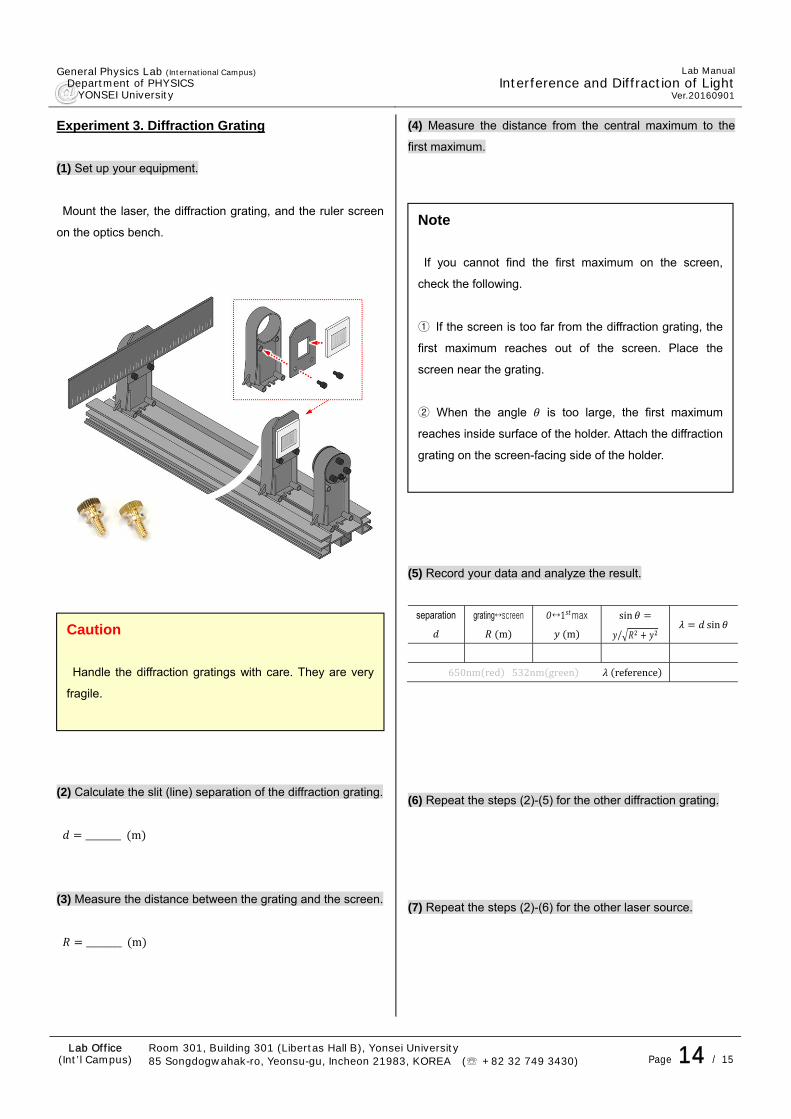
Experiment 3. Diffraction Grating
(1) Set up your equipment.
Mount the laser, the diffraction grating, and the ruler screen
on the optics bench.
(2) Calculate the slit (line) separation of the diffraction grating.
________ m
(3) Measure the distance between the grating and the screen.
________ m
(4) Measure the distance from the central maximum to the
first maximum.
(5) Record your data and analyze the result.
separation
grating↔screen
m
↔1 max
m
sin
⁄ sin
650nm red 532nm green reference
(6) Repeat the steps (2)-(5) for the other diffraction grating.
(7) Repeat the steps (2)-(6) for the other laser source.
Caution
Handle the diffraction gratings with care. They are very
fragile.
Note
If you cannot find the first maximum on the screen,
check the following.
① If the screen is too far from the diffraction grating, the
first maximum reaches out of the screen. Place the
screen near the grating.
② When the angle is too large, the first maximum
reaches inside surface of the holder. Attach the diffraction
grating on the screen-facing side of the holder.
General Physics Lab (International Campus) Department of PHYSICS YONSEI University
Lab Manual
Interference and Diffraction of LightVer.20160901
Lab Office (Int’l Campus)
Room 301, Building 301 (Libertas Hall B), Yonsei University 85 Songdogwahak-ro, Yeonsu-gu, Incheon 21983, KOREA (☏ +82 32 749 3430) Page 15 / 15
Your TA will inform you of the guidelines for writing the laboratory report during the lecture.
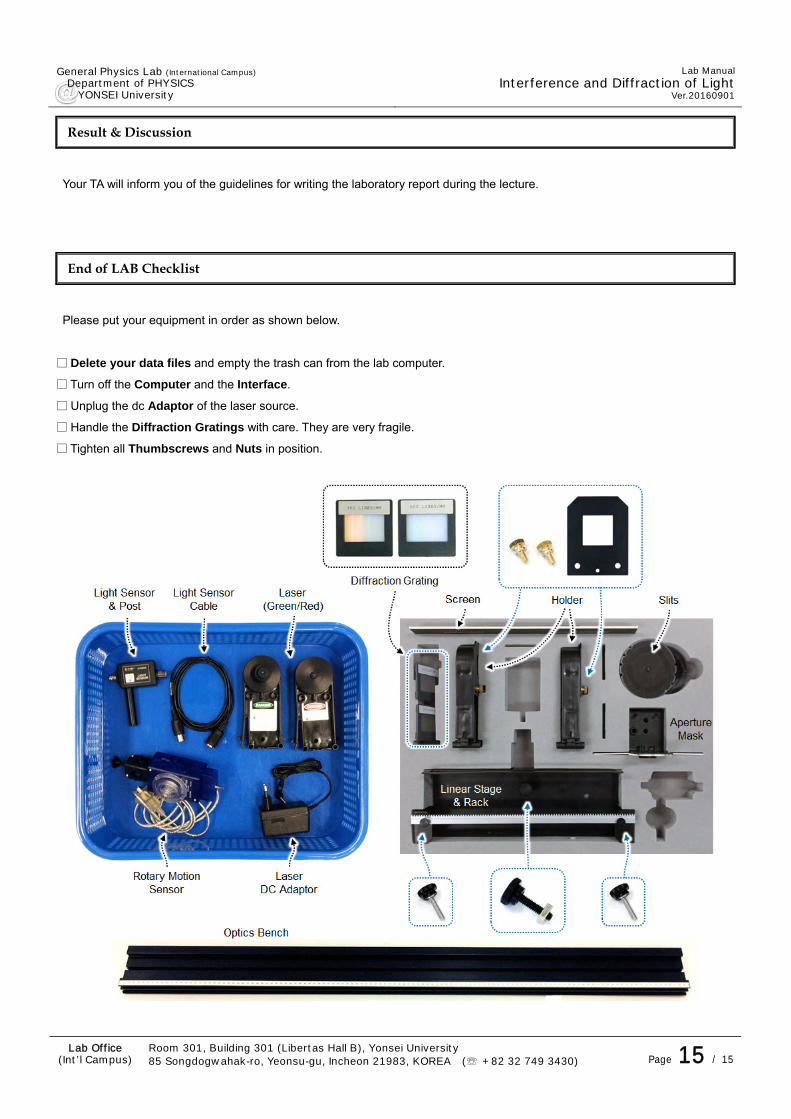
Please put your equipment in order as shown below.
□ Delete your data files and empty the trash can from the lab computer.
□ Turn off the Computer and the Interface.
□ Unplug the dc Adaptor of the laser source.
□ Handle the Diffraction Gratings with care. They are very fragile.
□ Tighten all Thumbscrews and Nuts in position.
Result & Discussion
End of LAB Checklist