000 Wave ENG rev1 20160526 - Yonsei Universityphylab.yonsei.ac.kr/exp_ref/109_Wave_ENG.pdf · verse...
13
General Physics Lab (International Campus) Department of PHYSICS YONSEI University Lab Manual Mechanical Waves Ver.20160526 Lab Office (Int’l Campus) Room 301, Building 301 (Libertas Hall B), Yonsei University 85 Songdogwahak-ro, Yeonsu-gu, Incheon 21983, KOREA (☏ +82 32 749 3430) Page 1 / 13 [For International Campus Lab ONLY] Mechanical Waves Observe standing waves on a string and investigate the relationship between wave speed and tension in the string. Observe standing waves in an air column and find the speed of sound. Ripple on a pond, musical sounds – all these are wave phe- nomena. Waves can occur whenever a system is disturbed from equilibrium and when the disturbance can travel, or propagate, from one region of the system to another. A mechanical wave is a disturbance that travels through some material or substance called the medium for the wave. In Fig. 1(a) the medium is a string under tension. Because the displacements of the medium are perpendicular or trans- verse to the direction of travel of the wave along the medium, this is called a transverse wave. In Fig. 1(b) the medium is a liquid or gas in a tube. This time the motions of the particles of the medium are back and forth along the same direction that the wave travels. We call this a longitudinal wave. Fig. 1 A sinusoidal transverse wave traveling to the right along a string and a sinusoidal longitudinal wave traveling to the right in a gas. Objective Theory ----------------------------- Reference -------------------------- Young & Freedman, University Physics (14 th ed.), Pearson, 2016 15.1~15.8 Mechanical Waves (p.492~518) 16.4 Standing Sound Waves / Normal Modes (p.542~546) -----------------------------------------------------------------------------
Transcript of 000 Wave ENG rev1 20160526 - Yonsei Universityphylab.yonsei.ac.kr/exp_ref/109_Wave_ENG.pdf · verse...

General Physics Lab (International Campus) Department of PHYSICS YONSEI University
Lab Manual
Mechanical WavesVer.20160526
Lab Office (Int’l Campus)
Room 301, Building 301 (Libertas Hall B), Yonsei University 85 Songdogwahak-ro, Yeonsu-gu, Incheon 21983, KOREA (☏ +82 32 749 3430) Page 1 / 13
[For International Campus Lab ONLY]
Mechanical Waves
Observe standing waves on a string and investigate the relationship between wave speed and tension in the string.
Observe standing waves in an air column and find the speed of sound.
Ripple on a pond, musical sounds – all these are wave phe-
nomena. Waves can occur whenever a system is disturbed
from equilibrium and when the disturbance can travel, or
propagate, from one region of the system to another.
A mechanical wave is a disturbance that travels through
some material or substance called the medium for the wave.
In Fig. 1(a) the medium is a string under tension. Because
the displacements of the medium are perpendicular or trans-
verse to the direction of travel of the wave along the medium,
this is called a transverse wave.
In Fig. 1(b) the medium is a liquid or gas in a tube. This time
the motions of the particles of the medium are back and forth
along the same direction that the wave travels. We call this a
longitudinal wave.
Fig. 1 A sinusoidal transverse wave traveling to the right along a string and a sinusoidal longitudinal wave traveling to the right in a gas.
Objective
Theory
----------------------------- Reference --------------------------
Young & Freedman, University Physics (14th ed.), Pearson, 2016
15.1~15.8 Mechanical Waves (p.492~518)
16.4 Standing Sound Waves / Normal Modes (p.542~546)
-----------------------------------------------------------------------------

General Physics Lab (International Campus) Department of PHYSICS YONSEI University
Lab Manual
Mechanical WavesVer.20160526
Lab Office (Int’l Campus)
Room 301, Building 301 (Libertas Hall B), Yonsei University 85 Songdogwahak-ro, Yeonsu-gu, Incheon 21983, KOREA (☏ +82 32 749 3430) Page 2 / 13
Suppose we give one end of the string a repetitive motion as
in Fig. 2, with amplitude , frequency , and period 1/ .
The wave that results is a symmetric sequence of crests and
troughs, and we have a periodic wave. The wavelength of
the wave is the distance from one any point to the corre-
sponding point on the next repetition of the wave shape.
The wave pattern travels with constant speed and ad-
vances a distance of one wavelength in a time interval of
one period . So the wave speed is
⁄ (1)
The wave speed is determined by the mechanical properties
of the medium. For example, the speed of transverse waves
on a string depends on the tension in the string and its
mass per unit length (also called linear mass density ).
(2)
Fig. 2 A block attached to a spring undergoes simple
harmonic motion producing a sinusoidal wave that travels to the right on the string.
Fig. 3 Reflection of a wave pulse at a fixed end of a string.
When a wave strikes the boundaries of its medium, all or
part of the wave is reflected. If the end of a string is fastened
to a rigid support as in Fig. 3, the reflected pulse moves in the
opposite direction from the initial pulse, and its displacement
is also opposite.
Now we consider two waves propagating in opposite direc-
tions through the string as in Fig. 4. When two waves overlap,
by the principle of superposition, the actual displacement
of any point on the string at any time is obtained by adding
the two displacements for the two separate waves. The re-
sultant displacement is always zero at those places marked
. These are called nodes. At a node the displacements of
the two waves are always equal and opposite and cancel
each other out. Midway between the nodes are the points of
greatest amplitude, which called antinodes, marked . Be-
cause the wave pattern doesn’t appear to be moving in either
direction along the string, it is called a standing wave.
Fig. 4 Formation of a standing wave. A wave traveling to the left (red curves) combines with a wave traveling to the right (blue curves) to form a standing wave (brown curves).

General Physics Lab (International Campus) Department of PHYSICS YONSEI University
Lab Manual
Mechanical WavesVer.20160526
Lab Office (Int’l Campus)
Room 301, Building 301 (Libertas Hall B), Yonsei University 85 Songdogwahak-ro, Yeonsu-gu, Incheon 21983, KOREA (☏ +82 32 749 3430) Page 3 / 13
If a string with length is fixed at both ends, a standing
wave can exist only if its wavelength satisfies
2 1, 2, 3, … (3)
Eq. (3) is illustrated by the standing waves shown in Fig. 5.
The smallest frequency corresponds to the largest wave-
length (the 1 case), 2 , then /2 . This is
called the fundamental frequency. The other standing-wave
frequencies are 2 /2 , 3 /2 , and so on. These
are all integer multiples of . We can express all as
2
1, 2, 3, … (4)
Combining Eqs. (1), (2), (3), and (4), we find
2
1, 2, 3, … (5)
where is the length of the string, is linear mass density
of the string, and is the tension in the string.
Fig. 5 The first four normal modes of a string fixed at both ends and time exposures of standing waves in a stretched string.
When longitudinal waves, such as sound, propagate in a
fluid in a pipe, the waves are reflected from the ends in the
same way that transverse waves on a string are reflected at
its ends. The superposition of the waves traveling in opposite
directions again forms a standing wave. When reflection
takes place at a closed end of a pipe, the displacement of the
particles at this end must always be zero. Thus a closed end
of a pipe is a displacement node and a pressure antinode.
An open end of a pipe is a pressure node because it is open
to the atmosphere, where the pressure is constant. Because
of this, and open end is always a displacement antinode.
Fig. 6 shows a stopped pipe. It is open at the left end but
closed at the right end. The left (open) end is a displacement
node, but the right (closed) end is a displacement node. Thus,
the possible wavelengths corresponds to a standing-wave
pattern are given by
4
1, 3, 5, … (6)
From Eqs. (1) and (5), the normal-mode frequencies in a
stopped pipe are given by
4
1, 3, 5, … (7)
Fig. 6 A cross section of a stopped pipe showing the first three normal modes. The shading indicates the pressure variation. The red curves are graphs of the displacement nodes and antinodes. Only odd har-monics are possible.
General Physics Lab (International Campus) Department of PHYSICS YONSEI University
Lab Manual
Mechanical WavesVer.20160526
Lab Office (Int’l Campus)
Room 301, Building 301 (Libertas Hall B), Yonsei University 85 Songdogwahak-ro, Yeonsu-gu, Incheon 21983, KOREA (☏ +82 32 749 3430) Page 4 / 13
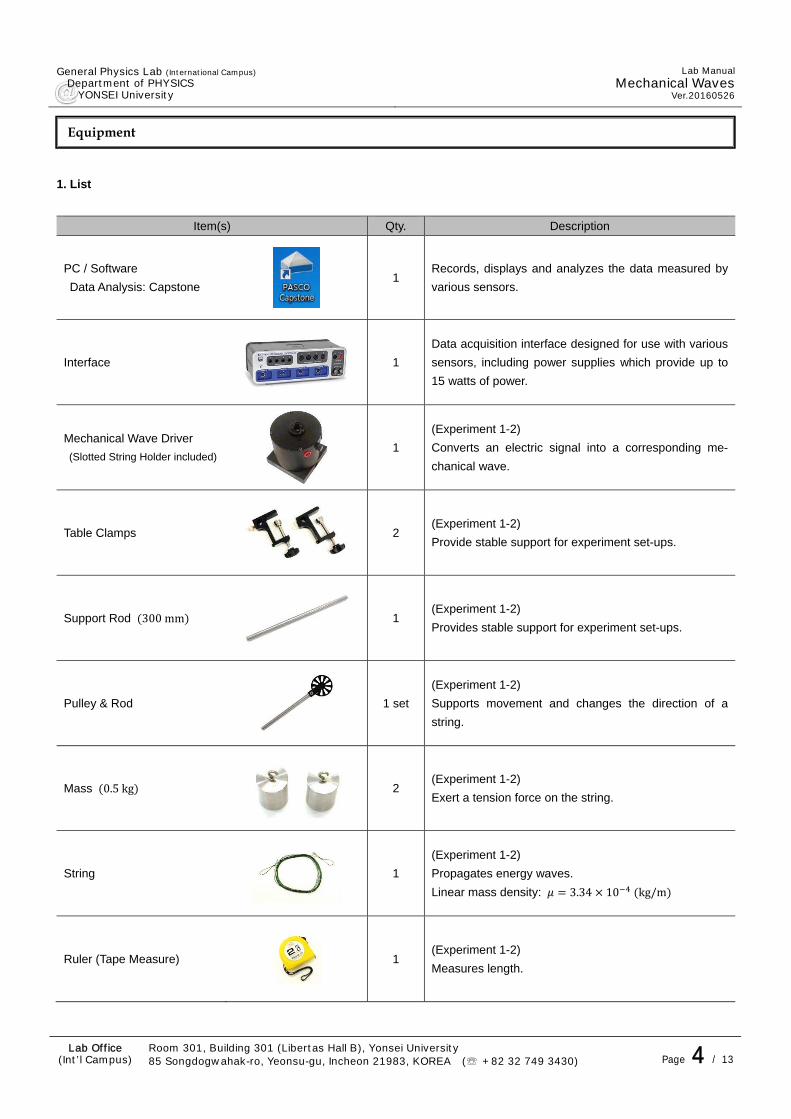
1. List
Item(s) Qty. Description
PC / Software
Data Analysis: Capstone
1 Records, displays and analyzes the data measured by
various sensors.
Interface
1
Data acquisition interface designed for use with various
sensors, including power supplies which provide up to
15 watts of power.
Mechanical Wave Driver
(Slotted String Holder included)
1
(Experiment 1-2)
Converts an electric signal into a corresponding me-
chanical wave.
Table Clamps
2 (Experiment 1-2)
Provide stable support for experiment set-ups.
Support Rod 300mm
1 (Experiment 1-2)
Provides stable support for experiment set-ups.
Pulley & Rod
1 set
(Experiment 1-2)
Supports movement and changes the direction of a
string.
Mass 0.5kg
2 (Experiment 1-2)
Exert a tension force on the string.
String
1
(Experiment 1-2)
Propagates energy waves.
Linear mass density: 3.34 10 kg/m
Ruler (Tape Measure)
1 (Experiment 1-2)
Measures length.
Equipment

General Physics Lab (International Campus) Department of PHYSICS YONSEI University
Lab Manual
Mechanical WavesVer.20160526
Lab Office (Int’l Campus)
Room 301, Building 301 (Libertas Hall B), Yonsei University 85 Songdogwahak-ro, Yeonsu-gu, Incheon 21983, KOREA (☏ +82 32 749 3430) Page 5 / 13
Item(s) Qty. Description
Screen (Black)
1
(Experiment 1-2)
Allows the wave patterns of the string to be clearly visi-
ble.
Resonance Tube Apparatus
1 (Experiment 3-4)
Produces sound waves and causes resonances.
Microphone
(with a battery powered amplifier)
Connector
1
1
(Experiment 3-4)
Converts a sound into an electric signal.
Voltage Sensor
1 (Experiment 3-4)
Measures a terminal voltage.
Probe Rod
Twist Tie
1
1
(Experiment 3-4)
Controls the position of the microphone in the reso-
nance tube.
Patch Cords 2000mm
(with banana plugs)
2 Carry an electric signal.
2. Details
(1) Mechanical Wave Driver
The Mechanical Wave Driver has a speaker which converts
an electric signal into a corresponding mechanical wave.
(2) Resonance Tube Apparatus
Waves in the tube are produced by a speaker and detected
by a microphone. The length of the tube is adjustable.

General Physics Lab (International Campus) Department of PHYSICS YONSEI University
Lab Manual
Mechanical WavesVer.20160526
Lab Office (Int’l Campus)
Room 301, Building 301 (Libertas Hall B), Yonsei University 85 Songdogwahak-ro, Yeonsu-gu, Incheon 21983, KOREA (☏ +82 32 749 3430) Page 6 / 13
Experiment 1. Standing Waves on a String, Part 1
In this experiment, the length of the string and the tension
on the string are held constant as the frequency is var-
ied.
(1) Set up the equipment.
Set up the equipment as below, and place the black screen
behind the string for easy observation of the wave pattern.
Insert the string in the slot on the top of the string holder of
the wave driver so the wave driver can cause the string to
vibrate up and down. Gently press or hold the string of the
left-side of the wave driver so this part of the string does not
vibrate. If the string has knots on it, unravel the knots.
(2) Run Capstone software.
① Click [Signal Generator] in the [Tools] palette.
② Select [850 Output 1].
③ Select [Sine] for [Waveform].
④ Set [Frequency] and [Amplitude].
- [Frequency]: 20Hz
- [Amplitude]: 5V or less (Do not exceed 5V.)
⑤ Use [On] or [Off] buttons to operate the wave driver.
(3) Exert a tension on the string.
Hang about 1.0kg mass to the end of the string (use an
electronic balance to measure mass with accuracy). Calcu-
late this tension .
(4) Measure the length of the string.
Use the ruler to measure the length between the string
holder of the wave driver and the top of the pulley.
Procedure

General Physics Lab (International Campus) Department of PHYSICS YONSEI University
Lab Manual
Mechanical WavesVer.20160526
Lab Office (Int’l Campus)
Room 301, Building 301 (Libertas Hall B), Yonsei University 85 Songdogwahak-ro, Yeonsu-gu, Incheon 21983, KOREA (☏ +82 32 749 3430) Page 7 / 13
(5) Turn on the wave driver.
Click [On] in the [Signal Generator] panel.
(6) Find the fundamental frequency ( 1).
Vary the output frequency of the signal generator until the
string vibrates in one segment (the fundamental frequency).
(7) Find the frequencies required for the higher harmonics.
In the same way, vary the output frequency of the signal
generator until the string vibrates in each of the higher har-
monics 2, 3, 4, … and record these frequencies.
1 2 3 4 ⋯
(8) Find of the string.
Plot a - graph and find the slope of the graph using the
method of least square. Finally use Eq. (5) to calculate the
linear mass density of the string.
2
12
1, 2, 3, … (5)
(9) Analyze your result.
The direct calculation of is 3.34 10 kg/m ,
which is calculated by dividing the real mass 1.67 10 kg
by the length 50m of the string.
(10) Repeat the experiment.
Change mass to 0.5kg and repeat steps (3) to (9).

General Physics Lab (International Campus) Department of PHYSICS YONSEI University
Lab Manual
Mechanical WavesVer.20160526
Lab Office (Int’l Campus)
Room 301, Building 301 (Libertas Hall B), Yonsei University 85 Songdogwahak-ro, Yeonsu-gu, Incheon 21983, KOREA (☏ +82 32 749 3430) Page 8 / 13
Experiment 2. Standing Waves on a String, Part 2
In this experiment, the frequency and the tension on
the string are held constant as the length of the string is
varied.
(1) Set up the equipment.
Use the setup detailed in expt. 1. Place the wave driver near
the pulley. Hang about 0.5kg mass to the end of the string.
(2) Set up Capstone software.
Use the setup detailed in expt. 1. Set [Frequency] of [Signal
Generator] at 150Hz and do not change it.
(3) Turn on the wave driver.
(4) Vary the length of the string.
Move the wave generator away from the pulley until the
string vibrates in one segment (the fundamental frequency).
Keep holding the string of the left-side of the wave driver so
this part of the string does not vibrate.
(5) Find the length required for the higher harmonics.
In the same way, vary the length of the string until the string
vibrates in each of the higher harmonics 2, 3, 4, … and
record these lengths.
1 2 3 4 ⋯
(6) Find of the string.
Plot a - graph and find the slope of the graph using the
method of least square. Finally use Eq. (5) to calculate the
linear mass density of the string.
2
12
1, 2, 3, … (5)
(7) Analyze your result.
Caution
1. Be careful not to make knots on the string. If the string
has knots on it, please unravel the knots. (Do not unrav-
el the loop knots at the ends.)
2. DO NOT cut the string.
3. Keep the string in the plastic bag.

General Physics Lab (International Campus) Department of PHYSICS YONSEI University
Lab Manual
Mechanical WavesVer.20160526
Lab Office (Int’l Campus)
Room 301, Building 301 (Libertas Hall B), Yonsei University 85 Songdogwahak-ro, Yeonsu-gu, Incheon 21983, KOREA (☏ +82 32 749 3430) Page 9 / 13
Experiment 3. Standing Sound Waves, Part 1
(1) Set up the equipment.
(2) Set up Capstone software.
(2-1) Add a [Voltage Sensor].
(2-2) Add an [Output Voltage Current Sensor].
(2-3) Configure the signal generator.
Set the parameters of [850 Output1] as below.
[Waveform]: Sine
[Frequency]: 800Hz
[Amplitude]: 0.5~1.0V
Do not exceed 1.0V. You can damage the speaker.
[Auto] (automatically starts or stops the generator.)
(2-4) Select [Fast Monitor Mode] in the controls palette.
[Fast Monitor Mode] displays data without recording. Check
that [Recode] button is changed to [Monitor] button. Do not
use [Continuous Mode]. It collects lots of data and causes a
hang or freeze of the software.

General Physics Lab (International Campus) Department of PHYSICS YONSEI University
Lab Manual
Mechanical WavesVer.20160526
Lab Office (Int’l Campus)
Room 301, Building 301 (Libertas Hall B), Yonsei University 85 Songdogwahak-ro, Yeonsu-gu, Incheon 21983, KOREA (☏ +82 32 749 3430) Page 10 / 13
(2-5) Create a scope display.
Click and drag the [Scope] icon from the [Displays] palette
into the workbook page.
(2-6) Add an independent -axis to the scope display.
Click [Add new y-axis … ] to make a two-channel scope.
(2-7) Define the axes.
-axis: Time(s)
-axis(left): Output Voltage, Ch01 (V)
(Signal Generator Output, or Speaker Input)
-axis(right): Voltage, Ch A (V)
(Voltage Sensor Reading, or Microphone Output)
(3) Demonstrate monitoring data.
(3-1) Click [Monitor] in the controls palette.
(3-2) Turn on trigger.
Click [Activate … trigger] in the toolbar to horizontally align
repetitions of the signal.

General Physics Lab (International Campus) Department of PHYSICS YONSEI University
Lab Manual
Mechanical WavesVer.20160526
Lab Office (Int’l Campus)
Room 301, Building 301 (Libertas Hall B), Yonsei University 85 Songdogwahak-ro, Yeonsu-gu, Incheon 21983, KOREA (☏ +82 32 749 3430) Page 11 / 13
(3-3) Scale the display
① Speaker Input (Signal Generator Output):
Drag the scaling pointer on the left -axis.
② Microphone Output (Voltage Sensor Reading):
Drag the scaling pointer on the right -axis.
③ Time (Period):
Drag the scaling pointer on the -axis.
(3-4) Find the axis of each trace.
When the scale fits data, you can see two traces as below.
Each trace has a random color. Color in legend matches plot
color. For example, in the figure below,
Color Symbol Measurement Axis
Blue Vo Output Voltage, Ch 01 (V)
(Speaker Input)
Left
-axis
Orange V Voltage, Ch A (V)
(Microphone Output)
Right
-axis
(4) Make a stopped pipe.
Generally, a stopped pipe is considered to be a pipe that is
closed at one end and open at the other. In keeping with this
convention, the speaker should be positioned several centi-
meters back from the end of the tube, so the speaker end of
the tube is open.
(5) Turn on the microphone.
(6) Begin your experiment.
Click [Monitor].
Move the piston to a position near the speaker end of the
tube, and then slowly pull the piston plunger, until you hear
the sound from the speaker being amplified by the tube, indi-
cating that you have produced a standing wave in the tube.
Adjust the piston position carefully until you find the first
point 1 which produces the loudest sound. (You can
also find the relative maximum by watching the trace on the
scope display.) Record this position.
Now continue moving the piston until you have found all of
the piston positions 3, 5, 7, 9, … along the tube which
produce standing waves.

General Physics Lab (International Campus) Department of PHYSICS YONSEI University
Lab Manual
Mechanical WavesVer.20160526
Lab Office (Int’l Campus)
Room 301, Building 301 (Libertas Hall B), Yonsei University 85 Songdogwahak-ro, Yeonsu-gu, Incheon 21983, KOREA (☏ +82 32 749 3430) Page 12 / 13
(7) Find the speed of sound.
The open end of the tube is always a displacement antinode,
so theoretically 4⁄ as above. However, the dis-
placement antinode actually occurs somewhat beyond an
open end of the tube. Thus, we cannot find by using Eq.
(6). Other equations such as 2⁄ , give a more
accurate calculation for of the standing wave in the tube.
⋯
1st
2nd
3rd
⋯ AVG
( 2⁄ )
1st
2nd
3rd
_______ m
_______ Hz s
m/s
. 331.3 0.606 m/s
(8) Repeat the procedures above for 1000Hz .
Experiment 4. Standing Sound Waves, Part 2
Set the output frequency at 800Hz. Adjust the position
of the piston so a 5 standing wave is produced.
Use a twist tie to mount the microphone on the end of the
probe rod, and insert it into the tube through the hole in the
speaker stand. As you move the microphone down the length
of the tube, note the positions where the scope signal is a
maximum and where it is a minimum.
Use the data to sketch the wave activity along the length of
the tube and to find the speed of sound.
Pay particular attention to the wave characteristics near the
open end of the tube and describe it.
331.3 0.606 m/s
Note
The accepted value of the speed of sound in air is
( : temperature in Celsius degrees)
Caution
Please turn off the microphone.

General Physics Lab (International Campus) Department of PHYSICS YONSEI University
Lab Manual
Mechanical WavesVer.20160526
Lab Office (Int’l Campus)
Room 301, Building 301 (Libertas Hall B), Yonsei University 85 Songdogwahak-ro, Yeonsu-gu, Incheon 21983, KOREA (☏ +82 32 749 3430) Page 13 / 13
Your TA will inform you of the guidelines for writing the laboratory report during the lecture.
Please put your equipment in order as shown below.
□ Delete your data files and empty the trash can from the lab computer.
□ Turn off the Computer.
□ Turn off the Microphone. Conjoin the microphone, the audio connector, and the converter.
□ Keep the Sting in the plastic bag. Be careful not to make knots on the string.
□ Plug the slotted String holder to the arm of the Wave Driver.
Result & Discussion
End of LAB Checklist