
Torsion Torsion of circular bar, Transmission of power by ...

General Physics Lab Department of PHYSICS YONSEI University
Lab Manual (Lite)
Physical Pendulum / Torsion Pendulum Ver.20180424
Physical Pendulum Torsion Pendulum
Experiment 1. Physical Pendulum (Slender Rod) (1) Set up equipment. Mount the RMS on the support rod so that the shaft of the sensor is horizontal (parallel to the table).
(2) Attach the slender rod to the RMS. Use the mounting thumbscrew to attach the slender rod to the shaft of the sensor through the end hole of the rod, so the pivot point is 230mm above the center of gravity.
(3) Run Capstone software. ① The interface automatically recognizes the RMS.
② Adjust the sample rate of measurement.
- [Rotary Motion Sensor]: 100.00 Hz
③ Add a [Graph], and then select [Time(s)] for the 𝑥𝑥-axis and [Angle(rad)] for the 𝑦𝑦-axis.
NOTICE This LITE version of manual includes only experimental procedures for easier reading on your smartphone. For more information and full instructions of the experiment, see the FULL version of manual.
Procedure

(4) Begin recording data. Click [Record] and then let the pendulum swing. ① With the pendulum on the equilibrium position, click [Rec-ord] to begin recording data.
② Gently start the pendulum swinging with a small amplitude (within 5°). ③ After 5~6 oscillations, click [Stop] to end recording data.
(5) Find the period 𝑇𝑇 of oscillation. ① Choose any reference point of measurement (for example, peaks or zero up-crossings). ② Use [Show coordinate…] to read off the time of the point.
③ Repeat measuring times for all oscillations and find the period of oscillation. Also, calculate and record the theoretical period of oscillation based on the length 𝑑𝑑 from the pivot point to the center of gravity.
𝑡𝑡𝑛𝑛 (s) 𝑇𝑇 = 𝑡𝑡𝑛𝑛 − 𝑡𝑡𝑛𝑛−1(s)
1
2
3
4
5
…
𝑇𝑇average(s)
𝑇𝑇theory (s)
𝑇𝑇 = 2𝜋𝜋�𝐿𝐿2 + 12𝑑𝑑2
12𝘨𝘨𝑑𝑑 (7)
𝐿𝐿 = 500mm 𝑑𝑑 = 230, 190, 144, 100, 60mm (6) Repeat measurement. Repeat steps (4) and (5) for the holes that are 𝑑𝑑 = 230mm,
190mm, 144mm, 100mm, and 60mm from the center hole. (7) Plot a 𝑇𝑇-𝑑𝑑 graph. Using your results in step (6), plot a 𝑇𝑇-𝑑𝑑 graph and com-pare it with Fig. 5 in Theory section.
Q
How does the period of this pendulum change when the pivot point moves towards the center of gravity? If it does not steadily increase or decrease, at what pivot point does the pendulum have minimum 𝑇𝑇. Also, use Eq. (7) to calcu-late 𝑑𝑑 under the condition of minimum 𝑇𝑇, and compare the theoretical value with your result.
A
Q When the amplitude of this physical pendulum increases, should its period increase or decrease? Why?
A

Experiment 2. Physical Pendulum (Solid Cylinder) Repeat the procedure of expt. 1 using a disk.
𝑇𝑇 = 2𝜋𝜋�𝑅𝑅2 + 2𝑑𝑑2
2𝘨𝘨𝑑𝑑 (8)
𝑅𝑅 = 100 mm 𝑑𝑑 = 90, 70, 50, 30 mm Experiment 3. Torsion Constant (1) Set up your equipment.
① Slip the lower wire clamp onto the support rod. ② Clamp the RMS at the top of the support rod so that the shaft of the sensor is vertical. ③ Align the guide of the upper wire clamp with the slot of the shaft of the RMS. Slide the upper wire clamp onto the shaft and firmly tighten the thumbscrew.
④ Clamp each ends of the wire under the thumbscrew of the upper/lower wire clamp. Be sure that the elbow of the bend in the wire fits snugly against the axle of the thumbscrew. ⑤ Connect the sensors to the interface.
⑥ Wind a string around the largest pulley.
Caution When you slide the 3-step pulley onto the shaft of the RMS, be sure to align the guide of the pulley with the slot of the shaft.

(2) Set up Capstone software. ① Configure the Rotary Motion Sensor. - Click the RMS icon and then click the properties button (☼). - Select [Large Pulley (Groove)] for [Linear Accessory]. - [Change Sign] switches the sign of collected RMS data, which depends on the setup status or the rotational direction of the shaft. Check [Change Sign] if required.
② Configure the Force Sensor. - Click the FS icon and then click the properties button (☼). - Check [Change Sign]. (The sign of FS data is initially negative for the pulling force.)
③ Configure calculator. Define the torque 𝜏𝜏 as below, where “[Force(N)]” is meas-ured data by the Force Sensor, and “r” is the radius of the 3rd (largest) pulley (= 24mm).
④ Add a graph. Select [Rotary Motion Sensor – Angle(rad)] for the 𝑥𝑥-axis
and [𝜏𝜏(Nm)] (defined in step③) for the 𝑦𝑦-axis.
Caution If the retaining ring of the sensor shaft gets entangled in a string, SLOWLY and CAREFULLY remove the string. (NEVER apply a firm quick jerk to the string, which caus-es the retaining ring to warp, and as a result, the sensor to fail.) If it becomes warped, suspend your experiment immediately and visit lab office to replace the sensor.
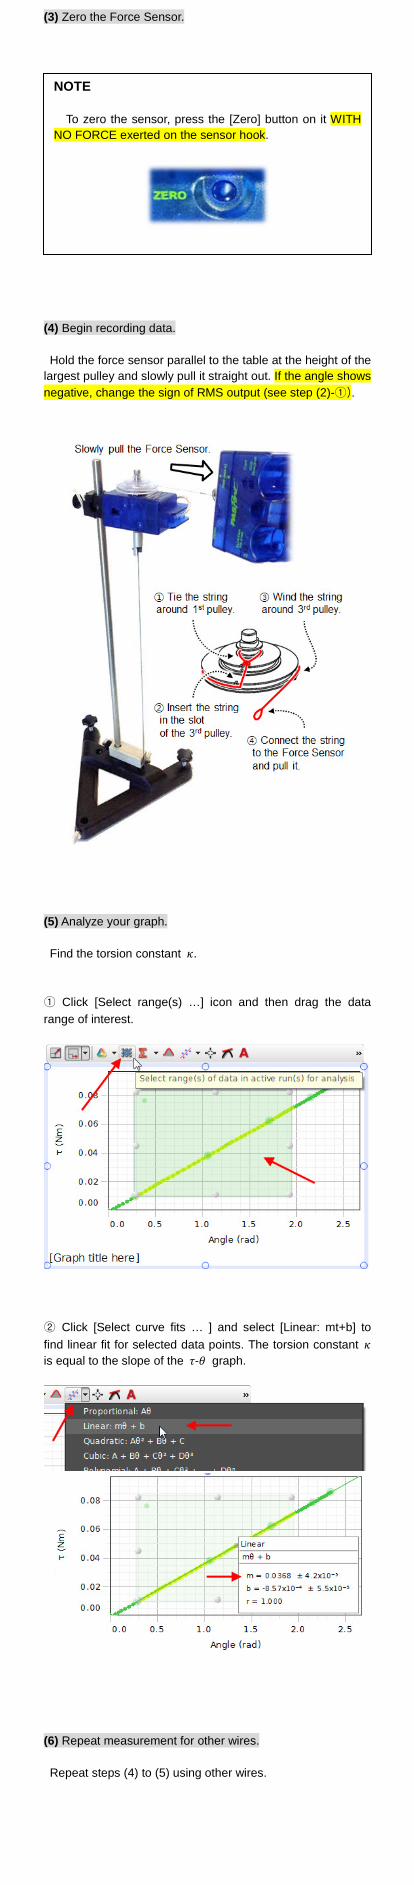
(3) Zero the Force Sensor.
(4) Begin recording data. Hold the force sensor parallel to the table at the height of the largest pulley and slowly pull it straight out. If the angle shows negative, change the sign of RMS output (see step (2)-①).
(5) Analyze your graph. Find the torsion constant 𝜅𝜅. ① Click [Select range(s) …] icon and then drag the data range of interest.
② Click [Select curve fits … ] and select [Linear: mt+b] to find linear fit for selected data points. The torsion constant 𝜅𝜅 is equal to the slope of the 𝜏𝜏-𝜃𝜃 graph.
(6) Repeat measurement for other wires. Repeat steps (4) to (5) using other wires.
NOTE To zero the sensor, press the [Zero] button on it WITH
NO FORCE exerted on the sensor hook.

Experiment 4. Torsion Pendulum (Angular SHM) (1) Calculate the moment of inertia of the balance disk. Measure the radius and the mass of the balance disk and calculate the theoretical value of 𝐼𝐼. (Suppose the balance disk is a perfect solid cylinder and apply the relationship 𝐼𝐼 = (1 2⁄ )𝑀𝑀𝑅𝑅2.)
(2) Set up your equipment. Use the setup detailed in expt. 3. Remove the string and attach the balance disk to the 3-step pulley with the thumb-screw. (Be careful not to attach the disk directly on the shaft without the pulley.)
(3) Configure Capstone software. Follow the setup instruction of the experiment 1. Change [Sample Rate] to 200.00 Hz or 500.00 Hz.
(4) Begin recording data. Click [Record]. Twist the balance disk about 120~180° and
release it. Keep recording data for about 5-6 oscillations and stop recording data. Determine the time for each period of oscillation and verify Eq. (11).
𝑇𝑇 = 2𝜋𝜋�𝐼𝐼𝜅𝜅 (11)
(5) Change the wire and repeat step (4).
Please put your equipment in order as shown below. □ Delete your data files from the lab computer. □ Turn off the Computer and the Interface. □ Tighten all thumbscrews in position. □ Put the Wires in the storage case. □ Leave the Spools of String, Scissors in the basket on the lecture table.
End of LAB Checklist