· Web viewCharacteristics and Mechanisms of Particle Adhesion Patterns in an Aerodynamic Cyclone...
30
Characteristics and Mechanisms of Particle Adhesion Patterns in an Aerodynamic Cyclone Yuanye Zhou 1,2* , Shan Zhong 1,2 , Lin Li 1,2 1 School of Mechanical, Aerospace and Civil Engineering, The University of Manchester, Oxford Road, Manchester, M13 9PL, United Kingdom 2 Laser Processing Research Centre, The University of Manchester, Oxford Road, M13 9PL, United Kingdom *Corresponding author at: School of Mechanical, Aerospace and Civil Engineering, The University of Manchester, Oxford Road, M13 9PL, United Kingdom E-mail address: [email protected] Abstract Characteristics of particle adhesion (deposition) patterns in an aerodynamic cyclone were studied by both experimental methods and computational fluid dynamic (CFD) simulation methods. The cyclone used in the experiment was made of Acrylonitrile Butadiene Styrene (ABS). The particles were a plaster material, with an average size of 1.13 μm and a density of 2300 kg/m 3 . Four levels of particle load rates were examined, ranging from 0.28 g/m 3 to 0.96 g/m 3 at a fixed mass flow rate of 2.1 g/s. Experimental results showed three key 1
Transcript of · Web viewCharacteristics and Mechanisms of Particle Adhesion Patterns in an Aerodynamic Cyclone...

Characteristics and Mechanisms of Particle Adhesion
Patterns in an Aerodynamic Cyclone
Yuanye Zhou1,2*, Shan Zhong1,2, Lin Li1,2
1 School of Mechanical, Aerospace and Civil Engineering, The University of Manchester, Oxford
Road, Manchester, M13 9PL, United Kingdom
2 Laser Processing Research Centre, The University of Manchester, Oxford Road, M13 9PL, United
Kingdom
*Corresponding author at: School of Mechanical, Aerospace and Civil Engineering, The University of
Manchester, Oxford Road, M13 9PL, United Kingdom
E-mail address: [email protected]
Abstract
Characteristics of particle adhesion (deposition) patterns in an aerodynamic cyclone were
studied by both experimental methods and computational fluid dynamic (CFD) simulation
methods. The cyclone used in the experiment was made of Acrylonitrile Butadiene Styrene
(ABS). The particles were a plaster material, with an average size of 1.13 μm and a density of
2300 kg/m3. Four levels of particle load rates were examined, ranging from 0.28 g/m3 to 0.96
g/m3 at a fixed mass flow rate of 2.1 g/s. Experimental results showed three key features of
particle adhesion patterns. They are large-scale spiral patterns (SPs), small-scale wave
patterns (WPs) and thick adhesion layer (TAL) at the cyclone tip region. It was observed that
the SPs had 5 turns and the WPs were periodic discrete patterns that crept slowly against the
flow direction. The formation of WPs was explained based on the Barchan sand dune
mechanism. Under zero particle load rate, six different mass flow rates ranging from 1.24 g/s
to 3.16 g/s were simulated using CFD. It was found that the precessional bent vortex end
(PBVE), precessing along the circumference of the cyclone tip, occurred close to the cyclone
tip. The PBVE was believed to be the cause of the TAL, because there was a weak wall shear
stress region below the PBVE. In addition, particle trajectories were simulated at a mass flow
rate of 2.26 g/s. Simulation results showed that particles had spiral trajectories that were
supposed to be linked with the SPs.
1
Key words: cyclone, particle, adhesion, deposition, CFD
Nomenclature
a Width of cyclone inlet [m]
b Height of cyclone inlet [m]
d Diameter of cyclone tip [m]
D Diameter of cyclone cylindrical body [m]
De Diameter of cyclone vortex finder [m]
Hc Length of cyclone cylindrical body [m]
L Length of cyclone conical body [m]
pw Wall static pressure of cyclone [Pa]
∆ p0 Pressure drop of cyclone without particles [Pa]
S Length of cyclone vortex finder [m]
th Thickness of vortex finder [m]
Abbreviations
CoR(er) Coefficient of Restitution
PVC Precessing Vortex Core
PBVE Precessional Bent Vortex End
SPs Spiral Patterns
TAL Thick Adhesion Layer
TCG Triboelectric Charge Generator
URSM Unsteady Reynolds Stress Model
2

WPs Wave Patterns
1. Introduction
Cyclones are widely used devices in the particle processing technology. A typical cyclone
consists of a tangential inlet, a cone shape body, and a vortex finder at the top centre, as
shown in Figure 1. Air and mixed particles enter the cyclone through the rectangular
tangential inlet. Particles are separated due to the centrifugal force and are collected in the
dust collector. Clean air leaves the cyclone through the vortex finder.
It is important to avoid particle adhesion (deposition) in the cyclone, as particle adhesion can
cause the blockage of the cyclone, which deteriorates the performance of the cyclone
(O’Callaghan and Cunningham, 2005). In the industry, there are some measures for
preventing the blockage of the cyclone, such as placing a jet flow tube at the tip of a cyclone
(Huang et al., 2013; He et al., 2014), the use of a portable central rod (Mozley, 1979) and the
use of vibrating rubber nozzle in a commercial vacuum cleaner.
However, it remains unclear about characteristics and mechanisms of particle adhesion
patterns in the cyclone. Previously, particle adhesion patterns were known as spiral patterns
on the wall (Yuu et al., 1978; Ranz, 1985). The said spiral patterns were caused by the
swirling flow in the cyclone. But they did not explain why spiral patterns had several bands.
Recently, some small-scale discrete droplet shapes and chevron shapes of particle adhesion
patterns were also observed on the wall (Bogodage and Leung, 2016; Houben, 2011). But
they did not give the explanation for these patterns. Therefore, there is need to understand
characteristics and mechanisms of these particle adhesion patterns, so as to provide the
fundamental knowledge for the reduction of particle adhesion in the cyclone.
Theoretically, particle adhesion in the cyclone is affected by the capillary force, the van der
Waals force, the electrostatic force and the aerodynamic force. These forces together induce
the friction and the removal force on the particle over a surface. According to the particle
sliding detachment model (Wang, 1990), if the friction is larger than the removal force,
particle adhesion would occur.
In detail, these forces are dependent on a number of parameters including the environmental
condition, material properties and the air flow distribution in the cyclone. For example, the
capillary force is related to the relative humidity (RH) of the environment; the van del Waals
force is associated with the Hamaker constant between the particle and the surface; the
3

electrostatic force is determined by the particle charge; the aerodynamic force is determined
by the air flow velocity (Mittal and Jaiswal, 2015).
In the cyclone, it is possible to control the environmental condition and material properties,
so that the impact of the capillary force, the van der Waals force and the electrostatic force
can be uniform for the whole cyclone. However, the aerodynamic force in the cyclone is
usually complex, due to different flow characteristics in the different region of the cyclone.
The basic flow structure in the cyclone is the ‘Rankine’ vortex, with a solid vortex core and a
free outer vortex. But there are some secondary flows as well, such as the roof secondary
flow and the axial secondary flow. There is also a large-scale coherent structure existing in
the cyclone, known as the precessing vortex core (PVC) phenomenon (Yazdabadi et al.,
1994). At the cyclone tip region, the PVC phenomenon is the precessional bent vortex end
(PBVE) attached to the wall surface (Hoffmann and Stein, 2002). In addition, it is found that
the particle concentration also affected the local air flow velocity and the aerodynamic force
(Liang et al., 1996). Therefore, the prediction of particle adhesion patterns in the cyclone
needs to consider all of flow characteristics mentioned above on a case-by-case basis,
because detailed flow characteristics are unique for different region of the cyclone.
In this work, a small aerodynamic cyclone was used to study characteristics and mechanisms
of particle adhesion patterns. Particle adhesion patterns were visualised during the experiment
and after the experiment. In order to explain experimental results, the CFD simulation
method was adopted to obtain detailed flow characteristics of the cyclone. The PBVE and the
particle trajectory were revealed in the simulation. Based on simulation results and the
Barchan sand dune mechanism, experimental observations of particle adhesion patterns were
explained.
4
Figure 1 Illustration of a typical cyclone and its key dimensions
2. Material and method
2.1.Particles
As plaster particles can easily form particle adhesion, Thistle Dura-Finish plaster,
manufactured by British Gypsum Ltd. was used in the experiment. The density of this plaster
particle is about 2300 kg/m3. Before the experiment, particles were stored in a sealed tank at
room temperature, so that particles were not wetted by the humidity.
Figure S1 shows the 2D image of particles under an optical microscope (GXML 3230) and
the particle size distribution. Since particles were irregular, the particle size distribution was
given in terms of dynamically equivalent diameter, which was measured by a particle sizer
(TSI 3321) in a sedimentation tank with diluted particle samples. The average dynamically
equivalent diameter of plaster particles was 1.13 μm.
5
2.2.Experimental method
2.2.1. Particle adhesion test rig
An experimental test rig was built to investigate particle adhesion patterns in the cyclone. The
test rig consisted of a triboelectric charge generator (TCG), a cyclone, a fibre filter, an air
pump with a pump voltage adjustor and sensors for pressure and mass flow rate
measurement, as shown in Figure 2.
In this study, the mass flow rate of the cyclone was fixed at 2.1 g/s. Four particle load rates
were tested. In terms of per gram particle in per volume flow, the particle load rates were
0.28 g/m3, 0.60 g/m3, 0.75 g/m3, and 0.96 g/m3, respectively. The duration of each test was 20
minutes.
During the experiment, the mass flow rate and pressure drop of the cyclone were measured.
The measurement range of mass flow sensor (TSI 40241) was 0 - 6 g/s and the accuracy was
± 3% of the reading. The pressure sensor (Sensortechnics HDIM series) read the differential
wall pressure between the inlet and outlet. The measurement range of pressure sensor was
±20 kPa and the accuracy was ± 100 Pa. The measurement was taken every 15 seconds. The
measured data were transmitted to a data acquisition card (model NI PCI-6221) and were
stored in a PC computer.
Dimensions of cyclones used in the experiment are listed in Table 1. Two types of cyclones
were used. They had the same inlet, vortex finder and dust collector. The only difference was
the conical part of the cyclone. One had a grey conical part, the other one had a transparent
conical part, as shown in Figure S2. Both conical parts were made from Acrylonitrile
Butadiene Styrene (ABS) material with a similar surface roughness (7.63 μm and 7.85 μm,
respectively, measured by Keyence VK-X200K 3D Laser Scanning Microscope). In the
experiment, the grey conical part was used for observing particle adhesion patterns after the
experiment, while the transparent conical part was used for observing particle adhesion
patterns during the experiment. Before each experiment, cyclones were cleaned by the water
and were dried by the compressed air.
The environmental temperature and humidity during the experiment was 20±2℃ and 50±5%
RH, respectively. The variation of room pressure was less than 5% of 101 kPa over one year,
according to the data from the centre of atmospheric science in the university. Thus, the test
environment condition is regarded as constant.
6

Table 1 Dimensions of cyclones used in the experiment
Feature Dimension, mm Feature Dimension, mma 5 S 13.55b 11.6 Hc 12.1D 35 L 87.11De 8.54 d 6.6th 1
* Measurement errors are within 0.01 mm
Figure 2 Particle adhesion test rig
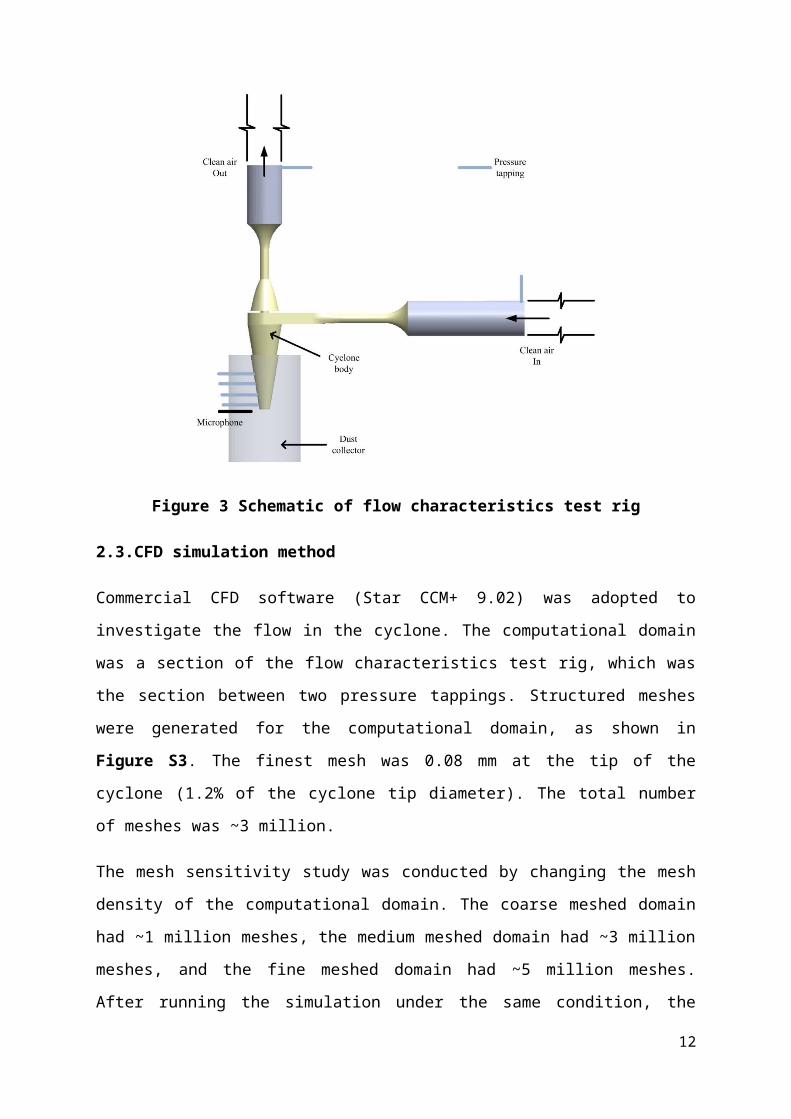
2.2.2. Flow characteristics test rig
A flow characteristics test rig was built to validate results of the CFD simulation, as
illustrated in Figure 3. The cyclone used in the flow characteristics test rig had the same
geometry as the cyclone used in particle adhesion test. During the test, the clean air moved
into the cyclone directly. The mass flow rate was 1 g/s to 3 g/s.
7
The pressure drop and mass flow rate measurements were the same as that described in the
previous section. In addition, the wall pressure distribution of the cyclone was also measured.
Five wall pressure sensors (HDIM series) were placed along the wall of the conical part. The
axial location of the wall pressure tapping from the cyclone tip was 5 mm, 15 mm, 25 mm, 35
mm and 45 mm, respectively. The sampling frequency of the pressure measurement was 200
Hz and the duration was 15 seconds.
In order to measure the frequency of the PBVE, a microphone (RS Pro Microphone) was
placed next to the cyclone tip. This measurement technique was reported as an approximate
frequency measurement method for the PBVE frequency in the cyclone (Grimble and
Agarwal, 2015). In this test, the measurement range of the microphone was 50 Hz to 16 kHz,
which was enough to cover two times the PBVE frequency. An 8 kHz low-pass signal filter
was applied to the measured acoustic signal before it was recorded by the data acquisition
card. The sampling frequency and duration of the acoustic measurement were 16 kHz and120
seconds.
Figure 3 Schematic of flow characteristics test rig
2.3.CFD simulation method
8

Commercial CFD software (Star CCM+ 9.02) was adopted to investigate the flow in the
cyclone. The computational domain was a section of the flow characteristics test rig, which
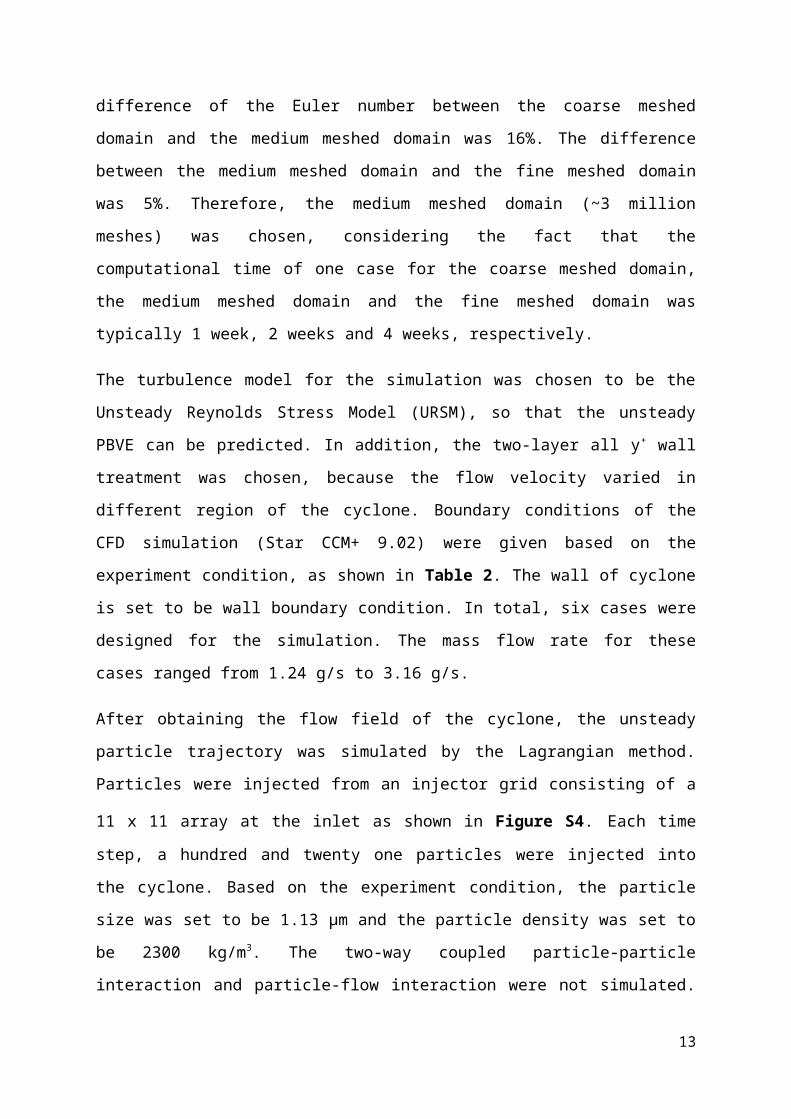
was the section between two pressure tappings. Structured meshes were generated for the
computational domain, as shown in Figure S3. The finest mesh was 0.08 mm at the tip of the
cyclone (1.2% of the cyclone tip diameter). The total number of meshes was ~3 million.
The mesh sensitivity study was conducted by changing the mesh density of the computational
domain. The coarse meshed domain had ~1 million meshes, the medium meshed domain had
~3 million meshes, and the fine meshed domain had ~5 million meshes. After running the
simulation under the same condition, the difference of the Euler number between the coarse
meshed domain and the medium meshed domain was 16%. The difference between the
medium meshed domain and the fine meshed domain was 5%. Therefore, the medium
meshed domain (~3 million meshes) was chosen, considering the fact that the computational
time of one case for the coarse meshed domain, the medium meshed domain and the fine
meshed domain was typically 1 week, 2 weeks and 4 weeks, respectively.
The turbulence model for the simulation was chosen to be the Unsteady Reynolds Stress
Model (URSM), so that the unsteady PBVE can be predicted. In addition, the two-layer all y+
wall treatment was chosen, because the flow velocity varied in different region of the
cyclone. Boundary conditions of the CFD simulation (Star CCM+ 9.02) were given based on
the experiment condition, as shown in Table 2. The wall of cyclone is set to be wall
boundary condition. In total, six cases were designed for the simulation. The mass flow rate
for these cases ranged from 1.24 g/s to 3.16 g/s.
After obtaining the flow field of the cyclone, the unsteady particle trajectory was simulated
by the Lagrangian method. Particles were injected from an injector grid consisting of a 11 x
11 array at the inlet as shown in Figure S4. Each time step, a hundred and twenty one
particles were injected into the cyclone. Based on the experiment condition, the particle size
was set to be 1.13 μm and the particle density was set to be 2300 kg/m3. The two-way
coupled particle-particle interaction and particle-flow interaction were not simulated.
Furthermore, only the drag force was considered in the simulation. The lift force, turbulence
dispersion effect and gravity were not accounted, as their magnitude was one to two orders
smaller than that of the drag force. Particle-wall interaction was simplified to be the elastic
collision. For simplicity, the tangential coefficient of restitution (CoR) was assumed to be the
same as the radial CoR.
9

Table 2 Boundary conditions and time steps
Case 1 2 3 4 5 6Inlet total pressure, Pa 0 0 0 0 0 0
Outlet static pressure, kPa -2 -5 -8 -10 -12.6 -17Time step, µs 49 36 28 26 24 2
3. Results and discussion
3.1.Experimental results and discussion
3.1.1. Particle adhesion patterns in the cyclone
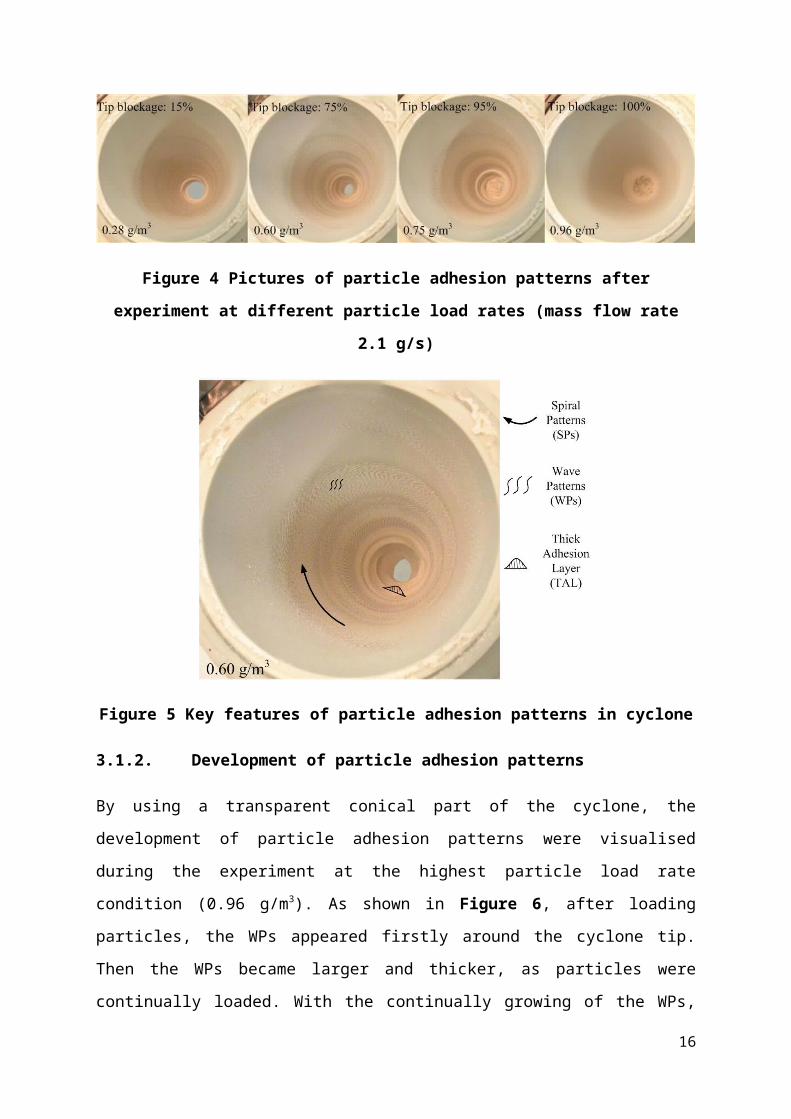
Pictures of particle adhesion patterns were taken after the experiment. As shown in Figure 4,
particle adhesion patterns (white part on the wall) were formed in the cyclone. The area of the
tip blockage to the tip area was measured with a Matlab image procession tool, showing that
the blockage became serious when the particle load rate increased. At the highest load rate
condition (0.96 g/m3), the cyclone was completely blocked. After that, particles were not able
to move into the dust collector.
What’s more, particle adhesion patterns under the highest load rate condition (0.96 g/m3)
appeared to be thinner than other load rate conditions. It was probably because particle
adhesion patterns were worn by particles that were not able to move out of the cyclone. At
other load rate conditions, particle adhesion patterns looked similar, except for the thickness
of the adhesion.
Based on the pictures, three key features of particle adhesion patterns were identified. They
were large-scale spiral patterns (SPs), small-scale wave patterns (WPs) and the thick
adhesion layer (TAL) close to the cyclone tip (within 10 mm away from the tip), as shown in
Figure 5. Large-scale SPs started from the upper part of the conical part and continued to the
cyclone tip. These SPs were similar to previous findings (Yuu et al., 1978; Ranz, 1985). In
this study, there were 5 turns in the SPs. Visually, the thickness of SPs slowly increased as
patterns moved down to the cyclone tip. It could be explained by the decrease of the wall
surface area. However, such mechanism did not hold for the TAL close to the cyclone tip,
because the thickness of the TAL increased rapidly. The cause for the TAL was explained
with the aid of the CFD simulation later. In addition, small-scale WPs were found to be
embedded in the large-scale SPs. The WPs were similar to droplet patterns and chevron
10

patterns (Bogodage and Leung, 2016; Houben, 2011). They were small-scale approximate
periodic discrete patterns in the cyclone.
Figure 4 Pictures of particle adhesion patterns after experiment at different particle
load rates (mass flow rate 2.1 g/s)
Figure 5 Key features of particle adhesion patterns in cyclone
3.1.2. Development of particle adhesion patterns
By using a transparent conical part of the cyclone, the development of particle adhesion
patterns were visualised during the experiment at the highest particle load rate condition (0.96
g/m3). As shown in Figure 6, after loading particles, the WPs appeared firstly around the
cyclone tip. Then the WPs became larger and thicker, as particles were continually loaded.
With the continually growing of the WPs, the SPs were formed. After 24 seconds, particle
adhesion at the cyclone tip was severe. It can be regarded as the initial state of the TAL.
11
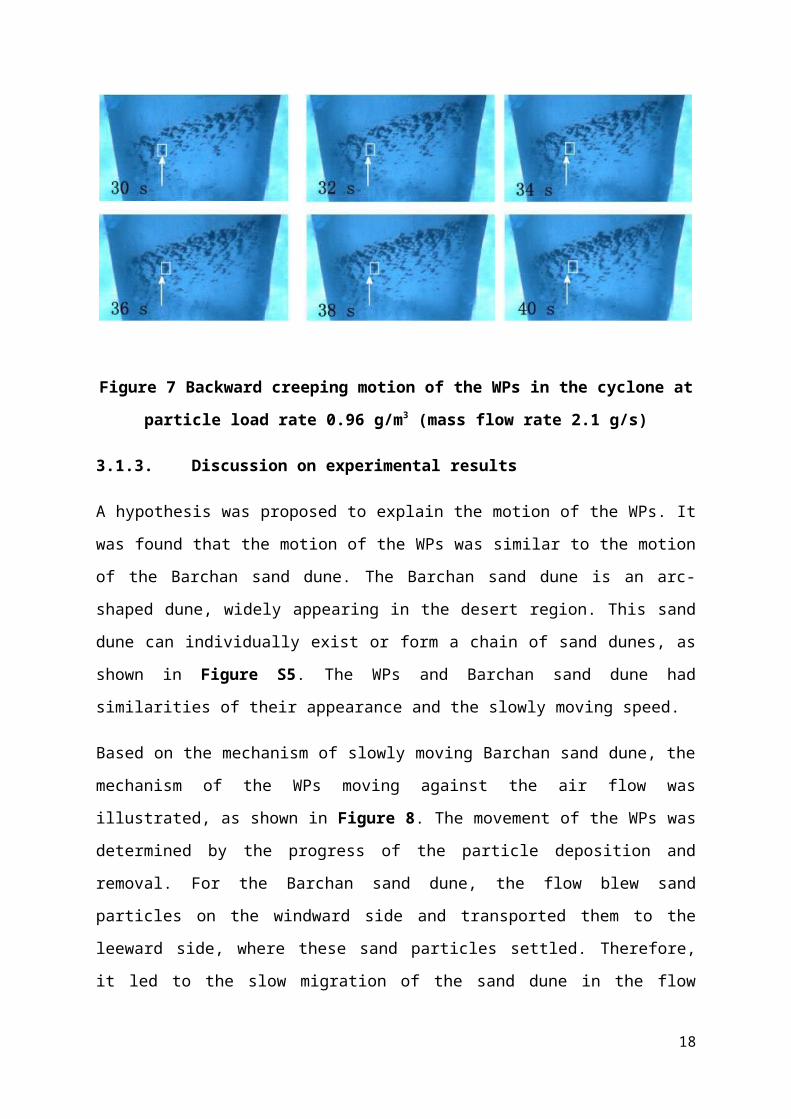
Interestingly, it was also found that the WPs crept backward (against the air flow direction),
as shown in Figure 7. The white arrow indicated a fixed location and the white rectangular
window tracked the same individual WP. It can be seen that the relative location of the white
window and arrow changed, suggesting that the individual WP crept from the left to right (the
local flow velocity direction was from the right to left). From 30 second to 40 second, this
individual WP travelled about 1 mm. Thus, the migration velocity of the WP was relatively
small compared with the flow velocity. In addition, although the resolution of the picture was
not very high, it can still be seen that the shape of the WP deformed during the experiment.
Similar creeping motion could be found for other individual WPs.
Figure 6 Development of particle adhesion patterns in the cyclone at particle load rate
0.96 g/m3 (mass flow rate 2.1 g/s)
Figure 7 Backward creeping motion of the WPs in the cyclone at particle load rate 0.96
g/m3 (mass flow rate 2.1 g/s)
3.1.3. Discussion on experimental results
12
A hypothesis was proposed to explain the motion of the WPs. It was found that the motion of
the WPs was similar to the motion of the Barchan sand dune. The Barchan sand dune is an
arc-shaped dune, widely appearing in the desert region. This sand dune can individually exist
or form a chain of sand dunes, as shown in Figure S5. The WPs and Barchan sand dune had
similarities of their appearance and the slowly moving speed.
Based on the mechanism of slowly moving Barchan sand dune, the mechanism of the WPs
moving against the air flow was illustrated, as shown in Figure 8. The movement of the WPs
was determined by the progress of the particle deposition and removal. For the Barchan sand
dune, the flow blew sand particles on the windward side and transported them to the leeward
side, where these sand particles settled. Therefore, it led to the slow migration of the sand
dune in the flow direction. However, in the cyclone, particles were separated to the windward
side due to the centrifugal force. At the leeward side of the WPs, particles were removed by
the flow, may be due to the flow separation. As the flow was faster in the cyclone than the
flow over the sand dune, the flow separation at the leeward side of the WPs was strong
enough to remove particles. Therefore, the WPs crept against the flow direction. The reason
for the slow moving was that the progress of the particle deposition and removal involved
large amount of particles. It required time to accumulate and remove large amount of
particles.
The reasons why the SPs and TAL occurred in the cyclone were explained with the aid of
CFD simulation in the next section.
13
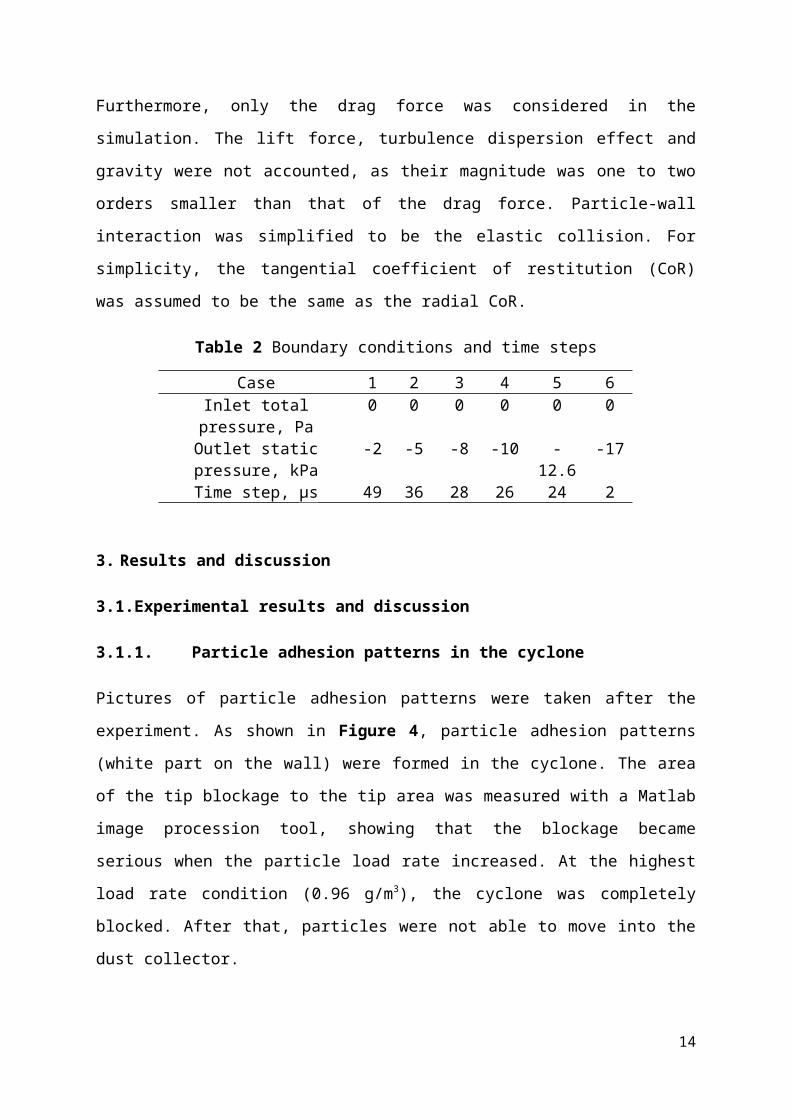
Figure 8 Sketch showing the mechanism of the backward creeping motion of the WPs
3.2.CFD simulation results and discussion
3.2.1. Validation of CFD simulation
The CFD simulation was validated by comparing the pressure drop and wall pressure
distribution in the cyclone with that of the experimental results obtained from the flow
characteristics test rig.
A comparison of the pressure drop between simulation results and experiment results is
shown in Figure 9(a). It can be seen that the experiment results agreed well with the
simulation results. Furthermore, the comparison of the wall pressure distribution was
conducted. The wall pressure was plotted in a non-dimensional way, as the pressure drop was
not the same for different mass flow rates. The non-dimensional wall pressure was defined as
pw /∆ p0, where pw is the wall pressure and ∆ p0 is the pressure drop without particles loaded.
It was noted that since the wall pressure was lower than the atmospheric pressure, the sign of
the non-dimensional wall pressure was negative. A comparison of the wall pressure
distribution between simulation results and experiment results are given, as shown in Figure
9(b). Again, it can be seen that experiment results agreed well with simulation results.
As both pressure drop and wall pressure distribution predicted by the simulation were close to
experiment results, simulation results were regarded as reliable.
14

In addition, it was found that the non-dimensional wall pressure followed a declining trend
from the upper part of the cyclone to the cyclone tip, in both experiment and CFD simulation.
It meant that the wall pressure decreased along the wall. A faster declining ratio of the non-
dimensional wall pressure was also observed between z=15 mm and z=5 mm. It was
supposed that the PBVE occurred around this region, as describe by Peng et al. (2005) that
the PBVE would lead to a faster decrease of the wall pressure in the region above the vortex
end and a rapid increase of the wall pressure in the region below the vortex end. According to
the measured wall pressure in this study, only faster decrease of wall pressure was observed.
Therefore, the location of the vortex end should be below z=5 mm in this study.
a b
Figure 9 Comparison of CFD simulation and experiment (mass flow rate 1 g/s to 3 g/s )
(a) on the pressure drop (b) wall pressure distribution
3.2.2. Precessional bent vortex end in the cyclone
The precessional bent vortex end (PBVE) was visualised by using the pressure iso-surfaces in
the CFD simulation. Instantaneous results of the static pressure in the vertical cross section of
the cyclone at the mass flow rate of 1.24 g/s are shown in Figure 10(a). It can be seen that
the vortex was bent near the cyclone tip. In other locations, the vortex was slightly twisted
but was almost straight. In Figure 10(b), the vortex core was eccentric, which was associated
with the bent vortex end. As the time step advanced, the vortex core changed its location
periodically (the precession motion of vortex core represents the precession motion of vortex
end). Similar results were found at other mass flow rates, as shown in Figure S6, S7, S8, S9
and S10. All these results showed that the location of the PBVE in the CFD simulation was
less than 2 mm away from the cyclone tip, which was the same as the prediction of
experimental results.
15
In order to support the CFD simulation, the PBVE frequency was experimentally measured
by placing a microphone next to the cyclone tip. The measured acoustic signal was processed
by the Fourier transform method in Matlab2012a. Results are shown in Figure 11. It can be
seen that the frequency of the acoustic signal had several peaks. Some of peaks did not
change as mass flow rate increased, such as 0 Hz, 3000 Hz, 4000 Hz and 6000 - 8000 Hz.
They were regarded as the hum frequency of cyclone or the environment noise. However,
some of the peak frequencies moved as the mass flow rate changed, as indicated by the
arrows. At the lowest mass flow rate, the peak was approximately 1700 Hz. As the mass flow
rate increased from 1.3 g/s to 3.0 g/s, the peak moved to around 2500 Hz, 3100 Hz, 3600 Hz,
4000 Hz, 4500 Hz and 5100 Hz, respectively.
In the CFD simulation, the frequency was counted for 100 precessional cycles. A comparison
between the CFD simulation and the experiment on the PBVE frequency is shown in Figure
12. Both experimental results and simulation results showed that the frequency changed
nearly linearly with the mass flow rate. However, experimental results were always higher
than simulation results. The difference between the experiment and the CFD simulation was
about 25%. It was probably because the URSM used in the CFD simulation had difficulty to
exactly capture the PBVE. However, considering the fact that the linear trend of the
frequency and the location of the vortex end were properly predicted by the CFD simulation,
the CFD simulation was able to reveal the PBVE in the cyclone.
Figure 10 CFD simulation results of PBVE at mass flow rate 1.24 g/s (time step: 49 µs)
(a) vertical cross section; (b) horizontal cross section (Z =2 mm)
16

Figure 11 Spectrum of the measured acoustic signal of the cyclone
Figure 12 Comparison of the CFD simulation and the experiment on the PBVE
frequency
3.2.3. Particle trajectory in the cyclone
Results of particle trajectory in the cyclone at different coefficient of restitution and a fixed
mass flow rate (2.26 g/s) are shown in Figure 13. Particles were enlarged to make them
visible. It can be seen that all particles moved down in a spiral trajectory into the dust
collector. By counting the band of the trajectory, the number of the spiral trajectory turns was
17
6, which was different from experimental results (5 turns). This difference was supposed due
to the particle-particle interaction in the experiment, as the particle-particle interaction was
found to reduce the number of turns (Chu et al., 2011; Chan et al., 2008).
Comparing results of different coefficient of restitution (CoR), it can be seen that the CoR did
not significantly affect the spiral particle trajectory but did affect the particle velocity. For a
small CoR (0.25), the particle velocity was low in some region, which appeared like vertical
bands (the dark colour bands in Figure 13). As the CoR increased, the area of low particle
velocity bands decreased, which meant that the particle velocity increases in the bands.
Figure 13 Particle trajectory in the cyclone at different coefficient of restitution (mass
flow rate 2.26 g/s)
3.2.4. Discussion on simulation results
Based on the results of CFD simulation, the formation of TAL and SPs can be explained.
The TAL near the cyclone tip, observed in our experiment, was supposed to be explained by
the PBVE. In the experiment, the location of the TAL was close to the location of the PBVE
in the CFD simulation. However, the location of the TAL in the experiment was 0 mm to 10
mm away from the cyclone tip. Some parts of the TAL were slightly above the location of the
PBVE in the CFD simulation (0 mm to 2 mm). In previous study, the location of PBVE was
found to be lifted up by the loading of particles (Hoffmann et al., 1995; Peng et al., 2005). A
possible explanation was that downward moving particles damped the flow and pushed the
flow and PBVE moving upward. Therefore, the location of the PBVE in the experiment was
higher than that in the CFD simulation.
18

Since the PBVE means the end of vortex, the flow wall shear stress was small below the
PBVE (wall shear stress distribution can be found in S3 section). Thus, the weak flow below
the PBVE in the experiment was believed to be located at the same position as the TAL,
which was supposed to be the major cause of the TAL. Similar opinion was proposed by
Hoffmann and Stein (2002), but they did not show experimental results of particle adhesion
that was associated with the PBVE. In this study, experimental results of particle adhesion
were supported by relevant CFD simulation results, so that this opinion was confirmed.
In addition, the SPs can be explained by the spiral particle trajectories. In the simulation, the
spiral particle trajectories had 6 turns in the cyclone. In the experiment, there were 5 turns of
the SPs. Because the particle-particle interaction decreased the number of turns (Chu et al.,
2011; Chan et al., 2008), it was believed that if the CFD simulation considered the particle-
particle interaction, the number of turns would be the same as that in the experiment.
Moreover, as there was no significant change in the wall shear stress (see S2 section) on most
parts of the cyclone, the aerodynamic force on the particle near the wall did not change
significantly. Therefore, the spiral SPs were the footprint of the spiral particle trajectories.
4. Conclusion
Particle adhesion patterns in aerodynamic cyclones were studied by using plaster particles.
The size and density of the plaster particle was 1.13 μm and 2300 kg/m3. In the experiment,
the mass flow rate of the cyclone was 2.1 g/s, and particle load rates were 0.28 g/m3, 0.60
g/m3, 0.75 g/m3, and 0.96 g/m3, respectively. Experimental visualisation results showed that
particle adhesion patterns had three key features:
Large-scale spiral patterns (SPs)
Small-scale wave patterns (WPs)
Thick adhesion layer (TAL) near the cyclone tip
The CFD simulation was conducted to help explain these features. In the CFD simulation,
structured meshes were generated for the cyclone, and the unsteady RSM was chosen for the
turbulence model. Combined with results of the CFD simulation, the features observed in the
experiment were explained as follows:
The spiral particle trajectory explained the SPs
19

The PBVE was believed to be the cause of the TAL near the cyclone tip
In addition, with the aid of the Barchan sand dune mechanism, the WPs was explained as
follow:
Barchan sand dune mechanism helped to illustrate the backward creeping motion of
the WPs
Acknowledgments
The author would like to acknowledge the Dyson Ltd. for funding this research. Also thanks
for James Allan in National Centre for Atmospheric Science (NCAS) for the assistance with
particle size measurements.
References
Bogodage, S. G., and Leung, A. Y. T. (2016). Improvements of the cyclone performance by down-comer tubes. Journal of Hazardous Materials,311, 100-114.
Chan, C. W., Seville, J. P., Fan, X., and Baeyens, J. (2008). Particle motion in CFB cyclones as observed by positron emission particle tracking. Industrial & Engineering Chemistry Research, 48(1), 253-261.
Chu, K. W., Wang, B., Xu, D. L., Chen, Y. X., and Yu, A. B. (2011). CFD–DEM simulation of the gas–solid flow in a cyclone. Chemical Engineering Science, 66(5), 834-847.
Grimble, T.A. and Agarwal, A. (2015). Characterisation of acoustically linked oscillations in cyclone separators. Journal of Fluid Mechanics, 780, pp.45-59.
He, S., Zeng, J. and Li, S. (2014) Patent CN104147858A
Hoffmann, A. C., and Stein, L. E. (2002). Gas cyclone and swirl tubes. Springer-Verlag Berlin Heidelberg.
Hoffmann, A. C., De Jonge, R., Arends, H., and Hanrats, C. (1995). Evidence of the ‘natural vortex length’and its effect on the separation efficiency of gas cyclones. Filtration & Separation, 32(8), 799-804.
Houben, J. J. H. (2011). Experimental investigations and CFD simulations on particle depositions in gas cyclone. Ph. D. thesis, Montanuniversitaet Leoben.
Huang, M., Zhou, P. and Yang, J. (2013) Patent CN203454113U
Liang, S. C., Hong, T., and Fan, L. S. (1996). Effects of particle arrangements on the drag force of a particle in the intermediate flow regime. International Journal of Multiphase Flow, 22(2), 285-306.
Mittal, K. L., and Jaiswal, R. (2015). Particle Adhesion and Removal. John Wiley & Sons.
20

Mozley, R. H. (1979). Patent US4148723
O’Callaghan, D., and Cunningham, P. (2005). Modern process control techniques in the production of dried milk products–a review. Le Lait, 85(4-5), 335-342.
Peng, W., Hoffmann, A.C., Dries, H.W.A., Regelink, M.A. and Stein, L.E. (2005). Experimental study of the vortex end in centrifugal separators: the nature of the vortex end. Chemical Engineering Science, 60(24), pp.6919-6928.
Ranz, W. E. (1985). Wall flows in a cyclone: A Description of internal phenomena. Aerosol Science and Technology, 4(4), 417-432.
Room pressure data: http://www.cas.manchester.ac.uk/restools/whitworth/plots/ (accessed on 30th March, 2016)
Wang, H. C. (1990). Effects of inceptive motion on particle detachment from surfaces. Aerosol Science and Technology, 13(3), 386-393.
Yazdabadi, P. A., Griffiths, A. J., and Syred, N. (1994). Characterization of the PVC phenomena in the exhaust of a cyclone dust separator. Experiments in Fluids, 17(1-2), 84-95.
Yuu, S., Jotaki, T., Tomita, Y., and Yoshida, K. (1978). The reduction of pressure drop due to dust loading in a conventional cyclone. Chemical Engineering Science, 33(12), 1573-1580.
21


![da Saude FM/vancouver... · Web viewCharacteristics of older methadone maintenance (MM) patients [resumo]. Drug ... Coletânea de Legislação e ... ...](https://static.fdocuments.in/doc/165x107/5c171c6609d3f2015a8b5572/da-saude-fmvancouver-web-viewcharacteristics-of-older-methadone-maintenance.jpg)

![[PPT]Scope of Biotechnology and Industrial Microbiology · Web viewCHARACTERISTICS OF INDUSTRIAL MICROBIOLOGY The discipline of microbiology is often divided into sub-disciplines](https://static.fdocuments.in/doc/165x107/5af2ebbf7f8b9aa91690ff11/pptscope-of-biotechnology-and-industrial-viewcharacteristics-of-industrial-microbiology.jpg)