© 2007, TSI Incorporated Inter-comparison of Long-Term Ambient Ultrafine Particle Size Distribution...
41
© 2007, TSI Incorporated Inter-comparison of Long-Term Ambient Ultrafine Particle Size Distribution Measurements at a Near- Roadway and a Representative Urban Site in New York City Brian P. Frank 1 , Jacqueline Perry 1 , H.D. Felton 1 , Robert C. Anderson 2 , Oliver Rattigan 1 , Kevin Civerolo 1 , and Olga Hogrefe 3 1 Division of Air Resources, New York State Department of Environmental Conservation, Albany, NY, 2 TSI, Inc., Shoreview , MN, 3 Department of Chemistry and Biochemistry, Siena College, Loudonville, NY
-
date post
19-Dec-2015 -
Category
Documents
-
view
213 -
download
0
Transcript of © 2007, TSI Incorporated Inter-comparison of Long-Term Ambient Ultrafine Particle Size Distribution...

© 2007, TSI Incorporated
Inter-comparison of Long-Term Ambient Ultrafine Particle Size Distribution Measurements at a Near-Roadway and a
Representative Urban Site in New York City
Brian P. Frank1, Jacqueline Perry1, H.D. Felton1,
Robert C. Anderson2, Oliver Rattigan1,
Kevin Civerolo1, and Olga Hogrefe3
1Division of Air Resources, New York State Department of Environmental Conservation, Albany, NY, 2TSI, Inc., Shoreview , MN,3Department of Chemistry and Biochemistry, Siena College, Loudonville, NY
© 2007, TSI Incorporated
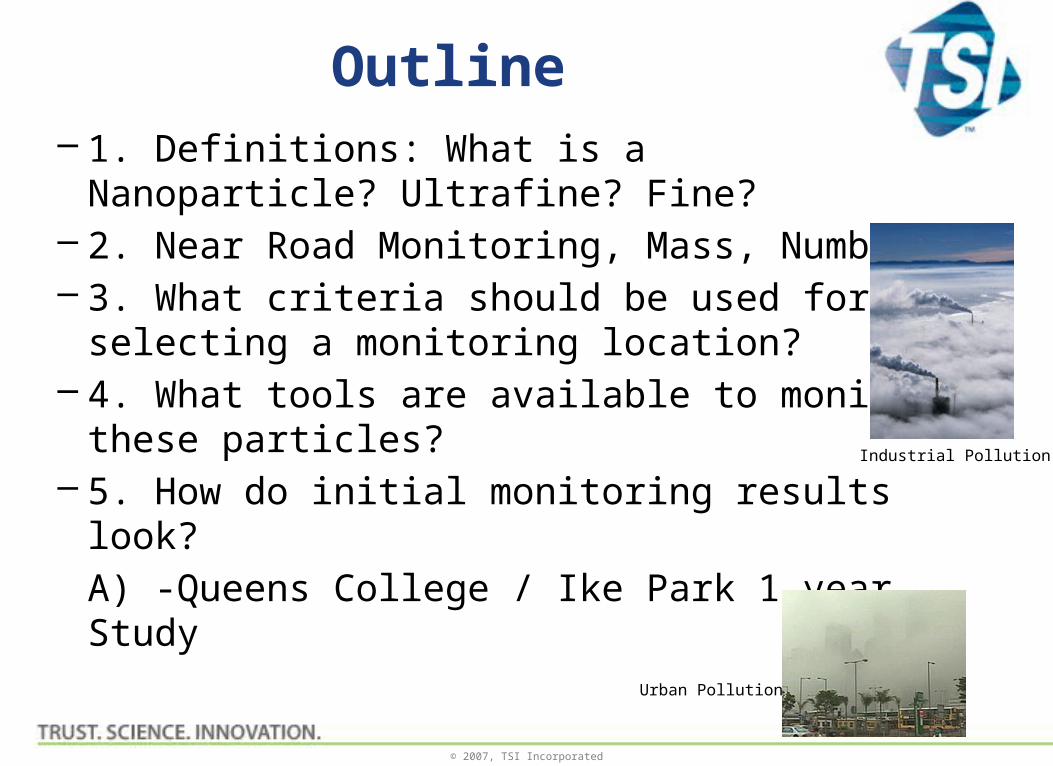
Outline– 1. Definitions: What is a Nanoparticle? Ultrafine?
Fine?– 2. Near Road Monitoring, Mass, Number– 3. What criteria should be used for selecting a
monitoring location?– 4. What tools are available to monitor these
particles?– 5. How do initial monitoring results look?
A) -Queens College / Ike Park 1 year Study
Urban Pollution
Industrial Pollution
© 2007, TSI Incorporated
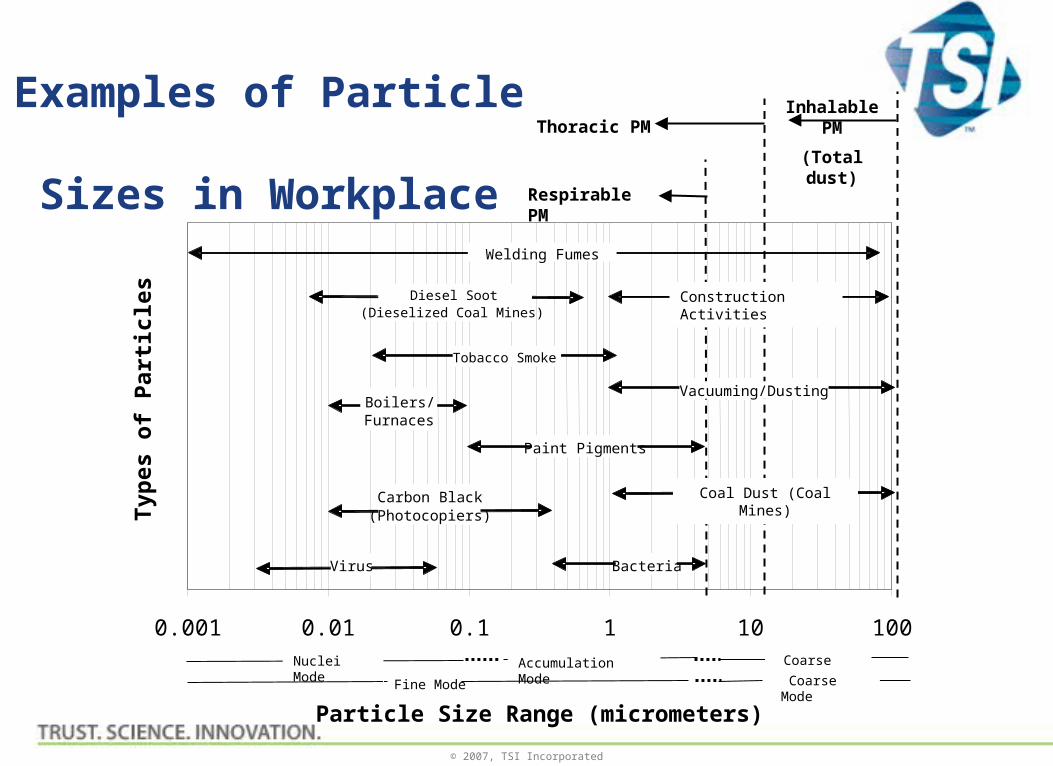
Examples of Particle Sizes in Workplace
Nuclei Mode Accumulation Mode Coarse Mode
Fine Mode Coarse Mode
0.001 0.01 0.1 1 10 100
Particle Size Range (micrometers)
Typ
es
of
Par
tic
les
Welding Fumes
BacteriaVirus
Paint Pigments
Diesel Soot(Dieselized Coal Mines)
Boilers/Furnaces
VirusCarbon Black(Photocopiers)
Coal Dust (Coal Mines)
Construction Activities
Vacuuming/Dusting
Tobacco Smoke
Inhalable PM
(Total dust)
Respirable PM
Thoracic PM
© 2007, TSI Incorporated
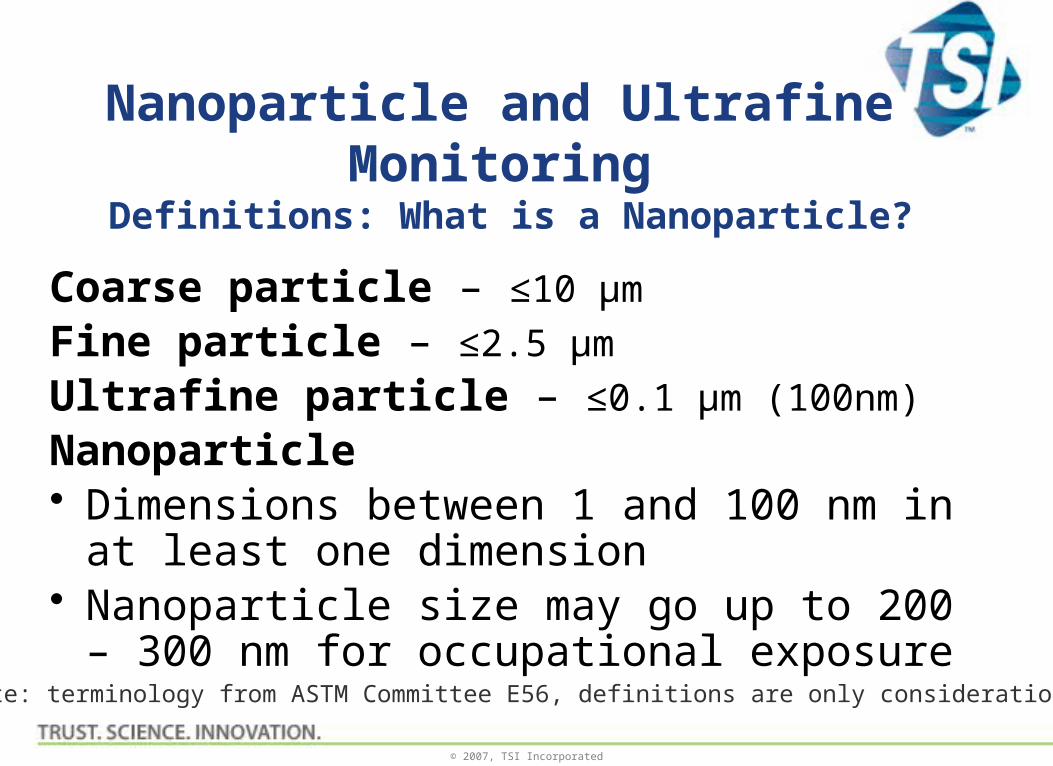
Nanoparticle and Ultrafine Monitoring
Definitions: What is a Nanoparticle?
Coarse particle – ≤10 µm
Fine particle – ≤2.5 µm
Ultrafine particle – ≤0.1 µm (100nm)
Nanoparticle • Dimensions between 1 and 100 nm in at least
one dimension• Nanoparticle size may go up to 200 – 300 nm
for occupational exposure(Note: terminology from ASTM Committee E56, definitions are only considerations)
© 2007, TSI Incorporated
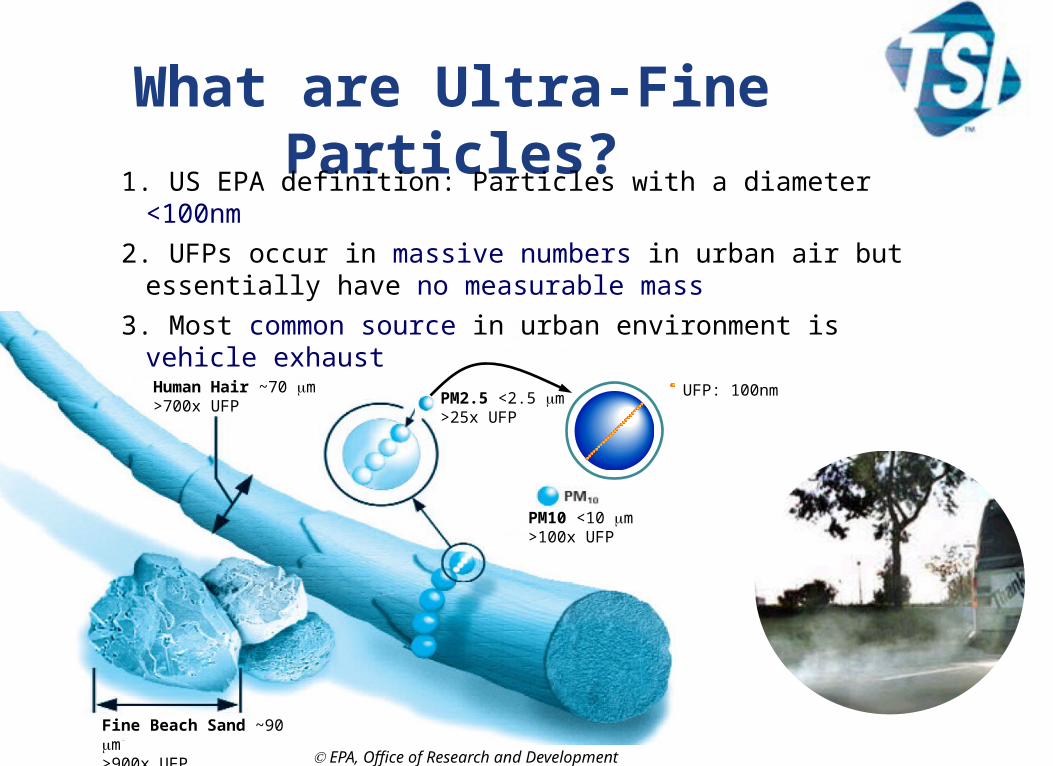
What are Ultra-Fine Particles?1. US EPA definition: Particles with a diameter <100nm
2. UFPs occur in massive numbers in urban air but essentially have no measurable mass
3. Most common source in urban environment is vehicle exhaust
Human Hair ~70 m>700x UFP
Fine Beach Sand ~90 m>900x UFP
PM10 <10 m>100x UFP
PM2.5 <2.5 m>25x UFP
EPA, Office of Research and Development
UFP: 100nm
© 2007, TSI Incorporated
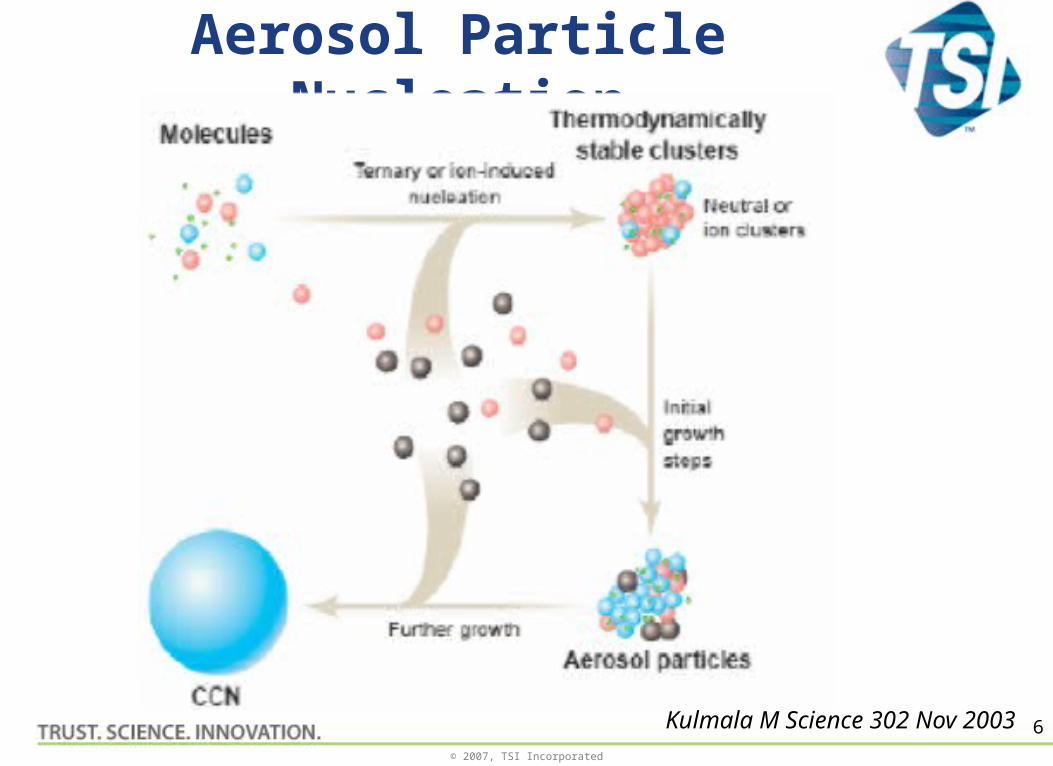
Aerosol Particle Nucleation
6Kulmala M Science 302 Nov 2003

© 2007, TSI Incorporated
Near Road Monitoring= PM Mass Confusion
7
2.3.1.6 Particulate Matter (PM). Motor vehicles emit significant amounts of PM through combustion, brake wear, and tire wear. Motor vehicles may also
contribute to elevated near-road PM concentrations by re-suspending dust present on the road surface. In the United States, the NAAQS regulates
ambient concentrations of PM less than 10 μm in diameter (PM10) and PM less than 2.5 μm in diameter (PM2.5). Both of these PM size fractions are
emitted from motor vehicles. In general, PM emitted by combustion will be in the PM2.5 size fraction. Since combustion-emitted particles typically
occur at less than 0.1 μm in diameter, these emissions tend to contribute little to ambient PM2.5 mass concentrations, but do contribute
significantly to PM number concentrations, and may impact the chemical composition of the PM2.5 mass collected near the road relative
to urban background conditions
Near-Road Air Quality Monitoring: Factors Affecting Network Design and Interpretation of Data
R. Baldauf1,2,*, N. Watkins3, D. Heist4, C. Bailey1, P. Rowley1, R. Shores2

© 2007, TSI Incorporated
Near Road Monitoring= PM Mass Confusion
8
2.3.3.1 PM number concentration. As previously discussed, PM emitted through the combustion
process occurs primarily in the ultrafine size range (i.e. less than 0.1 μm in diameter); thus, the impact
on PM mass may be negligible. However, emissions of these small particles occur in extremely large quantities; therefore, PM number concentration
measurements often provide a good indication of primary PM exhaust emissions from motor vehicles. In addition, several health studies suggest that ultrafine particles may lead to adverse health effects identified in
the near-road literature
Near-Road Air Quality Monitoring: Factors Affecting Network Design and Interpretation of Data
R. Baldauf1,2,*, N. Watkins3, D. Heist4, C. Bailey1, P. Rowley1, R. Shores2
© 2007, TSI Incorporated
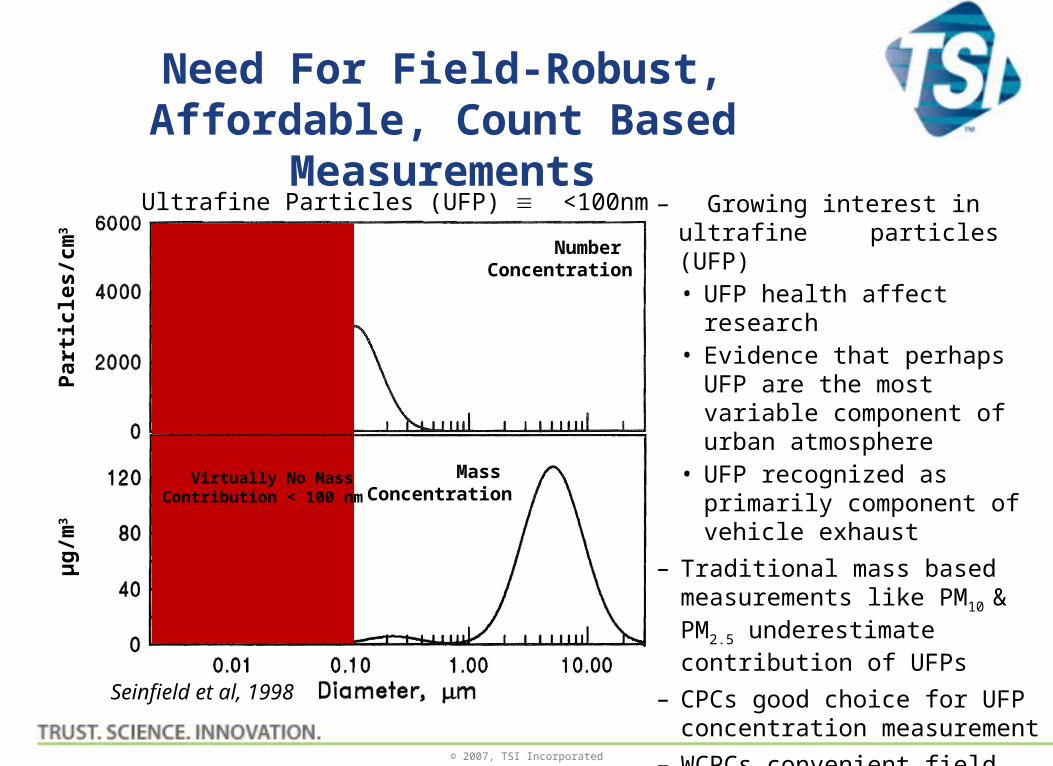
Need For Field-Robust, Affordable, Count Based Measurements
µg
/m3
Mass Concentration
Par
ticl
es/c
m3 Number
Concentration
Virtually No Mass Contribution < 100 nm
– Growing interest in ultrafine particles (UFP)
• UFP health affect research• Evidence that perhaps UFP are
the most variable component of urban atmosphere
• UFP recognized as primarily component of vehicle exhaust
– Traditional mass based measurements like PM10 & PM2.5 underestimate contribution of UFPs
– CPCs good choice for UFP concentration measurement
– WCPCs convenient field choice
Ultrafine Particles (UFP) <100nm
Seinfield et al, 1998

© 2007, TSI Incorporated
How Do You Quantify UFP?Particle Counting Less Than 0.1 m (100nm)
Problem: Detection of light scattering “peters out” for particles less than 0.1 µm
Solution: Make the particles BIGGER → Condensation Particle Counters
Aerosol Inlet w/screen assembly
Transport Flow
Saturator 20oC
Growth Tube 60oC
Optical Detection
Water Separator
External Vacuum
Excess Water Drain
Continuous Flow Water-base Condensation Particle Counter

© 2007, TSI Incorporated
EPC Flow Schematic
Particle Size RangeD50 7 nm - ~ 3 µmParticle Concentration Range 0.001 to 106 particles/cm3
Single Particle Counting; w/live-time correctionParticle Concentration Accuracy10% at 106 particles/cm3
Flow
High-flow Inlet 3 0.3 Liters/minuteLow-flow Inlet 0.60.06 Liters/minuteAerosol Flow Rate 120 12 cm3/minuteWorking Fluid WaterEnvironmental Operating ConditionsAmbient Temperature Range 10 to 40 oC

© 2007, TSI Incorporated
The operating principle of the UFP Monitor is based on diffusion charging of particles, followed by size segregation within a Differential Mobility Analyzer (DMA) and detection of the aerosol via a sensitive electrometer. The charging device in the UFP Monitor is a "Corona-Jet"
charger. Within the charger, the total flow of 5.0 L/min is split into 1.0 L/min passing through two filters (a carbon and a HEPA) and an ionizer and 4.0 L/min of aerosol remaining as sample flow. The flow streams are merged in a mixing chamber where particles in the aerosol
flow mix with the ions carried by the filtered clean air. The charged aerosol then moves on to the DMA for size segregation. After leaving DMA, the aerosol enters a faraday cage where the particles, and their charge, are collected on a particle filter. The filter is conductive, and
is electrically connected to the input of a sensitive electrometer amplifier. One measurement cycle takes approximately 10 minutes with one minute zeroing time between cycles.
3031 Ultrafine Particle Monitor
How Do You Quantify UFP?Particle Sizing & Counting Less Than 0.1 m (100nm)
I 20nm-30nm I 30nm-50nm I 50nm-70nm I 70nm-100nm I 100nm-200nm I >200nm I

© 2007, TSI Incorporated
Filter
11.7 L/min
Roof
16.7 L/min
5 L/min
5 L/min
UFP Monitor
PM10 Inlet
PM1 Cyclone
Exhaust
Valve
Nafion Dryer
Flow Splitter
Dry Aerosol
Filtered Air
Filtered Air
Pump
Filter
11.7 L/min
Roof
16.7 L/min
5 L/min
5 L/min
UFP Monitor
PM10 Inlet
PM1 Cyclone
Exhaust
Valve
Nafion Dryer
Flow Splitter
Dry Aerosol
Filtered Air
Filtered Air
Pump
The UFP Monitor was deployed in concert with the TSI Model 3031200 Environmental Sampling System. A representative sample of ambient air is continuously drawn through a size selective PM10 inlet at a standard flow rate of 16.7 L/min. Next, the sample passes through a PM1
cyclone which removes larger particles. The main sample stream is subsampled into the UFP Monitor at a flow rate of 5 L/min. A Nafion dryer upstream of the UFP Monitor ensures proper conditioning of the aerosol to minimize effects due to relative humidity. The remaining
11.7 L/min of make-up air is routed through the Nafion dryer as purge air and drawn through a vacuum pump and exhausted.
Environmental Sampling System
How Do You Quantify UFP?

© 2007, TSI Incorporated
Distance, Noise and Vegetation Barrierseffect PN monitoring measurements
14
Figure 2. Mobile monitoring measurements of the number of 20 nm size particles present at varying distances from a 125,000 AADT highway for an at-grade road with no obstructions (open field), behind only a noise barrier (noise barrier only), and behind a noise barrier with mature vegetation stands (noise barrier & vegetation). Bars represent 95 percent confidence
intervals for each distance (Baldauf et al., 2008b).

© 2007, TSI Incorporated
Case Study A
QUEENS COLLEGE
& IKE PARK
Long Island, NY
June 2009 – June 2010
© 2007, TSI Incorporated
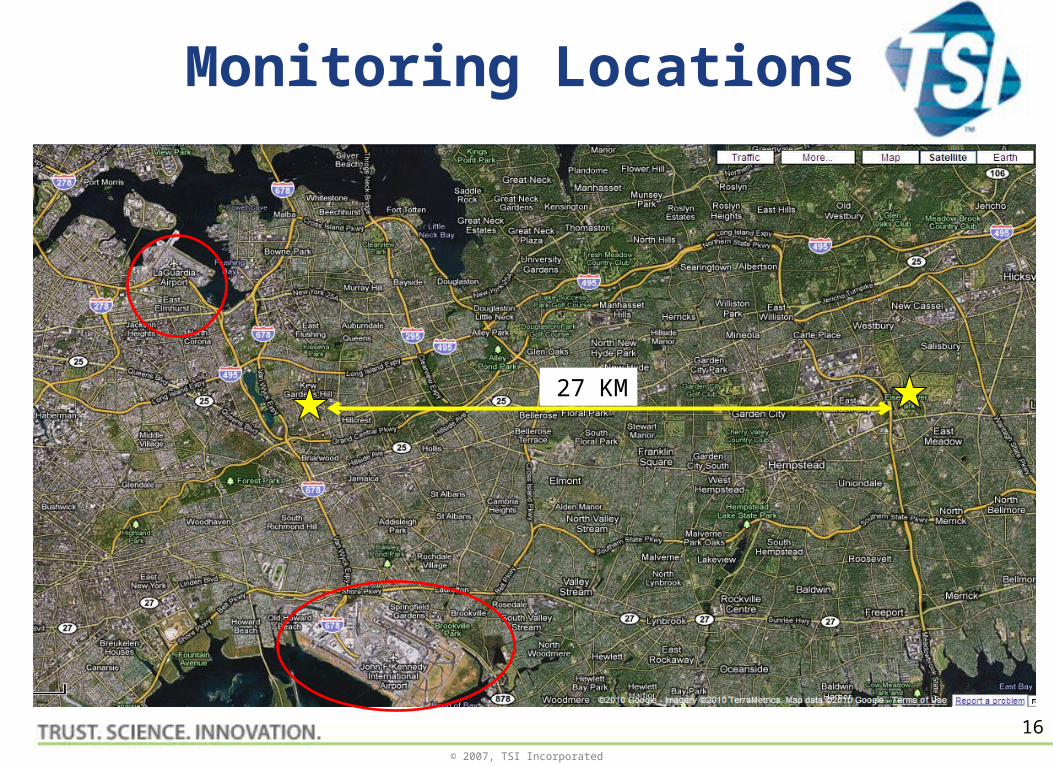
Monitoring Locations
16
27 KM

© 2007, TSI Incorporated
The Queens College monitoring site is a well instrumented monitoring site representative of the New York City metropolitan area located on the campus of Queens College in New York City. The site is bordered by
a mix of sources, including mobile sources from the Long Island and Horace Harding Expressways, as well as local campus parking. It is located 27 kilometers NW of the Eisenhower Park monitoring site.
Hourly wind rose for Queens College averaged over the analysis period.
*Courtesy of Brian Frank & NYSDEC – 2010 AAAR POSTER Intercomparison of Long-Term Ambient Ultrafine Particle Size Distribution
Measurements at a Near-Roadway and a Representative Urban Site in New York City
Queens College

© 2007, TSI Incorporated
How do initial monitoring results look?Queens College, NY
0:07
1:07
2:07
3:07
4:07
5:07
6:07
7:07
8:07
9:07
10:0
711
:0712
:0713
:0714
:0715
:0716
:0717
:0718
:0719
:0720
:0721
:0722
:0723
:07
0
5000
10000
15000
20000
25000
30000
35000
NY StateTuesday, January 19, 2010
20-30nm
30-50nm
50-70nm
70-100nm
100-200nm
200-500nm
Total
Par
ticl
es /
cc
Typical Commuter Traffic Patterns
© 2007, TSI Incorporated
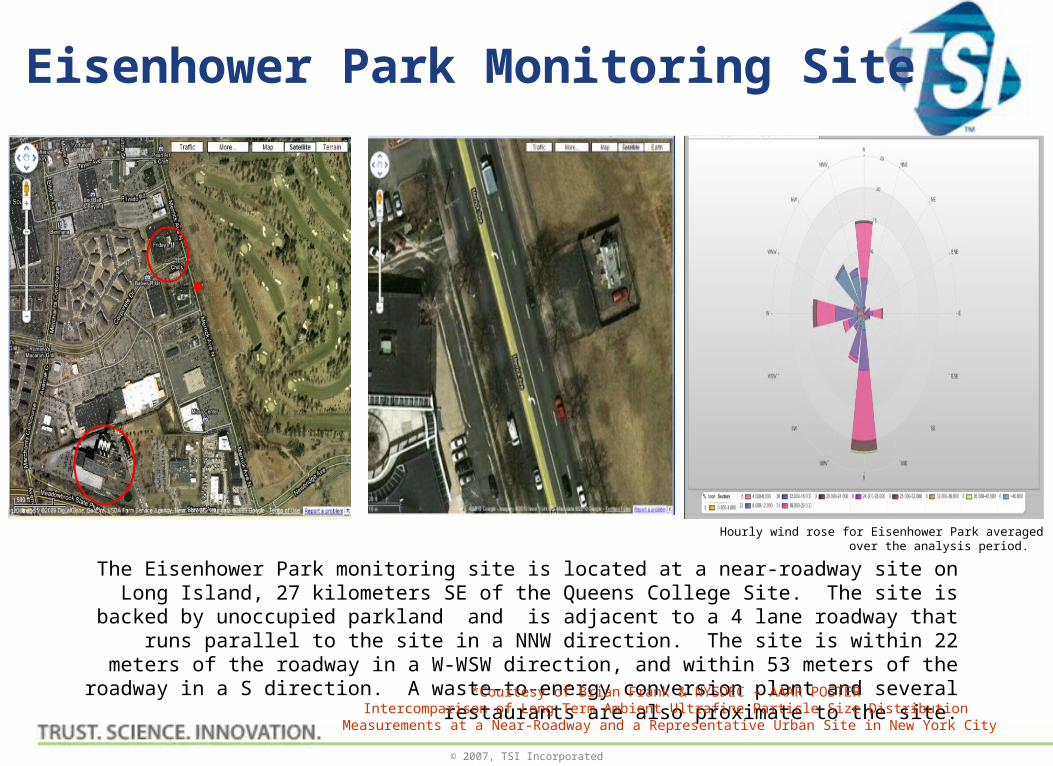
The Eisenhower Park monitoring site is located at a near-roadway site on Long Island, 27 kilometers SE of the Queens College Site. The site is backed by unoccupied parkland and is adjacent to a 4
lane roadway that runs parallel to the site in a NNW direction. The site is within 22 meters of the roadway in a W-WSW direction, and within 53 meters of the roadway in a S direction. A waste-to-
energy conversion plant and several restaurants are also proximate to the site.
Hourly wind rose for Eisenhower Park averaged over the analysis period.
*Courtesy of Brian Frank & NYSDEC – AAAR POSTER Intercomparison of Long-Term Ambient Ultrafine Particle Size Distribution
Measurements at a Near-Roadway and a Representative Urban Site in New York City
Eisenhower Park Monitoring Site

© 2007, TSI Incorporated
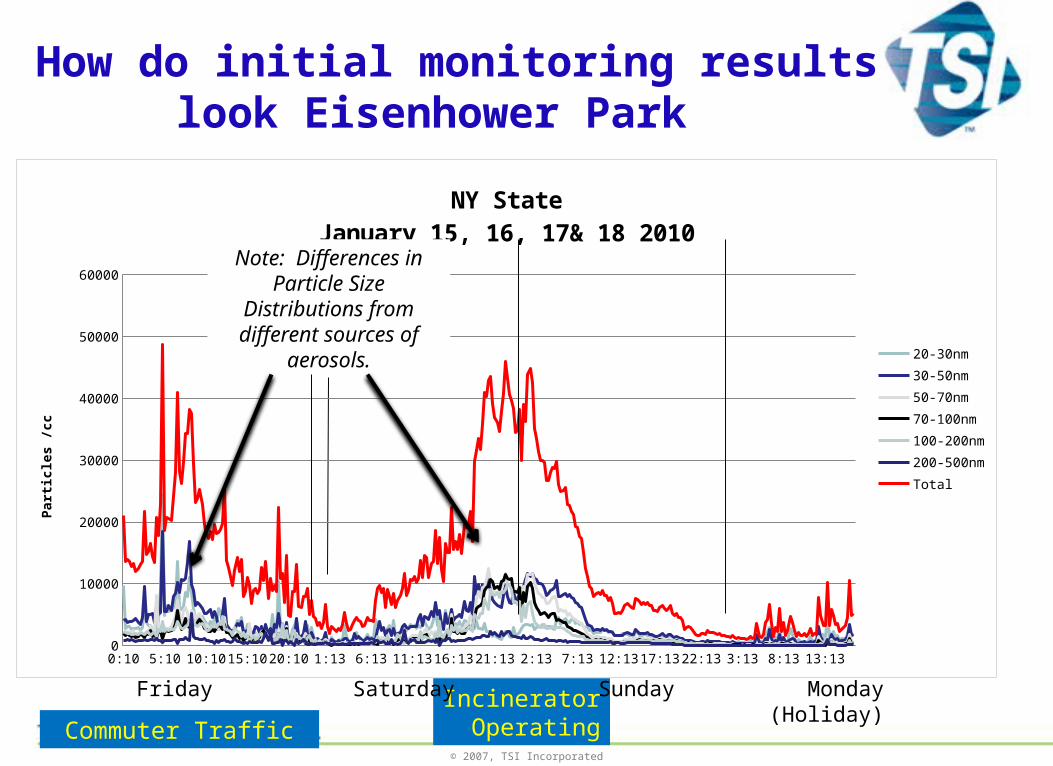
How do initial monitoring results look Eisenhower Park
Commuter TrafficIncineratorOperating
0:10 4:10 8:10 12:1016:1020:10 0:13 4:13 8:13 12:1316:1320:13 0:13 4:13 8:13 12:1316:1320:13 0:13 4:13 8:13 12:1316:130
10000
20000
30000
40000
50000
60000
NY StateJanuary 15, 16, 17& 18 2010
20-30nm
30-50nm
50-70nm
70-100nm
100-200nm
200-500nm
Total
Par
ticl
es /
cc
Friday Saturday Sunday Monday(Holiday)
© 2007, TSI Incorporated
Commuter TrafficIncineratorOperating
0:10 4:10 8:10 12:1016:1020:10 0:13 4:13 8:13 12:1316:1320:13 0:13 4:13 8:13 12:1316:1320:13 0:13 4:13 8:13 12:1316:130
10000
20000
30000
40000
50000
60000
NY StateJanuary 15, 16, 17& 18 2010
20-30nm
30-50nm
50-70nm
70-100nm
100-200nm
200-500nm
Total
Par
ticl
es /
cc
Note: Differences in Particle Size
Distributions from different sources of
aerosols.
Friday Saturday Sunday Monday(Holiday)
How do initial monitoring results look Eisenhower Park

© 2007, TSI Incorporated
22
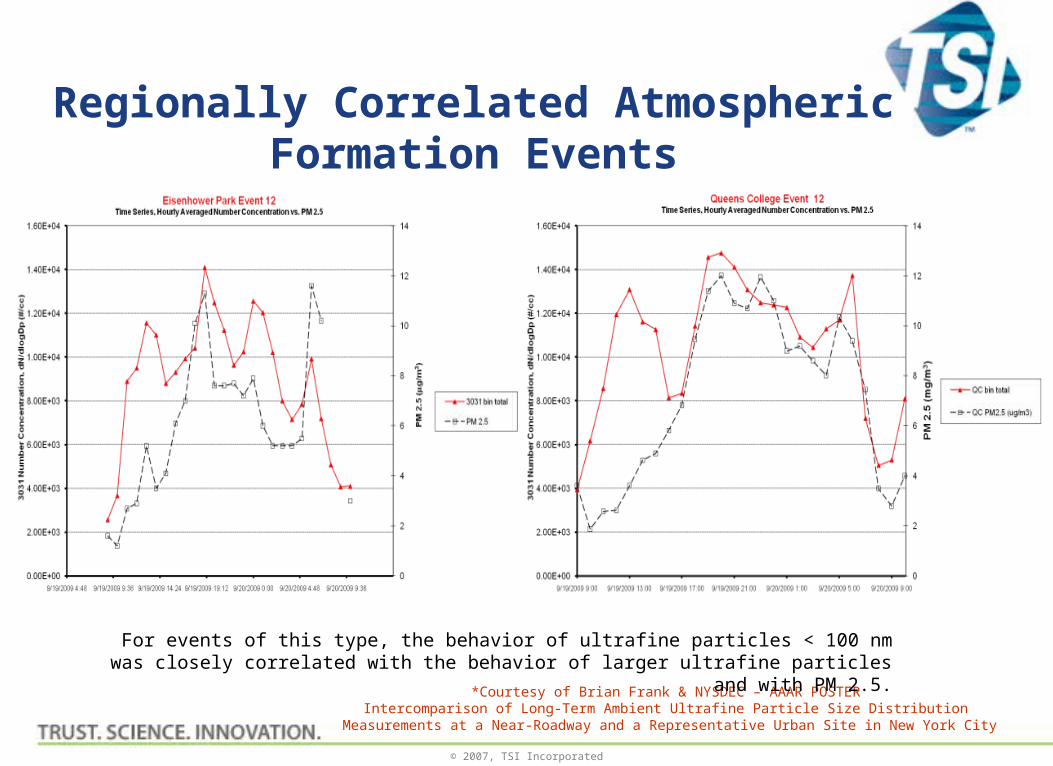
For events of this type, the behavior of ultrafine particles < 100 nm was closely correlated with the behavior of larger ultrafine particles and with PM 2.5.
*Courtesy of Brian Frank & NYSDEC – AAAR POSTER Intercomparison of Long-Term Ambient Ultrafine Particle Size Distribution
Measurements at a Near-Roadway and a Representative Urban Site in New York City
Regionally Correlated Atmospheric Formation Events
© 2007, TSI Incorporated
*Courtesy of Brian Frank & NYSDEC – AAAR POSTER Intercomparison of Long-Term Ambient Ultrafine Particle Size Distribution
Measurements at a Near-Roadway and a Representative Urban Site in New York City
Regionally Correlated Atmospheric Formation Events
For events of this type, the behavior of ultrafine particles < 100 nm was closely correlated with the behavior of larger ultrafine particles and with PM 2.5.

© 2007, TSI Incorporated
*Courtesy of Brian Frank & NYSDEC – AAAR POSTER Intercomparison of Long-Term Ambient Ultrafine Particle Size Distribution
Measurements at a Near-Roadway and a Representative Urban Site in New York City
© 2007, TSI Incorporated
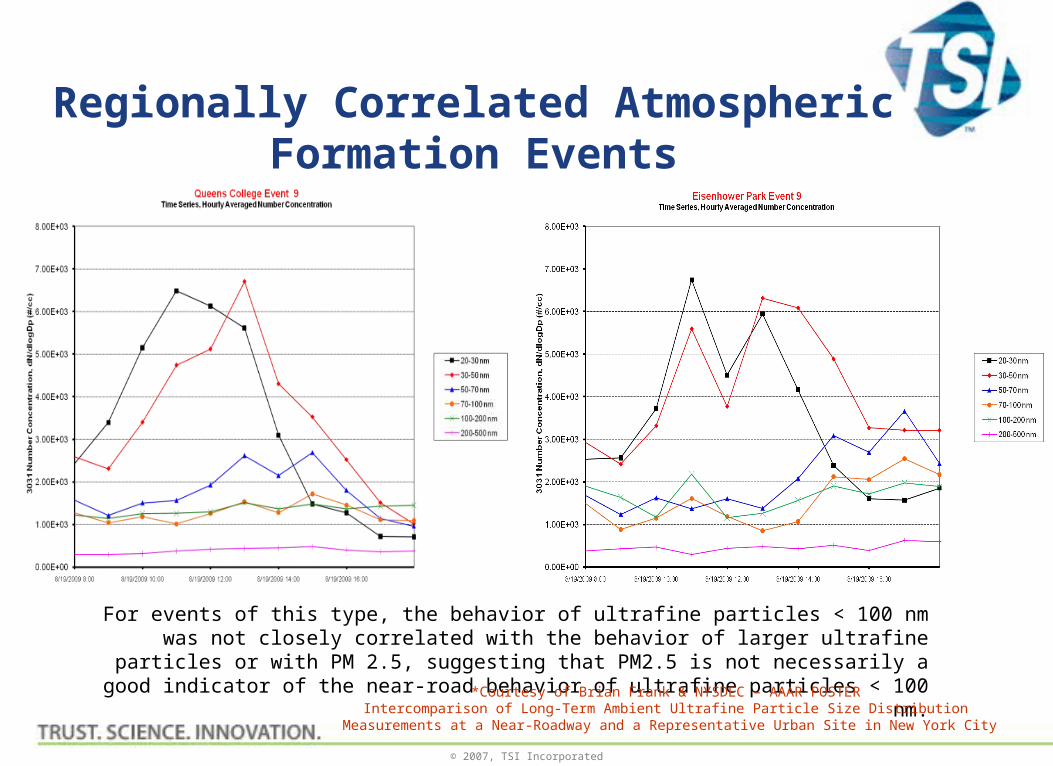
For events of this type, the behavior of ultrafine particles < 100 nm was not closely correlated with the behavior of larger ultrafine particles or with PM 2.5, suggesting that PM2.5 is not
necessarily a good indicator of the near-road behavior of ultrafine particles < 100 nm.
*Courtesy of Brian Frank & NYSDEC – AAAR POSTER Intercomparison of Long-Term Ambient Ultrafine Particle Size Distribution
Measurements at a Near-Roadway and a Representative Urban Site in New York City
Regionally Correlated Atmospheric Formation Events

© 2007, TSI Incorporated
*Courtesy of Brian Frank & NYSDEC – AAAR POSTER Intercomparison of Long-Term Ambient Ultrafine Particle Size Distribution
Measurements at a Near-Roadway and a Representative Urban Site in New York City
Regionally Correlated Atmospheric Formation Events
For events of this type, the behavior of ultrafine particles < 100 nm was not closely correlated with the behavior of larger ultrafine particles or with PM 2.5, suggesting that PM2.5 is not
necessarily a good indicator of the near-road behavior of ultrafine particles < 100 nm.

© 2007, TSI Incorporated
*Courtesy of Brian Frank & NYSDEC – AAAR POSTER Intercomparison of Long-Term Ambient Ultrafine Particle Size Distribution
Measurements at a Near-Roadway and a Representative Urban Site in New York City

© 2007, TSI Incorporated
*Courtesy of Brian Frank & NYSDEC – AAAR POSTER Intercomparison of Long-Term Ambient Ultrafine Particle Size Distribution
Measurements at a Near-Roadway and a Representative Urban Site in New York City
Regionally Correlated Diurnal Events

© 2007, TSI Incorporated
Ike ParkNOx vs Channel 1 (20-30nm)

© 2007, TSI Incorporated
Ike ParkNO2 vs Channel 4 (70-100nm)

© 2007, TSI Incorporated
Ike ParkNOx vs Channel 4 (70-100nm)

© 2007, TSI Incorporated
Queens College NO2Channel 4 (70-100nm)

© 2007, TSI Incorporated
SO2 Channel 1 (20-30nm) & 6 (200-500nm)

© 2007, TSI Incorporated
SO2 Channel 5 (200-500nm)

© 2007, TSI Incorporated
PSO4 Channel 5 (200-500nm)
© 2007, TSI Incorporated
Conclusions NOX vs UFP
• Does not correlate well with the largest (200-500nm) or smallest (20-50nm) channels. This supports a significant general conclusion that we found, which was that none of the non-UFP data we gathered ever correlated with the smallest (20-50 nm) bin, i.e., there are no surrogates for UFPs below 50 nm; they have to be directly measured.
• The middle channels (50-200 nm) correlate well with NOx in Fall, Winter and Spring, but not in Summer.
• We speculate that this is due to the high temperatures in summer, which cause particle-phase nitrate to evaporate even if it forms. This is supported by the finding that we see the same seasonal behavior for NO2, which is an intermediate for nitrate
formation Less pronounced at IP than at QC.
© 2007, TSI Incorporated
Conclusions SO2 vs UFP• Again, consistently low correlations (R2 always < 0.5) for the smallest (20-
50 nm) size bin. [• The middle channels (50-200nm) correlate well with SO2 in Winter, but not
in Spring, Summer, and Fall. Winter has the highest correlations and Summer has no correlations (ie R2 < 0.5).]
• For QC only (we don’t have IP data on this); particle phase SO4 also correlates with UFPs according to the same trend.
• Our measurements also indicate that SO2 is higher in the winter, and we speculate that greater amounts are therefore available for particle formation. This higher SO2 may be potentially due to local heating; the lower amount of transport SO2 available in the summer may be insufficient for particle formation.
• Side note: since the correlation with PMSO4 was so low in the summertime we wouldn’t expect to learn anything useful from looking at the AMS data from the QC09 summer intensive.
© 2007, TSI Incorporated
The authors wish to thank Michael Christopherson, Robert Murway, Aaron Pulaski, Sergio Fleishaker, and Enrique Lopez of the New York State Department of Environmental Conservation
for their assistance.
Acknowledgements

© 2007, TSI Incorporated
Thank You For
Your Attention
Any Questions?
Robert C. Anderson ([email protected])

© 2007, TSI Incorporated
Forrest Fire in Quebec – Smoke Blowing into Boston

© 2007, TSI Incorporated
Boston Quebec Fire Event -- Hourly PM2.5, Aeth DC, and # concPM2.5 is average of N.End and Roxbury MA-DEP sites
Courtesy of NESCAUMGeorge Allen
Courtesy of George Allen - NESCAUM