Dry-grinded Ultrafine Cements Hydration. Physicochemical ... · PDF fileDry-grinded Ultrafine...
13
*e-mail: [email protected] Dry-grinded Ultrafine Cements Hydration. Physicochemical and Microstructural Characterization Foteini Kontoleontos a , Petros Tsakiridis b *, Apostolos Marinos a , Nikolaos Katsiotis a , Vasileios Kaloidas c , Margarita Katsioti a a School of Chemical Engineering, National Technical University of Athens, 9 Heroon Polytechniou St, 15780 Athens, Greece b School of Mining and Metallurgical Engineering, National Technical University of Athens, 9 Heroon Polytechniou St, 15780 Athens, Greece c EKET Central Laboratory, Heracles Group, 19 K. Pateli, 14123, Lykovrissi, Attica, Greece Received: July 26, 2012; Revised: October 8, 2012 The aim of the present research work was the evaluation of the physicochemical and microstructural properties of two ultrafine cements, produced by dry grinding of a commercial CEM I 42.5N cement. The effect of grinding on particle size distribution was determined by laser scattering analyzer. All cements were tested for initial and final setting times, consistency of standard paste, soundness, flow of normal mortar and compressive strengths after 1, 2, 7 and 28 days. The effect of the fineness on the heat of hydration was also investigated. The hydration products were determined by X-ray diffraction analysis and by Fourier transform infrared spectroscopy, at 1, 2, 7 and 28 days. The microstructure of the hardened cement pastes and their morphological characteristics were examined by scanning electron microscopy. Porosity and pore size distribution were evaluated by mercury intrusion porosimetry. The effects of greater fineness on compressive strengths were evident principally at early ages. After the first 24 hours of hydration, the compressive strength of the finest cements was about 3 times higher (over 48 MPa) than the corresponding of CEM I 42.5N (15.1 MPa). Keywords: ultrafine cement, heat of hydration, physical & mechanical properties, microstructure 1. Introduction Ultrafine grinding is an energy-intensive stage in the overall of the process, which provides materials in the proper fine size range for the required properties of final product 1,2 . The quality of cement is measured by the specific surface area (Blaine index). The cement clinker grinding circuit reduces the feed from 80% passing size between 10 and 20 mm to 100% passing 90 μm. However, the specific surface area of the cement powder depends also on size distribution of cement particles (smaller particles have larger specific surface area) 3,4 . Cement performance is a direct consequence of the clinker chemistry and mineralogy. However, it is well known that the properties of cement are also affected by its fineness and particle size distribution. The chemical and mineralogical composition of the ultra fine cement is analogous to that of OPC and only the specific surface area is much larger 5,6 . The increased rate of strength gain is usually achieved by a higher alite content (C 3 S higher than 55%, sometimes up to 70%) and by a finer grinding of the cement clinker 7,8 . On average, high early strength cements have Blaine specific surface area of 4500 to 6000 cm 2 .g –1 . The higher fineness significantly increases the strength at 10 to 24 hours, with the increase persisting up to 28 days. Cement compressive strengths increases with fineness, or specific surface area, and that for equal specific surface area, cements with a narrow particle size distribution have a higher strength than those with a wide size distribution 9,10 . Since cements with equal specific surface area may differ in their particle size distribution, the specific surface area is not an unambiguous criterion of fineness. It may have the same value for large average particle size and wide particle size distribution as for a smaller average size and narrow distribution. Skvara et al. studied the relationship between the particle size distribution of a special type of high early strength cement and its strength development characteristics 11 . The same clinker was ground in a laboratory ball mill to various levels of specific surface area to produce cements having Blaine values ranging between 4200 and 10000 cm 2 .g –1 . The strength gain after one day of curing appeared to be a direct function of the specific surface area of the cement. At 1 day, the ultrafine mixes were quite porous and consisted of near spherical, extremely fine unhydrated and nominally hydrated cement particles, with Ca(OH) 2 being extremely rare in the paste. By 7 days the paste acquired some degree of denseness, cement particles began to hydrate, and Ca(OH) 2 appeared in the paste. At 28 days the paste becomes extremely dense, and the paste porosity decreases. High energy milling has been applied by García-Luna and Bernal, in order to reduce the particle size of OPC 12 . The milling results showed a great particle size reduction with 50% of the powder ≤ 1 μm and 100% ≤ 6 μm. After OI: D 10.1590/S1516-14392013005000014 Materials Research. 2013; 16(2): 404-416 © 2013
Transcript of Dry-grinded Ultrafine Cements Hydration. Physicochemical ... · PDF fileDry-grinded Ultrafine...

*e-mail: [email protected]
Dry-grinded Ultrafine Cements Hydration. Physicochemical and Microstructural Characterization
Foteini Kontoleontosa, Petros Tsakiridisb*, Apostolos Marinosa,
Nikolaos Katsiotisa, Vasileios Kaloidasc, Margarita Katsiotia
aSchool of Chemical Engineering, National Technical University of Athens, 9 Heroon Polytechniou St, 15780 Athens, Greece
bSchool of Mining and Metallurgical Engineering, National Technical University of Athens, 9 Heroon Polytechniou St, 15780 Athens, Greece
cEKET Central Laboratory, Heracles Group, 19 K. Pateli, 14123, Lykovrissi, Attica, Greece
Received: July 26, 2012; Revised: October 8, 2012
The aim of the present research work was the evaluation of the physicochemical and microstructural properties of two ultrafine cements, produced by dry grinding of a commercial CEM I 42.5N cement. The effect of grinding on particle size distribution was determined by laser scattering analyzer. All cements were tested for initial and final setting times, consistency of standard paste, soundness, flow of normal mortar and compressive strengths after 1, 2, 7 and 28 days. The effect of the fineness on the heat of hydration was also investigated. The hydration products were determined by X-ray diffraction analysis and by Fourier transform infrared spectroscopy, at 1, 2, 7 and 28 days. The microstructure of the hardened cement pastes and their morphological characteristics were examined by scanning electron microscopy. Porosity and pore size distribution were evaluated by mercury intrusion porosimetry. The effects of greater fineness on compressive strengths were evident principally at early ages. After the first 24 hours of hydration, the compressive strength of the finest cements was about 3 times higher (over 48 MPa) than the corresponding of CEM I 42.5N (15.1 MPa).
Keywords: ultrafine cement, heat of hydration, physical & mechanical properties, microstructure
1. IntroductionUltrafine grinding is an energy-intensive stage in the
overall of the process, which provides materials in the proper fine size range for the required properties of final product1,2. The quality of cement is measured by the specific surface area (Blaine index). The cement clinker grinding circuit reduces the feed from 80% passing size between 10 and 20 mm to 100% passing 90 μm. However, the specific surface area of the cement powder depends also on size distribution of cement particles (smaller particles have larger specific surface area)3,4.
Cement performance is a direct consequence of the clinker chemistry and mineralogy. However, it is well known that the properties of cement are also affected by its fineness and particle size distribution. The chemical and mineralogical composition of the ultra fine cement is analogous to that of OPC and only the specific surface area is much larger5,6.
The increased rate of strength gain is usually achieved by a higher alite content (C
3S higher than 55%, sometimes
up to 70%) and by a finer grinding of the cement clinker7,8. On average, high early strength cements have Blaine specific surface area of 4500 to 6000 cm2.g–1. The higher fineness significantly increases the strength at 10 to 24 hours, with the increase persisting up to 28 days. Cement compressive strengths increases with fineness, or specific surface area, and that for equal specific surface area, cements with a
narrow particle size distribution have a higher strength than those with a wide size distribution9,10.
Since cements with equal specific surface area may differ in their particle size distribution, the specific surface area is not an unambiguous criterion of fineness. It may have the same value for large average particle size and wide particle size distribution as for a smaller average size and narrow distribution. Skvara et al. studied the relationship between the particle size distribution of a special type of high early strength cement and its strength development characteristics11. The same clinker was ground in a laboratory ball mill to various levels of specific surface area to produce cements having Blaine values ranging between 4200 and 10000 cm2.g–1. The strength gain after one day of curing appeared to be a direct function of the specific surface area of the cement. At 1 day, the ultrafine mixes were quite porous and consisted of near spherical, extremely fine unhydrated and nominally hydrated cement particles, with Ca(OH)
2 being extremely rare in the
paste. By 7 days the paste acquired some degree of denseness, cement particles began to hydrate, and Ca(OH)
2 appeared in
the paste. At 28 days the paste becomes extremely dense, and the paste porosity decreases.
High energy milling has been applied by García-Luna and Bernal, in order to reduce the particle size of OPC12. The milling results showed a great particle size reduction with 50% of the powder ≤ 1 μm and 100% ≤ 6 μm. After
OI:D 10.1590/S1516-14392013005000014Materials Research. 2013; 16(2): 404-416 © 2013
Dry-grinded Ultrafine Cements Hydration. Physicochemical and Microstructural Characterization
28 days of curing (w/c: 0.32-0.34) compressive strength values between 90 and 105 MPa were obtained, which are almost four times higher than OPC’s values.
Navi and Pignat examined the effect of particle size distribution on the capillary pore structure of cement paste and they established that the evolution of the microstructure of hardened cement paste strongly depended on it13. For the same w/c ratio, the cement with the finer particles presented higher degrees of hydration, whereas the coarse ones produced larger pores at any given curing stage.
However, it should be noticed that problems such as short setting times and strength retrogression (few days after hardening) may be observed, because of the fine particle size. Sarkar and Wheeler have stated that the heat evolution of ultrafine cement within the first 24 hours can be exceptionally high compared to that of an ASTM Type III cement14. This results in rapid consumption of the available water, which in turn leads to limited hydration at later ages. As a consequence, strength gain of ultrafine cement can be low. High heat is also likely to generate microcracks. The Authors improved the properties of the ultrafine cement (with Blaine specific area greater than 7000 cm2.g–1), by adding small dosages of a solid retarder.
When the fineness of cement is higher, the hydration speed is faster and the hydration products increase rapidly. The rapid hardening of cement pastes (flash set), in the first stage of hydration, is mainly due to the reaction of tricalcium aluminate (C
3A) with water and it is usually controlled
by the addition of an optimum amount of natural gypsum (CaSO
4 2H
2O), which acts a retarder. This addition, apart
from the setting time, also affects the strength development of the hydrated cement paste and avoids shrinkage. However, if its addition exceeds a certain limit, it can lead to substantial expansion of cement paste. The required amount of gypsum in a specific cement type increases with the amount of C
3A
in the clinker and the fineness of the cement9,15. Modification of the sulphate-bearing admixture to the reactivity of the tricalcium aluminate (C
3A) is, therefore, of significant
importance in retarding setting and improving the strength development. It is known that there is an optimum SO
3
content, yielding the highest strength. The optimum amount at early ages is closely related to the amount of SO
3
necessary for proper retardation, and so it will be affected by the amount and reactivity of C
3A, the quantity of soluble
alkalis, the cement fineness and the reactivity of the SO3
bearing compositions. Proper SO3 optimization is usually
worthwhile as a deviation of 1% SO3 from the optimum
value (or range) can result in a decrease in strength by 5 MPa or more, at 28 days.
Although the production of cements with a great fineness increase the total production cost, micro or ultra fine cements have been proposed to be used in oil well cementing technology16. They also used extensively in the pre-grouting (and post-grouting) of rock tunnels for consolidation and water tightening of the rock. Investigations have been carried out on cements of normal commercial levels of fineness and on fine cements produced by grinding or classifying, mainly because of problems with injection technology17.
The aim of the present research work was the evaluation of the physicochemical and microstructural properties of two
ultrafine cements (with a specific surface area greater than 7000 cm2.g–1), produced by dry grinding of a commercial CEM I 42.5N cement. All cements were tested for setting times, consistency of standard paste, flow of normal mortar and compressive strengths after 1, 2, 7 and 28 days. X-ray diffraction (XRD), Fourier transform infrared spectroscopy (FT-IR), scanning electron microscopy (SEM) and mercury intrusion porosimetry (MIP) tests were conducted to study the hydration products.
2. ExperimentalExperiments were carried out in order to produce
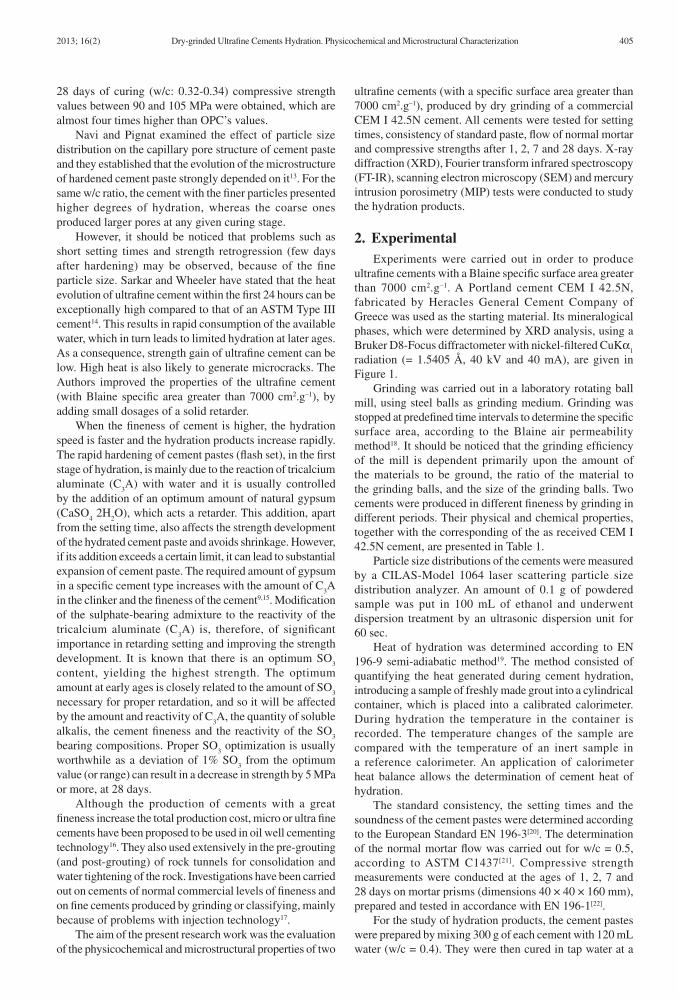
ultrafine cements with a Blaine specific surface area greater than 7000 cm2.g–1. A Portland cement CEM I 42.5N, fabricated by Heracles General Cement Company of Greece was used as the starting material. Its mineralogical phases, which were determined by XRD analysis, using a Bruker D8-Focus diffractometer with nickel-filtered CuKα
1
radiation (= 1.5405 Å, 40 kV and 40 mA), are given in Figure 1.
Grinding was carried out in a laboratory rotating ball mill, using steel balls as grinding medium. Grinding was stopped at predefined time intervals to determine the specific surface area, according to the Blaine air permeability method18. It should be noticed that the grinding efficiency of the mill is dependent primarily upon the amount of the materials to be ground, the ratio of the material to the grinding balls, and the size of the grinding balls. Two cements were produced in different fineness by grinding in different periods. Their physical and chemical properties, together with the corresponding of the as received CEM I 42.5N cement, are presented in Table 1.
Particle size distributions of the cements were measured by a CILAS-Model 1064 laser scattering particle size distribution analyzer. An amount of 0.1 g of powdered sample was put in 100 mL of ethanol and underwent dispersion treatment by an ultrasonic dispersion unit for 60 sec.
Heat of hydration was determined according to EN 196-9 semi-adiabatic method19. The method consisted of quantifying the heat generated during cement hydration, introducing a sample of freshly made grout into a cylindrical container, which is placed into a calibrated calorimeter. During hydration the temperature in the container is recorded. The temperature changes of the sample are compared with the temperature of an inert sample in a reference calorimeter. An application of calorimeter heat balance allows the determination of cement heat of hydration.
The standard consistency, the setting times and the soundness of the cement pastes were determined according to the European Standard EN 196-3[20]. The determination of the normal mortar flow was carried out for w/c = 0.5, according to ASTM C1437[21]. Compressive strength measurements were conducted at the ages of 1, 2, 7 and 28 days on mortar prisms (dimensions 40 × 40 × 160 mm), prepared and tested in accordance with EN 196-1[22].
For the study of hydration products, the cement pastes were prepared by mixing 300 g of each cement with 120 mL water (w/c = 0.4). They were then cured in tap water at a
2013; 16(2) 405
Kontoleontos et al.
temperature 20 ± 2 °C. At the ages of 1, 2, 7 and 28 days, the hydration was stopped by means of acetone and ether extraction. The hydration products were mineralogically determined by X-ray diffraction, using a Bruker D8-Focus diffractometer. They were also characterized by a Spectrum GX (Perkin Elmer) Fourier transform spectrophotometer, in the range of 4000-400 cm−1, using the Kbr pellet technique. The pellets were prepared by pressing a mixture of the sample and dried KBr (ratio, about 1:200) at 8 t.cm–2.
In order to get an idea of their morphology, the hydration products were also examined by scanning electron
microscopy (SEM) using a Jeol 6380 LV Scanning Electron Microscope. Experimental conditions involved 15 kV accelerating voltage. Microanalysis of the cement pastes was performed by an Oxford INCA Energy Dispersive Spectrometer (EDS) connected to the SEM. Finally, mercury intrusion porosimetry was considered a satisfactory technique for determining basic structural characteristics, such as pore size distribution, specific surface area and pore volume. A Carlo Erba 4000 mercury porosimeter was used for porosimetry measurements, having a pressure range from 1-4000 bar.
Figure 1. X-ray diffraction of the cement CEM I 42.5N.
Table 1. Chemical analyses and physical characteristics of the examined cements.
OxidesChemical analysis (%)
CEM I 42.5N UF-I UF-II
SiO2
20.11 20.14 20.05
Al2O
35.15 5.25 5.15
Fe2O
33.35 3.25 3.35
CaO 63.00 63.05 63.10
MgO 2.65 2.61 2.62
K2O 0.62 0.56 0.61
Na2O 0.29 0.28 0.29
SO3
2.44 2.38 2.40
TiO2
0.263 0.258 0.251
P2O
50.169 0.155 0.153
Cr2O
30.049 0.050 0.050
LOI 1.39 1.41 1.40
Physical properties
Specific surface Area (Blaine-cm2.g–1) 3870 7810 10725
Specific gravity (g.cm–2) 3.26 3.25 3.25
406 Materials Research
Dry-grinded Ultrafine Cements Hydration. Physicochemical and Microstructural Characterization
3. Results and Discussion
3.1. Cements physical and chemical properties
According to the analyses presented in Table 1, the chemical composition of the fine ground Portland cements, is compared with that of CEM I 42.5N. Minor variations in composition of the three cements that are evident are common between different batches of cement. The quantitative determination of the principal cement anhydrous phases was carried by Rietveld analysis technique and the results are given in Table 2.
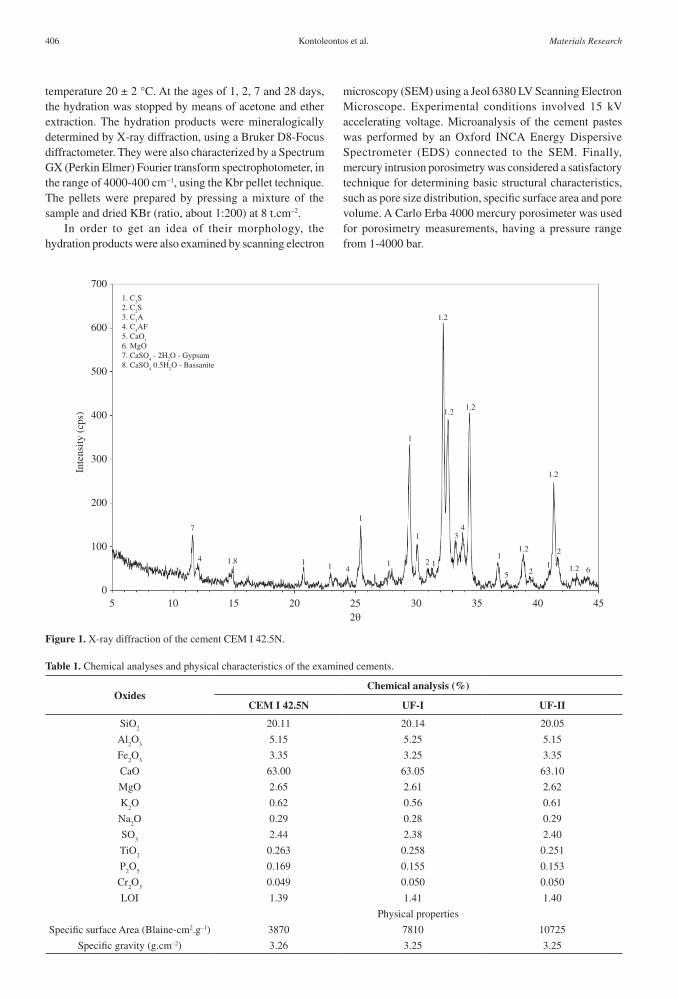
The typical particle distribution data describing the three examined cements are shown in Figure 2. The mean and median sizes of the cements PSD curve, their 45 μm percent passing value, size and spread factors (n, X
o) of the
Rosin-Rammler distribution and Blaine specific surface area values, which are all indicators of the material’s fineness, are summarized in Table 3. The expected reduction in
particle size and the increase in specific surface area with the increase in milling time are evident. Grinding resulted in a reasonably smooth and continuous shift of the particle size distributions to finer sizes.
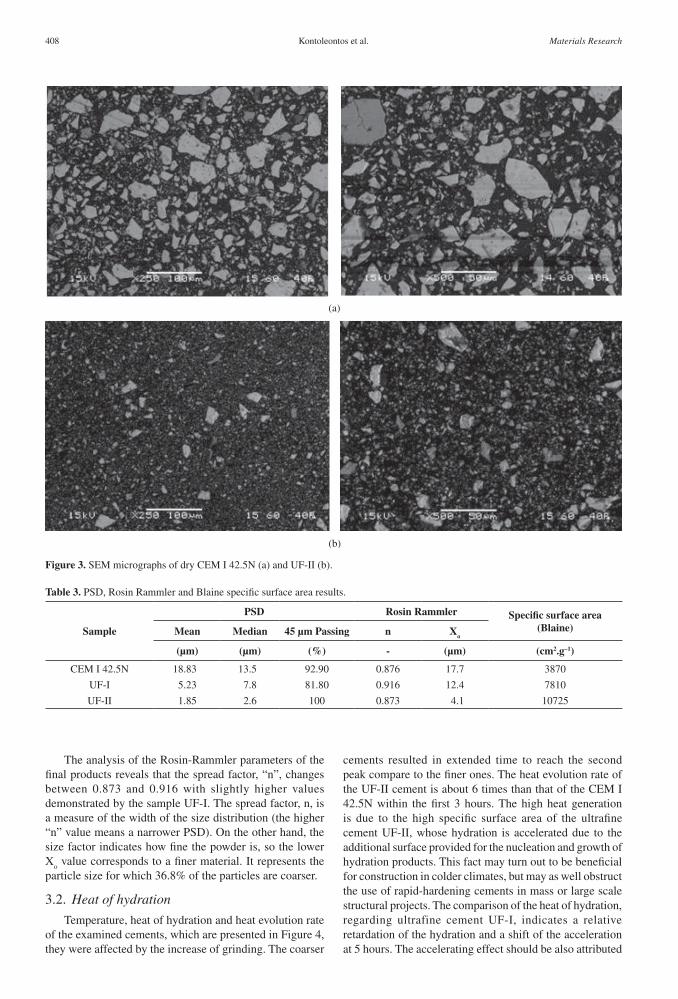
The greatest particle size reduction was observed particularly for UF-II cement that has 100% of powder under 35 μm. This particle size diminution can be also observed in the SEM micrographs shown in Figure 3. UF-II cement presented the highest specific surface area, lower values of the size distribution parameters and higher values of the 45 μm percent passing. It was also found that 23% of it was below 1 μm, whereas the majority (90%) of the particles were below 10 μm. It should be noticed that UF-I cement presented a relatively heterogeneous distribution of particle size and contains two major size fractions: a fine-grained portion (≈7.5 μm) and a coarser part (≈12.5 μm). The above observation was confirmed and by the Rosin-Rammler analysis and it was attributed to the partial agglomeration phenomena.
Figure 2. Particle size distributions of the examined cement samples by a laser scattering analyzer. a) Cumulative Passing PSD; b) Individual Retained PSD.
Table 2. Phase composition by Rietveld analysis.
Phaseswt. (%)
CEM I 42.5N UF-I UF-II
Alite - C3S monoclinic 50.8 50.5 50.7
Belite – b-C2S 21.2 21.3 21.1
Aluminates (cubic) (Orthorhombic)6.3 6.2 6.3
0.4 0.7 0.4
Ferrite – C2Fe
2-xAl
xO
58.8 8.7 8.9
Periclase (MgO) 1.9 1.8 1.9
Lime (CaOf) 1.1 1.2 1
Arcanite (K2SO
4) 0 0.1 0.1
Apthitalite ((Na,K)2SO
4) 0.6 0.7 0.6
Gypsum 2.2 2.1 2.2
Hemihydrate 1.1 1.1 1
Anhydrite 0.1 0.1 0.2
Portlandite 0.6 0.5 0.6
Calcite 4.1 3.9 4
Dolomite 0.8 1.1 1
Quartz (SiO2) 0 0 0
2013; 16(2) 407
Kontoleontos et al.
The analysis of the Rosin-Rammler parameters of the final products reveals that the spread factor, “n”, changes between 0.873 and 0.916 with slightly higher values demonstrated by the sample UF-I. The spread factor, n, is a measure of the width of the size distribution (the higher “n” value means a narrower PSD). On the other hand, the size factor indicates how fine the powder is, so the lower X
o value corresponds to a finer material. It represents the
particle size for which 36.8% of the particles are coarser.
3.2. Heat of hydration
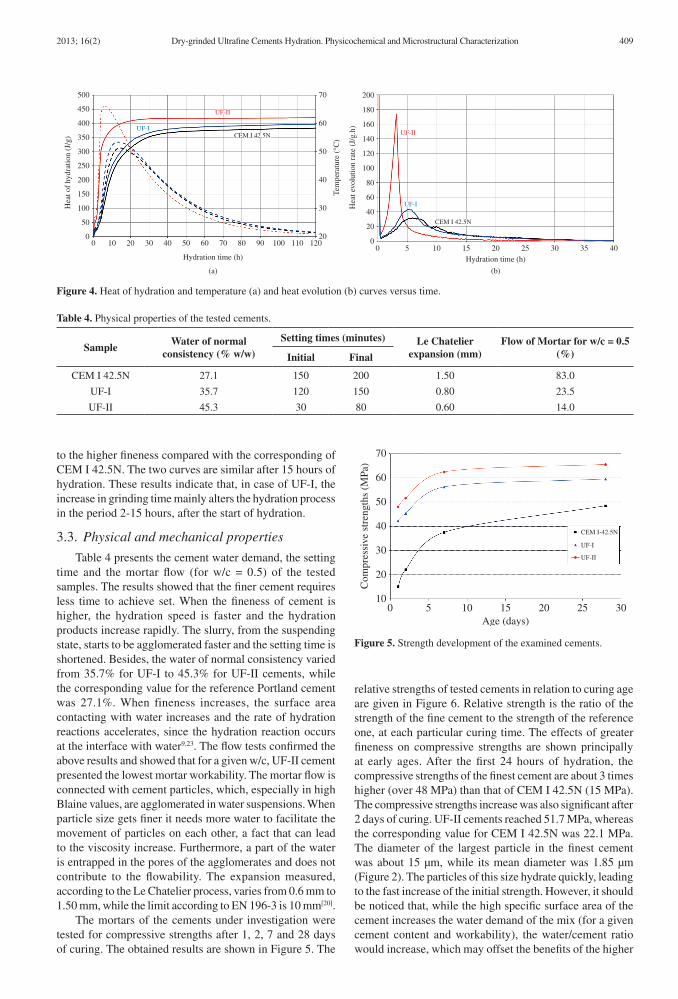
Temperature, heat of hydration and heat evolution rate of the examined cements, which are presented in Figure 4, they were affected by the increase of grinding. The coarser
cements resulted in extended time to reach the second peak compare to the finer ones. The heat evolution rate of the UF-II cement is about 6 times than that of the CEM I 42.5N within the first 3 hours. The high heat generation is due to the high specific surface area of the ultrafine cement UF-II, whose hydration is accelerated due to the additional surface provided for the nucleation and growth of hydration products. This fact may turn out to be beneficial for construction in colder climates, but may as well obstruct the use of rapid-hardening cements in mass or large scale structural projects. The comparison of the heat of hydration, regarding ultrafine cement UF-I, indicates a relative retardation of the hydration and a shift of the acceleration at 5 hours. The accelerating effect should be also attributed
Figure 3. SEM micrographs of dry CEM I 42.5N (a) and UF-II (b).
Table 3. PSD, Rosin Rammler and Blaine specific surface area results.
Sample
PSD Rosin Rammler Specific surface area (Blaine)Mean Median 45 μm Passing n Xo
(μm) (μm) (%) - (μm) (cm2.g–1)
CEM I 42.5N 18.83 13.5 92.90 0.876 17.7 3870
UF-I 5.23 7.8 81.80 0.916 12.4 7810
UF-II 1.85 2.6 100 0.873 4.1 10725
408 Materials Research
Dry-grinded Ultrafine Cements Hydration. Physicochemical and Microstructural Characterization
to the higher fineness compared with the corresponding of CEM I 42.5N. The two curves are similar after 15 hours of hydration. These results indicate that, in case of UF-I, the increase in grinding time mainly alters the hydration process in the period 2-15 hours, after the start of hydration.
3.3. Physical and mechanical properties
Table 4 presents the cement water demand, the setting time and the mortar flow (for w/c = 0.5) of the tested samples. The results showed that the finer cement requires less time to achieve set. When the fineness of cement is higher, the hydration speed is faster and the hydration products increase rapidly. The slurry, from the suspending state, starts to be agglomerated faster and the setting time is shortened. Besides, the water of normal consistency varied from 35.7% for UF-I to 45.3% for UF-II cements, while the corresponding value for the reference Portland cement was 27.1%. When fineness increases, the surface area contacting with water increases and the rate of hydration reactions accelerates, since the hydration reaction occurs at the interface with water9,23. The flow tests confirmed the above results and showed that for a given w/c, UF-II cement presented the lowest mortar workability. The mortar flow is connected with cement particles, which, especially in high Blaine values, are agglomerated in water suspensions. When particle size gets finer it needs more water to facilitate the movement of particles on each other, a fact that can lead to the viscosity increase. Furthermore, a part of the water is entrapped in the pores of the agglomerates and does not contribute to the flowability. The expansion measured, according to the Le Chatelier process, varies from 0.6 mm to 1.50 mm, while the limit according to EN 196-3 is 10 mm[20].
The mortars of the cements under investigation were tested for compressive strengths after 1, 2, 7 and 28 days of curing. The obtained results are shown in Figure 5. The
relative strengths of tested cements in relation to curing age are given in Figure 6. Relative strength is the ratio of the strength of the fine cement to the strength of the reference one, at each particular curing time. The effects of greater fineness on compressive strengths are shown principally at early ages. After the first 24 hours of hydration, the compressive strengths of the finest cement are about 3 times higher (over 48 MPa) than that of CEM I 42.5N (15 MPa). The compressive strengths increase was also significant after 2 days of curing. UF-II cements reached 51.7 MPa, whereas the corresponding value for CEM I 42.5N was 22.1 MPa. The diameter of the largest particle in the finest cement was about 15 μm, while its mean diameter was 1.85 μm (Figure 2). The particles of this size hydrate quickly, leading to the fast increase of the initial strength. However, it should be noticed that, while the high specific surface area of the cement increases the water demand of the mix (for a given cement content and workability), the water/cement ratio would increase, which may offset the benefits of the higher
Figure 4. Heat of hydration and temperature (a) and heat evolution (b) curves versus time.
Table 4. Physical properties of the tested cements.
SampleWater of normal
consistency (% w/w)
Setting times (minutes) Le Chatelier expansion (mm)
Flow of Mortar for w/c = 0.5(%)Initial Final
CEM I 42.5N 27.1 150 200 1.50 83.0
UF-I 35.7 120 150 0.80 23.5
UF-II 45.3 30 80 0.60 14.0
Figure 5. Strength development of the examined cements.
2013; 16(2) 409
Kontoleontos et al.
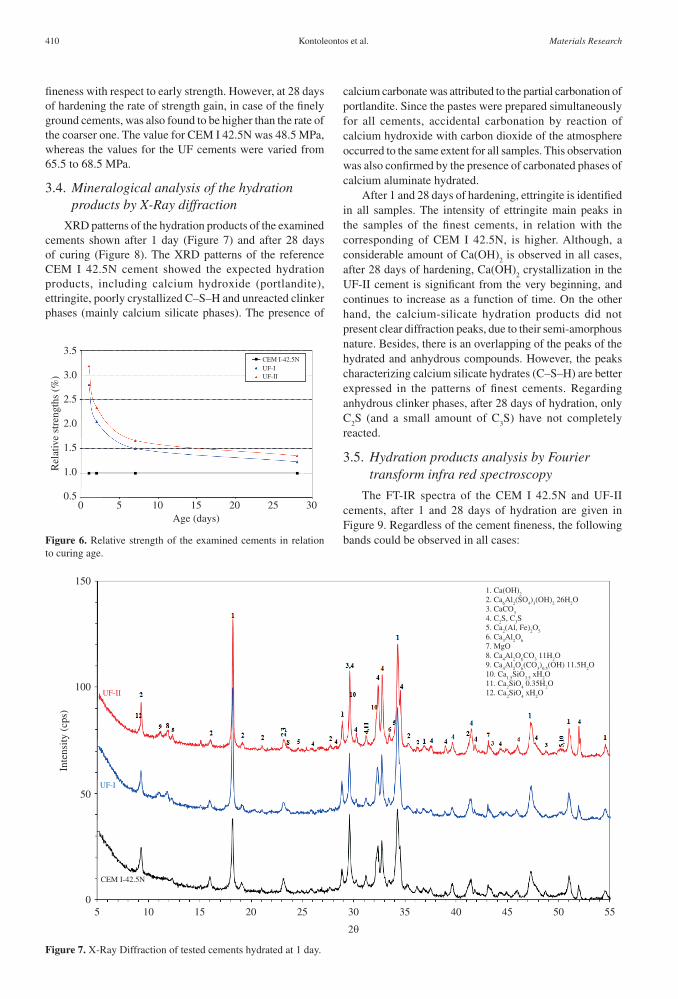
Figure 7. X-Ray Diffraction of tested cements hydrated at 1 day.
fineness with respect to early strength. However, at 28 days of hardening the rate of strength gain, in case of the finely ground cements, was also found to be higher than the rate of the coarser one. The value for CEM I 42.5N was 48.5 MPa, whereas the values for the UF cements were varied from 65.5 to 68.5 MPa.
3.4. Mineralogical analysis of the hydration products by X-Ray diffraction
XRD patterns of the hydration products of the examined cements shown after 1 day (Figure 7) and after 28 days of curing (Figure 8). The XRD patterns of the reference CEM I 42.5N cement showed the expected hydration products, including calcium hydroxide (portlandite), ettringite, poorly crystallized C–S–H and unreacted clinker phases (mainly calcium silicate phases). The presence of
calcium carbonate was attributed to the partial carbonation of portlandite. Since the pastes were prepared simultaneously for all cements, accidental carbonation by reaction of calcium hydroxide with carbon dioxide of the atmosphere occurred to the same extent for all samples. This observation was also confirmed by the presence of carbonated phases of calcium aluminate hydrated.
After 1 and 28 days of hardening, ettringite is identified in all samples. The intensity of ettringite main peaks in the samples of the finest cements, in relation with the corresponding of CEM I 42.5N, is higher. Although, a considerable amount of Ca(OH)
2 is observed in all cases,
after 28 days of hardening, Ca(OH)2 crystallization in the
UF-II cement is significant from the very beginning, and continues to increase as a function of time. On the other hand, the calcium-silicate hydration products did not present clear diffraction peaks, due to their semi-amorphous nature. Besides, there is an overlapping of the peaks of the hydrated and anhydrous compounds. However, the peaks characterizing calcium silicate hydrates (C–S–H) are better expressed in the patterns of finest cements. Regarding anhydrous clinker phases, after 28 days of hydration, only C
2S (and a small amount of C
3S) have not completely
reacted.
3.5. Hydration products analysis by Fourier transform infra red spectroscopy
The FT-IR spectra of the CEM I 42.5N and UF-II cements, after 1 and 28 days of hydration are given in Figure 9. Regardless of the cement fineness, the following bands could be observed in all cases:Figure 6. Relative strength of the examined cements in relation
to curing age.
410 Materials Research

Dry-grinded Ultrafine Cements Hydration. Physicochemical and Microstructural Characterization
• Portlandite–Ca(OH)2 (3641-3642 cm−1);
• Ettringite (AFt) – Ca6Al
2(SO
4)
3(OH)
12·26H
2O
(1116-1118 cm−1);• HydratedCalciumSilicates–C–S–H(970-980cm−1);• Anhydrous Calcium Silicates – Ca
3SiO
5/Ca
2SiO
4
(458-464 cm−1);
• CarbonatePhases(1424-1430cm−1 and 874-885 cm−1); and
• Molecular water (3440-3446 cm−1 and 1643-1645 cm−1).
All samples indicated characteristic bands at 1643-1645 cm−1, due to the H-O-H bending (v
2) vibration of
Figure 8. X-Ray Diffraction of tested cements hydrated at 28 days.
Figure 9. FT-IR spectra of CEM I 42.5N and UF-II cements pastes after 1 and 28 days of curing.
2013; 16(2) 411
Kontoleontos et al.
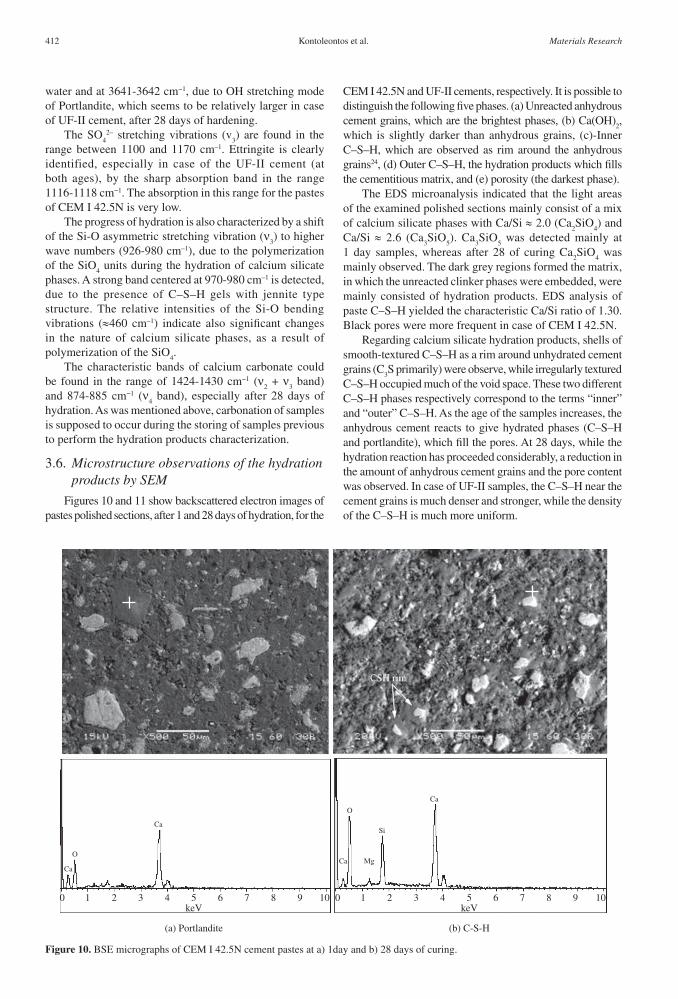
Figure 10. BSE micrographs of CEM I 42.5N cement pastes at a) 1day and b) 28 days of curing.
water and at 3641-3642 cm−1, due to OH stretching mode of Portlandite, which seems to be relatively larger in case of UF-II cement, after 28 days of hardening.
The SO4
2– stretching vibrations (v3) are found in the
range between 1100 and 1170 cm–1. Ettringite is clearly identified, especially in case of the UF-II cement (at both ages), by the sharp absorption band in the range 1116-1118 cm−1. The absorption in this range for the pastes of CEM I 42.5N is very low.
The progress of hydration is also characterized by a shift of the Si-O asymmetric stretching vibration (ν
3) to higher
wave numbers (926-980 cm–1), due to the polymerization of the SiO
4 units during the hydration of calcium silicate
phases. A strong band centered at 970-980 cm–1 is detected, due to the presence of C–S–H gels with jennite type structure. The relative intensities of the Si-O bending vibrations (≈460 cm–1) indicate also significant changes in the nature of calcium silicate phases, as a result of polymerization of the SiO
4.
The characteristic bands of calcium carbonate could be found in the range of 1424-1430 cm−1 (ν
2 + ν
3 band)
and 874-885 cm−1 (ν4 band), especially after 28 days of
hydration. As was mentioned above, carbonation of samples is supposed to occur during the storing of samples previous to perform the hydration products characterization.
3.6. Microstructure observations of the hydration products by SEM
Figures 10 and 11 show backscattered electron images of pastes polished sections, after 1 and 28 days of hydration, for the
CEM I 42.5N and UF-II cements, respectively. It is possible to distinguish the following five phases. (a) Unreacted anhydrous cement grains, which are the brightest phases, (b) Ca(OH)
2,
which is slightly darker than anhydrous grains, (c)-Inner C–S–H, which are observed as rim around the anhydrous grains24, (d) Outer C–S–H, the hydration products which fills the cementitious matrix, and (e) porosity (the darkest phase).
The EDS microanalysis indicated that the light areas of the examined polished sections mainly consist of a mix of calcium silicate phases with Ca/Si ≈ 2.0 (Ca
2SiO
4) and
Ca/Si ≈ 2.6 (Ca3SiO
5). Ca
3SiO
5 was detected mainly at
1 day samples, whereas after 28 of curing Ca2SiO
4 was
mainly observed. The dark grey regions formed the matrix, in which the unreacted clinker phases were embedded, were mainly consisted of hydration products. EDS analysis of paste C–S–H yielded the characteristic Ca/Si ratio of 1.30. Black pores were more frequent in case of CEM I 42.5N.
Regarding calcium silicate hydration products, shells of smooth-textured C–S–H as a rim around unhydrated cement grains (C
3S primarily) were observe, while irregularly textured
C–S–H occupied much of the void space. These two different C–S–H phases respectively correspond to the terms “inner” and “outer” C–S–H. As the age of the samples increases, the anhydrous cement reacts to give hydrated phases (C–S–H and portlandite), which fill the pores. At 28 days, while the hydration reaction has proceeded considerably, a reduction in the amount of anhydrous cement grains and the pore content was observed. In case of UF-II samples, the C–S–H near the cement grains is much denser and stronger, while the density of the C–S–H is much more uniform.
412 Materials Research
Dry-grinded Ultrafine Cements Hydration. Physicochemical and Microstructural Characterization
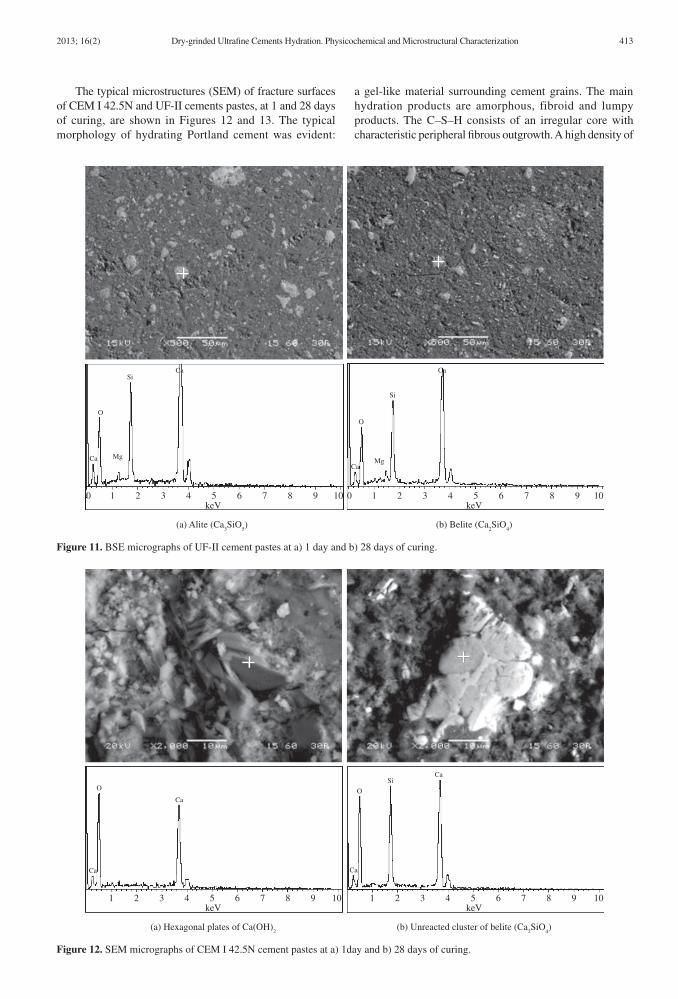
a gel-like material surrounding cement grains. The main hydration products are amorphous, fibroid and lumpy products. The C–S–H consists of an irregular core with characteristic peripheral fibrous outgrowth. A high density of
The typical microstructures (SEM) of fracture surfaces of CEM I 42.5N and UF-II cements pastes, at 1 and 28 days of curing, are shown in Figures 12 and 13. The typical morphology of hydrating Portland cement was evident:
Figure 11. BSE micrographs of UF-II cement pastes at a) 1 day and b) 28 days of curing.
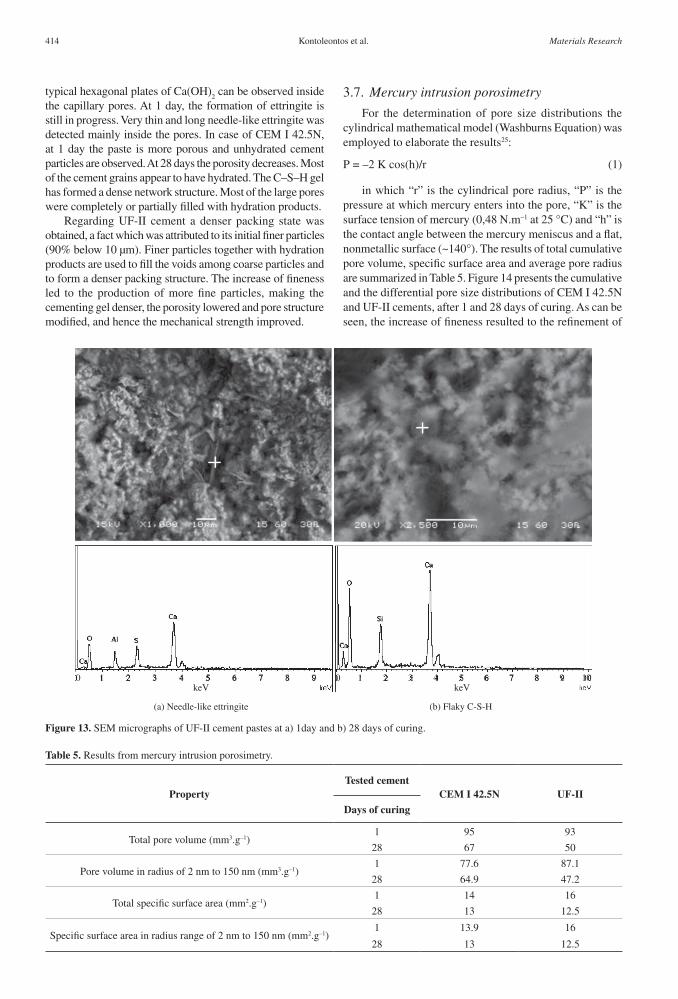
Figure 12. SEM micrographs of CEM I 42.5N cement pastes at a) 1day and b) 28 days of curing.
2013; 16(2) 413
Kontoleontos et al.
typical hexagonal plates of Ca(OH)2 can be observed inside
the capillary pores. At 1 day, the formation of ettringite is still in progress. Very thin and long needle-like ettringite was detected mainly inside the pores. In case of CEM I 42.5N, at 1 day the paste is more porous and unhydrated cement particles are observed. At 28 days the porosity decreases. Most of the cement grains appear to have hydrated. The C–S–H gel has formed a dense network structure. Most of the large pores were completely or partially filled with hydration products.
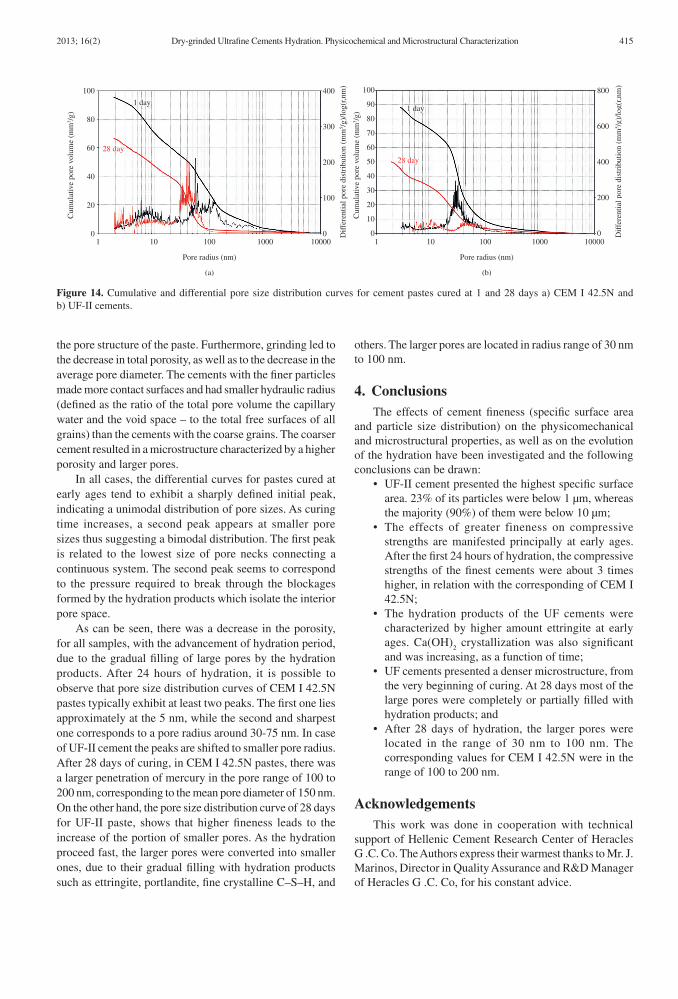
Regarding UF-II cement a denser packing state was obtained, a fact which was attributed to its initial finer particles (90% below 10 μm). Finer particles together with hydration products are used to fill the voids among coarse particles and to form a denser packing structure. The increase of fineness led to the production of more fine particles, making the cementing gel denser, the porosity lowered and pore structure modified, and hence the mechanical strength improved.
Figure 13. SEM micrographs of UF-II cement pastes at a) 1day and b) 28 days of curing.
3.7. Mercury intrusion porosimetry
For the determination of pore size distributions the cylindrical mathematical model (Washburns Equation) was employed to elaborate the results25:
P = –2 K cos(h)/r (1)
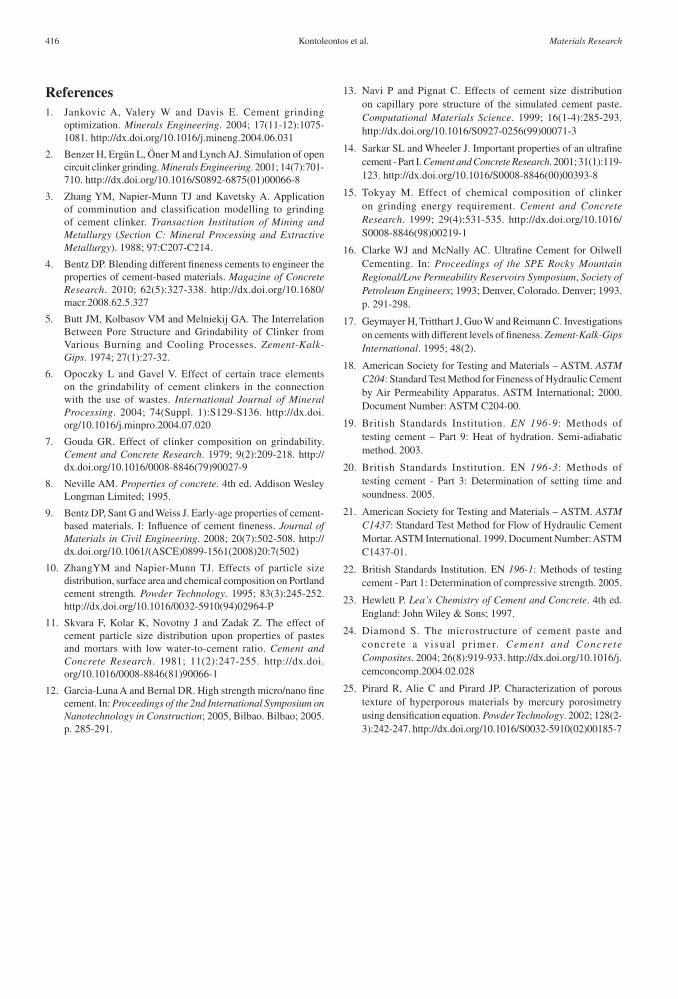
in which “r” is the cylindrical pore radius, “P” is the pressure at which mercury enters into the pore, “K” is the surface tension of mercury (0,48 N.m–1 at 25 °C) and “h” is the contact angle between the mercury meniscus and a flat, nonmetallic surface (~140°). The results of total cumulative pore volume, specific surface area and average pore radius are summarized in Table 5. Figure 14 presents the cumulative and the differential pore size distributions of CEM I 42.5N and UF-II cements, after 1 and 28 days of curing. As can be seen, the increase of fineness resulted to the refinement of
Table 5. Results from mercury intrusion porosimetry.
PropertyTested cement
CEM I 42.5N UF-II
Days of curing
Total pore volume (mm3.g–1)1 95 93
28 67 50
Pore volume in radius of 2 nm to 150 nm (mm3.g–1)1 77.6 87.1
28 64.9 47.2
Total specific surface area (mm2.g–1)1 14 16
28 13 12.5
Specific surface area in radius range of 2 nm to 150 nm (mm2.g–1)1 13.9 16
28 13 12.5
414 Materials Research
Dry-grinded Ultrafine Cements Hydration. Physicochemical and Microstructural Characterization
the pore structure of the paste. Furthermore, grinding led to the decrease in total porosity, as well as to the decrease in the average pore diameter. The cements with the finer particles made more contact surfaces and had smaller hydraulic radius (defined as the ratio of the total pore volume the capillary water and the void space – to the total free surfaces of all grains) than the cements with the coarse grains. The coarser cement resulted in a microstructure characterized by a higher porosity and larger pores.
In all cases, the differential curves for pastes cured at early ages tend to exhibit a sharply defined initial peak, indicating a unimodal distribution of pore sizes. As curing time increases, a second peak appears at smaller pore sizes thus suggesting a bimodal distribution. The first peak is related to the lowest size of pore necks connecting a continuous system. The second peak seems to correspond to the pressure required to break through the blockages formed by the hydration products which isolate the interior pore space.
As can be seen, there was a decrease in the porosity, for all samples, with the advancement of hydration period, due to the gradual filling of large pores by the hydration products. After 24 hours of hydration, it is possible to observe that pore size distribution curves of CEM I 42.5N pastes typically exhibit at least two peaks. The first one lies approximately at the 5 nm, while the second and sharpest one corresponds to a pore radius around 30-75 nm. In case of UF-II cement the peaks are shifted to smaller pore radius. After 28 days of curing, in CEM I 42.5N pastes, there was a larger penetration of mercury in the pore range of 100 to 200 nm, corresponding to the mean pore diameter of 150 nm. On the other hand, the pore size distribution curve of 28 days for UF-II paste, shows that higher fineness leads to the increase of the portion of smaller pores. As the hydration proceed fast, the larger pores were converted into smaller ones, due to their gradual filling with hydration products such as ettringite, portlandite, fine crystalline C–S–H, and
others. The larger pores are located in radius range of 30 nm to 100 nm.
4. ConclusionsThe effects of cement fineness (specific surface area
and particle size distribution) on the physicomechanical and microstructural properties, as well as on the evolution of the hydration have been investigated and the following conclusions can be drawn:
• UF-IIcementpresentedthehighestspecificsurfacearea. 23% of its particles were below 1 μm, whereas the majority (90%) of them were below 10 μm;
• The effects of greater fineness on compressivestrengths are manifested principally at early ages. After the first 24 hours of hydration, the compressive strengths of the finest cements were about 3 times higher, in relation with the corresponding of CEM I 42.5N;
• The hydration products of the UF cements werecharacterized by higher amount ettringite at early ages. Ca(OH)
2 crystallization was also significant
and was increasing, as a function of time;• UFcementspresentedadensermicrostructure,from
the very beginning of curing. At 28 days most of the large pores were completely or partially filled with hydration products; and
• After 28 days of hydration, the larger pores werelocated in the range of 30 nm to 100 nm. The corresponding values for CEM I 42.5N were in the range of 100 to 200 nm.
AcknowledgementsThis work was done in cooperation with technical
support of Hellenic Cement Research Center of Heracles G .C. Co. The Authors express their warmest thanks to Mr. J. Marinos, Director in Quality Assurance and R&D Manager of Heracles G .C. Co, for his constant advice.
Figure 14. Cumulative and differential pore size distribution curves for cement pastes cured at 1 and 28 days a) CEM I 42.5N and b) UF-II cements.
2013; 16(2) 415
Kontoleontos et al.
13. Navi P and Pignat C. Effects of cement size distribution on capillary pore structure of the simulated cement paste. Computational Materials Science. 1999; 16(1-4):285-293. http://dx.doi.org/10.1016/S0927-0256(99)00071-3
14. Sarkar SL and Wheeler J. Important properties of an ultrafine cement - Part I. Cement and Concrete Research. 2001; 31(1):119-123. http://dx.doi.org/10.1016/S0008-8846(00)00393-8
15. Tokyay M. Effect of chemical composition of clinker on grinding energy requirement. Cement and Concrete Research. 1999; 29(4):531-535. http://dx.doi.org/10.1016/S0008-8846(98)00219-1
16. Clarke WJ and McNally AC. Ultrafine Cement for Oilwell Cementing. In: Proceedings of the SPE Rocky Mountain Regional/Low Permeability Reservoirs Symposium, Society of Petroleum Engineers; 1993; Denver, Colorado. Denver; 1993. p. 291-298.
17. Geymayer H, Tritthart J, Guo W and Reimann C. Investigations on cements with different levels of fineness. Zement-Kalk-Gips International. 1995; 48(2).
18. American Society for Testing and Materials – ASTM. ASTM C204: Standard Test Method for Fineness of Hydraulic Cement by Air Permeability Apparatus. ASTM International; 2000. Document Number: ASTM C204-00.
19. British Standards Institution. EN 196-9: Methods of testing cement – Part 9: Heat of hydration. Semi-adiabatic method. 2003.
20. British Standards Institution. ΕΝ 196-3: Methods of testing cement - Part 3: Determination of setting time and soundness. 2005.
21. American Society for Testing and Materials – ASTM. ASTM C1437: Standard Test Method for Flow of Hydraulic Cement Mortar. ASTM International. 1999. Document Number: ASTM C1437-01.
22. British Standards Institution. ΕΝ 196-1: Methods of testing cement - Part 1: Determination of compressive strength. 2005.
23. Hewlett P. Lea’s Chemistry of Cement and Concrete. 4th ed. England: John Wiley & Sons; 1997.
24. Diamond S. The microstructure of cement paste and concrete a visual pr imer. Cement and Concrete Composites. 2004; 26(8):919-933. http://dx.doi.org/10.1016/j.cemconcomp.2004.02.028
25. Pirard R, Alie C and Pirard JP. Characterization of porous texture of hyperporous materials by mercury porosimetry using densification equation. Powder Technology. 2002; 128(2-3):242-247. http://dx.doi.org/10.1016/S0032-5910(02)00185-7
References1. Jankovic A, Valery W and Davis E. Cement grinding
optimization. Minerals Engineering. 2004; 17(11-12):1075-1081. http://dx.doi.org/10.1016/j.mineng.2004.06.031
2. Benzer H, Ergün L, Öner M and Lynch AJ. Simulation of open circuit clinker grinding. Minerals Engineering. 2001; 14(7):701-710. http://dx.doi.org/10.1016/S0892-6875(01)00066-8
3. Zhang YM, Napier-Munn TJ and Kavetsky A. Application of comminution and classification modelling to grinding of cement clinker. Transaction Institution of Mining and Metallurgy (Section C: Mineral Processing and Extractive Metallurgy). 1988; 97:C207-C214.
4. Bentz DP. Blending different fineness cements to engineer the properties of cement-based materials. Magazine of Concrete Research. 2010; 62(5):327-338. http://dx.doi.org/10.1680/macr.2008.62.5.327
5. Butt JM, Kolbasov VM and Melniekij GA. The Interrelation Between Pore Structure and Grindability of Clinker from Various Burning and Cooling Processes. Zement-Kalk-Gips. 1974; 27(1):27-32.
6. Opoczky L and Gavel V. Effect of certain trace elements on the grindability of cement clinkers in the connection with the use of wastes. International Journal of Mineral Processing. 2004; 74(Suppl. 1):S129-S136. http://dx.doi.org/10.1016/j.minpro.2004.07.020
7. Gouda GR. Effect of clinker composition on grindability. Cement and Concrete Research. 1979; 9(2):209-218. http://dx.doi.org/10.1016/0008-8846(79)90027-9
8. Neville AM. Properties of concrete. 4th ed. Addison Wesley Longman Limited; 1995.
9. Bentz DP, Sant G and Weiss J. Early-age properties of cement-based materials. I: Influence of cement fineness. Journal of Materials in Civil Engineering. 2008; 20(7):502-508. http://dx.doi.org/10.1061/(ASCE)0899-1561(2008)20:7(502)
10. ZhangYM and Napier-Munn TJ. Effects of particle size distribution, surface area and chemical composition on Portland cement strength. Powder Technology. 1995; 83(3):245-252. http://dx.doi.org/10.1016/0032-5910(94)02964-P
11. Skvara F, Kolar K, Novotny J and Zadak Z. The effect of cement particle size distribution upon properties of pastes and mortars with low water-to-cement ratio. Cement and Concrete Research. 1981; 11(2):247-255. http://dx.doi.org/10.1016/0008-8846(81)90066-1
12. Garcia-Luna A and Bernal DR. High strength micro/nano fine cement. In: Proceedings of the 2nd International Symposium on Nanotechnology in Construction; 2005, Bilbao. Bilbao; 2005. p. 285-291.
416 Materials Research