Ultrafine particles in concrete
177
Ultrafine particles in concrete Influence of ultrafine particles on concrete properties and application to concrete mix design Carsten Vogt School of Architecture and the Built Environment Division of Concrete Structures Royal Institute of Technology SE-100 44 Stockholm, Sweden _________________________________________________________________________ TRITA-BKN. Bulletin 103, 2010 ISSN 1103-4270 ISRN KTH/BKN/B—103—SE Doctoral Thesis
Transcript of Ultrafine particles in concrete
Ultrafine particles in concrete Influence of ultrafine particles on concrete properties and application to concrete mix design Carsten Vogt School of Architecture and the Built Environment Division of Concrete Structures Royal Institute of Technology SE-100 44 Stockholm, Sweden _________________________________________________________________________ TRITA-BKN. Bulletin 103, 2010 ISSN 1103-4270 ISRN KTH/BKN/B—103—SE Doctoral Thesis

Akademisk avhandling som med tillstånd av Kungliska Tekniska Högskolan i Stockholm framlägges till offentlig granskning för avläggande av teknologie doktorsexamen fredagen den 9 april 2010 kl 10:00 i Sal D3, Lindstedtsvägen 5, Kungliska Tekniska Högskolan, Stockholm.

III
Acknowledgements This doctoral thesis has been prepared at the Swedish Cement and Concrete Research Institute (CBI) in Stockholm and the Royal Institute of Technology (KTH), School of Architecture and the Built Environment, Division of Concrete Structures, Sweden. I would like to direct my gratitude to my supervisors Professor Jonas Holmgren and Professor Björn Lagerblad for valuable advice, discussions and not least, their patience. Thank you, Jonas, for being my supervisor even after your retirement. Thank you, Björn, for your never-ending imagination and time for discussions whenever and wherever. This work was partly financed by CBI. Parts of the experimental work were conducted for and financed by the Swedish Nuclear Waste Management (SKB). I would like to thank Stig Pettersson and Torbjörn Hugo-Persson from SKB for allowing publication of the obtained results. The support of CBI and SKB is greatly appreciated. I would also like to thank my friends and colleagues at CBI for their everyday support. Anders, Annika, Björn, Karin, Kjell and Mikael are great friends on and off the field. Fredrik Öhlund, Göran Olsson and Lars Melin at CBI helped with sample preparation and analysis. If information on any subject is available, Tuula Ojala, the librarian at CBI, will find it. Herzlichen Dank an meine Eltern, die mich immer unterstützt haben und immer für mich da sind. Diverse väterliche Weisheiten, zum Beispiel: T n m a m a, a w a G r. haben sich als unbezahlbar erwiesen. Danke für alles, Franziska. Den ehemaligen Mitgliedern der Trierer Straße 48 bin ich dankbar, dass ich trotz unerlaubter Entfernung von der Truppe immer willkommen bin. Stockholm in February 2010 Carsten Vogt
IV
Summary Concrete consists of a system of different sized particles, usually called aggregate. Fresh concrete is a particle slurry and hardened concrete consists of packed particles of different size. The aggregate is bound together by a binder, most often based on cementitious materials. The cementitious material reacts with water and forms hydration products which hold the aggregates together. Usually, the binder is the most expensive component of a concrete and has the largest environmental impact. Therefore, reduction of the binder content in concrete is desirable. This can be achieved by different means. One commonly used way is to optimise the grading of the aggregates in order to minimise the void content in the particle system and by that lower the required binder content. There are plenty of models available which can be used to calculate a denser packing of the aggregates. Most of the available models take only the aggregates into consideration and ignore the finer particles. But it is the fine particles which allow for workability of concrete in the fresh state and ensure a dense microstructure when hardened. The development of self-compacting concrete showed that with increased content of fines in the mix, the fresh and hardened concrete properties can be improved. It seems that if the fine particles are included into packing models, the whole system of particles that built up concrete may be optimised. Moreover, very fine particles have different surface properties. They may influence the hydration process of the cement and bind differently to the cement paste than coarser grains. In this work, the influence of ultrafine particles on concrete properties was investigated. In the context of this work, ultrafine particles (reactive and inert materials) are particles finer than cement. Due to the development of effective superplasticizers, the incorporation of ultrafine particles in concrete is nowadays possible. Different minerals, usually considered inert, were tested. These minerals were also used in combination with reactive silica fume. The modified Andreassen model was used to optimise the particle size distribution and thus the packing density of the complete mix composition. Heat of hydration, compressive strength, shrinkage, frost resistance and the microstructure were investigated. The influence of different ultrafine inert materials on the cement hydration was investigated. The results show that most of the minerals have an accelerating effect. They provide nucleation sites for hydration products and contribute in that way to a faster dissolution of cement grains. Minerals containing calcium were found to influence the early stage of hydration as well. These minerals shortened the dormant period of the cement hydration, the effect is known from limestone filler in self-compacting concrete. In a first test series on concrete, different ultrafine inert particles were used to replace cement. That was done in several ways; with constant water content or constant w/c. The results from this test series show that the best effect is achieved when cement is replaced by suitable ultrafines while the w/c is kept constant. In doing so, the compressive strength can be increased and shrinkage can be reduced. The microstructure is improved and becomes denser with improved packing at microlevel. Efficiency factors (k values) for the ultrafine inert materials were calculated from the compressive strength results. The k values are strongly dependent on the mode of cement replacement, fineness and type of the replacement material and curing time. Drying shrinkage was found to continue over long periods of time, even after more than
V
4 years of testing the final shrinkage was not reached. The total water content of concrete was found to be the governing factor for the drying shrinkage. With the help of the modified Andreassen model, concrete compositions with low cement content and high content of ultrafines were optimised. With only 100 kg/m3 of cement, suitable inert ultrafine particles and an optimised particle size distribution, a compressive strength of more than 65 MPa can be achieved. The most effective way to apply the modified Andreassen model to concrete is the combination of inert ultrafine fillers and silica fume. In doing so, concrete with low cement content and compressive strength of more than 100 MPa can be produced. The paste structure of such mixes is homogeneous without distinct interfacial transition zones or agglomeration of portlandite crystals. The microstructure is dense, that was confirmed by mercury intrusion porosimetry, capillary suction and microscopy. The early shrinkage of such mix compositions is due to the autogenous shrinkage contribution of the silica fume higher than for a traditional concrete. After a longer period of time, the difference diminishes. The concept of replacing cement by inert ultrafine particles is also applicable to high-strength concrete and reactive powder concrete. The cement content was reduced by more than 30 % without negative influence on strength and durability. Again, the modified Andreassen model proved to be a valuable tool in the design of the mixes. This work includes also practical applications of some of the concepts tested. Self-compacting concrete with low cement content and low pH (pH < 11), to be used in a repository for spent nuclear fuel, was developed. The concrete contained high amounts of inert ultrafine particles and silica fume, the modified Andreassen model was used to optimise the particle size distribution of the mixes and thus packing density. All relevant material properties for structural calculations and thermal crack risk calculations were determined experimentally. Another application was the development of glass fibre reinforced ultra high performance concrete for stabilisation of deep boreholes. With increased content of silica fume, glass fibres will be more durable in concrete. The conclusions of this work are that ultrafine particles have a great potential in concrete. Many concrete properties are influenced positively when parts of the cement are replaced in the correct way by ultrafines. The modified Andreassen model proves to be a helpful tool for the optimisation of concrete compositions. Based on the findings of this work, recommendations are given on how to include ultrafine particles in mix design of concrete.
VI
Sammanfattning Betong består av ett system av partiklar av olika storlek. Färsk betong är en partikelsuspension och hårdnad betong består av packade partiklar. Partiklarna (i allmänhet betecknat som ballast) binds ihop med ett bindemedel som i vanliga fall är cementbaserad. Bindemedlen reagerar med vatten och bilder fasta hydratationsprodukter som binder ballastkornen. Eftersom bindemedlens andel av betongkostnaderna och miljöpåverkan är störst, är en reduktion av bindemedelshalten i betong eftersträvansvärt. Halten av bindemedel i betong kan reduceras på olika sätt. En vanlig metod är att optimera partikelsystemets gradering med målsättning att öka packningsgraden. Det finns ett flertal modeller som kan användas för att åstadkomma detta. De flesta modeller fokuserar på betongens ballast och tar inte hänsyn till finpartiklarna. Men det är just finpartiklarna som har en avgörande påverkan på den färska betongmassans arbetbarhet och den hårdnade betongens täthet. När självkompakterande betong utvecklades upptäcktes att betongegenskaperna i färskt och hårdnat tillstånd förbättrades genom tillsats av stora mängder finmaterial. Genom att integrera även finpartiklarna i en packningsmodell kan hela betongsammansättningen från de finaste till de grövsta partiklarna optimeras. Detta leder till en förbättrad betongsammansättning och med förbättrade egenskaper. Dessutom har finpartiklar andra ytegenskaper än grövre partiklar och fungera därför olika i en suspension. Finpartiklar kan påverka cementets hydratation och integreras bättre i cementpastan. I avhandlingen undersöks ultrafina partiklars egenskaper och deras inflytande på betong. Inerta och reaktiva partiklar som är finare än cement betecknas som ultrafina i denna avhandling. Användningen av ultrafina partiklar i betong är idag möjlig pga utvecklingen av effektiva flyttillsatsmedel. Inflytandet av olika mineraler som i allmänhet anses inerta har undersökts, även i kombination med reaktivt silikastoft. Partikelstorleksfördelningen av hela betongsammansättningen har optimerats med hjälp av den s.k. modifierade Andreassen-modellen. För betong har hydratationsvärmeutveckling, tryckhållfasthet, krympning, frostbeständighet och mikrostruktur undersökts. Undersökningen av hydratationsvärmeutvecklingen visade att de flesta av mineralen påskyndade cementets hydratation. Ultrafina partiklarna verkar som nukleationskärnor för cementets hydratationsprodukter. Mineraler som innehåller kalcium har dessutom inflytande på bindetiden, de förkortar induktionsperioden för cementhydratationen. Effekten är känd från bl. a kalkstensfiller i självkompakterande betong. I en första testserie har olika inerta ultrafina partiklar ersatt delar av cementet i betong. Effekten av detta har undersökts på betong med dels konstant vattenhalt, dels konstant vct. Resultaten av denna testserie visar att cementersättning med ultrafina partiklar ger bäst effekt om vct hålls konstant. På detta sätt erhålls högre tryckhållfasthet och en lägre krympning. De ultrafina partiklarna bidrar till en homogen mikrostruktur med förbättrad packning. Resultat av tryckhållfasthetsprovning används för beräkning av det s.k. k-värdet (effektivitetsfaktor för material som ersätter cement). Erhållna k-värden är kraftigt beroende av betongens ålder, finhet och typ av material som ersatt cementet, samt metoden för cementersättning. Mätningen av betongens uttorkningskrympning visar att betongens vattenhalt är avgörande för slutkrympningen. Krympningen fortgår under långa tidsperioder, även efter 4 års tid har slutkrympning inte uppnåtts. En optimerad betongsammansättning (modifierad Andreassen-modell) för låg cementhalt
VII
och hög andel ultrafina partiklar möjliggör framtagning av betonger med en cementhalt av 100 kg/m3 och en tryckhållfasthet på mer än 65 MPa. För att dra största möjliga fördel av en optimerad partikelgradering enligt modifierade Andreassen-modellen kombinerades inerta ultrafina partiklar och reaktivt silikastoft. Betonger med över 100 MPa i tryckhållfasthet och låg bindemedelshalt kan tillverkas med hjälp av denna modell. På mikronivå är cementpastan i dessa betonger mycket homogen, övergångszonen mellan ballast och cementpasta försvinner nästan fullständigt. Övergångszonen mellan cementpasta och ballast är fri från förhöjd porositet och ansamlingar av portlandit. Undersökningar med kvicksilverhögtrycksporosimetri, kapillärsugning och mikroskopi verifierade den ökade tätheten av mikrostrukturen. I sådana betonger är den tidiga krympningen pga av silikastoftets bidrag högre än i normalbetong. Efter mer än 4 års undersökningstid minskar skillnaderna och slutkrympningen är jämförbar. Även i höghållfasta och ultrahöghållfasta betonger (RPC) testades cementersättning med ultrafina partiklar. Cementhalten kunde minskas med mer än 30 % utan negativ inverkan på tryckhållfasthet och beständighet. Den modifierade Andreassen-modellen användes för optimeringen av korngraderingen. Avhandlingen innehåller även tillämpningar av beskrivna metoder och koncept. Betonger med låg pH (pH < 11), som planeras att användas i slutförvar för förbrukat kärnbränsle, har utvecklats med hjälp av modifierade Andreassen-modellen. Dessa betonger innehåller höga halter av silikastoft och ultrafina partiklar för att minska bindemedelshalten och öka partikelpackningen. Materialparametrar för statiska beräkningar och temperatursprickrisk-beräkningar har bestämts experimentellt. Ett annat användningsområde som beskrivs är ultrahöghållfast betong med glasfiberarmering för förstärkning av djupa borrhål. Glasfibernas beständighet i betong kan ökas genom att höja andelen silikastoft i betongen. Slutsatserna av avhandlingen är att användning av ultrafina partiklar i betong har en stor potential. Många betongegenskaper kan förbättras om cement ersätts med ultrafina partiklar. Den modifierade Andreassen-modellen har framgångsrikt använts för optimering av olika betongsammansättningar. Baserat på resultat i avhandlingen har rekommendationer utarbetats för användandet av ultrafina partiklar i betongproportionering.
VIII
Zusammenfassung Beton ist aus einem Gerüst von unterschiedlich großen Partikeln, im Allgemeinen als Zuschläge bezeichnet, aufgebaut. Diese Partikel sind durch ein Bindemittel, im häufigsten Fall auf Zementbasis, miteinander verbunden. Bindemittel auf Zementbasis bilden bei Reaktion mit Wasser wasserunlösliche Reaktionsprodukte, welche die Zuschlagkörner miteinander verbinden. Da die Bindemittel im Normalfall den größten Anteil zu Kosten und Umweltbeeinflussung eines Betons beitragen, ist deren Reduzierung im Beton wünschenswert. Die Reduktion des Bindemittelanteiles im Beton kann auf unterschiedliche Weisen erfolgen. Eine häufig verwendete Methode ist die Optimierung der Korngrößenverteilung der Zuschläge im Beton mit dem Ziel, die Packungsdichte zu erhöhen. Eine Vielzahl an Modellen wurde entwickelt, mit denen dies möglich ist. Die meisten der vorhandenen Modelle sind auf die Zuschläge begrenzt und ignorieren die Feinststoffe. Gerade aber die Feinststoffe haben einen entscheidenden Einfluss auf die Verarbeitbarkeit des Frischbetons und die Dichtigkeit des erhärteten Betons. Dies wurde bei der Entwicklung des selbstverdichtenden Betons deutlich; erhöhte Anteile von Feinststoffen führten zu verbesserten Frisch- und Festbetoneigenschaften. Wenn die Feinststoffe in ein Packungsmodell integriert werden, kann die gesamte Betonzusammensetzung von den feinsten bis hin zu den gröbsten Partikeln optimiert werden. Dies sollte zu einer verbesserten Betonzusammensetzung mit verbesserten Betoneigenschaften führen. Sehr feine Partikel haben, verglichen mit gröberen Partikeln, andere Oberflächeneigenschaften. Sie können die Zementhydratation beeinflussen und haben ein anderes Verhalten in der Bindung zum Zementstein. In dieser Arbeit wurde der Einfluss von ultrafeinen Partikeln auf Beton und dessen Eigenschaften untersucht. Im Kontext dieser Arbeit werden sowohl inerte als auch reaktive Stoffe, die feiner als Zement sind, als ultrafein bezeichnet. Die Verwendung von ultrafeinen Materialen in Beton ist heute aufgrund der Entwicklung effektiver Fliessmittel möglich. Es wurde der Einfluss von verschiedenen Mineralien, im Allgemeinen als inert betrachtet, auch in Kombination mit reaktivem Silikastaub, untersucht. Die Korngrößenverteilung der gesamten Betonzusammensetzung wurde mit Hilfe des modifizierten Andreassen-Modells optimiert. Hydratationswärmeentwicklung, Druckfestigkeit, Schwinden, Frostbeständigkeit und Mikrostruktur wurden betrachtet. Die Untersuchung der Hydratationswärmeentwicklung zeigte, dass die meisten untersuchten Mineralien einen beschleunigenden Einfluss auf die Hydratation des Zementes haben. Die Feinststoffe stellen Kristallisationskeime für die Hydratationsprodukte des Zementes zur Verfügung. Kalziumhaltige Minerale wirken nicht nur beschleunigend sondern verkürzen auch die dormante Periode der Hydratation. Dieser Einfluss ist von Kalksteinfüllern in selbstverdichtendem Beton bekannt. In einer ersten Testserie wurde der Einfluss von inerten ultrafeinen Partikeln mit verschiedener Feinheit und chemischer Zusammensetzung als Zementersatz in Beton untersucht. Dabei wurden Betonzusammensetzungen mit konstantem Wassergehalt oder konstantem w/z-Wert hergestellt. Die Ergebnisse dieser Serie zeigen, dass Zementersatz durch Feinststoffe bei konstantem w/z-Wert am effektivsten ist, somit kann die Betondruckfestigkeit gesteigert und das Schwinden verringert werden. Die Feinststoffe tragen zu einer verbesserten und homogeneren Mikrostruktur mit erhöhter
IX
Packungsdichte bei. Die Ergebnisse der Untersuchungen der Betondruckfestigkeit wurden zur Berechnung von k-Werten (Anteil an Zusatzstoff der mit Zement bei der Berechnung eines effektiven w/z-Wertes gleichgesetzt werden kann) verwendet. Die ermittelten k-Werte waren stark von der Art und Weise des Zementersatzes, dem Betonalter und der Feinheit und Zusammensetzung des Feinststoffes abhängig. Das Schwinden der untersuchten Betone wird stark vom Wassergehalt der Mischung beeinflusst und vollzog sich über lange Zeiträume. Selbst nach 4 Jahren Untersuchungszeitraum ist anzunehmen, dass das Endschwindmaß noch nicht erreicht war. Unter Verwendung des modifizierten Andreassen-Modells wurden Betonzusammensetzungen für niedrigen Zementgehalt und hohen Anteil an ultrafeinen Partikeln optimiert. Es war bei Verwendung von geeigneten inerten ultrafeinen Zusatzstoffen und optimierter Korngrößenverteilung möglich, Betone mit einem Zementgehalt von nur 100 kg/m3 und einer Betondruckfestigkeit von 65 N/mm2 herzustellen. Die Kombination von ultrafeinen inerten Partikeln und Silikastaub ermöglicht die beste Anpassung des modifizierten Andreassen-Modells für Betonanwendungen; Betone mit niedrigem Zementgehalt und Druckfestigkeiten über 100 N/mm2 sind herstellbar. Der Zementstein solcher Mischungen ist sehr homogen, die Übergangszone zwischen Zuschlagkörnern und Zementstein ist nahezu nicht vorhanden. Ansammlungen von Portlandit oder erhöhte Porosität können in der Übergangszone zwischen Zementstein und Zuschlag nicht festgestellt werden. Die erhöhte Dichtigkeit der Mikrostruktur wurde durch Untersuchungen mittels Quecksilberhochdruckporosimetrie, kapillarem Saugen und Mikroskopie festgestellt. Aufgrund des Anteils an Silikastaub ist das Frühschwinden dieser Betone höher als das von Normalbeton. Nach längerer Untersuchungszeit verkleinern sich die Unterschiede und das Endschwindmaß ist vergleichbar. Der Ersatz von Zement durch ultrafeine inerte Partikel wurde auch in hochfesten und ultrahochfesten Betonen (RPC) angewendet. Die Zementgehalte in solchen Betonen konnten um mehr als 30 % reduziert werden, ohne dass die Druckfestigkeit oder die Dauerhaftigkeit negativ beeinflusst wurden. Wiederum kam das modifizierte Andreassen-Modell bei der Erstellung der Mischungszusammensetzungen zum Einsatz. In dieser Arbeit sind auch Anwendungen der beschriebenen Konzepte und Methoden enthalten. Es wurden mit Hilfe des modifizierten Andreassen-Modells selbstverdichtende Betone mit niedrigem pH-Wert (pH < 11) entwickelt, welche in einem Atommüllendlager zum Einsatz kommen sollen. Sie enthalten hohe Anteile an reaktivem Silikastaub und ultrafeinen inerten Füllern zur Erzielung niedriger Bindemittelgehalte und hoher Packungsdichten. Sämtliche für Temperaturspannungsrissberechnungen und statische Berechnungen erforderliche Materialparameter wurden experimentell bestimmt. Eine weitere Anwendung, die beschrieben wird, ist glasfaserbewehrter ultrahochfester Beton zur Verstärkung von Bohrlöchern. Durch erhöhten Zusatz von Silikastaub konnte die Beständigkeit der Glasfasern im Beton gesteigert werden. Aus den Ergebnissen dieser Arbeit kann geschlossen werden, dass die Anwendung von ultrafeinen Partikeln in Beton ein großes Potential hat. Eine Vielzahl von Betoneigenschaften kann durch Zementersatz mit Feinststoffen verbessert werden. Das modifizierte Andreassen-Model wurde erfolgreich zur Optimierung von

X
Mischungszusammensetzungen eingesetzt; basiert auf den Ergebnissen dieser Arbeit wurden Empfehlungen erarbeitet, wie Feinststoffe im Mischungsentwurf für Betone berücksichtigt werden können.
XI
Table of contents Acknowledgements
Summary
Sammanfattning
Zusammenfassung
Table of contents
Notations
Context of the thesis
Introduction ........................................................................................................................... 1
Aim, Scope and Limitations ................................................................................................. 3
Theoretical background ....................................................................................................... 5 3.1 Particle packing ........................................................................................................................... 5
3.1.1 Particle packing theory ...................................................................................................... 5 3.1.2 Particle packing in concrete ............................................................................................... 9 3.1.3 Local packing phenomena in concrete ............................................................................ 12 3.1.4 Water demand and particle packing ................................................................................ 14 3.1.5 Practical aspects considering particle packing in concrete .............................................. 17
3.2 Hydration .................................................................................................................................. 19 3.2.1 Hydration of portland cement .......................................................................................... 19 3.2.2 Hydration of portland cement with pozzolanas ............................................................... 22 3.2.3 Hydration of portland cement with fillers ....................................................................... 24 3.2.4 Pozzolanic activity........................................................................................................... 26
3.3 Load independent deformation ................................................................................................. 27 3.3.1 Chemical and autogenous shrinkage ............................................................................... 28 3.3.2 Plastic shrinkage .............................................................................................................. 33 3.3.3 Drying shrinkage ............................................................................................................. 33 3.3.4 Other types of volume changes ....................................................................................... 35
3.4 Strength of concrete .................................................................................................................. 37 3.4.1 General ............................................................................................................................ 37 3.4.2 High strength and ultra high performance concrete ......................................................... 37
Materials and methods ....................................................................................................... 40 4.1 Materials ................................................................................................................................... 40
4.1.1 Powders ........................................................................................................................... 40 4.1.2 Aggregates ....................................................................................................................... 42 4.1.3 Superplasticizers .............................................................................................................. 44 4.1.4 Fibres ............................................................................................................................... 45
4.2 Methods .................................................................................................................................... 46 4.2.1 Grinding .......................................................................................................................... 46 4.2.2 Mixing, mixing time and mixing order ............................................................................ 47 4.2.3 Mix compositions ............................................................................................................ 47 4.2.4 Heat development ............................................................................................................ 47 4.2.5 Determination of fresh concrete properties ..................................................................... 48 4.2.6 Determination of macroscopic properties of hardened concrete ..................................... 48 4.2.7 Determination of microscopic properties of hardened concrete ...................................... 51
Results and discussion ........................................................................................................ 53 5.1 Effect of ultrafine particles ....................................................................................................... 53
5.1.1 Influence of ultrafine particles on heat of hydration ........................................................ 53

XII
5.1.2 Effect of ultrafine particles as cement replacement in concrete ....................................... 58 5.1.3 Optimisation of low cement concretes with ultrafiller ..................................................... 72
5.2 Effect of high amounts of silica fume ....................................................................................... 75 5.2.1 Influence of high amounts of silica fume on concrete strength ....................................... 75 5.2.2 Influence of dry co-grinding of cement, silica fume and quartz on concrete strength ..... 77
5.3 Combination of ultrafine inert particles and silica fume ........................................................... 80 5.3.1 Low cement concretes with silica fume and ultrafine particles ....................................... 80 5.3.2 High-strength and ultra high performance concretes ....................................................... 89
5.4 Discussion ............................................................................................................................... 101 Conclusions ....................................................................................................................... 105
6.1 General .................................................................................................................................... 105 6.2 Application of ultrafine particles to mix designs..................................................................... 107 6.3 Future research ........................................................................................................................ 112
Applications ...................................................................................................................... 113 7.1 Low pH self-compacting concrete .......................................................................................... 113 7.2 Ultra high performance concrete with glass fibres .................................................................. 123 7.3 Ultra high performance concrete with glass fibres as repair material ..................................... 131
7.3.1 Durability of glass fibres ............................................................................................... 131 7.3.2 Mechanical tests on small scale structural members in the laboratory .......................... 132
References ......................................................................................................................... 135
Measurements and test results ........................................................................................ 144 A1 Particle size distributions ........................................................................................................ 144 A2 Compressive strength .............................................................................................................. 149 A3 Drying shrinkage and water loss ............................................................................................. 150 A4 Autogenous shrinkage ............................................................................................................. 152 A5 Capillary suction ..................................................................................................................... 153 A7 Frost resistance ........................................................................................................................ 155
XIII
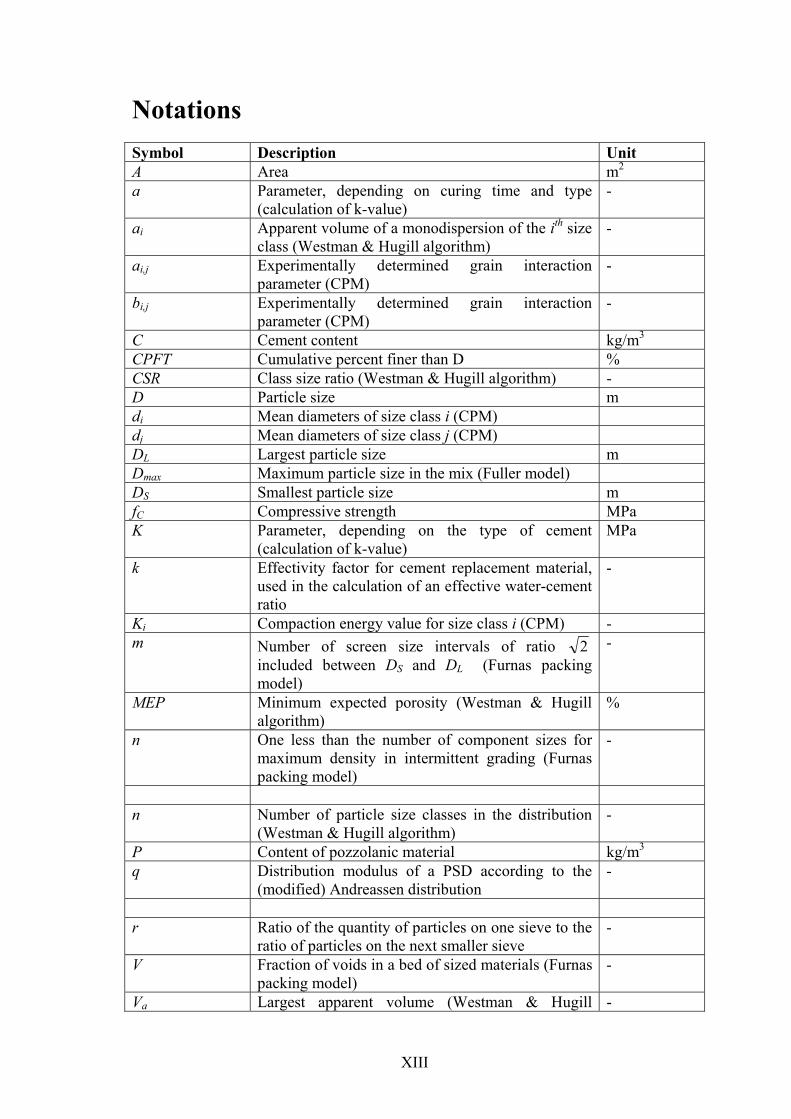
Notations Symbol Description Unit A Area m2 a Parameter, depending on curing time and type
(calculation of k-value) -
ai Apparent volume of a monodispersion of the ith size class (Westman & Hugill algorithm)
-
ai,j Experimentally determined grain interaction parameter (CPM)
-
bi,j Experimentally determined grain interaction parameter (CPM)
-
C Cement content kg/m3 CPFT Cumulative percent finer than D % CSR Class size ratio (Westman & Hugill algorithm) - D Particle size m di Mean diameters of size class i (CPM) dj Mean diameters of size class j (CPM) DL Largest particle size m Dmax Maximum particle size in the mix (Fuller model) DS Smallest particle size m fC Compressive strength MPa K Parameter, depending on the type of cement
(calculation of k-value) MPa
k Effectivity factor for cement replacement material, used in the calculation of an effective water-cement ratio
-
Ki Compaction energy value for size class i (CPM) - m Number of screen size intervals of ratio 2
included between DS and DL (Furnas packing model)
-
MEP Minimum expected porosity (Westman & Hugill algorithm)
%
n One less than the number of component sizes for maximum density in intermittent grading (Furnas packing model)
-
n Number of particle size classes in the distribution
(Westman & Hugill algorithm) -
P Content of pozzolanic material kg/m3 q Distribution modulus of a PSD according to the
(modified) Andreassen distribution -
r Ratio of the quantity of particles on one sieve to the
ratio of particles on the next smaller sieve -
V Fraction of voids in a bed of sized materials (Furnas packing model)
-
Va Largest apparent volume (Westman & Hugill -
XIV
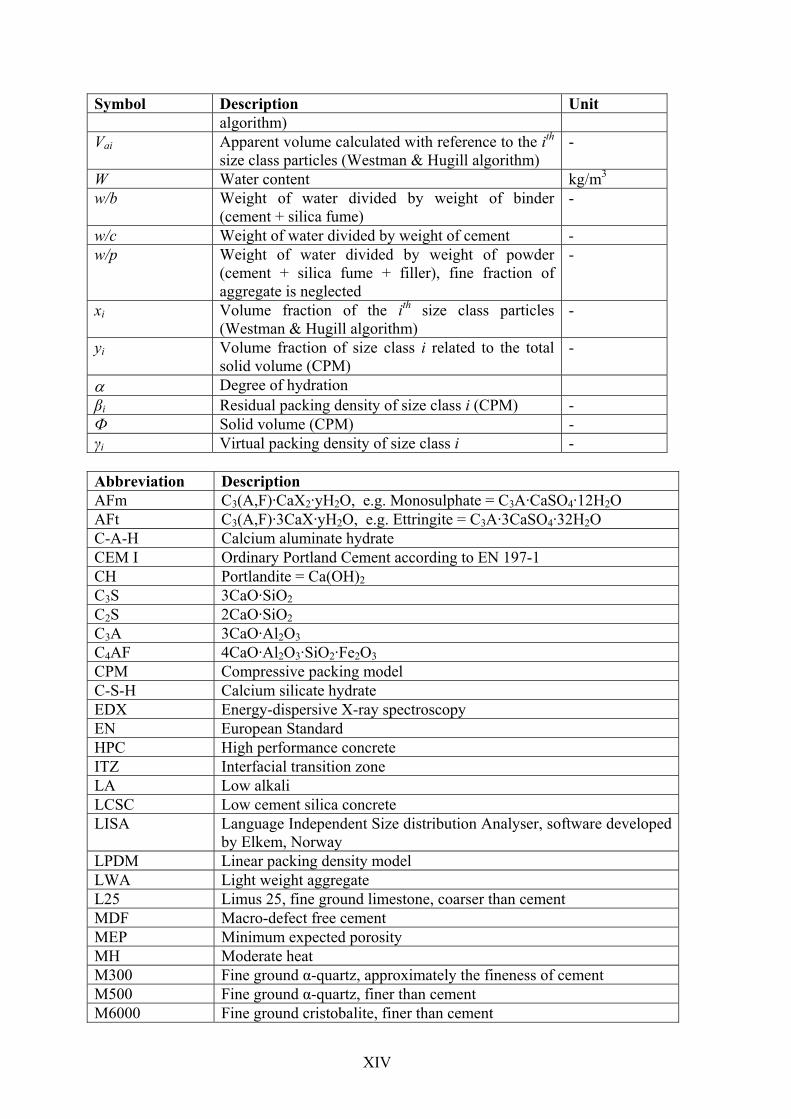
Symbol Description Unit algorithm)
Vai Apparent volume calculated with reference to the ith size class particles (Westman & Hugill algorithm)
-
W Water content kg/m3 w/b Weight of water divided by weight of binder
(cement + silica fume) -
w/c Weight of water divided by weight of cement - w/p Weight of water divided by weight of powder
(cement + silica fume + filler), fine fraction of aggregate is neglected
-
xi Volume fraction of the ith size class particles (Westman & Hugill algorithm)
-
yi Volume fraction of size class i related to the total solid volume (CPM)
-
α Degree of hydration βi Residual packing density of size class i (CPM) - Ф Solid volume (CPM) - γi Virtual packing density of size class i - Abbreviation Description AFm C3(A,F)·CaX2·yH2O, e.g. Monosulphate = C3A·CaSO4·12H2O AFt C3(A,F)·3CaX·yH2O, e.g. Ettringite = C3A·3CaSO4·32H2O C-A-H Calcium aluminate hydrate CEM I Ordinary Portland Cement according to EN 197-1 CH Portlandite = Ca(OH)2 C3S 3CaO·SiO2 C2S 2CaO·SiO2 C3A 3CaO·Al2O3 C4AF 4CaO·Al2O3·SiO2·Fe2O3 CPM Compressive packing model C-S-H Calcium silicate hydrate EDX Energy-dispersive X-ray spectroscopy EN European Standard HPC High performance concrete ITZ Interfacial transition zone LA Low alkali LCSC Low cement silica concrete LISA Language Independent Size distribution Analyser, software developed
by Elkem, Norway LPDM Linear packing density model LWA Light weight aggregate L25 Limus 25, fine ground limestone, coarser than cement MDF Macro-defect free cement MEP Minimum expected porosity MH Moderate heat M300 Fine ground α-quartz, approximately the fineness of cement M500 Fine ground α-quartz, finer than cement M6000 Fine ground cristobalite, finer than cement
XV
Abbreviation Description OPC Ordinary Portland Cement PCE Polycarboxylate ether based superplasticizer PSD Particle size distribution Q Wet-ground quartz, used as a slurry, finer than cement RPC Reactive Powder Concrete SCC Self-compacting concrete SEM Scanning Electron Microscope SF Silica fume SIFCON Slurry infiltrated fibre concrete SR Sulphate resistant SS Swedish Standard SY Fine ground nepheline syenite, finer than cement Vol. % Volume percent Woll Fine ground wollastonite, finer than cement Wt. % Weight percent XRD X-ray diffraction 29Si MAS NMR Silicon magic angle spinning nuclear magnetic resonance

XVI
Context of the thesis This thesis is built up from different studies with a common subject, conducted from 2003 to 2009. The main topic is the influence of ultrafine particles on concrete properties. It focuses on inert ultrafine particles as cement replacement in concrete and the combination of inert ultrafines and reactive silica fume. Concrete compositions are optimised towards lower cement content by means of improved particle packing. The practical aim of this work is to minimise the cement content in concrete and to develop concretes for special applications. The author chose to write this thesis as monograph for improved readability and easier understanding. It is the impression of the author that it would have been difficult to include a detailed exposition of the subject in another form of writing. Some results which are presented in this thesis are published previously at conferences or in research reports:
I. Lagerblad B, Vogt C, Moosberg-Bustnes H (2003): Fine ground quartz as cement replacement and pozzolana, in proceedings of the International Conference on Building Materials in Weimar, Germany, 2003.
II. Vogt C, Lagerblad B, Hugo-Persson, T (2004): Optimization of UHPC for selective stabilization of deep boreholes, in proceedings of the International Symposium on Ultra-High Performance Concrete, Kassel, Germany, 2004.
III. Lagerblad B, Vogt, C (2007): Fillers and ultrafine particles to save cement, in proceedings of the International conference on sustainability in cement and concrete industry, Lillehammer, Norway, 2007.
IV. Vogt C, Jonasson J-E, Wallin K, Lagerblad B, Baldy F (2009): Low pH self compacting concrete for deposition tunnel plugs, ISSN 1402-3091, SKB Rapport R-09-07, Stockholm, Sweden, 2009
Contribution of Carsten Vogt to publications with co-authors:
I. Complete experimental part, major part of writing. II. Complete experimental part, major part of writing.
III. Complete experimental part, minor part of writing. IV. Half of experimental part, half of writing.
In section 7.3, additional studies are briefly summarised. These studies have been performed by students of the Bauhaus University in Weimar, Germany and the Royal Institute of Technology in Stockholm, Sweden. These studies were based on findings described in this work and the author made contributions to the experimental part of the studies.
Chapter 1 Introduction
1
Chapter 1
Introduction
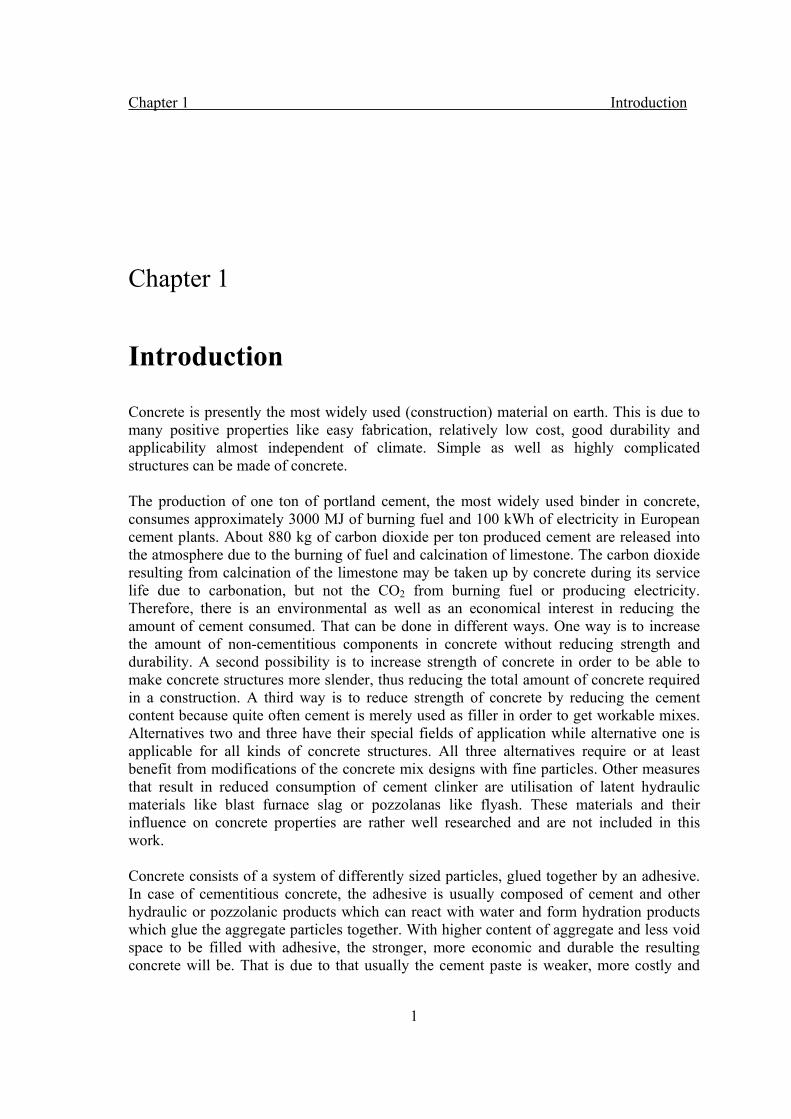
Concrete is presently the most widely used (construction) material on earth. This is due to many positive properties like easy fabrication, relatively low cost, good durability and applicability almost independent of climate. Simple as well as highly complicated structures can be made of concrete. The production of one ton of portland cement, the most widely used binder in concrete, consumes approximately 3000 MJ of burning fuel and 100 kWh of electricity in European cement plants. About 880 kg of carbon dioxide per ton produced cement are released into the atmosphere due to the burning of fuel and calcination of limestone. The carbon dioxide resulting from calcination of the limestone may be taken up by concrete during its service life due to carbonation, but not the CO2 from burning fuel or producing electricity. Therefore, there is an environmental as well as an economical interest in reducing the amount of cement consumed. That can be done in different ways. One way is to increase the amount of non-cementitious components in concrete without reducing strength and durability. A second possibility is to increase strength of concrete in order to be able to make concrete structures more slender, thus reducing the total amount of concrete required in a construction. A third way is to reduce strength of concrete by reducing the cement content because quite often cement is merely used as filler in order to get workable mixes. Alternatives two and three have their special fields of application while alternative one is applicable for all kinds of concrete structures. All three alternatives require or at least benefit from modifications of the concrete mix designs with fine particles. Other measures that result in reduced consumption of cement clinker are utilisation of latent hydraulic materials like blast furnace slag or pozzolanas like flyash. These materials and their influence on concrete properties are rather well researched and are not included in this work. Concrete consists of a system of differently sized particles, glued together by an adhesive. In case of cementitious concrete, the adhesive is usually composed of cement and other hydraulic or pozzolanic products which can react with water and form hydration products which glue the aggregate particles together. With higher content of aggregate and less void space to be filled with adhesive, the stronger, more economic and durable the resulting concrete will be. That is due to that usually the cement paste is weaker, more costly and
Chapter 1 Introduction
2
more prone to degradation than the aggregate. Therefore, packing of particles is fundamental in proportioning of concrete. There are plenty of models which allow calculating a grading of particles which will result in minimum void content. Certain models are based on the idea that the largest grains are to be packed first in a dense array and smaller and smaller grains fill the void space between the larger grains. This will result in dense packing of the involved particles, at least in theory. But, one of the basic problems with concrete is that it must be workable in the fresh state, it must be able to fill the formwork and achieve compaction. This requires that the inner friction in the material is at a minimum. One way of solving this problem is to increase the amount of fine grains, i.e. material in the size of cement or below. These fine grains will act as ball bearings and separate the coarser particles, allowing flow. Traditionally, the content of very fine particles in concrete had to be reduced in order to keep the water content at reasonable levels, ensuring sufficient strength, durability and economic production. Due to the development of efficient superplasticizers, the surface area of fine particles does not any longer determine the water content in concrete. Therefore, it is with the help of superplasticizers possible to include large amounts of very fine particles and achieve different concrete properties in fresh and hardened state. Traditionally, cement was used to be the finest particles in concrete. Later, silica fume showed the possibilities that arise from introducing reactive fines into concrete. Increased strength and durability were achieved. One of the drawbacks is the high cost of silica fume. The development of self-compacting concrete showed that increased content of inert filler coarser than cement has beneficial effects on concrete properties as well. However, the influence and potential of particles coarser than silica fume but finer than cement is not widely researched. These materials are denoted ultrafine particles in this work. The concept of ultrafine particles is already utilised to a certain extent in CEM II-L cements where up to 20 wt. % of cement clinker is substituted by limestone. Other minerals than calcite might be suitable as well or perform even better. Continuous particle size distributions are common in the ingredients for concrete and therefore a particle packing theory based on continuous size distributions seems suitable for concrete compositions. Industries like ceramics manufacturing have a much longer experience in working with very fine particles than the concrete producing industry. In ceramics manufacturing, a commonly used tool for designing particle size distributions is the modified Andreassen model (Dinger & Funk, 1992, 1993, 1994). Highly packed suspensions with low viscosity have been reported to be producible using this model. Apart from an increased grain size, concrete does not differ much from ceramics. The requirements on fresh and hardened concrete are similar to the requirements on fresh and burned ceramics. Therefore, the application of the same packing model to concrete should be possible and beneficial. With the application of the modified Andreassen model to concrete, optimisation of the whole particle system will be possible. Traditionally, the aggregates in concrete were optimised with the help of different packing models. However, the fines (fine aggregate below 0.125 mm, i.e., cement, filler, and pozzolanas) were often neglected. There seems to be a great potential for optimisation of concrete mixtures when including the fines into packing calculations and modelling.
Chapter 2 Aim, scope and limitations
3
Chapter 2
Aim, Scope and Limitations
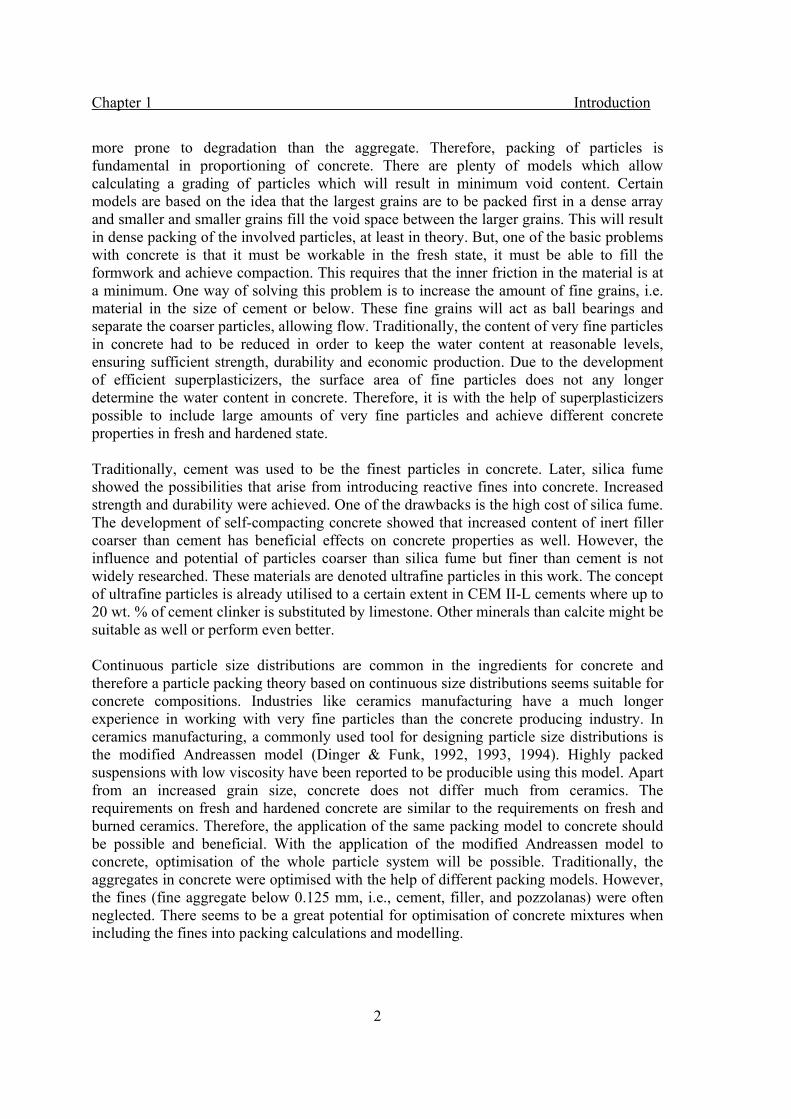
This work aims at increasing the knowledge on the effect of ultrafine particles in concrete. In the context of this work, ultrafine particles are particles with a grain size finer than cement. These particles may be inert and improve the packing density of the fines in concrete, or they may be pozzolanic and react with hydration products of the cement. The hypothesis of this work is that substantial amounts of cement can be replaced by suitable very fine grained materials without affecting mechanical properties or durability negatively. Cement itself is considered as a fraction of the complete particle mix that builds up the concrete. By application of suitable particle packing models to the entire concrete mix, the particle size distribution (PSD) of the entire mix can be adjusted in order to achieve mobility in the fresh state and adequate properties when hardened. Due to the fact that the ingredients of a concrete mix are particles with continuous size distributions, a model should be based on packing of continuous size distributions. A modification of concrete mixes with ultrafine particles affects the fresh and hardened properties of the concrete. The workability, hardening, mechanical properties and durability may be influenced in different ways. Reactive particles like silica fume may have different effects compared to inert particles. Synergy effects from combination of reactive and inert particles can be expected. Therefore, this investigation is done in several steps. First, a literature review on particle packing, cement hydration, load independent deformation and mechanical strength of concrete is done. These topics are considered to be of primary interest for the subject of the work. Particle packing is directly related to the introduction of other fine particles than cement into concrete. It may be used to provide knowledge on how to utilise ultrafine particles in the best way. The hydration of cement is known to be influenced by the presence of other particles. Load-independent deformations of concrete are known to be influenced by the content of fines, the cement content and reactive additives. The mechanical strength of concrete is strongly related to the porosity which in turn is influenced by hydration, particle packing and additives. The experimental section of this work concentrates on concrete experiments. In addition, the influence of the ultrafines on the hydration is examined on paste samples with the help
Chapter 2 Aim, scope and limitations
4
of isothermal calorimetry. In the concrete experiments, different measures are taken in order to isolate the influence of inert and reactive ultrafine particles. First, different inert ultrafine particles are used to replace cement at constant water content and variable water content. Then, mix compositions are optimised towards low cement content with the help of inert ultrafines. The effect of high contents of reactive ultrafine particles on concrete properties is tested, also in combination with inert ultrafines. Then, concrete compositions are optimised towards low binder content. The effect of different ultrafine particles on concrete properties is quantified by tests on compressive strength and calculation of k values, shrinkage, and characterisation of the microstructure by microscopy, mercury intrusion Porosimetry (MIP) and capillary suction as well as test of frost resistance. The results of this work shall contribute to an increased understanding of the effects of different very fine particles on concrete properties. Recommendations are given on how to include ultrafine particles in mix design. This work does not concentrate on concrete mixes that comply with recent concrete standards in which concrete properties are mainly related to the water-cement ratio. The results of this work are expected to be more useful for performance based design of concrete or in special applications. Further, it is not primarily the fresh concrete properties that are investigated. Workability of fresh concrete is of course an important issue but within the limitations of this work, superplasticizers were used to achieve workable mixes when necessary. The fine aggregate (0-8 mm) used in this work is of natural origin with well rounded particle shape. Crushed fine aggregate is not tested but it is likely that some adjustments are necessary when using this type of fine aggregate. There are other properties of hardened concrete, e.g. creep, E-modulus, chloride diffusion and carbonation which can be influenced by ultrafine particles but it is not possible to test all of them within this work. Neither is cost efficiency of the resulting mixes considered, at present time the cost of the used ultrafines may exceed the cost of the replaced cement. Additionally, many concrete plants may have problems handling ultrafines. However, the findings of this work can contribute to increased use of ultrafines in concrete and intensified research on suitable by-products. In that way, cost efficiency can be achieved in the future.
Chapter 3 Theoretical background
5
Chapter 3
Theoretical background
3.1 Particle packing
Particle packing is fundamental to concrete. The better the packing of the particle system, the less binder is required in the concrete. The problem with concrete is, however, that concrete must flow and be compactable in the fresh state which stands in conflict with optimal packing. Introduction of large amounts of fine particles, in size of cement and below, into a concrete mix can solve this problem. Then, the particle size distribution of the whole mix composition, including cement, pozzolanas and/or fillers, should be taken into account when calculating the packing density.
3.1.1 Particle packing theory
Particle packing is an important issue not only for concrete materials. Ceramics, geotechnology, food processing industry and others do benefit from densely packed systems. The first investigations concerning particle packing were done more than 200 years ago (see Dinger & Funk, 1992). One of the most important properties of a particle system is its packing density; the volume percentage of solids for each volume unit. Looking into a certain system, the particle packing of this system is a function of particle size distribution, particle shape, and particle surface, ratio between system size and maximum grain size and presence of liquids, if any. In order to understand the existing theories and models for systems with multiple grain sizes, one ought to look into systems with only one grain size first. Systems consisting of only one grain size are called monodispersions; they are useful for modelling but rarely seen in reality. If perfect spherical particles of only one size are assumed, the packing density of the system depends on which structure is formed by the spheres. According to White and Walton (1936), the cubic packing structure results in a packing density of 0.52 while pyramidal or tetrahedral structures can give 0.74. Orthorhombic and double stagger packing result in packing densities of 0.60 and 0.70, respectively.
Chapter 3 Theoretical background
6
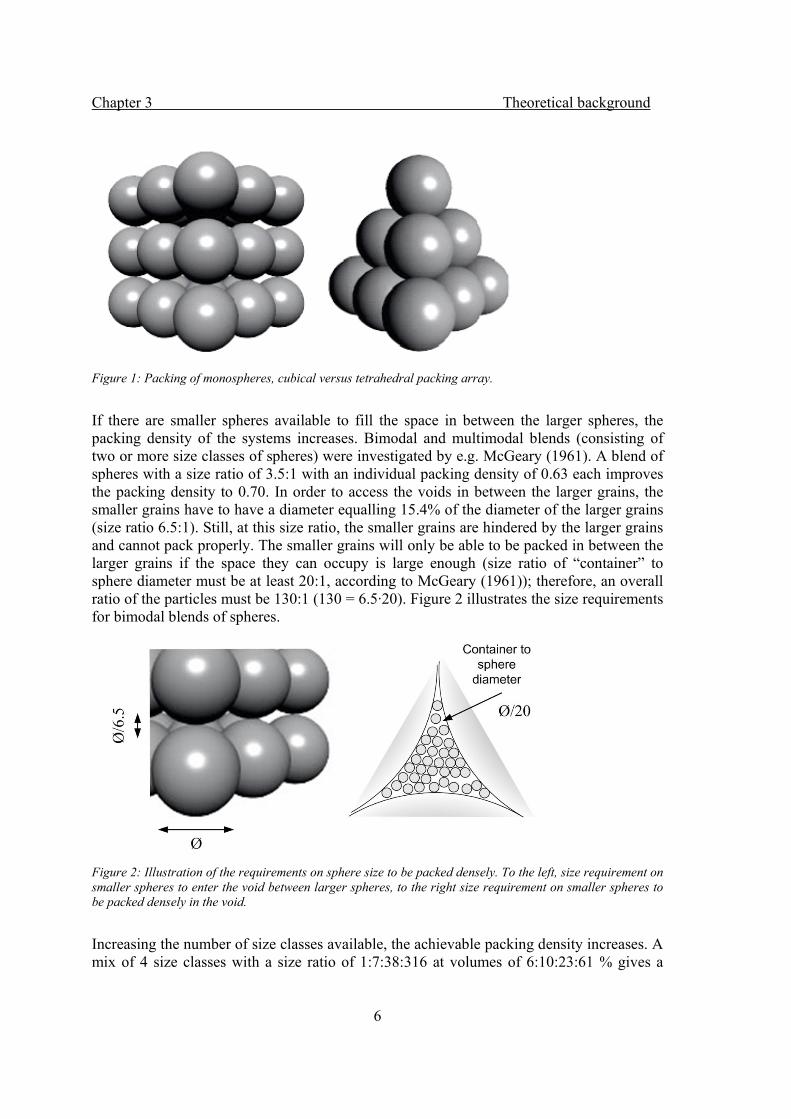
Figure 1: Packing of monospheres, cubical versus tetrahedral packing array.
If there are smaller spheres available to fill the space in between the larger spheres, the packing density of the systems increases. Bimodal and multimodal blends (consisting of two or more size classes of spheres) were investigated by e.g. McGeary (1961). A blend of spheres with a size ratio of 3.5:1 with an individual packing density of 0.63 each improves the packing density to 0.70. In order to access the voids in between the larger grains, the smaller grains have to have a diameter equalling 15.4% of the diameter of the larger grains (size ratio 6.5:1). Still, at this size ratio, the smaller grains are hindered by the larger grains and cannot pack properly. The smaller grains will only be able to be packed in between the larger grains if the space they can occupy is large enough (size ratio of “container” to sphere diameter must be at least 20:1, according to McGeary (1961)); therefore, an overall ratio of the particles must be 130:1 (130 = 6.5·20). Figure 2 illustrates the size requirements for bimodal blends of spheres.
Figure 2: Illustration of the requirements on sphere size to be packed densely. To the left, size requirement on smaller spheres to enter the void between larger spheres, to the right size requirement on smaller spheres to be packed densely in the void.
Increasing the number of size classes available, the achievable packing density increases. A mix of 4 size classes with a size ratio of 1:7:38:316 at volumes of 6:10:23:61 % gives a
Chapter 3 Theoretical background
7
theoretical packing density of 0.975. However, these are purely theoretical values, but still, they could be reproduced with “real spheres, tweezers, glue, and wonderful patience” (Dinger & Funk, 1992). According to Dinger & Funk (1992, 1993, 1994), nature does not provide monodispersions in the desired size ratios and another major problem is to place the smaller spheres in between the already packed larger grains in a real mix. Therefore, different models are required to equal real particle size distributions. Two basic works on particle packing of realistic PSD, based on different principles, were presented in the 1930’s. Furnas’ (1931) work is based on the packing of discretely sized particles. His approach is based on the assumption that best packing will occur if the smaller grain size fills the voids in the larger particles. The ratio between the volumes on two consecutive screens should be constant. Extending that to a range of particle sizes defined by standard sieves, the following equation gives the densest packing according to Furnas:
SL
S
DD
DD
rrrrCPFT
loglog
loglog
100 −−
= (Eq. 1)
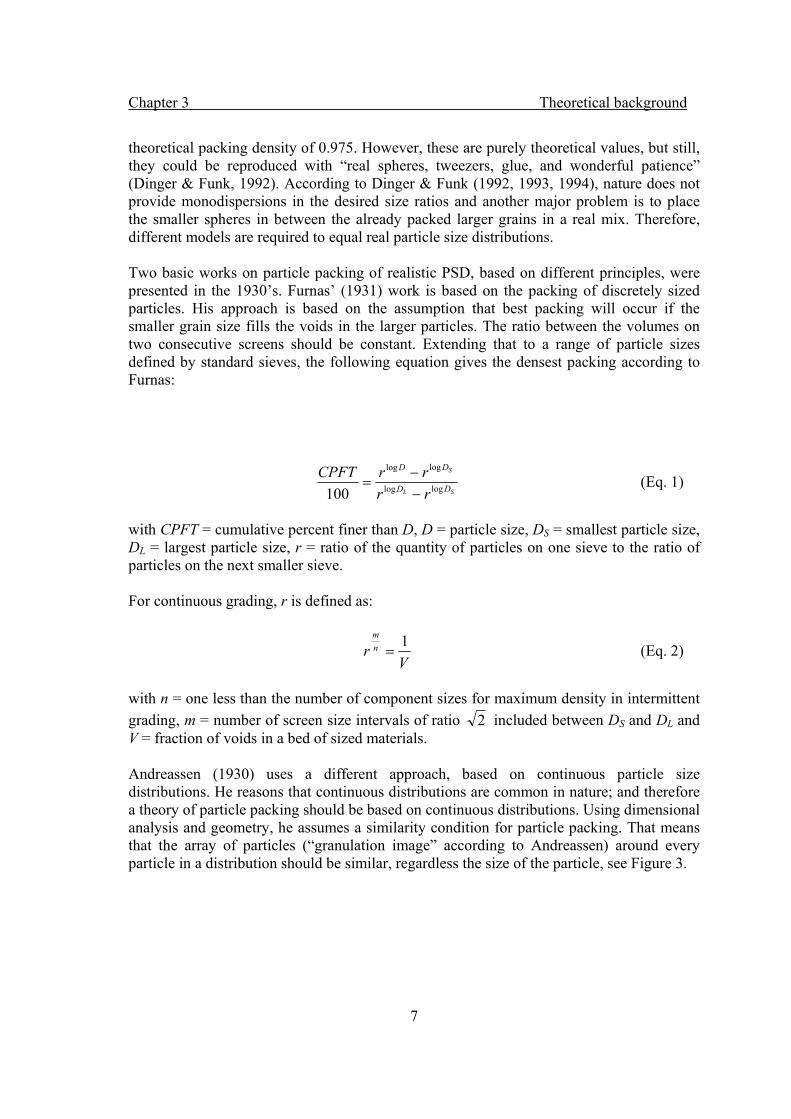
with CPFT = cumulative percent finer than D, D = particle size, DS = smallest particle size, DL = largest particle size, r = ratio of the quantity of particles on one sieve to the ratio of particles on the next smaller sieve. For continuous grading, r is defined as:
Vr n
m 1= (Eq. 2)
with n = one less than the number of component sizes for maximum density in intermittent grading, m = number of screen size intervals of ratio 2 included between DS and DL and V = fraction of voids in a bed of sized materials. Andreassen (1930) uses a different approach, based on continuous particle size distributions. He reasons that continuous distributions are common in nature; and therefore a theory of particle packing should be based on continuous distributions. Using dimensional analysis and geometry, he assumes a similarity condition for particle packing. That means that the array of particles (“granulation image” according to Andreassen) around every particle in a distribution should be similar, regardless the size of the particle, see Figure 3.

Chapter 3 Theoretical background
8
Figure 3: Illustration of the similarity condition in the Andreassen packing model. The environment around two particles of different size is photographed. The picture with the smaller particle is enhanced until the two particles of interest are of the same size. If then the environments around each are similar, the similarity condition is fulfilled.
Using the similarity condition and continuous particle size distributions, Andreassen’s equation for particle packing reads as follows:
q
LDDCPFT
⎟⎟⎠
⎞⎜⎜⎝
⎛=
100 (Eq. 3)
with CPFT = cumulative percent finer than D, D = particle size, D = particle size, DL = largest particle size, q = distribution modulus. Equations like the above (Eq. 3) produce straight lines in a log-log diagram, the distribution modulus q being the inclination of the graph. Andreassen concluded from experiments that the distribution modulus in Eq.(3) should be between 1/3 and 1/2 in order to achieve dense packing. Later, Dinger & Funk (1992, 1993, 1994) showed with computer simulations that a distribution modulus of 0.37 gives the densest packing (for perfect spheres). The theories presented above are well established and present the foundation of more recent developments. As particle packing is important in numerous industries, many researchers have developed different models to solve the problem of highest possible packing density. However, all of these models are based on either discretely sized particles or continuous size distributions. In the next section, some packing models suitable for concrete, are discussed.
Chapter 3 Theoretical background
9
3.1.2 Particle packing in concrete
The theoretical models described in the previous section are based on the assumption of perfect spheres, smooth particle surfaces and no attracting or repelling forces between particles. In reality, this will never be the case, especially for concrete mixes. Additionally, fresh concrete needs to be placed and has to flow, at least to a certain degree. But, if all particles are completely packed, flow is highly unlikely. Therefore, an approach with completely dense packing is not suitable for concrete mixes. Already more than 100 years ago, researchers developed models in order to increase the ratio of aggregates in concrete mixes. Fuller & Thompson (1907) stated, that if the aggregates in a concrete mix are graded according to Eq.(4) below, the resulting mix requires less cement and gives higher compressive strength.
5.0
max100 ⎟⎟⎠
⎞⎜⎜⎝
⎛=
DDCPFT (Eq. 4)
with CPFT = cumulative percent finer than D, D = particle size, Dmax = maximum particle size in the mix. A closer look at the Fuller curve shows that it is a special case of Andreassen’s equation with a distribution modulus q = 0.5. Fuller investigated only the aggregates in concrete mixes, not the whole particle mix. Aggregates for concrete are usually classified by standard sieves with size intervals of ratio 2 for coarser aggregate and ratio 2 for finer sizes. The Fuller curve ensures continuous grading but does not give the highest possible packing. Adding cement and water to the mix, lubrication and workability are assured. The Fuller curve, despite its “age”, is still the base for proportioning the aggregate for concrete mixes in many national concrete standards. It is suitable for the production of concrete to be placed and vibrated traditionally. Stovall et al. (1986) presented a linear model for packing of several grain sizes (LPDM), based on discretely sized particles. The model includes the particle shape, wall effect (explained in section 3.1.3) and takes into account the fact that smaller grain sizes dilute the packing density of the larger fractions. Still, the foundation of the LPDM is that in a compact system at least one fraction of particles will be completely packed and the other particles have to fill the remaining volume. In reality, that is impossible to achieve (Dinger & Funk, 1992, 1993, 1994). The linear packing density model was modified by de Larrard (1999) and resulted in the Compressive Packing Model (CPM). The model introduces the virtual packing density and the compaction index. The virtual packing density is the highest possible packing density if the particles were placed optimally one by one. In reality, there is always random packing, resulting in free space that could be occupied by a finer fraction of particles. The virtual packing of monodispersions can be up to 0.74 while the packing density that can be measured in reality on a random mix will be around 0.64 (Cumberland & Crawford, 1987).
Chapter 3 Theoretical background
10
The compaction index is a measure for the influence of the placing process. Due to the fact that the CPM includes particle shape, wall effect and placing method, the equations involved become rather complicated. First, a value K is introduced which represents the amount of energy put into compaction of the granular mix. K = ∞ would be required for achieving the virtual packing density, K = 9.0 is defined to be equivalent to vibration and compression with 10 kPa, K = 4.5 for dry rodding and K = 4.1 for pouring. In a monodisperse mix, the following relationship is defined:
1/1−Φ
=i
iKβ
(Eq. 5)
with Ki = compaction energy value for size class i, βi = residual packing density of size class i, Ф = solid volume. In that way, a calibrated βi can be calculated for a known value of Ki. The sum of all Ki values for all size classes gives a total K for the complete mix:
∑=
=n
iiKK
1
(Eq. 6)
Ki of size class i within the particle mix is obtained using the following relationship:
∑∑== −Φ
==n
i
i
i
in
ii
y
KK11 11
γ
β (Eq. 7)
with yi = volume fraction of size class i related to the total solid volume, γi = virtual packing density of size class i, βi = residual packing density of size class i and Ф = solid volume. The virtual packing density γi of each size class can be calculated from:
)1())11(1(1 ,1
1
1 ,j
iji
n
ij ij
i
j ijiii
ii
aybyββ
βββ
βγ
−−−+−−=
∑∑ +=
−
=
(Eq. 8)
with yi = volume fraction of size class i related to the total solid volume, βi = residual packing density of size class i, βj = residual packing density of the size class below i and ai,j,bi,j = experimentally determined grain interaction parameters. The grain interaction parameters ai,j and bi,j can be calculated using:
Chapter 3 Theoretical background
11
02.1, )1(1
i
jji d
da −−= 5.1
, )1(1i
jji d
db −−= (Eq. 9)
with di and dj = mean diameters of size classes i and j. For predetermined K and known βi and γi, the above equation can be solved to maximise for different yi and in that way minimise the void ratio of the total mix. The application of the CPM to concrete mixes results in mix proportions with low void content. It is especially suitable for gap graded aggregates. However, it shows quite often in practice that mixes incorporating real continuous particle size distributions, which were composed with the help of the CPM, have rather low workability (Fennis, 2006). The CPM includes a lot of phenomena that occur in real concrete mixes and puts those together in a rather complex set of equations but it is still based on packing of monodispersions in order to predict the packing of a continuously graded mix. The Andreassen model was modified by Dinger & Funk (1992, 1993, 1994) by the introduction of a smallest particle size. This modified Andreassen model is still based on the similarity condition used by Andreassen, the modified equation reads:
qS
qL
qS
q
DDDDCPFT
−−
=100
(Eq. 10)
with CPFT = cumulative percent finer than D, D = particle size, DS = smallest particle size, DL = largest particle size, q = distribution modulus. With the help of computer modelling, Dinger & Funk (1992, 1993, 1994) determined the distribution modulus resulting in the highest packing density. They found that a continuous PSD (of perfect spheres) with a distribution modulus of 0.37 gives the highest possible packing of that system. Inter-particle forces and border-related phenomena like the wall-effect were neglected. Interesting is the finding that if the distribution modulus increases above 0.37, the porosity of a system increases instantly, see also Figure 6 in section 3.1.4. On the contrary, finer PSD’s with q below 0.37 do not show the same trend, especially for broad PSD’s. Broad size distributions with q between 0.20 and 0.40 may be densely packed. Dinger & Funk were able to produce coal slurries with a solid content of 80%, maintaining very low viscosity and thus high flowability. Even though the modified Andreassen model was developed for ceramics and other fine grained suspensions like coal slurries, its application to concrete is possible and useful. Brouwers & Radix (2005), Brameshuber & Uebachs (2006) and Fennis et al. (2007) amongst others used the modified Andreassen model for the optimisation of self-compacting concrete. Hüsken & Brouwers (2008) showed that the model can be used for the improvement of earth-moist concrete compositions as well. The difference between the application to self-compacting concrete and earth-moist concrete lies in the distribution modulus q. A mix aimed for higher flowability should have a lower distribution modulus,
Chapter 3 Theoretical background
12
thus incorporating more fine particles. Therefore, the composition of self-compacting concretes should follow a PSD with a distribution modulus of 0.22 to 0.25 (Brouwers & Radix, 2005) while earth-moist concrete should have a distribution modulus of 0.35 to 0.40 (Hüsken & Brouwers, 2008).
3.1.3 Local packing phenomena in concrete
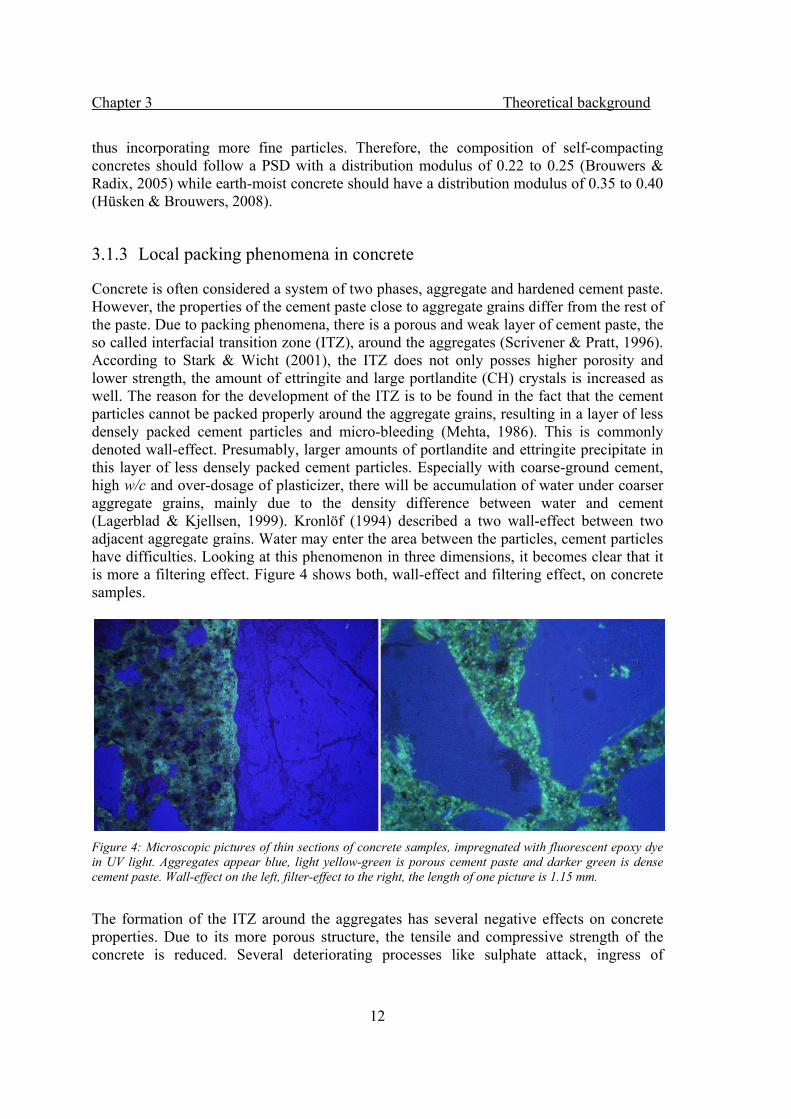
Concrete is often considered a system of two phases, aggregate and hardened cement paste. However, the properties of the cement paste close to aggregate grains differ from the rest of the paste. Due to packing phenomena, there is a porous and weak layer of cement paste, the so called interfacial transition zone (ITZ), around the aggregates (Scrivener & Pratt, 1996). According to Stark & Wicht (2001), the ITZ does not only posses higher porosity and lower strength, the amount of ettringite and large portlandite (CH) crystals is increased as well. The reason for the development of the ITZ is to be found in the fact that the cement particles cannot be packed properly around the aggregate grains, resulting in a layer of less densely packed cement particles and micro-bleeding (Mehta, 1986). This is commonly denoted wall-effect. Presumably, larger amounts of portlandite and ettringite precipitate in this layer of less densely packed cement particles. Especially with coarse-ground cement, high w/c and over-dosage of plasticizer, there will be accumulation of water under coarser aggregate grains, mainly due to the density difference between water and cement (Lagerblad & Kjellsen, 1999). Kronlöf (1994) described a two wall-effect between two adjacent aggregate grains. Water may enter the area between the particles, cement particles have difficulties. Looking at this phenomenon in three dimensions, it becomes clear that it is more a filtering effect. Figure 4 shows both, wall-effect and filtering effect, on concrete samples.
Figure 4: Microscopic pictures of thin sections of concrete samples, impregnated with fluorescent epoxy dye in UV light. Aggregates appear blue, light yellow-green is porous cement paste and darker green is dense cement paste. Wall-effect on the left, filter-effect to the right, the length of one picture is 1.15 mm.
The formation of the ITZ around the aggregates has several negative effects on concrete properties. Due to its more porous structure, the tensile and compressive strength of the concrete is reduced. Several deteriorating processes like sulphate attack, ingress of
Chapter 3 Theoretical background
13
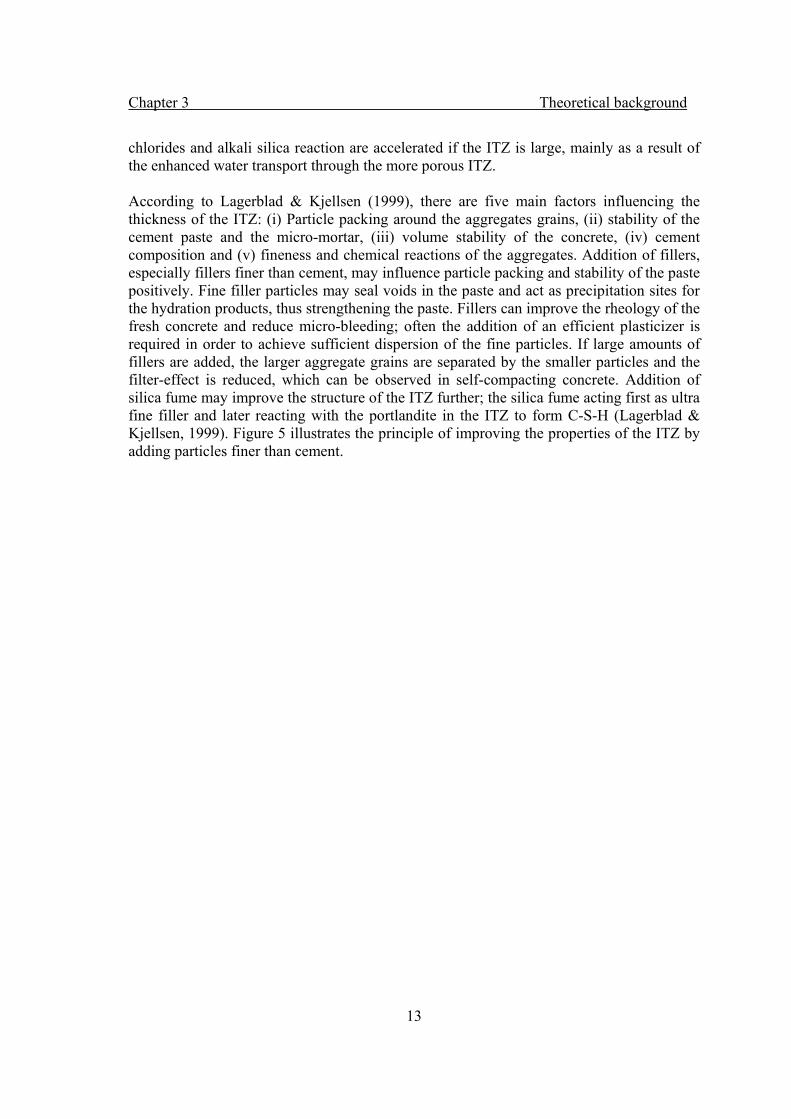
chlorides and alkali silica reaction are accelerated if the ITZ is large, mainly as a result of the enhanced water transport through the more porous ITZ. According to Lagerblad & Kjellsen (1999), there are five main factors influencing the thickness of the ITZ: (i) Particle packing around the aggregates grains, (ii) stability of the cement paste and the micro-mortar, (iii) volume stability of the concrete, (iv) cement composition and (v) fineness and chemical reactions of the aggregates. Addition of fillers, especially fillers finer than cement, may influence particle packing and stability of the paste positively. Fine filler particles may seal voids in the paste and act as precipitation sites for the hydration products, thus strengthening the paste. Fillers can improve the rheology of the fresh concrete and reduce micro-bleeding; often the addition of an efficient plasticizer is required in order to achieve sufficient dispersion of the fine particles. If large amounts of fillers are added, the larger aggregate grains are separated by the smaller particles and the filter-effect is reduced, which can be observed in self-compacting concrete. Addition of silica fume may improve the structure of the ITZ further; the silica fume acting first as ultra fine filler and later reacting with the portlandite in the ITZ to form C-S-H (Lagerblad & Kjellsen, 1999). Figure 5 illustrates the principle of improving the properties of the ITZ by adding particles finer than cement.
Chapter 3 Theoretical background
14
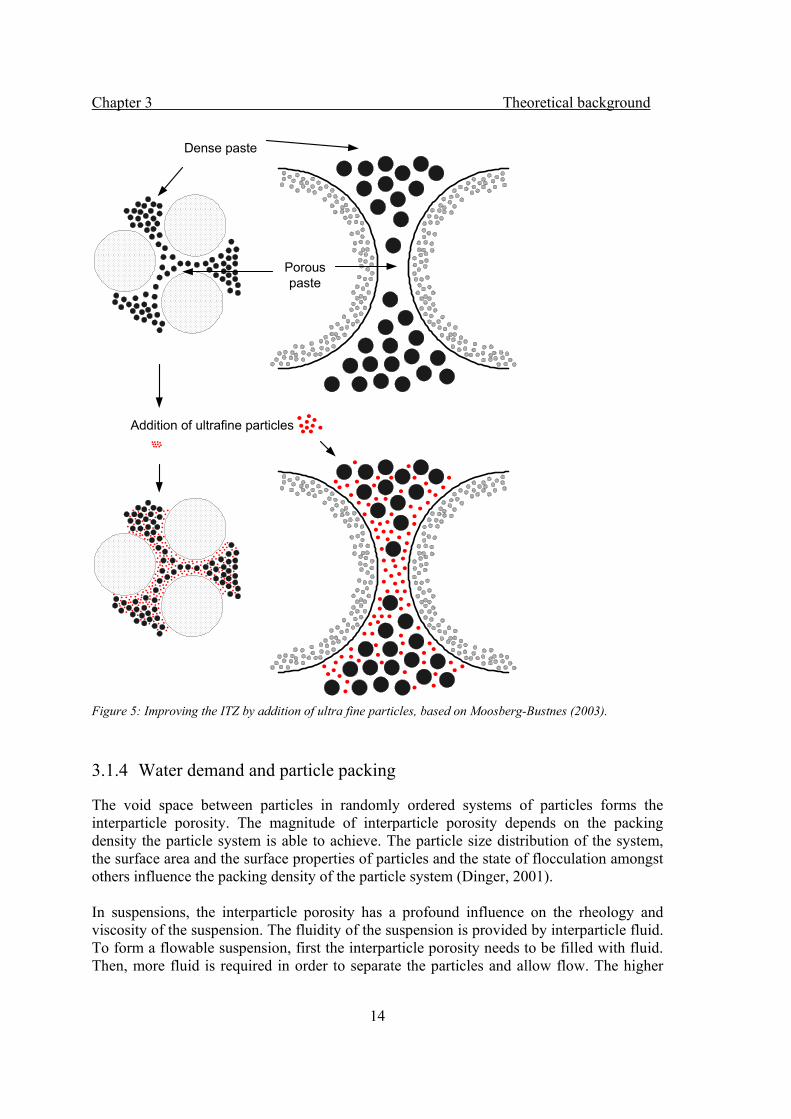
Figure 5: Improving the ITZ by addition of ultra fine particles, based on Moosberg-Bustnes (2003).
3.1.4 Water demand and particle packing
The void space between particles in randomly ordered systems of particles forms the interparticle porosity. The magnitude of interparticle porosity depends on the packing density the particle system is able to achieve. The particle size distribution of the system, the surface area and the surface properties of particles and the state of flocculation amongst others influence the packing density of the particle system (Dinger, 2001). In suspensions, the interparticle porosity has a profound influence on the rheology and viscosity of the suspension. The fluidity of the suspension is provided by interparticle fluid. To form a flowable suspension, first the interparticle porosity needs to be filled with fluid. Then, more fluid is required in order to separate the particles and allow flow. The higher
Porous paste
Dense paste
Addition of ultrafine particles
Chapter 3 Theoretical background
15
the packing density of the particle system, the less fluid is required to enable flow, or, the lower the viscosity of the system at certain content of fluid (above the minimum amount of fluid required to fill the interparticle porosity). This is of course a simplified way of looking at suspensions and interactions between fluid and particle from Dinger (2001), but it may be sufficient for many engineering requirements. The interparticle porosity of a particle system can be calculated from the particle size distribution as the minimum expected porosity. This minimum expected porosity can be seen as the minimum amount of fluid that has to be added to a system of particles in order to enable flow. Note that in order to allow high flowability, more fluid is required in order to separate the particles and reduce the inner friction of the system. The influence of admixtures is neglected as well. A way of calculating the minimum expected porosity of a particle system from the particle size distribution is the Westman & Hugill (1930) algorithm equation set which was modified by Dinger & Funk (1992, 1993, 1994) and is explained in a simplified way in Dinger (2001). First, the apparent volume of each size class in the particle size distribution is calculated according to the following expressions:
∑−
=
⋅+=
⋅++=⋅+=
⋅=
1
1
33213
2212
111
n
jnnjan
a
a
a
xaxV
xaxxVxaxV
xaV
(Eq. 11)
with ai = apparent volume of a monodispersion of the ith size class, defined by (Eq. 12), xi = volume fraction of the ith size class particles, Vai = apparent volume calculated with reference to the ith size class particles, n = number of particle size classes in the distribution. This calculation requires that the size classes of the particles size distribution follow a complete size series of sieves, preferably a sieve series with a ratio of 4 2 . If the particle size distribution to be analysed does not follow a sieve series with a ratio of 4 2 , it should be recalculated, using interpolation. The apparent volumes of monodispersions to which each size class can be packed are valid for continuous distributions and can be calculated according to the following expression:
qi
CSR
a
⎟⎠⎞
⎜⎝⎛−
=11
1 (Eq. 12)
with CSR = class size ratio = preferably 4 2 , q = distribution modulus of the ideal particle size distribution according to the modified Andreassen distribution giving densest packing = 0.37.
Chapter 3 Theoretical background
16
Now, the apparent volumes Vai can be calculated for all size classes of the particle size distribution. The largest apparent volume Vai defines the size class with the lowest degree of packing and thus the minimum expected porosity of the complete particle size distribution. From the largest apparent volume Vai the minimum expected porosity can be calculated according to:
%1140 ⎟⎟⎠
⎞⎜⎜⎝
⎛−⋅=
aVMEP (Eq. 13)
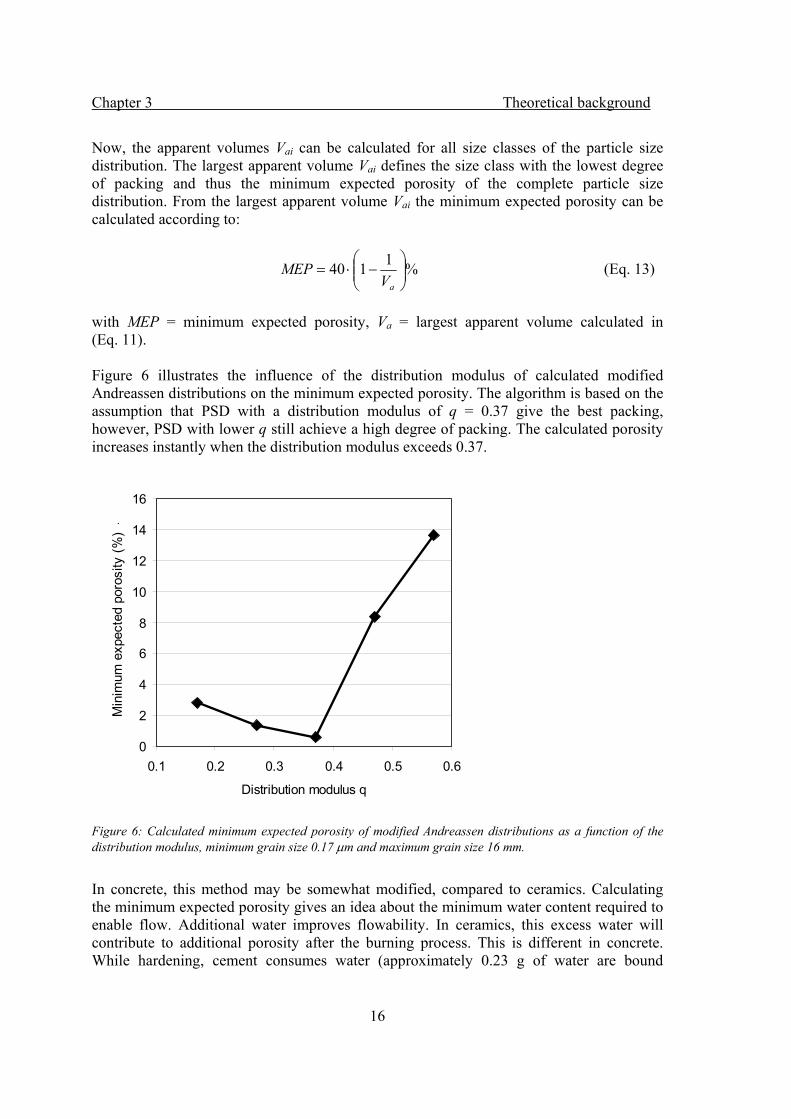
with MEP = minimum expected porosity, Va = largest apparent volume calculated in (Eq. 11). Figure 6 illustrates the influence of the distribution modulus of calculated modified Andreassen distributions on the minimum expected porosity. The algorithm is based on the assumption that PSD with a distribution modulus of q = 0.37 give the best packing, however, PSD with lower q still achieve a high degree of packing. The calculated porosity increases instantly when the distribution modulus exceeds 0.37.
Figure 6: Calculated minimum expected porosity of modified Andreassen distributions as a function of the distribution modulus, minimum grain size 0.17 μm and maximum grain size 16 mm.
In concrete, this method may be somewhat modified, compared to ceramics. Calculating the minimum expected porosity gives an idea about the minimum water content required to enable flow. Additional water improves flowability. In ceramics, this excess water will contribute to additional porosity after the burning process. This is different in concrete. While hardening, cement consumes water (approximately 0.23 g of water are bound
0
2
4
6
8
10
12
14
16
0.1 0.2 0.3 0.4 0.5 0.6
Distribution modulus q
Min
imum
exp
ecte
d po
rosi
ty (%
) -
Chapter 3 Theoretical background
17
chemically by 1 g cement according to Powers & Brownyard, 1948) and therefore water excess (which will ensure low viscosity) may still result in dense packing and high strength of the hardened concrete. One has to bear in mind that this is an approach purely based on packing of particles. The influence of the water- cement ratio on the strength of the cement paste is neglected.
3.1.5 Practical aspects considering particle packing in concrete
Concrete is a technical product which is produced worldwide in vast amounts at a low technological standard, compared to e.g. chemical industry or metallurgy. Concrete is expected to be cheap and locally producible with almost any ingredients, namely aggregate. Cement production itself is more advanced and costly, therefore usually higher quality standards and product control are applicable. A common problem in the production of standard concrete is the fact that the main ingredient, the aggregate, is shifting in quality and grading due to the fact that it is a low cost mass product of natural origin. Another problem for application of particle packing in concrete production or any other industry that handles fine ground materials is particle size analysis (Dinger, 2001). Analysis of particle size distributions is usually done by sieving, laser diffraction, sedimentation analysis or microscopy. All these methods have certain advantages and problems. All methods for particle size analysis have upper and lower size limits. Outside these limits, particle sizes cannot be measured. In concrete technology, sieving and laser diffraction are most common. One of the shortcomings with laser diffraction is that, if a certain amount of particles is outside the size limit of the instrument, they are not included in the measurement. The resulting particle size distribution, normalised to 100 %, will be wrong and there is no information available on the percentage of particles outside the measuring limit (Dinger, 2001). When using sieve analyses, usually particles below 63 µm cannot be measured. Sieve blinding, the blocking of holes by larger particles, hinders smaller particles from passing and produces wrong results (Dinger, 2001). Fine particles that are attached to larger particles can produce wrong results in dry sieving. Particle shape is usually not recorded by any of the above mentioned techniques. However, it is an important factor in practice and may influence results of particle size distribution analyses as well. In sieving, flaky particles will be characterised by their second largest dimension, fibrous particles by their smallest dimension. In laser diffraction, all particle sizes are defined as equivalent spherical diameters. In summary, particle size distribution analysis of real materials with irregular shapes will produce a more or less accurate picture of the reality. Using these approximate values in packing models which are almost entirely based on packing of perfect spheres, calculated and observed packing may differ greatly. Adding the fact that flaky and fibrous particles may hinder other particles from being well packed, calculated packing may be even more misleading. When performing packing calculations for concrete, one experiences additional problems. Most of the fine powders used in concrete react immediately when in contact with water, thus changing size due to dissolution or growth of hydration products. Particle size analyses on the other hand are done on dry materials or in organic solvents to prevent these processes. The question remains, how comparable is the particle size distribution of ready-
Chapter 3 Theoretical background
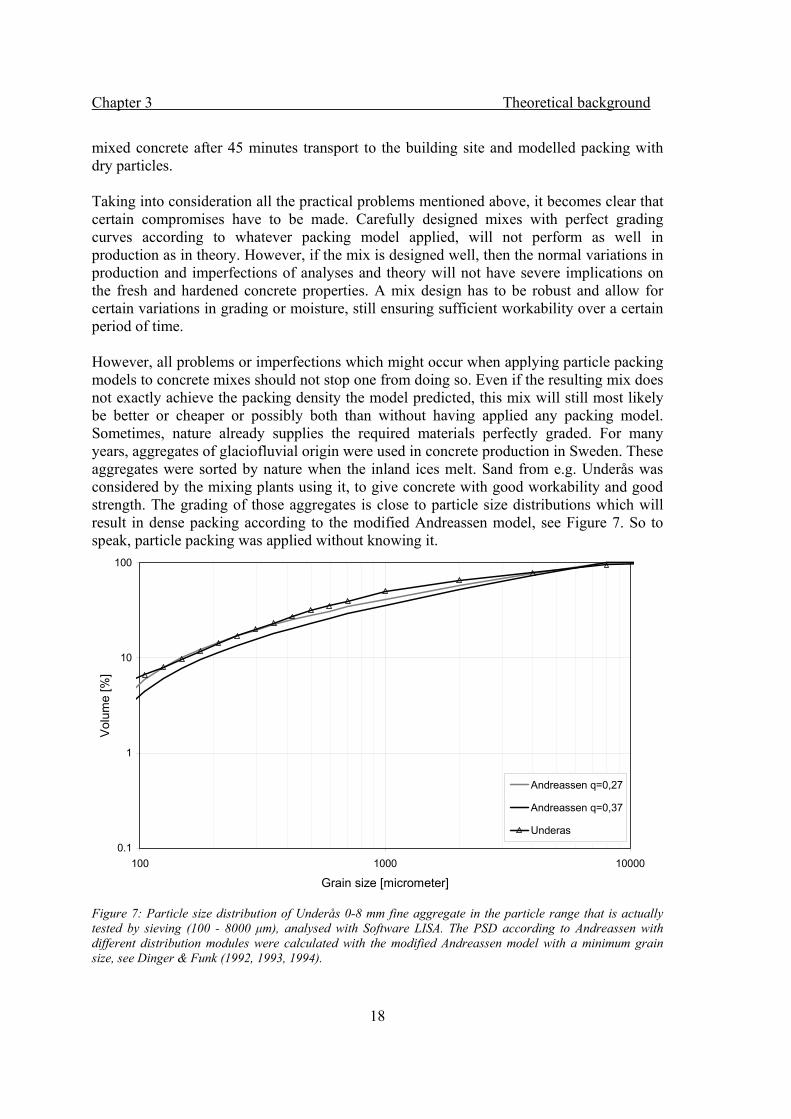
18
mixed concrete after 45 minutes transport to the building site and modelled packing with dry particles. Taking into consideration all the practical problems mentioned above, it becomes clear that certain compromises have to be made. Carefully designed mixes with perfect grading curves according to whatever packing model applied, will not perform as well in production as in theory. However, if the mix is designed well, then the normal variations in production and imperfections of analyses and theory will not have severe implications on the fresh and hardened concrete properties. A mix design has to be robust and allow for certain variations in grading or moisture, still ensuring sufficient workability over a certain period of time. However, all problems or imperfections which might occur when applying particle packing models to concrete mixes should not stop one from doing so. Even if the resulting mix does not exactly achieve the packing density the model predicted, this mix will still most likely be better or cheaper or possibly both than without having applied any packing model. Sometimes, nature already supplies the required materials perfectly graded. For many years, aggregates of glaciofluvial origin were used in concrete production in Sweden. These aggregates were sorted by nature when the inland ices melt. Sand from e.g. Underås was considered by the mixing plants using it, to give concrete with good workability and good strength. The grading of those aggregates is close to particle size distributions which will result in dense packing according to the modified Andreassen model, see Figure 7. So to speak, particle packing was applied without knowing it.
Figure 7: Particle size distribution of Underås 0-8 mm fine aggregate in the particle range that is actually tested by sieving (100 - 8000 μm), analysed with Software LISA. The PSD according to Andreassen with different distribution modules were calculated with the modified Andreassen model with a minimum grain size, see Dinger & Funk (1992, 1993, 1994).
0.1
1
10
100
100 1000 10000
Grain size [micrometer]
Vol
ume
[%]
Andreassen q=0,27
Andreassen q=0,37
Underas
Chapter 3 Theoretical background
19
3.2 Hydration
Cement stiffens and hardens as a result of the chemical reaction of clinker minerals and water. New, water insoluble products are formed and build up the structure of the hardened cement paste. The term hydration is commonly used to summarise the complex reactions occurring. In the early stage of hydration, the processes are rapid and strongly exothermic but hydration itself may go on for many years if the required conditions are met. Many properties of the hardened concrete depend on the hydration of the cement. Mechanical properties as well as durability are influenced. Many factors like cement composition, cement fineness, temperature, admixtures and additions influence the hydration process of cement.
3.2.1 Hydration of portland cement
Ordinary Portland Cement (OPC) is a technical product which is produced by burning a mixture of limestone and clay at over 1400°C in a kiln into cement clinker. The clinker is ground and mixed with calcium sulphates, usually gypsum, hemihydrate and/or anhydrite to give the technical product portland cement (Stark & Wicht, 1995). OPC, or more specifically, the main clinker phases C3S, C2S, C3A and C4AF react with water (hydration) in a complex chemical reaction, forming different hydrates. The topic of cement hydration has been investigated by many researchers for many years; see e.g. Taylor (1997), Lea (2000) and Stark & Wicht (1995). Despite all efforts, there is still no completely plausible and usable model available. The chemical impurity of the technical product OPC with a lot of different phases and impurities might be one reason (Stark & Wicht, 1995), difficulties finding suitable analysing methods another. The following short description of the hydration mechanism of OPC follows Stark & Wicht (1995). The hydration of OPC is a complex process, depending on the material properties and environmental parameters. Different precipitation reactions occur after the clinker minerals have been dissolved in water under heat release and an oversaturated solution is formed. Some phases, like calcium silicate hydrate (C-S-H), are growing on the surface of the clinker grains, while others like portlandite or ettringite (AFt) precipitate in the aqueous phase. The hydration process of OPC can be divided into five periods (Figure 8), similar to the hydration of its main constituent C3S.
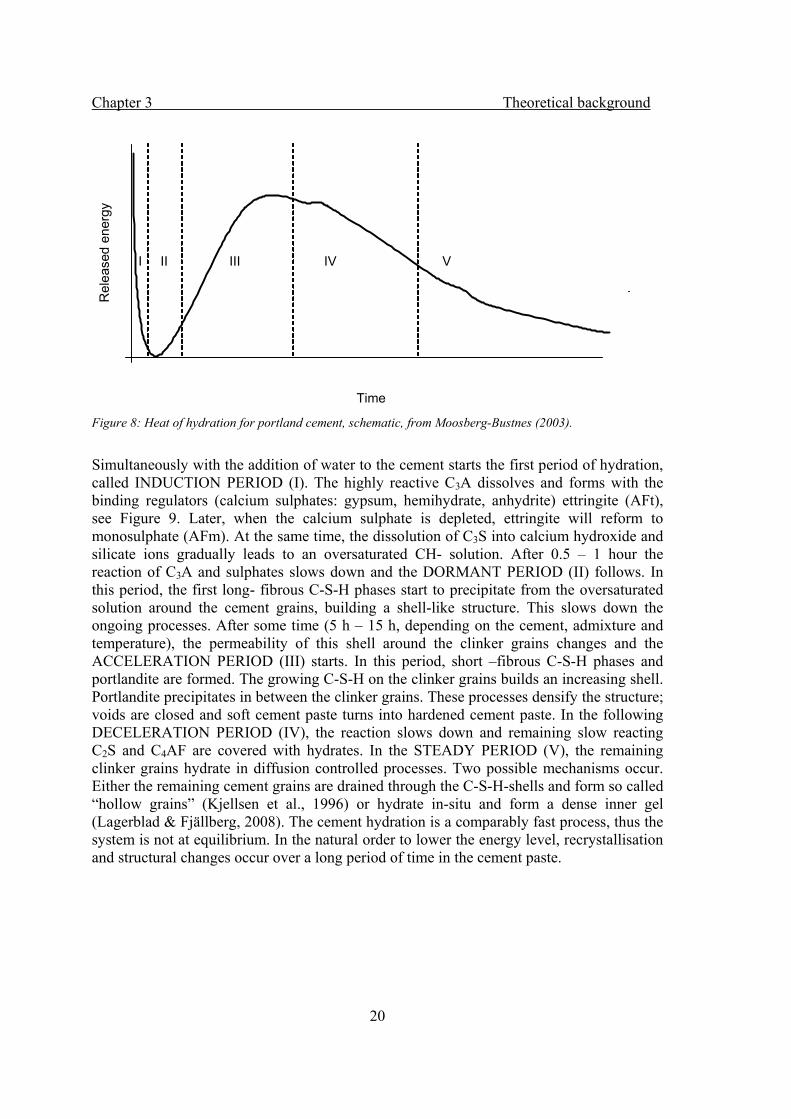
Chapter 3 Theoretical background
20
Figure 8: Heat of hydration for portland cement, schematic, from Moosberg-Bustnes (2003).
Simultaneously with the addition of water to the cement starts the first period of hydration, called INDUCTION PERIOD (I). The highly reactive C3A dissolves and forms with the binding regulators (calcium sulphates: gypsum, hemihydrate, anhydrite) ettringite (AFt), see Figure 9. Later, when the calcium sulphate is depleted, ettringite will reform to monosulphate (AFm). At the same time, the dissolution of C3S into calcium hydroxide and silicate ions gradually leads to an oversaturated CH- solution. After 0.5 – 1 hour the reaction of C3A and sulphates slows down and the DORMANT PERIOD (II) follows. In this period, the first long- fibrous C-S-H phases start to precipitate from the oversaturated solution around the cement grains, building a shell-like structure. This slows down the ongoing processes. After some time (5 h – 15 h, depending on the cement, admixture and temperature), the permeability of this shell around the clinker grains changes and the ACCELERATION PERIOD (III) starts. In this period, short –fibrous C-S-H phases and portlandite are formed. The growing C-S-H on the clinker grains builds an increasing shell. Portlandite precipitates in between the clinker grains. These processes densify the structure; voids are closed and soft cement paste turns into hardened cement paste. In the following DECELERATION PERIOD (IV), the reaction slows down and remaining slow reacting C2S and C4AF are covered with hydrates. In the STEADY PERIOD (V), the remaining clinker grains hydrate in diffusion controlled processes. Two possible mechanisms occur. Either the remaining cement grains are drained through the C-S-H-shells and form so called “hollow grains” (Kjellsen et al., 1996) or hydrate in-situ and form a dense inner gel (Lagerblad & Fjällberg, 2008). The cement hydration is a comparably fast process, thus the system is not at equilibrium. In the natural order to lower the energy level, recrystallisation and structural changes occur over a long period of time in the cement paste.
0,0
1,0
2,0
3,0
4,0
5,0
6,0
0,0 5,0 10,0 15,0 20,0 25,0 30,0Time
Rel
ease
d en
ergy
I II III IV V
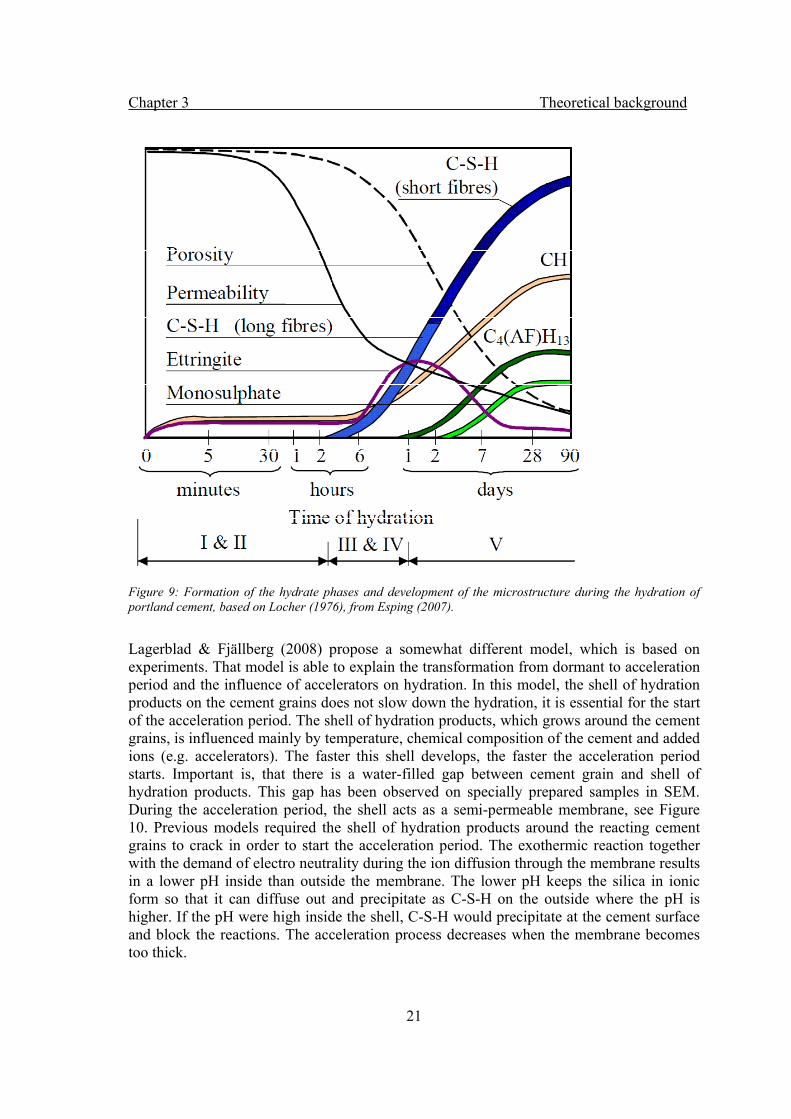
Chapter 3 Theoretical background
21
Figure 9: Formation of the hydrate phases and development of the microstructure during the hydration of portland cement, based on Locher (1976), from Esping (2007).
Lagerblad & Fjällberg (2008) propose a somewhat different model, which is based on experiments. That model is able to explain the transformation from dormant to acceleration period and the influence of accelerators on hydration. In this model, the shell of hydration products on the cement grains does not slow down the hydration, it is essential for the start of the acceleration period. The shell of hydration products, which grows around the cement grains, is influenced mainly by temperature, chemical composition of the cement and added ions (e.g. accelerators). The faster this shell develops, the faster the acceleration period starts. Important is, that there is a water-filled gap between cement grain and shell of hydration products. This gap has been observed on specially prepared samples in SEM. During the acceleration period, the shell acts as a semi-permeable membrane, see Figure 10. Previous models required the shell of hydration products around the reacting cement grains to crack in order to start the acceleration period. The exothermic reaction together with the demand of electro neutrality during the ion diffusion through the membrane results in a lower pH inside than outside the membrane. The lower pH keeps the silica in ionic form so that it can diffuse out and precipitate as C-S-H on the outside where the pH is higher. If the pH were high inside the shell, C-S-H would precipitate at the cement surface and block the reactions. The acceleration process decreases when the membrane becomes too thick.
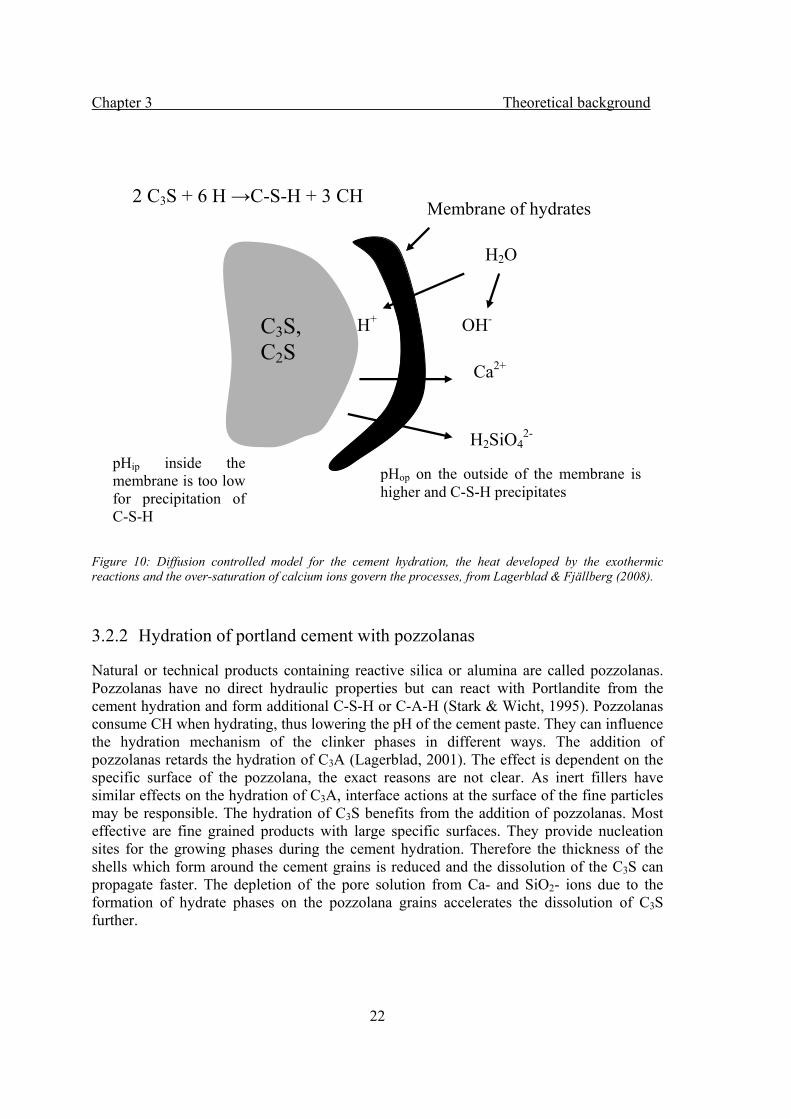
Chapter 3 Theoretical background
22
Figure 10: Diffusion controlled model for the cement hydration, the heat developed by the exothermic reactions and the over-saturation of calcium ions govern the processes, from Lagerblad & Fjällberg (2008).
3.2.2 Hydration of portland cement with pozzolanas
Natural or technical products containing reactive silica or alumina are called pozzolanas. Pozzolanas have no direct hydraulic properties but can react with Portlandite from the cement hydration and form additional C-S-H or C-A-H (Stark & Wicht, 1995). Pozzolanas consume CH when hydrating, thus lowering the pH of the cement paste. They can influence the hydration mechanism of the clinker phases in different ways. The addition of pozzolanas retards the hydration of C3A (Lagerblad, 2001). The effect is dependent on the specific surface of the pozzolana, the exact reasons are not clear. As inert fillers have similar effects on the hydration of C3A, interface actions at the surface of the fine particles may be responsible. The hydration of C3S benefits from the addition of pozzolanas. Most effective are fine grained products with large specific surfaces. They provide nucleation sites for the growing phases during the cement hydration. Therefore the thickness of the shells which form around the cement grains is reduced and the dissolution of the C3S can propagate faster. The depletion of the pore solution from Ca- and SiO2- ions due to the formation of hydrate phases on the pozzolana grains accelerates the dissolution of C3S further.
C3S, C2S
2 C3S + 6 H →C-S-H + 3 CH
H2SiO42-
Ca2+
pHop on the outside of the membrane is higher and C-S-H precipitates
pHip inside the membrane is too low for precipitation of C-S-H
H2O
H+ OH-
Membrane of hydrates
Chapter 3 Theoretical background
23
Depending on the chemistry of the pozzolana, there are different hydration mechanisms. Technical products like silica fume, metakaoline or flyash react in different ways with cement paste. The influence of recently developed pozzolanas of nano size like colloidal silica is not well researched yet; according to Lagerblad & Fjällberg (2008) do they have an accelerating effect on the cement hydration. Natural pozzolanas like fine ground volcanic rock compositions have a chemical composition comparable to low-lime flyash. Therefore, the reaction mechanism is similar to flyash, but the rate of reaction may differ greatly (Taylor, 1997). Silica fume is an extremely fine grained technical product and consists almost entirely of amorphous silica. It has a profound effect on cement hydration. In the early stage of hydration, the extremely fine particles act as nucleation site for hydration products, helping to refine the developing pore system. When the pH in the pore solution increases due to the progressing dissolution of clinker grains and CaO and alkalis are released and form hydroxides, the amorphous silica starts to go into solution. Silica ions are released and react primarily with CH, forming additional C-S-H.
Ca(OH)2 + SiO2 + H2O => C-S-H (1) (Eq. 14)
CH is often found in the vicinity of aggregate grains; therefore silica fume can improve the properties of the interfacial transition zone (ITZ) around the aggregates (Lagerblad & Kjellsen, 1999). The pozzolanic reaction consumes CH and alkalis are bound in the reaction products. That leads to a lower pH in the pore solution. Therefore, the amount of silica fume that can be added to concrete is limited in concrete standards (e.g. EN 206-1, 2001), in order to ensure the corrosion protection of the reinforcement. Depending on the type of cement, namely it’s content of CaO, about 15- 18 wt. % of cement need to be replaced by silica fume in order to eliminate all portlandite in the hardened concrete at equilibrium. Additional silica fume reacts with the C-S-H in the paste and gives C-S-H with lower calcium-silica-ratio.
C-S-H (1) + SiO2 => C-S-H (2) (Eq. 15) where C-S-H (2) has a lower CaO-SiO2 ratio than C-S-H (1). The chain length of the C-S-H increases with time and the cryptocrystalline C-S-H may even start to polymerise in order to lower the energy level (Lagerblad et al. 2004). That does not happen in concrete without high contents of silica fume due to the stabilisation of the silicate chains by CH. Metakaolin is a technical product which consists of kaolin clay, calcinated at 500-800°C. In this dehydroxylated form, the aluminosilicates of the clay are amorphous and highly pozzolanic. The reaction mechanism of metakaolin is similar to that of silica fume, except that mostly calcium aluminate hydrate phases (C-A-H) are formed. Metakaolin reacts somewhat slower than silica fume, but due to the high reactivity and fine particle size, it still participates in the early hydration reactions (Taylor, 1997).
Chapter 3 Theoretical background
24
Flyash is a technical product, separated from the flue gas of an energy power station burning coal. In Europe, mostly low-lime flyash, consisting mainly of SiO2, Al2O3 and Fe2O3 with high glass content, is used in concrete production. The pozzolanic activity of flyash depends to a large extent on the glass content. When mixed with OPC and water, the high pH leads to an attack on the Si-O-Si bond in the flyash, giving reactive silica (Stark & Wicht, 1995). Not only is the chemical composition of a flyash but also its particle size distribution of major importance for its influence on cement hydration. Mostly flyash particles smaller than 10 µm take part in the hydration processes and may accelerate the reaction of C3S. Larger grains act as filler. The reaction mechanism of flyash is described in the literature, see e.g. Taylor (1997), Lea (2000), Stark & Wicht (1995). The speed of the reaction is strongly dependent on temperature and in general much slower than for silica fume or metakaolin.
3.2.3 Hydration of portland cement with fillers
Minerals without pozzolanic or latent hydraulic properties can influence the hydration process of OPC as well. These inert additions influence the cement hydration mainly due to physical effects. Those physical effects are often summarised as filler effect. The large surface area of filler materials acts as nucleation sites for hydration products, increasing the speed of hydration. As a result, the fine grained filler materials end up covered with hydration products and become an integrated part of the cement paste. In case of limestone and quartz, also chemical reactions between the pore solution and the addition take place, at least at the surface of the grains. The exact mechanism that leads to changes in the hydration kinetics of OPC in the presence of fine filler particles is much discussed. Experiments on water-mineral systems showed complex processes on the surfaces of the minerals. According to Hochella (1990), the reactivity of a minerals surface is depending on its chemical composition, atomic structure and morphology at micro level. Fractured surfaces may provide minerals with loose bindings. Those atoms may contribute actively to the formation of new bindings (Kjellsen & Lagerblad, 1994). Similar processes may occur in a water- filler- cement system; the reactions become even more complex due to the hydration of the cement. Basically, the cement hydration is controlled by nucleation and precipitation of hydrated phases, interaction and diffusion through already hydrated phases. In the early stages of the hydration, the speed is determined by the nucleation and precipitation processes (Kjellsen & Lagerblad, 1994). Fine grained minerals provide nucleation sites for hydration products, thus the cement hydration can be accelerated by adding fillers. Limestone as filler material is widely used. The effect of limestone on cement hydration is partly physical (basic mechanism described above) and partly chemical (Taylor, 1997). During cement hydration, monocarbonate will form with the clinker phases. About 2- 3 % of CaCO3 may react, depending on the type of cement. Ye et al. (2006) developed a numerical model for heat of hydration of self-compacting concrete; the contribution of limestone filler is included. Kjellsen & Lagerblad (1995) measured the heat release of cement pastes with different limestone fillers and amounts. Clearly, the finer the limestone and the higher the content of limestone in the paste, the earlier the acceleration period
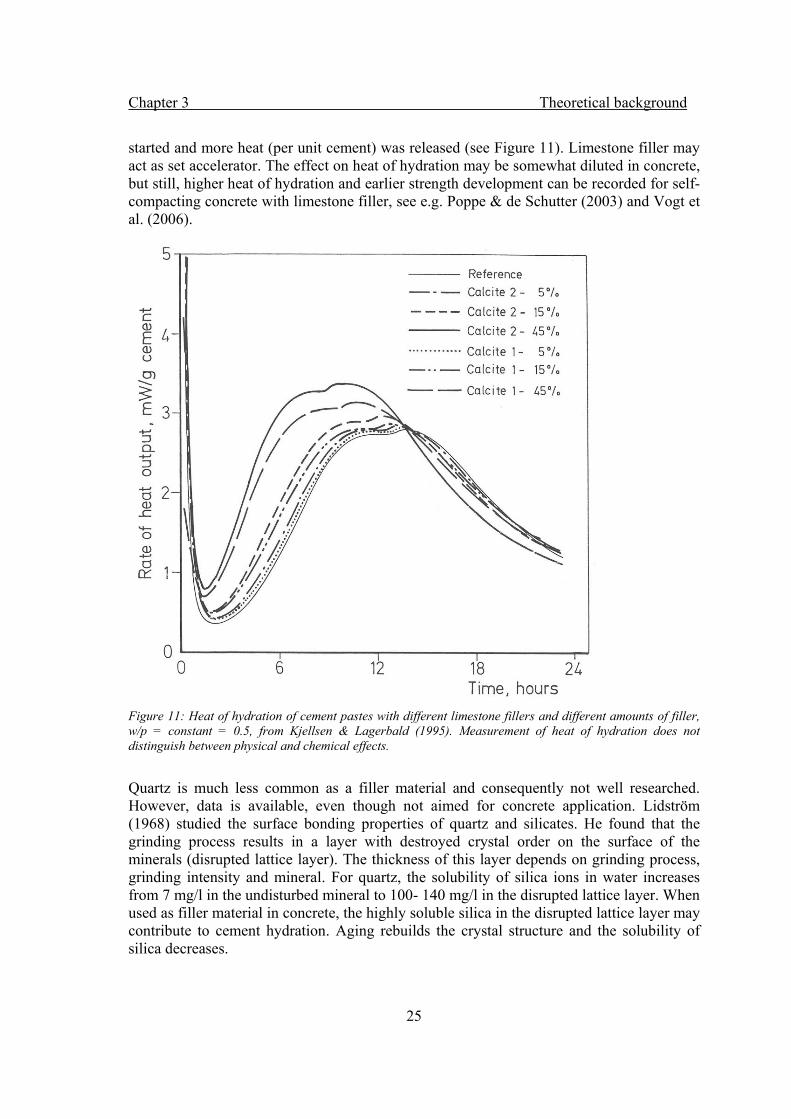
Chapter 3 Theoretical background
25
started and more heat (per unit cement) was released (see Figure 11). Limestone filler may act as set accelerator. The effect on heat of hydration may be somewhat diluted in concrete, but still, higher heat of hydration and earlier strength development can be recorded for self-compacting concrete with limestone filler, see e.g. Poppe & de Schutter (2003) and Vogt et al. (2006).
Figure 11: Heat of hydration of cement pastes with different limestone fillers and different amounts of filler, w/p = constant = 0.5, from Kjellsen & Lagerbald (1995). Measurement of heat of hydration does not distinguish between physical and chemical effects.
Quartz is much less common as a filler material and consequently not well researched. However, data is available, even though not aimed for concrete application. Lidström (1968) studied the surface bonding properties of quartz and silicates. He found that the grinding process results in a layer with destroyed crystal order on the surface of the minerals (disrupted lattice layer). The thickness of this layer depends on grinding process, grinding intensity and mineral. For quartz, the solubility of silica ions in water increases from 7 mg/l in the undisturbed mineral to 100- 140 mg/l in the disrupted lattice layer. When used as filler material in concrete, the highly soluble silica in the disrupted lattice layer may contribute to cement hydration. Aging rebuilds the crystal structure and the solubility of silica decreases.

Chapter 3 Theoretical background
26
3.2.4 Pozzolanic activity
The pozzolanic activity of a material measures the ability to react with calcium hydroxide and depends on the content of reactive silica or alumina, the grain size and the state of the material (glass content, metastability). The addition of a fine grained material to concrete may influence hydration of the cement, packing and structure of the paste. Different concrete properties may be influenced in different ways. A material which may contribute positively to concrete strength may in turn be negative in terms of frost resistance or carbonation. Actual concrete standards summarise all physical and chemical influences of pozzolanic materials in efficiency factors, called k values. These k values represent the amount of pozzolanic material which is taken into account in the calculation of an effective water-cement ratio. The k values are determined experimentally and the resulting figure does not distinguish between physical or chemical effects. In EN 206-1 the k values for silica fume and flyash are regulated. The values in the standards are rather conservative, experimentally usually higher values are determined (Papadakis & Tsimas, 2002 amongst others). A practical way of determining k values for pozzolanic materials from compressive strength testing is presented by Papadakis & Tsimas (2002). They use an empirical relationship, presented by Bolomey (1926), between water-cement ratio and compressive strength:
⎟⎠⎞
⎜⎝⎛ −= a
CWKfC /
1 (Eq. 16)
with fC = compressive strength, K = parameter dependent on the cement used, W = water content, C = cement content, a = parameter dependent on time and type of curing. First, the parameter K is determined with the help of reference mixes with different w/c for different times tested. Using the same reference mixes, the parameter a can be determined. Both parameters are different for each tested concrete age. If a concrete contains pozzolanic material, (Eq. 16) can be modified in the following way:
⎟⎟⎠
⎞⎜⎜⎝
⎛−
⋅+= a
PkZWKfC )/(
1 (Eq. 17)
with k = activity factor of the pozzolanic material, P = content of pozzolanic material. Using (Eq. 17) and parameters K and a, the activity factor k can be determined. This activity factor is purely compressive strength related, properties like frost resistance, chloride diffusion or carbonation are not considered.
Chapter 3 Theoretical background
27
3.3 Load independent deformation
Most load independent deformations of a porous body are linked to the loss or uptake of water, resulting in contraction or expansion. In cementitious materials, additional deformations may be caused by chemical reactions (hydration, carbonation, phase changes, alkali silica reaction, delayed ettringite formation and others). Due to heat of hydration, thermal expansion will occur, followed by contraction when the concrete cools down. Volume reduction of concrete is usually denoted shrinkage. From a practical point of view, expansion of concrete due to water uptake can be neglected, while restrained shrinkage can result in severe cracking. Note that there are deteriorating expansive reactions like alkali silica reaction or delayed ettringite formation but these can usually be avoided using appropriate materials and good concrete technology. However, shrinkage is more difficult to control (Röhling et al., 2000). Since concrete is changing from liquid to hardened state and different deformations occur at different points of time, it is convenient to divide the load independent deformations into early-age and long-term deformations. Following Esping (2007), the first 24 hours after mixing are considered early-age and the time beyond long-term within the context of this work. Volume reduction (or shrinkage) of a cementitious material will start immediately after mixing with water due to chemical reactions and evaporation of water. As long as the concrete is liquid, this volumetric change will usually result in vertical displacement (settlement). No stresses are developed within the material. As soon as the concrete sets, most volume changes are hindered by the developing structure and stresses result from contraction. The deformations due to chemical reactions develop rather early, to a large extent within the first 24 hours after casting. In the hardened concrete that is exposed to lower relative humidity (RH) than the RH in the capillary pore system, evaporating water from the capillary pore system will result in drying shrinkage. The exact mechanism responsible for the contraction of the concrete in autogenous and drying shrinkage is disputed (Taylor, 1997; Aïtcin, 1999). Clear is, that in both cases menisci are created within the gradually water-drained pore system, which leads to tensile forces and consequently to contraction of the rigid body. Capillary tension, surface tension, disjoining pressure and interlayer water removal are discussed mechanisms, most likely in combination (Lura, 2003). According to Taylor (1997), more than one mechanism probably operates and the dominant mechanism may be dependent on the RH. Capillary tension in the pore fluid of concrete develops due to drying and is a mechanism responsible for shrinkage of concrete (Wittmann, 1976). Menisci are formed in the pore structure when concrete dries. The fluid pressure is lower on the convex side of a meniscus than on the concave side. Therefore the creation of water- air menisci results in a negative pressure in the pore water. This negative pressure contracts the cement paste. The smaller the radius of a meniscus, the higher the contracting force. Therefore, capillary tension increases with decreasing pore size and interparticle space. According to Lura (2003), capillary tension is an effective mechanism above 45 % RH in the concrete.
Chapter 3 Theoretical background
28
Surface tension as an influencing factor on shrinkage was described by e.g. Wittmann (1968). Water molecules adsorb on the surface of the cement gel. When water is removed due to drying, the surface tension of the cement gel increases and shrinkage occurs. According to Lura (2003), the surface tension mechanism is limited to RH below 75 % as only the first three adsorbed water layers can influence the solids surface tension. Disjoining pressure (Ferraris & Wittmann, 1987) is a result of van der Waals forces, double layer repulsion and structural forces. It is active in areas of hindered adsorption. Such areas are e.g. particles which are situated very close to each other. When the RH in concrete is reduced and the distance between particles is smaller than two times the thickness of the adsorbed free water layer, the disjoining pressure is activated and results in volume reduction. Removal of interlayer water can result in shrinkage. The C-S-H gel consists of sheet-like structures with adsorbed water layers (Taylor, 1997). When concrete dries, the physically bound water between C-S-H sheets is removed and the volume is reduced. This results in shrinkage of the paste. In traditional concretes with relatively large content of aggregates, low content of fines and high water-cement ratios, the early-age deformations can be neglected compared to drying shrinkage (Aïtcin, 1999). Modern types of concrete like self-compacting concrete or high strength concrete with high content of fines, incorporation of silica fume, high binder content and low w/c have considerably higher early-age deformations.
3.3.1 Chemical and autogenous shrinkage
There are a lot of different terms in the literature concerning chemical and autogenous shrinkage, describing the same mechanisms. RILEM TC 181 EAS (RILEM 2002) defines chemical and autogenous shrinkage as follows:
Chemical shrinkage is the internal-microscopic volume reduction which results from the fact that the absolute volume of the hydration products is smaller than that of the reacting constituents. It is roughly proportional to the degree of hydration beyond the very early stage. Autogenous shrinkage is the external-macroscopic dimensional reduction of the cementitious system which occurs under isothermal conditions without exchange of moisture or any other substance with the surroundings. Autogenous shrinkage is usually driven by chemical shrinkage and the magnitudes of the two are roughly equal as long as the paste matrix is fluid-like. The autogenous shrinkage becomes smaller than the chemical shrinkage when the paste matrix has developed a self-supporting skeleton and the difference between them is manifested as internal contraction pores. The reduction of the internal relative humidity in a sealed system when the contraction pores are emptied from water is called self-desiccation. Figure 12 illustrates the principal relationship between chemical shrinkage and autogenous shrinkage.
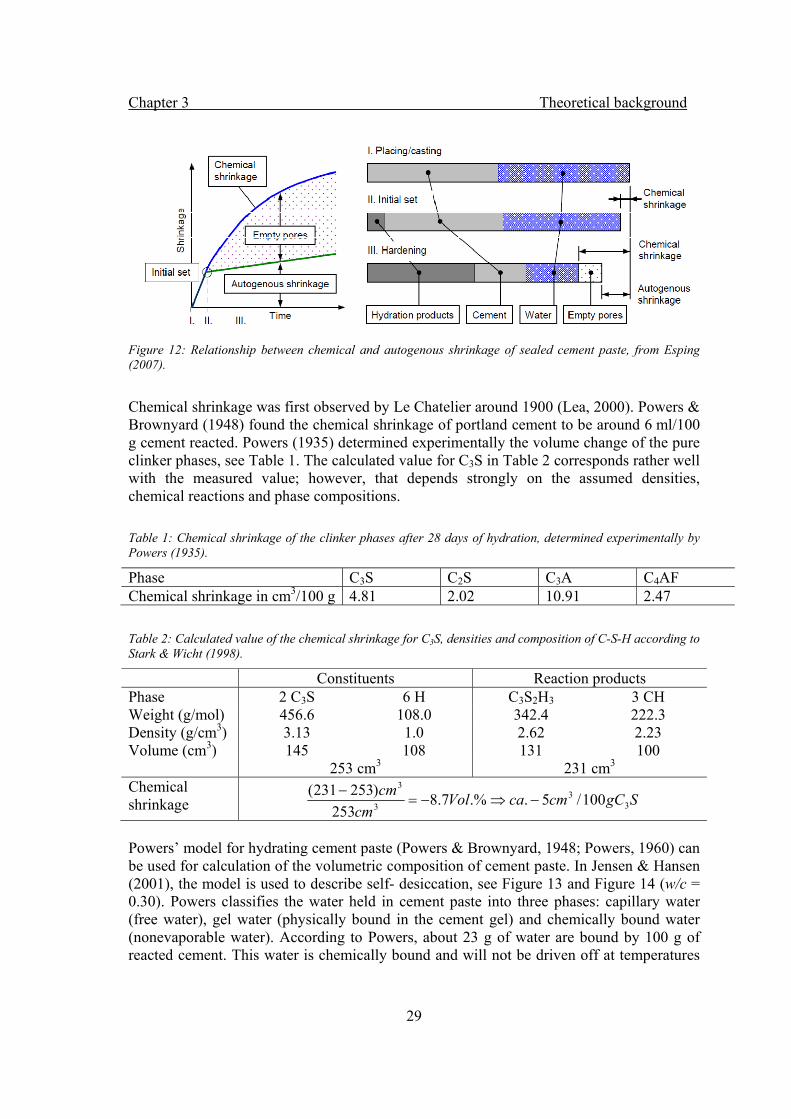
Chapter 3 Theoretical background
29
Figure 12: Relationship between chemical and autogenous shrinkage of sealed cement paste, from Esping (2007).
Chemical shrinkage was first observed by Le Chatelier around 1900 (Lea, 2000). Powers & Brownyard (1948) found the chemical shrinkage of portland cement to be around 6 ml/100 g cement reacted. Powers (1935) determined experimentally the volume change of the pure clinker phases, see Table 1. The calculated value for C3S in Table 2 corresponds rather well with the measured value; however, that depends strongly on the assumed densities, chemical reactions and phase compositions. Table 1: Chemical shrinkage of the clinker phases after 28 days of hydration, determined experimentally by Powers (1935).
Phase C3S C2S C3A C4AF Chemical shrinkage in cm3/100 g 4.81 2.02 10.91 2.47 Table 2: Calculated value of the chemical shrinkage for C3S, densities and composition of C-S-H according to Stark & Wicht (1998).
Constituents Reaction products Phase 2 C3S 6 H C3S2H3 3 CH Weight (g/mol) 456.6 108.0 342.4 222.3 Density (g/cm3) 3.13 1.0 2.62 2.23 Volume (cm3) 145 108 131 100 253 cm3 231 cm3 Chemical shrinkage SgCcmcaVol
cmcm
33
3
3
100/5..%7.8253
)253231(−⇒−=
−
Powers’ model for hydrating cement paste (Powers & Brownyard, 1948; Powers, 1960) can be used for calculation of the volumetric composition of cement paste. In Jensen & Hansen (2001), the model is used to describe self- desiccation, see Figure 13 and Figure 14 (w/c = 0.30). Powers classifies the water held in cement paste into three phases: capillary water (free water), gel water (physically bound in the cement gel) and chemically bound water (nonevaporable water). According to Powers, about 23 g of water are bound by 100 g of reacted cement. This water is chemically bound and will not be driven off at temperatures
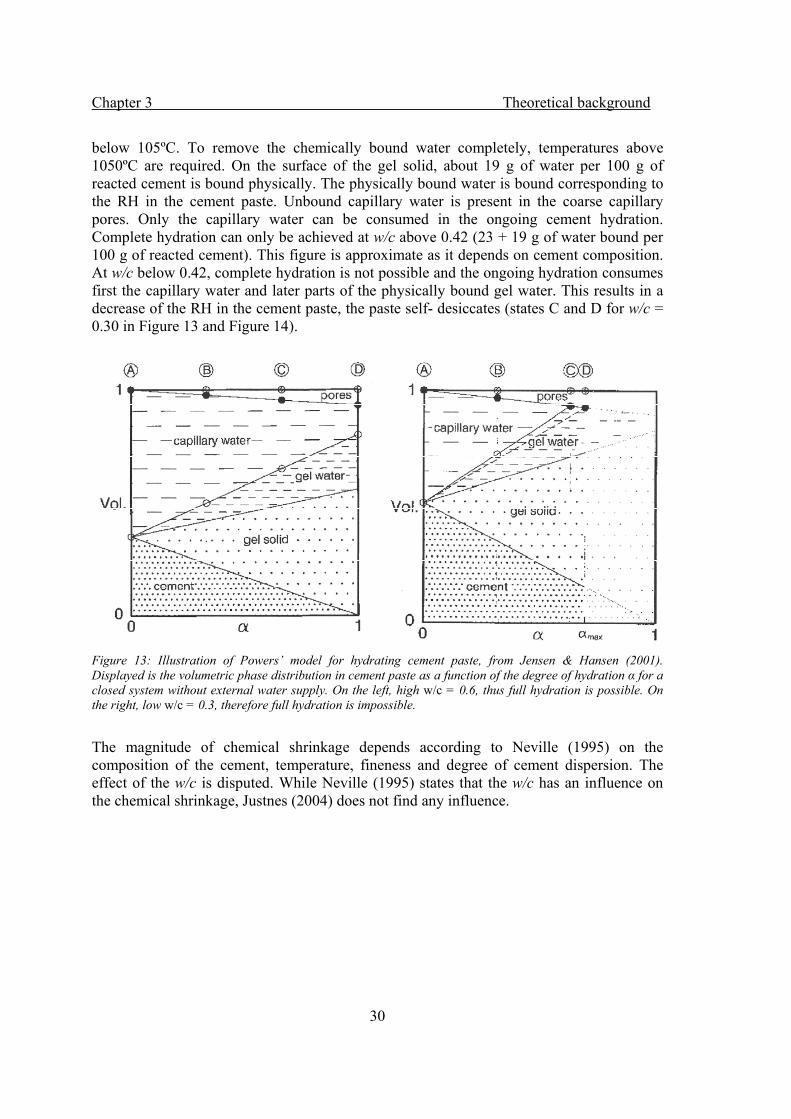
Chapter 3 Theoretical background
30
below 105ºC. To remove the chemically bound water completely, temperatures above 1050ºC are required. On the surface of the gel solid, about 19 g of water per 100 g of reacted cement is bound physically. The physically bound water is bound corresponding to the RH in the cement paste. Unbound capillary water is present in the coarse capillary pores. Only the capillary water can be consumed in the ongoing cement hydration. Complete hydration can only be achieved at w/c above 0.42 (23 + 19 g of water bound per 100 g of reacted cement). This figure is approximate as it depends on cement composition. At w/c below 0.42, complete hydration is not possible and the ongoing hydration consumes first the capillary water and later parts of the physically bound gel water. This results in a decrease of the RH in the cement paste, the paste self- desiccates (states C and D for w/c = 0.30 in Figure 13 and Figure 14).
Figure 13: Illustration of Powers’ model for hydrating cement paste, from Jensen & Hansen (2001). Displayed is the volumetric phase distribution in cement paste as a function of the degree of hydration α for a closed system without external water supply. On the left, high w/c = 0.6, thus full hydration is possible. On the right, low w/c = 0.3, therefore full hydration is impossible.
The magnitude of chemical shrinkage depends according to Neville (1995) on the composition of the cement, temperature, fineness and degree of cement dispersion. The effect of the w/c is disputed. While Neville (1995) states that the w/c has an influence on the chemical shrinkage, Justnes (2004) does not find any influence.
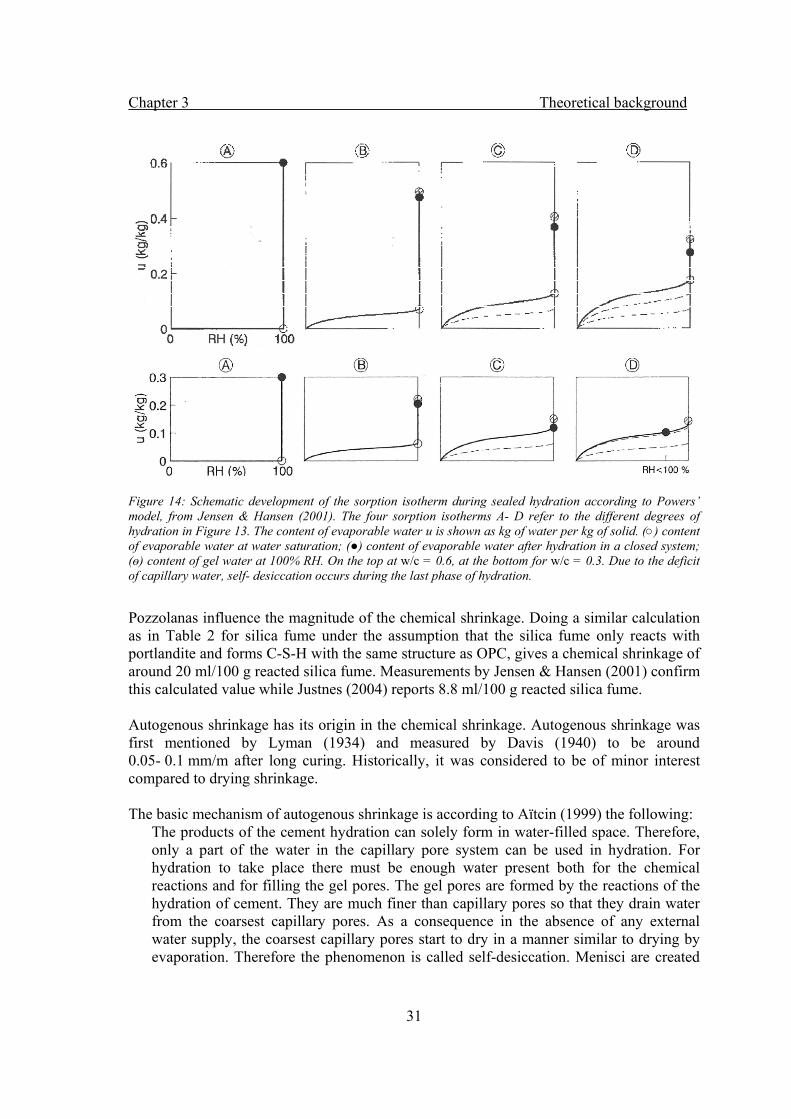
Chapter 3 Theoretical background
31
Figure 14: Schematic development of the sorption isotherm during sealed hydration according to Powers’ model, from Jensen & Hansen (2001). The four sorption isotherms A- D refer to the different degrees of hydration in Figure 13. The content of evaporable water u is shown as kg of water per kg of solid. (○) content of evaporable water at water saturation; (●) content of evaporable water after hydration in a closed system; (ө) content of gel water at 100% RH. On the top at w/c = 0.6, at the bottom for w/c = 0.3. Due to the deficit of capillary water, self- desiccation occurs during the last phase of hydration.
Pozzolanas influence the magnitude of the chemical shrinkage. Doing a similar calculation as in Table 2 for silica fume under the assumption that the silica fume only reacts with portlandite and forms C-S-H with the same structure as OPC, gives a chemical shrinkage of around 20 ml/100 g reacted silica fume. Measurements by Jensen & Hansen (2001) confirm this calculated value while Justnes (2004) reports 8.8 ml/100 g reacted silica fume. Autogenous shrinkage has its origin in the chemical shrinkage. Autogenous shrinkage was first mentioned by Lyman (1934) and measured by Davis (1940) to be around 0.05- 0.1 mm/m after long curing. Historically, it was considered to be of minor interest compared to drying shrinkage. The basic mechanism of autogenous shrinkage is according to Aïtcin (1999) the following:
The products of the cement hydration can solely form in water-filled space. Therefore, only a part of the water in the capillary pore system can be used in hydration. For hydration to take place there must be enough water present both for the chemical reactions and for filling the gel pores. The gel pores are formed by the reactions of the hydration of cement. They are much finer than capillary pores so that they drain water from the coarsest capillary pores. As a consequence in the absence of any external water supply, the coarsest capillary pores start to dry in a manner similar to drying by evaporation. Therefore the phenomenon is called self-desiccation. Menisci are created

Chapter 3 Theoretical background
32
within the capillary pores, resulting in tensile forces. Autogenous shrinkage occurs without mass loss, isotropically within the concrete without developing humidity gradients.
The magnitude of autogenous shrinkage reported in the literature differs greatly (Esping, 2007), most likely due to difficulties in measuring techniques and unclear definitions (Justnes, 2004). According to Röhling et al. (2000), the autogenous shrinkage is increased by high binder content, low w/c, low content of coarse aggregate, silica fume and admixtures with retarding effect. Accelerating admixtures, shrinkage reducing admixtures, internal curing by means of light weight aggregates (LWA) or superabsorbent polymers and, to a certain degree, external water supply reduce the autogenous shrinkage. Figure 15 shows the influence of different measures on the magnitude of autogenous shrinkage.
Figure 15: Effect of (a) w/c, (b) silica, (c) content of coarse aggregate of total aggregate, (d) superplasticizer dosage, (e) shrinkage-reducing admixture, and (f) accelerating and retarding admixtures on the autogenous shrinkage of self-compacting concrete, from Esping (2007).
Chapter 3 Theoretical background
33
3.3.2 Plastic shrinkage
Plastic shrinkage is defined as the deformation that takes place in fresh concrete that is exposed to drying prior to setting (Neville, 1995). The process usually stops when the concrete has reached its final set. If the rate of water evaporation is high (concreting in summer at high temperature or in winter at low RH), cracking can occur in restraint situations due to the low strain capacity of the plastic concrete (Neville, 1995). In traditional concretes, protection from drying and/or addition of water usually helps to avoid plastic shrinkage cracks (Betonghandbok, 1994, Röhling et al., 2000). Modern concrete compositions may crack even when water is added due to combination of plastic shrinkage, autogenous shrinkage and thermal expansion (Esping, 2007).
3.3.3 Drying shrinkage
The difference in relative humidity between concrete and its environment will result in drying shrinkage of the concrete if the surrounding RH is lower than the RH in the capillary pores of the concrete and consequently the concrete looses water. According to Röhling et al. (2000), the term shrinkage is commonly used for drying shrinkage of hardened concrete exposed to air with a low relative humidity. The driving force is the evaporation of unbound water from the capillary pores and creation of menisci. The actual mechanism responsible for the volume reduction is disputed (see section 3.3), but includes capillary tension, surface tension, disjoining pressure and interlayer water removal, ultimately resulting in tensile forces contracting the concrete. The forces restraining the water in the concrete are inversely proportional to the diameter of the pores; therefore the speed of the drying process (and drying shrinkage) is decreasing with time. Drying shrinkage starts at the surface of the concrete which is exposed to dry air and progresses towards the core of the element. In that way, differential shrinkage develops between surface and core of a concrete element exposed to drying. (Aïtcin, 1999) The porosity of the concrete and the characteristics of the pore network such as size, shape and continuity of the pores influence the speed of the drying process. Drying shrinkage occurs with mass loss, developing humidity gradients. The magnitude of the drying shrinkage of cement paste and consequently of concrete depends strongly on the initial water content of the concrete, see Figure 16.
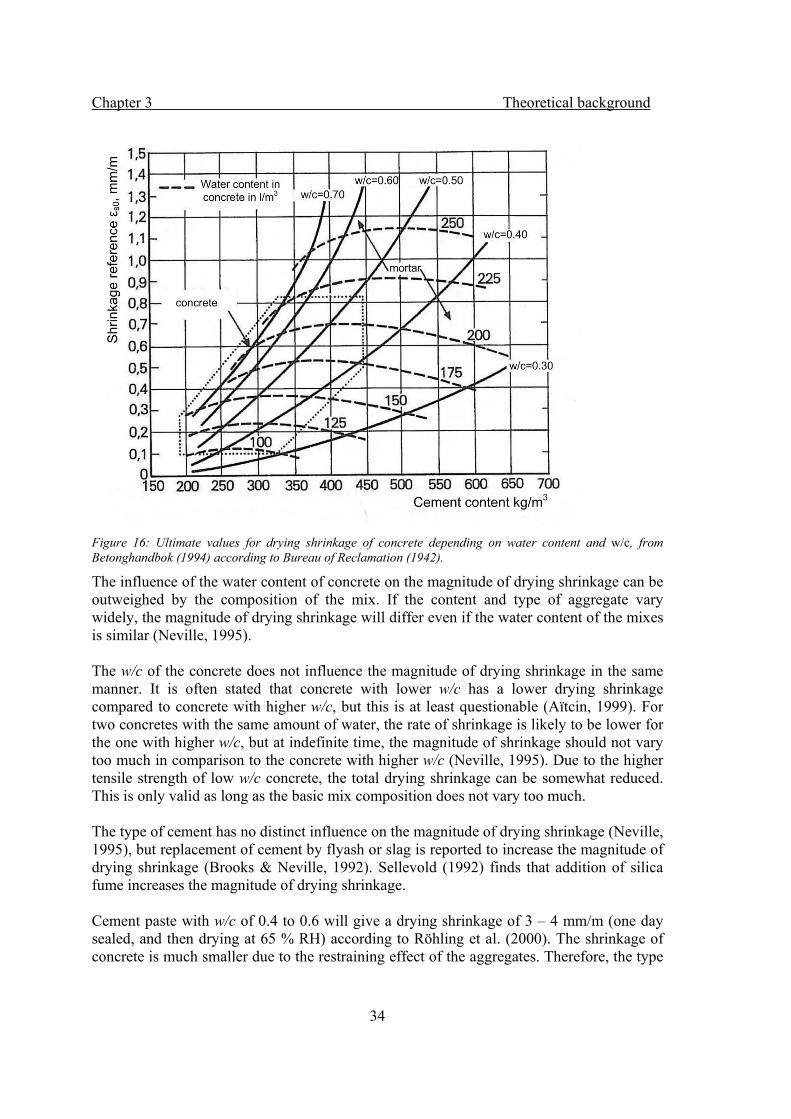
Chapter 3 Theoretical background
34
Figure 16: Ultimate values for drying shrinkage of concrete depending on water content and w/c, from Betonghandbok (1994) according to Bureau of Reclamation (1942).
The influence of the water content of concrete on the magnitude of drying shrinkage can be outweighed by the composition of the mix. If the content and type of aggregate vary widely, the magnitude of drying shrinkage will differ even if the water content of the mixes is similar (Neville, 1995). The w/c of the concrete does not influence the magnitude of drying shrinkage in the same manner. It is often stated that concrete with lower w/c has a lower drying shrinkage compared to concrete with higher w/c, but this is at least questionable (Aïtcin, 1999). For two concretes with the same amount of water, the rate of shrinkage is likely to be lower for the one with higher w/c, but at indefinite time, the magnitude of shrinkage should not vary too much in comparison to the concrete with higher w/c (Neville, 1995). Due to the higher tensile strength of low w/c concrete, the total drying shrinkage can be somewhat reduced. This is only valid as long as the basic mix composition does not vary too much. The type of cement has no distinct influence on the magnitude of drying shrinkage (Neville, 1995), but replacement of cement by flyash or slag is reported to increase the magnitude of drying shrinkage (Brooks & Neville, 1992). Sellevold (1992) finds that addition of silica fume increases the magnitude of drying shrinkage. Cement paste with w/c of 0.4 to 0.6 will give a drying shrinkage of 3 – 4 mm/m (one day sealed, and then drying at 65 % RH) according to Röhling et al. (2000). The shrinkage of concrete is much smaller due to the restraining effect of the aggregates. Therefore, the type
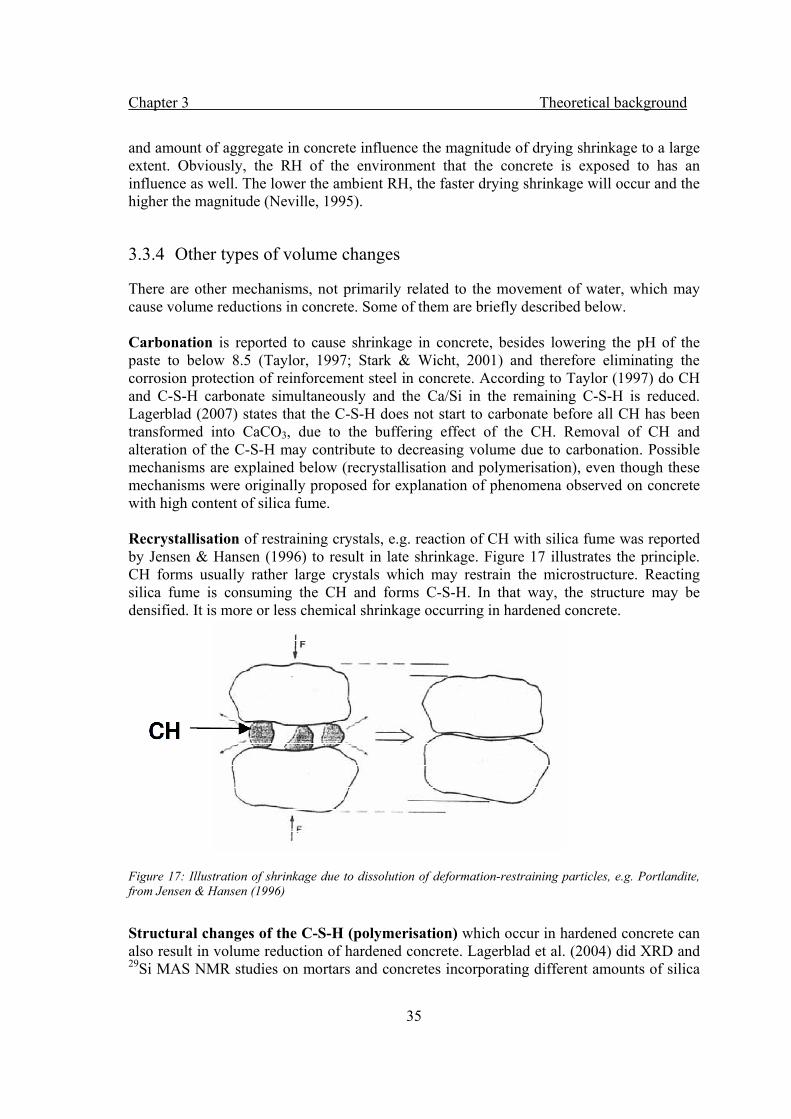
Chapter 3 Theoretical background
35
and amount of aggregate in concrete influence the magnitude of drying shrinkage to a large extent. Obviously, the RH of the environment that the concrete is exposed to has an influence as well. The lower the ambient RH, the faster drying shrinkage will occur and the higher the magnitude (Neville, 1995).
3.3.4 Other types of volume changes
There are other mechanisms, not primarily related to the movement of water, which may cause volume reductions in concrete. Some of them are briefly described below. Carbonation is reported to cause shrinkage in concrete, besides lowering the pH of the paste to below 8.5 (Taylor, 1997; Stark & Wicht, 2001) and therefore eliminating the corrosion protection of reinforcement steel in concrete. According to Taylor (1997) do CH and C-S-H carbonate simultaneously and the Ca/Si in the remaining C-S-H is reduced. Lagerblad (2007) states that the C-S-H does not start to carbonate before all CH has been transformed into CaCO3, due to the buffering effect of the CH. Removal of CH and alteration of the C-S-H may contribute to decreasing volume due to carbonation. Possible mechanisms are explained below (recrystallisation and polymerisation), even though these mechanisms were originally proposed for explanation of phenomena observed on concrete with high content of silica fume. Recrystallisation of restraining crystals, e.g. reaction of CH with silica fume was reported by Jensen & Hansen (1996) to result in late shrinkage. Figure 17 illustrates the principle. CH forms usually rather large crystals which may restrain the microstructure. Reacting silica fume is consuming the CH and forms C-S-H. In that way, the structure may be densified. It is more or less chemical shrinkage occurring in hardened concrete.
Figure 17: Illustration of shrinkage due to dissolution of deformation-restraining particles, e.g. Portlandite, from Jensen & Hansen (1996)
Structural changes of the C-S-H (polymerisation) which occur in hardened concrete can also result in volume reduction of hardened concrete. Lagerblad et al. (2004) did XRD and 29Si MAS NMR studies on mortars and concretes incorporating different amounts of silica
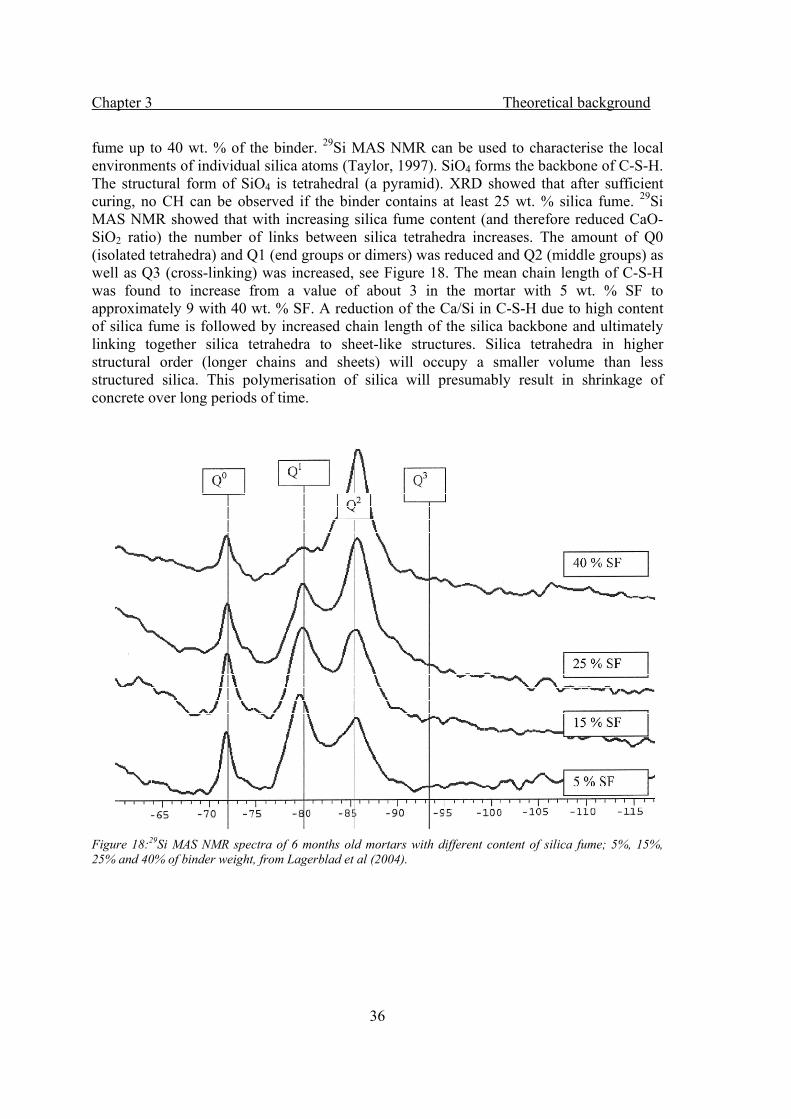
Chapter 3 Theoretical background
36
fume up to 40 wt. % of the binder. 29Si MAS NMR can be used to characterise the local environments of individual silica atoms (Taylor, 1997). SiO4 forms the backbone of C-S-H. The structural form of SiO4 is tetrahedral (a pyramid). XRD showed that after sufficient curing, no CH can be observed if the binder contains at least 25 wt. % silica fume. 29Si MAS NMR showed that with increasing silica fume content (and therefore reduced CaO-SiO2 ratio) the number of links between silica tetrahedra increases. The amount of Q0 (isolated tetrahedra) and Q1 (end groups or dimers) was reduced and Q2 (middle groups) as well as Q3 (cross-linking) was increased, see Figure 18. The mean chain length of C-S-H was found to increase from a value of about 3 in the mortar with 5 wt. % SF to approximately 9 with 40 wt. % SF. A reduction of the Ca/Si in C-S-H due to high content of silica fume is followed by increased chain length of the silica backbone and ultimately linking together silica tetrahedra to sheet-like structures. Silica tetrahedra in higher structural order (longer chains and sheets) will occupy a smaller volume than less structured silica. This polymerisation of silica will presumably result in shrinkage of concrete over long periods of time.
Figure 18:29Si MAS NMR spectra of 6 months old mortars with different content of silica fume; 5%, 15%, 25% and 40% of binder weight, from Lagerblad et al (2004).
Chapter 3 Theoretical background
37
3.4 Strength of concrete
3.4.1 General
Mechanical properties of concrete like compressive strength, tensile strength, flexural strength and E-modulus are of essential importance for the structural performance of a concrete element. The primary load bearing function of concrete in general is in compression. The compressive strength is approximately 10 times the tensile strength for conventional concrete (Betonghandbok, 1994). Due to the brittle behaviour of the heterogeneous material concrete in tension, structural concrete requires reinforcement of some kind in order to bear tensile load (Röhling et al. 2000). Commonly, the compressive strength is used to describe or relate many material parameters to, because it is essential for the structural performance and it is easily tested. Compressive strength of concrete depends to a large extend on the porosity of the concrete. Porosity in turn is strongly connected to the water-binder ratio of the concrete (Neville, 1995). Any measures which result in a lower water-binder ratio of the concrete usually also result in higher compressive strength. Other contributing factors are strength and type of cement and aggregate, curing time and conditions, additions and concrete composition in general.
3.4.2 High strength and ultra high performance concrete
High-strength concrete can be generally understood as concrete with compressive strength higher than the majority of the concrete used in production. This implies that the term high-strength concrete has different meanings at different times and in different countries. 100 years ago, concrete with compressive strength of more than 30 MPa was considered to be high-strength concrete. Nowadays, concrete with more than 80 MPa in compressive strength is usually denoted high-strength concrete (Betonghandbok, 1994). The requirement of concrete with higher compressive strength for concrete structures with reduced cross-sections for e.g. high rise buildings drove the development of high-strength concrete. In the beginning, the focus was mainly on compressive strength. However, due to the composition of high-strength concrete with its lower porosity, other positive properties like increased durability and reduced creep were achieved. As drawbacks have to be mentioned increased brittleness, higher heat development combined with high autogenous shrinkage and therefore higher crack risk and reduced resistance to spalling at fire (Neville, 1995). The basic principles for producing high-strength concrete are an increased binder content, low w/b, increased content of superplasticizer, and additions of silica fume and/or flyash. Generally speaking, the three constituent system in traditional concrete (cement, aggregates and water) is changed into a five constituent system (cement, additives, admixtures, aggregates and water). This results in a denser paste structure with reduced porosity and reduced thickness of the ITZ around the aggregates. The reduced porosity of the paste itself results in higher concrete strength, but it is to a large extent the better bond between aggregate and paste that gives the strength increase (Röhling et al., 2000).

Chapter 3 Theoretical background
38
There are several concepts, briefly described in the following, which aim to improve the properties of cement based materials and may result in mechanical properties usually reserved for metals or ceramics. Macro-defect free cements (MDF) were first described by Birchall et al. (1981). A composition of cement (OPC or calcium aluminate), high amounts of water-soluble polymers (polyacrylamide, polyvinylacetate, hydroxypropylmethyl cellulose and others) and a limited amount of water is mixed in a high shear mixer. The resulting mixture is extremely viscous but can be processed using conventional plastics technology. The processes that occur during hardening of the mixture differ from the hydration of conventional cementitious products. In the beginning of the hardening process, the polymer chains attach to the cement grains. In the following, hydration products grow on and through the polymer chains. As hydration proceeds, the limited water supply is depleted and the polymers dehydrate. As a consequence, the polymers exert contraction forces on the system and the whole body shrinks. The contraction is strong enough to reduce the porosity of the system to approximately 1%. (Birchall et al., 1981). By introducing different kinds of filler (mineral or steel) and/or fibres (glass, carbon, steel), the desired properties of the material can be tailor-made. Flexural strength values of 150- 200 MPa and compressive strength of up to 300 MPa were achieved for MDF compositions (Alford & Birchall, 1984). By application of advanced packing technology of micro-cement and silica fume, Bache (1981, 1992) developed cementitious products with extreme strength and durability. Bache called his concept of new concrete materials densified systems containing homogenously arranged particles (DSP). Basically, the cement particles are packed as closely together as possible and the remaining space is to be filled with silica fume. The water content is very low. This requires special mixing and compacting technology as well as high contents of superplasticizer. By combining the DSP binder with high-strength aggregates (e.g. burned bauxite), high contents of high strength micro steel fibres (6-12 vol. %) and up to 20 % of reinforcement bars, Bache (1992) achieved up to 350 MPa in bending strength for composite materials. He denoted those composites CRC (compact reinforced composites). Bache’s ideas were taken up by Richard & Cheyrezy (1995) and Richard (1996) who called their concept Reactive Powder Concrete (RPC). The idea was to minimise the number of defects in concrete, eliminate pores and micro cracks in order to achieve a greater percentage of the potential load bearing capacity defined by its component materials and obtain enhanced durability. The particle sizes of aggregates was reduced to maximum one millimetre and the whole particle packing was optimized to a grain size down to 0.5 µm to achieve a dense mixture with minimum void spaces. By applying the following four principles, cementitious materials with high strength, ductility and durability can be produced:
• Enhancement of homogenity by elimination of coarse aggregate. • Enhancement of compacted density by optimization of the granular mixture and
application of pressure before and during setting. • Enhancement of the microstructure by post-set heat-treating. • Enhancement of ductility by incorporation of small-sized steel fibres.
Chapter 3 Theoretical background
39
The application of the first three principles led to a concrete with high compressive strength but the ductility and flexural strength is not better than that of conventional high performance concrete. By introducing small-sized steel fibres into the mix, ductility and flexural strength were increased. The problems occurring of mechanical, physical and chemical heterogeneity of concrete are reduced in RPC. Mechanical heterogeneity results from the difference in the E-modulus between aggregate and paste, physical heterogeneity from difference in thermal expansion coefficient of aggregate and paste and chemically from autogenous shrinkage of the paste (Richard & Cheyrezy, 1995). By reducing the aggregate size to below one millimetre, improving the mechanical properties of the paste and reducing the interfacial transition zone, the homogeneity of the concrete can be increased. The compacted density of the mixture is enhanced by different means. The granular mixture of fine silica sand, cement, quartz flour and silica fume is combined from a number of granular classes with a tight granular range within each class. The different classes are separated and have a high ratio between mean diameters for two consecutive classes (Richard & Cheyrezy, 1995). The optimum type and content of plasticizer is determined by rheological analysis. The water content of the mixture is determined by the minimum water content that is needed to achieve fluidification and optimum relative density analysis to achieve the highest compacted density. By applying pressure to the fresh mixture, the entrapped air can be reduced significantly. Furthermore, excess water is removed from the fresh concrete via the formwork’s interstices and during setting of the concrete; the applied pressure can help to reduce the porosity induced by initial chemical shrinkage. Heat treatment in the range from 90°C at ambient pressure or up to 250-400°C at high pressure accelerates the pozzolanic reaction of silica fume and lead to modifications in the microstructure. The high temperature heat-treatment leads to formation of xonotlite in the paste and major dehydration of the paste. To change the brittle behaviour of pure concrete, the addition of small-sized steel fibres to RPC lead to increased ductility and higher levels of fracture energy. The fibres are introduced in the mix in a ratio of 1.5-3 vol. %. Compressive strength values of 200 to 800 MPa and flexural strength up to 85 MPa were reported for RPC compositions (Richard & Cheyrezy, 1995). Lankard (1984) presented a concept of how to increase the fibre content in cementitious products to up to 20 vol. %, resulting in supreme tensile strength and flexural strength, impact resistance and crack control. The basic idea is to pre-pack steel fibres in a mould (analogue to pre-packed aggregate) and fill the void with a fine grained cement-based slurry. The filling process can vary, purely gravity induced, vibrated or pressurised. Depending on the fibre content and composition of the slurry, compressive strength between 80 MPa and 220 MPa and flexural strength up to 75 MPa were reported by Lankard (1984). Due to fibre orientation in the placing process, slurry infiltrated concrete (SIFCON) has different properties in different loading directions.
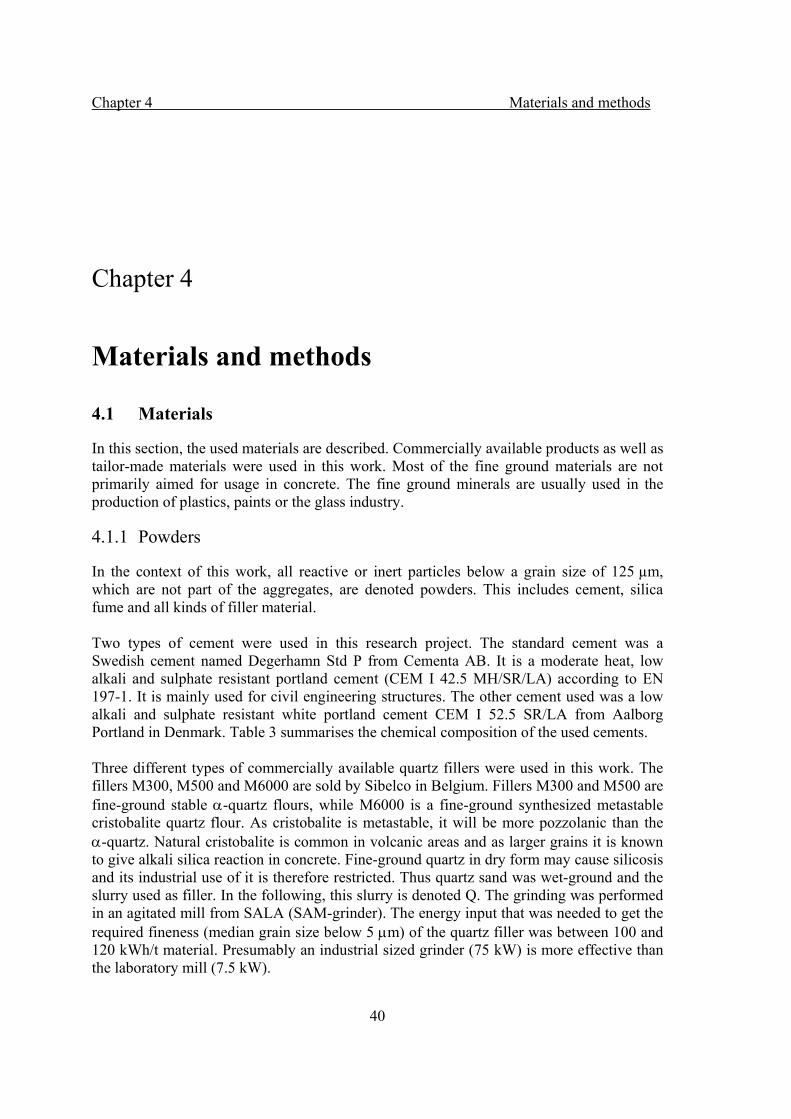
Chapter 4 Materials and methods
40
Chapter 4
Materials and methods
4.1 Materials
In this section, the used materials are described. Commercially available products as well as tailor-made materials were used in this work. Most of the fine ground materials are not primarily aimed for usage in concrete. The fine ground minerals are usually used in the production of plastics, paints or the glass industry.
4.1.1 Powders
In the context of this work, all reactive or inert particles below a grain size of 125 µm, which are not part of the aggregates, are denoted powders. This includes cement, silica fume and all kinds of filler material. Two types of cement were used in this research project. The standard cement was a Swedish cement named Degerhamn Std P from Cementa AB. It is a moderate heat, low alkali and sulphate resistant portland cement (CEM I 42.5 MH/SR/LA) according to EN 197-1. It is mainly used for civil engineering structures. The other cement used was a low alkali and sulphate resistant white portland cement CEM I 52.5 SR/LA from Aalborg Portland in Denmark. Table 3 summarises the chemical composition of the used cements. Three different types of commercially available quartz fillers were used in this work. The fillers M300, M500 and M6000 are sold by Sibelco in Belgium. Fillers M300 and M500 are fine-ground stable α-quartz flours, while M6000 is a fine-ground synthesized metastable cristobalite quartz flour. As cristobalite is metastable, it will be more pozzolanic than the α-quartz. Natural cristobalite is common in volcanic areas and as larger grains it is known to give alkali silica reaction in concrete. Fine-ground quartz in dry form may cause silicosis and its industrial use of it is therefore restricted. Thus quartz sand was wet-ground and the slurry used as filler. In the following, this slurry is denoted Q. The grinding was performed in an agitated mill from SALA (SAM-grinder). The energy input that was needed to get the required fineness (median grain size below 5 μm) of the quartz filler was between 100 and 120 kWh/t material. Presumably an industrial sized grinder (75 kW) is more effective than the laboratory mill (7.5 kW).

Chapter 4 Materials and methods
41
Fine ground wollastonite and nepheline syenite were investigated to find out the effect of other minerals than quartz. The wollastonite (WIC 10) used was a commercial product delivered by Nordkalk AB in Sweden. Wollastonite is a calcium silicate mineral (CaSiO3). Mixtures incorporating wollastonite are denoted Woll. The nepheline syenite (Minex S10) used was a commercial product produced by North Cape Minerals in Norway. Nepheline syenite is a rock, composed of 62% K-feldspar (K2O·AL2O3·6SiO2) and Na-feldspar (Na2O·Al2O3·6SiO2) and 38% nepheline (3Na2O·K2O·4Al2O3·8SiO2). Mixes containing nepheline syenite are denoted SY. In some special concretes (see chapter 7), Limestone filler L25, consisting of crushed crystalline limestone (CaCO3), from Nordkalk AB in Sweden was used. Some of the special concretes and the UHPC contain silica fume in different amounts. Undensified silica fume 940 U as well as densified silica fume 920 D from Elkem, Norway, was used. The chemical composition of the materials was taken from the manufacturers’ datasheets if available. Otherwise samples were taken and sent to an accredited laboratory for XRF-analysis. Table 4 summarises the chemical composition of the used powders. The particle size distributions of the powders used in the test program were analysed by laser diffraction and are summarised in Figure 19.
Figure 19: Particle size distribution of cements and fillers, analysed by laser diffraction.
0
10
20
30
40
50
60
70
80
90
100
0.100 µm 1.000 µm 10.000 µm 100.000 µmparticle diameter
volu
me
[%]
CEM I 42.5
CEM I 52.5
Quartz M300
Quartz M500
CristobaliteM6000
Wetgroundquartz
Wollastonite
Nepheline-Syenite
LimestoneLimus 25
Silica fume
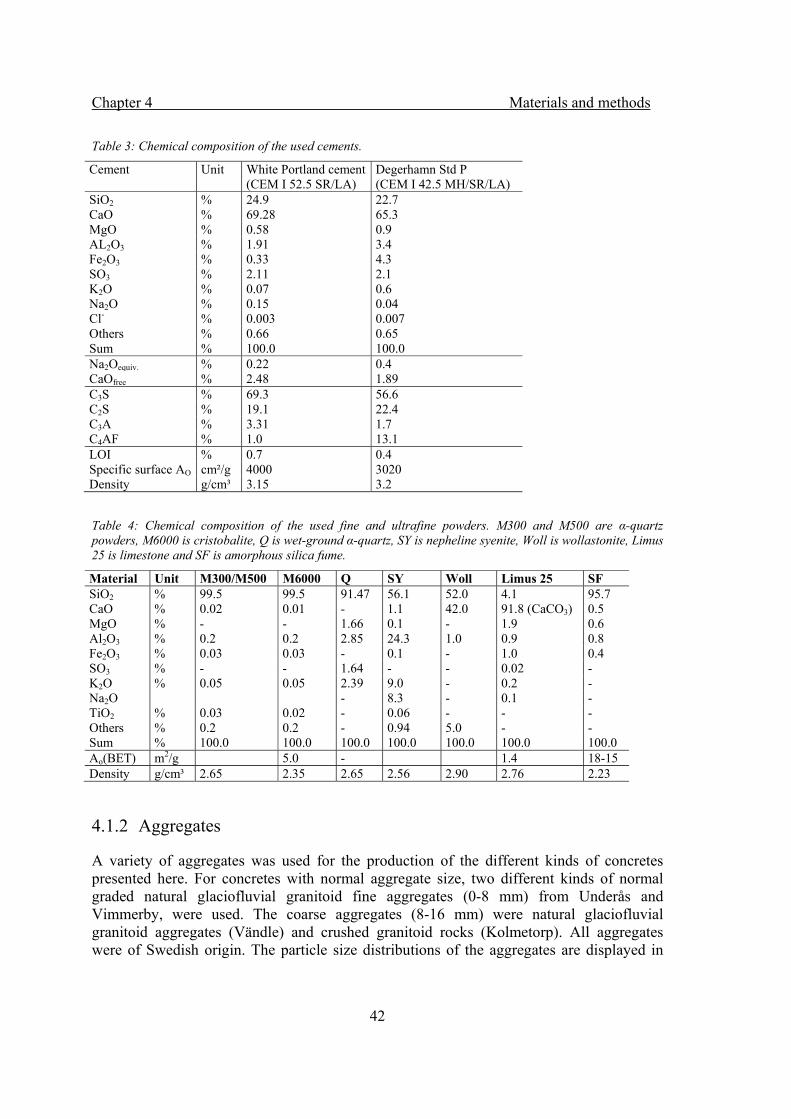
Chapter 4 Materials and methods
42
Table 3: Chemical composition of the used cements.
Cement Unit White Portland cement(CEM I 52.5 SR/LA)
Degerhamn Std P (CEM I 42.5 MH/SR/LA)
SiO2 % 24.9 22.7 CaO % 69.28 65.3 MgO % 0.58 0.9 AL2O3 % 1.91 3.4 Fe2O3 % 0.33 4.3 SO3 % 2.11 2.1 K2O % 0.07 0.6 Na2O % 0.15 0.04 Cl- % 0.003 0.007 Others % 0.66 0.65 Sum % 100.0 100.0 Na2Oequiv. % 0.22 0.4 CaOfree % 2.48 1.89 C3S % 69.3 56.6 C2S % 19.1 22.4 C3A % 3.31 1.7 C4AF % 1.0 13.1 LOI % 0.7 0.4 Specific surface AO cm²/g 4000 3020 Density g/cm³ 3.15 3.2 Table 4: Chemical composition of the used fine and ultrafine powders. M300 and M500 are α-quartz powders, M6000 is cristobalite, Q is wet-ground α-quartz, SY is nepheline syenite, Woll is wollastonite, Limus 25 is limestone and SF is amorphous silica fume.
Material Unit M300/M500 M6000 Q SY Woll Limus 25 SF SiO2 % 99.5 99.5 91.47 56.1 52.0 4.1 95.7 CaO % 0.02 0.01 - 1.1 42.0 91.8 (CaCO3) 0.5 MgO % - - 1.66 0.1 - 1.9 0.6 Al2O3 % 0.2 0.2 2.85 24.3 1.0 0.9 0.8 Fe2O3 % 0.03 0.03 - 0.1 - 1.0 0.4 SO3 % - - 1.64 - - 0.02 - K2O % 0.05 0.05 2.39 9.0 - 0.2 - Na2O - 8.3 - 0.1 - TiO2 % 0.03 0.02 - 0.06 - - - Others % 0.2 0.2 - 0.94 5.0 - - Sum % 100.0 100.0 100.0 100.0 100.0 100.0 100.0 Ao(BET) m2/g 5.0 - 1.4 18-15 Density g/cm³ 2.65 2.35 2.65 2.56 2.90 2.76 2.23
4.1.2 Aggregates
A variety of aggregates was used for the production of the different kinds of concretes presented here. For concretes with normal aggregate size, two different kinds of normal graded natural glaciofluvial granitoid fine aggregates (0-8 mm) from Underås and Vimmerby, were used. The coarse aggregates (8-16 mm) were natural glaciofluvial granitoid aggregates (Vändle) and crushed granitoid rocks (Kolmetorp). All aggregates were of Swedish origin. The particle size distributions of the aggregates are displayed in
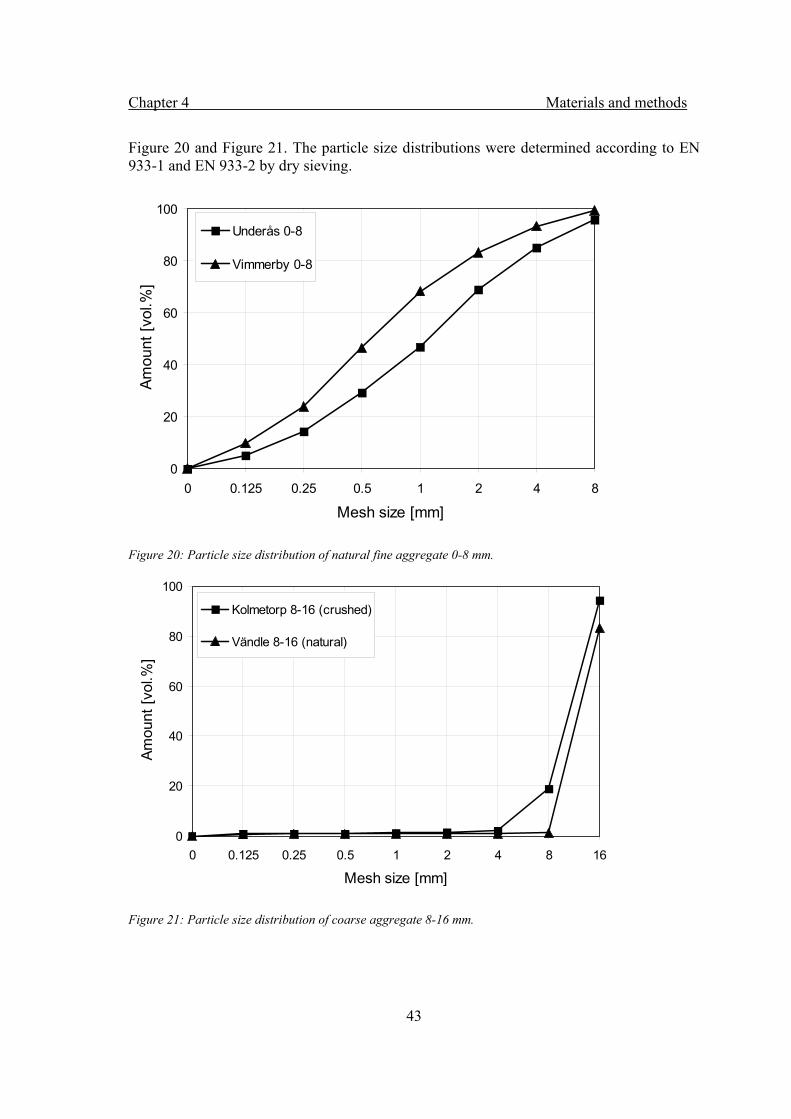
Chapter 4 Materials and methods
43
Figure 20 and Figure 21. The particle size distributions were determined according to EN 933-1 and EN 933-2 by dry sieving.
Figure 20: Particle size distribution of natural fine aggregate 0-8 mm.
Figure 21: Particle size distribution of coarse aggregate 8-16 mm.
0
20
40
60
80
100
0 0.125 0.25 0.5 1 2 4 8
Mesh size [mm]
Amou
nt [v
ol.%
]
Underås 0-8
Vimmerby 0-8
0
20
40
60
80
100
0 0.125 0.25 0.5 1 2 4 8 16
Mesh size [mm]
Amou
nt [v
ol.%
]
Kolmetorp 8-16 (crushed)
Vändle 8-16 (natural)
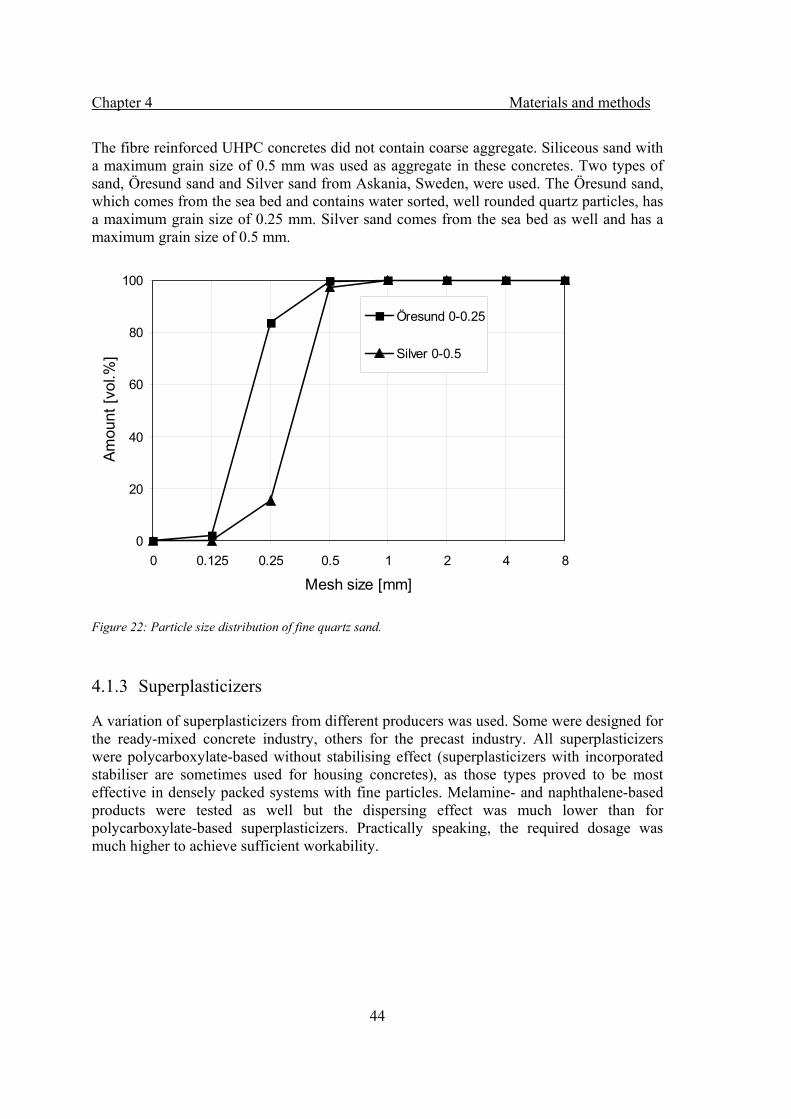
Chapter 4 Materials and methods
44
The fibre reinforced UHPC concretes did not contain coarse aggregate. Siliceous sand with a maximum grain size of 0.5 mm was used as aggregate in these concretes. Two types of sand, Öresund sand and Silver sand from Askania, Sweden, were used. The Öresund sand, which comes from the sea bed and contains water sorted, well rounded quartz particles, has a maximum grain size of 0.25 mm. Silver sand comes from the sea bed as well and has a maximum grain size of 0.5 mm.
Figure 22: Particle size distribution of fine quartz sand.
4.1.3 Superplasticizers
A variation of superplasticizers from different producers was used. Some were designed for the ready-mixed concrete industry, others for the precast industry. All superplasticizers were polycarboxylate-based without stabilising effect (superplasticizers with incorporated stabiliser are sometimes used for housing concretes), as those types proved to be most effective in densely packed systems with fine particles. Melamine- and naphthalene-based products were tested as well but the dispersing effect was much lower than for polycarboxylate-based superplasticizers. Practically speaking, the required dosage was much higher to achieve sufficient workability.
0
20
40
60
80
100
0 0.125 0.25 0.5 1 2 4 8
Mesh size [mm]
Amou
nt [v
ol.%
]
Öresund 0-0.25
Silver 0-0.5
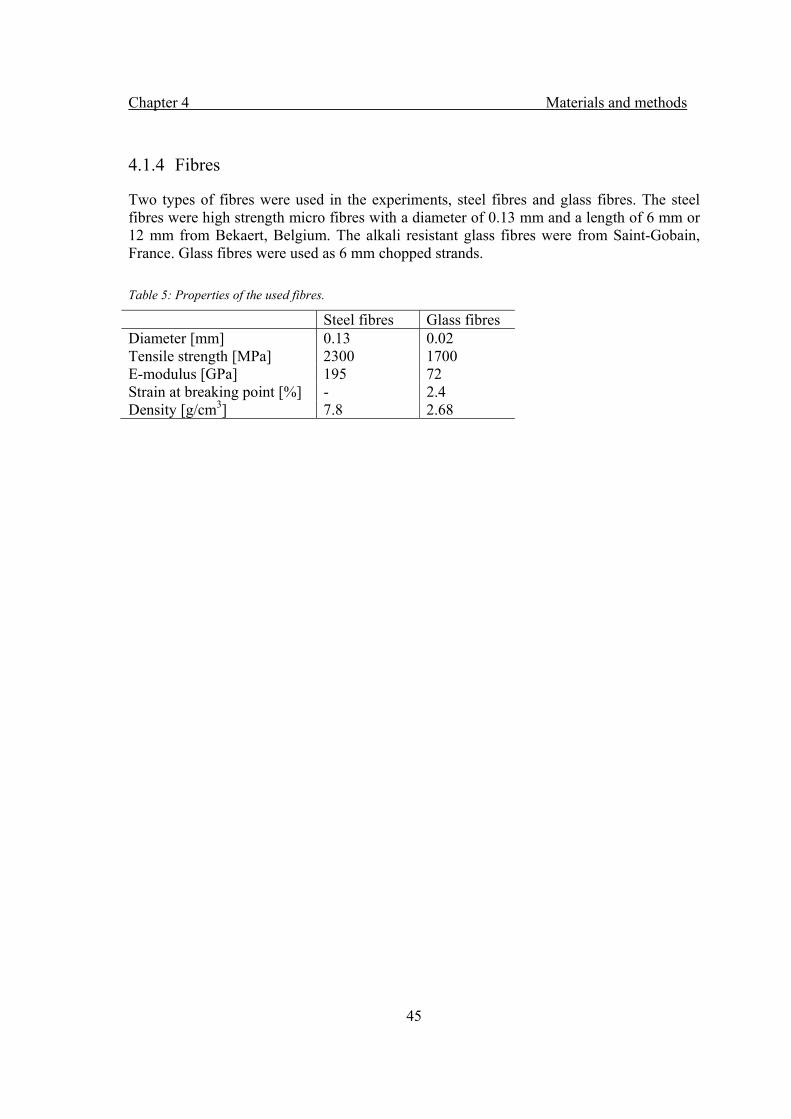
Chapter 4 Materials and methods
45
4.1.4 Fibres
Two types of fibres were used in the experiments, steel fibres and glass fibres. The steel fibres were high strength micro fibres with a diameter of 0.13 mm and a length of 6 mm or 12 mm from Bekaert, Belgium. The alkali resistant glass fibres were from Saint-Gobain, France. Glass fibres were used as 6 mm chopped strands. Table 5: Properties of the used fibres.
Steel fibres Glass fibres Diameter [mm] 0.13 0.02 Tensile strength [MPa] 2300 1700 E-modulus [GPa] 195 72 Strain at breaking point [%] - 2.4 Density [g/cm3] 7.8 2.68
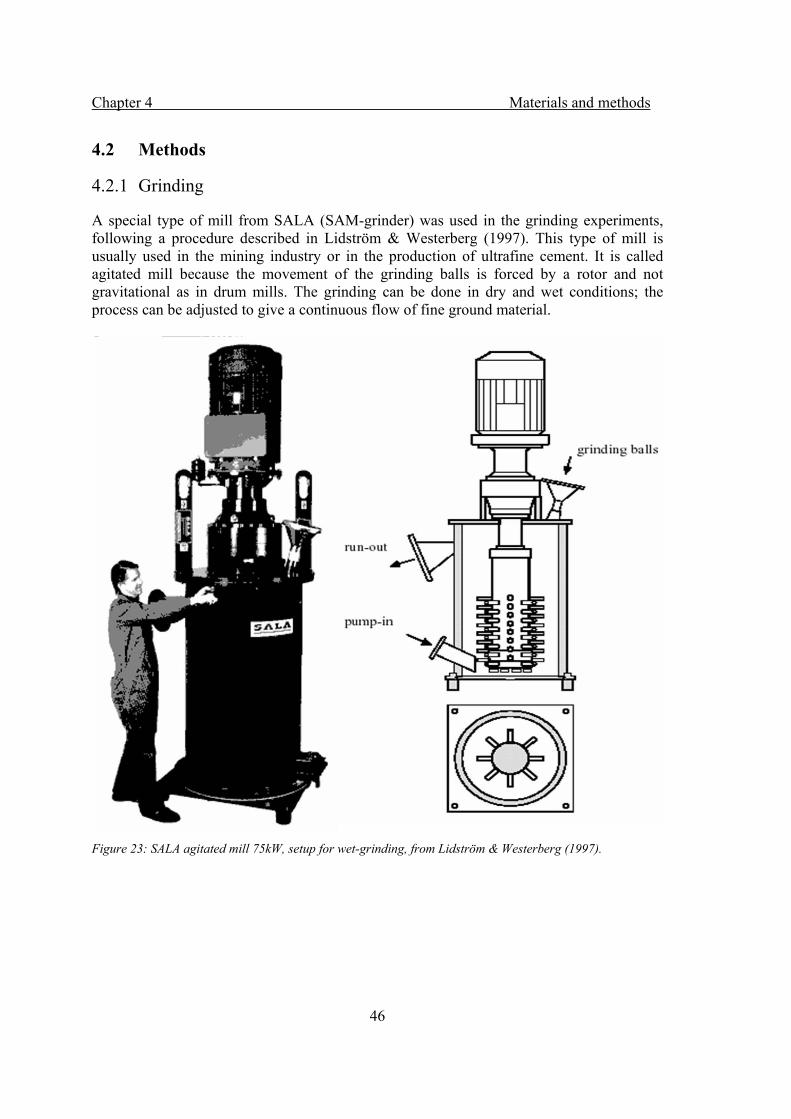
Chapter 4 Materials and methods
46
4.2 Methods
4.2.1 Grinding
A special type of mill from SALA (SAM-grinder) was used in the grinding experiments, following a procedure described in Lidström & Westerberg (1997). This type of mill is usually used in the mining industry or in the production of ultrafine cement. It is called agitated mill because the movement of the grinding balls is forced by a rotor and not gravitational as in drum mills. The grinding can be done in dry and wet conditions; the process can be adjusted to give a continuous flow of fine ground material.
Figure 23: SALA agitated mill 75kW, setup for wet-grinding, from Lidström & Westerberg (1997).

Chapter 4 Materials and methods
47
4.2.2 Mixing, mixing time and mixing order
Depending on the type of concrete and its maximum aggregate size, different types of mixers were used. Paste for isothermal calorimetry and small batches of UHPC were mixed in a Hobart laboratory mixer, concrete and larger batches of UHPC were mixed in a 25 litre laboratory mixer (Zyklos ZK 30 E) or in a 100 litre Eirich Intensive Mixer R 09 T. Depending on the composition of the mixes, different mixing orders had to be used. Table 6 summarises all mixing orders and times. Table 6: Mixing order and mixing time for different mixes
Paste with Concrete with UHPC Dry filler Filler slurry Dry filler Filler slurry Densified SF All dry materials
All dry materials
All dry materials
All dry materials
Aggregates and SF
All dry materials except fibres
2 min 2 min 2 min 2 min 2 min 2 min Water and ½ of plasticizer if any
Water, filler slurry and ½ of plasticizer if any
Water and ½ of plasticizer if any
Water, filler slurry and ½ of plasticizer if any
Filler and cement
Water and ½ of plasticizer
1 min 1 min 2 min 2 min 2 min 2 min Rest of plasticizer if any
Rest of plasticizer if any
Rest of plasticizer if any
Rest of plasticizer if any
Water and ½ of plasticizer
Rest of plasticizer
2 min* 2 min* 2 min* 2 min* 2 min 5- 10 min Rest of
plasticizer fibres
2 min 2- 5 min *in mixes without plasticizer, the total mixing time was equal.
4.2.3 Mix compositions
A variety of mix compositions for paste and concrete was used in this work. In order to improve the readability of the work, the different mix designs will be presented prior to the associated results in chapter 5.
4.2.4 Heat development
Heat development of cement paste incorporating different fillers and UHPC was tested using isothermal calorimetry. Concrete can not be tested with isothermal calorimetry as the instrument works with very small amounts of material. Therefore, semi-adiabatic calorimetry was done on some concrete mixes, using the equipment described in Ekerfors (1995) and Ekerfors & Jonasson (2000), see Figure 24. A concrete sample with a volume of about 5 litres is instrumented with temperature gauges, placed in thick insulation and the temperature development due to heat of hydration is measured.

Chapter 4 Materials and methods
48
Figure 24: Semi-adiabatic concrete calorimeter
4.2.5 Determination of fresh concrete properties
For all prepared concretes, the workability was evaluated, using a slump test. The test to be used depended on the properties of the tested concrete. If a conventional concrete was tested, the slump value according to EN 12350-2 was determined. Had the concrete a high flowability, the slump flow was tested according to the European guidelines for self-compacting concrete (2005). The slump flow of the UHPC was tested with a set cone according to EN 1015-3; this set cone is intended to test the workability of cement pastes and mortars and therefore much smaller. The rheological parameters yield stress and viscosity according to the Bingham model were determined for a selection of concretes, using a ConTec 4 Viscometer. Not all types of concrete could be tested in the viscometer because of machinery limits concerning the maximum force which can be measured.
4.2.6 Determination of macroscopic properties of hardened concrete
One of the most important properties of concrete is mechanical strength. Compressive strength according to EN 12390-1, EN 12390-2 and EN 12390-3 on cubes of 100x100x100 mm3 was determined for all mixes. The results were not recalculated to standard cubes. The flexural strength of UHPC containing fibres was tested on prisms 40x40x160 mm3 according to EN 196-1. The prisms were notched and the loading process was deformation controlled, following a procedure described in Brahmeshuber (2003). All
Insulation
Insulation
Concrete sample with temperature
gauges
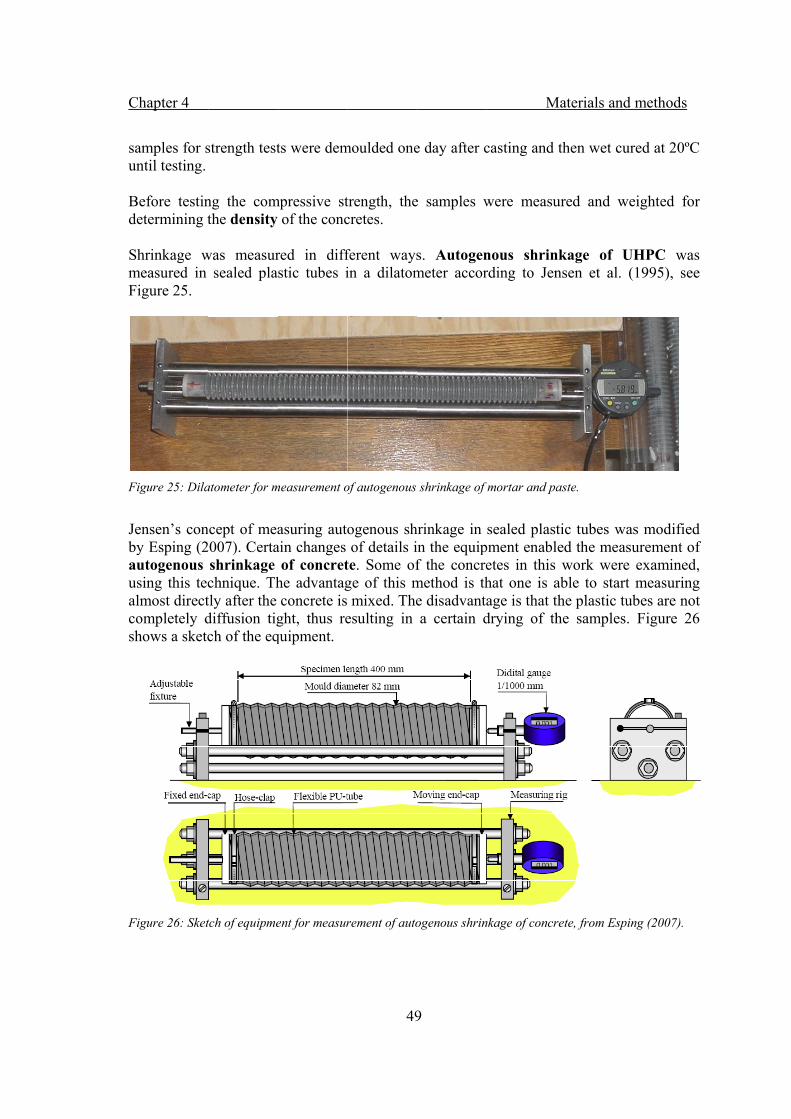
Ch
saun Bde ShmFi
Fi
Jebyauusalcosh
Fi
hapter 4
amples for sntil testing.
efore testinetermining t
hrinkage wmeasured in
igure 25.
igure 25: Dila
ensen’s cony Esping (2utogenous sing this teclmost directompletely dhows a sketc
igure 26: Sket
strength test
ng the comthe density
was measursealed pla
atometer for m
cept of mea007). Certashrinkage chnique. Thtly after the diffusion tigch of the eq
tch of equipme
ts were dem
mpressive stof the conc
red in diffstic tubes i
measurement o
asuring autoain changes
of concrethe advantagconcrete is
ght, thus requipment.
ent for measur
49
moulded one
trength, thecretes.
ferent waysin a dilatom
of autogenous
ogenous shof details i
te. Some ofge of this mmixed. The
esulting in
rement of auto
9
e day after c
e samples w
s. Autogenmeter accor
shrinkage of
hrinkage in n the equipf the concremethod is the disadvantaa certain d
ogenous shrin
M
casting and
were measu
nous shrinrding to Jen
mortar and pa
sealed plastpment enabletes in this hat one is aage is that tdrying of th
nkage of concr
Materials and
then wet cu
ured and w
nkage of Unsen et al.
aste.
tic tubes wled the mea
work wereable to startthe plastic tuhe samples
rete, from Esp
d methods
ured at 20ºC
weighted for
UHPC was(1995), see
as modifiedsurement ofe examinedt measuringubes are no. Figure 26
ping (2007).
C
r
s e
d f
d, g t 6
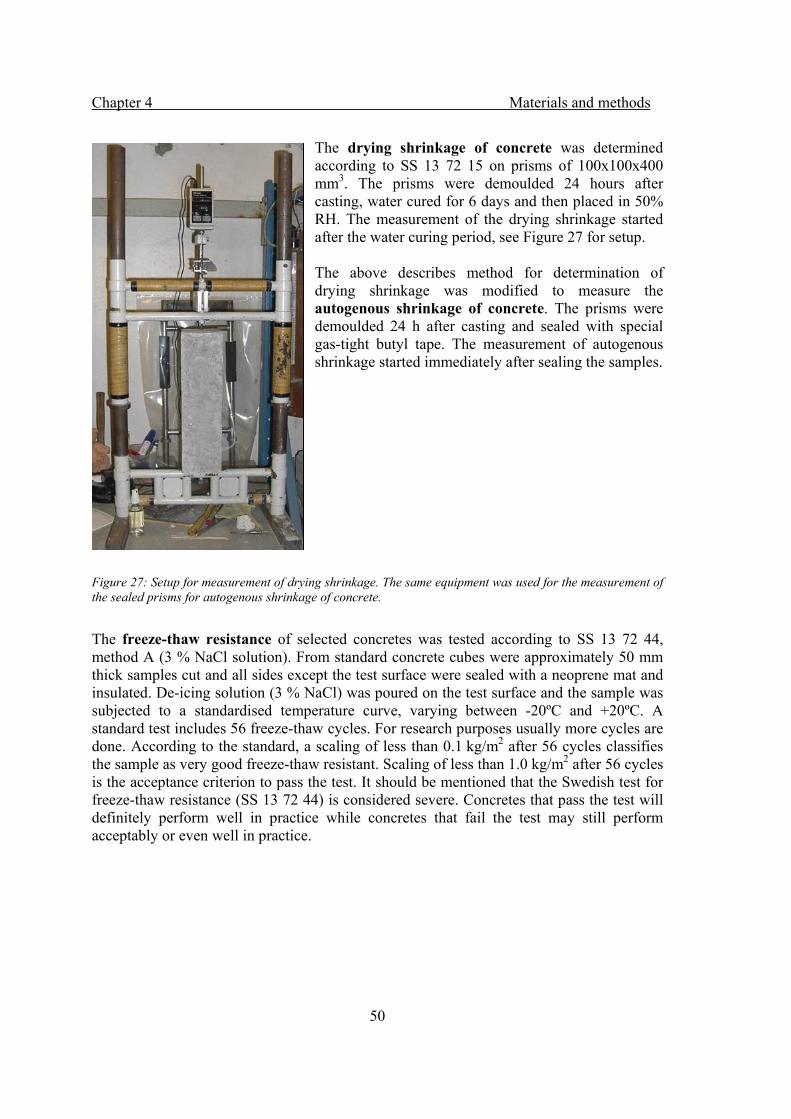
Chapter 4 Materials and methods
50
The drying shrinkage of concrete was determined according to SS 13 72 15 on prisms of 100x100x400 mm3. The prisms were demoulded 24 hours after casting, water cured for 6 days and then placed in 50% RH. The measurement of the drying shrinkage started after the water curing period, see Figure 27 for setup. The above describes method for determination of drying shrinkage was modified to measure the autogenous shrinkage of concrete. The prisms were demoulded 24 h after casting and sealed with special gas-tight butyl tape. The measurement of autogenous shrinkage started immediately after sealing the samples.
Figure 27: Setup for measurement of drying shrinkage. The same equipment was used for the measurement of the sealed prisms for autogenous shrinkage of concrete.
The freeze-thaw resistance of selected concretes was tested according to SS 13 72 44, method A (3 % NaCl solution). From standard concrete cubes were approximately 50 mm thick samples cut and all sides except the test surface were sealed with a neoprene mat and insulated. De-icing solution (3 % NaCl) was poured on the test surface and the sample was subjected to a standardised temperature curve, varying between -20ºC and +20ºC. A standard test includes 56 freeze-thaw cycles. For research purposes usually more cycles are done. According to the standard, a scaling of less than 0.1 kg/m2 after 56 cycles classifies the sample as very good freeze-thaw resistant. Scaling of less than 1.0 kg/m2 after 56 cycles is the acceptance criterion to pass the test. It should be mentioned that the Swedish test for freeze-thaw resistance (SS 13 72 44) is considered severe. Concretes that pass the test will definitely perform well in practice while concretes that fail the test may still perform acceptably or even well in practice.
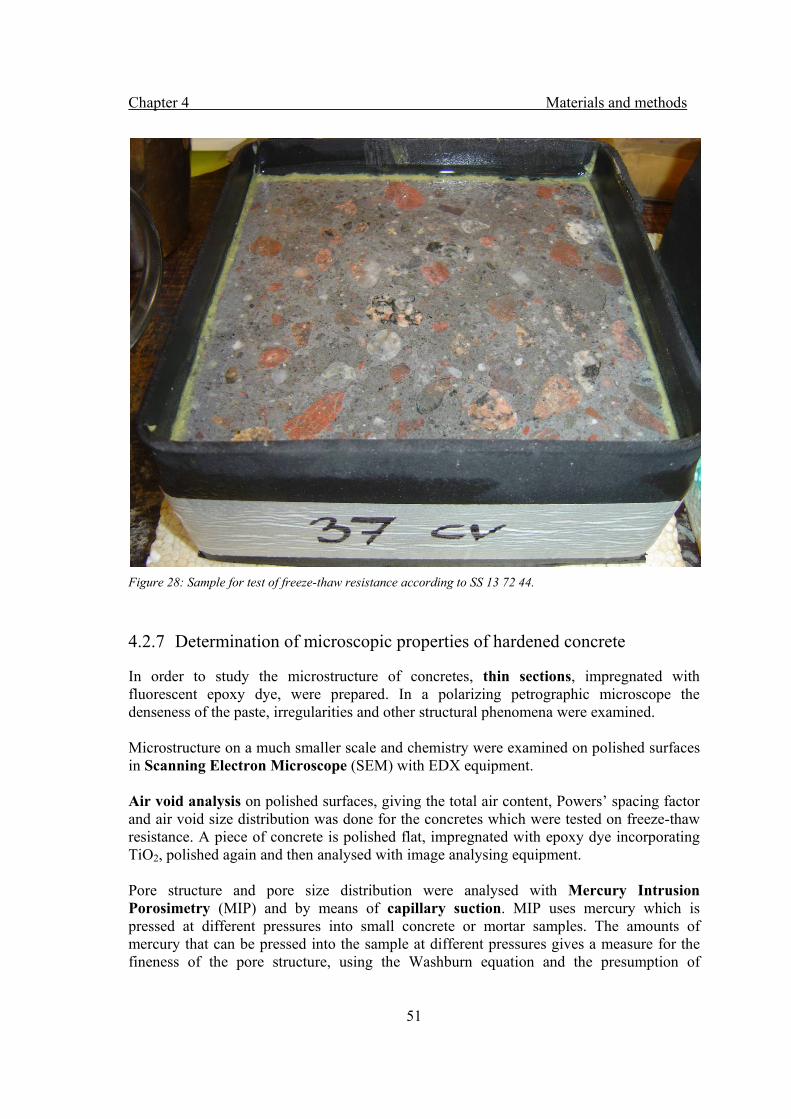
Chapter 4 Materials and methods
51
Figure 28: Sample for test of freeze-thaw resistance according to SS 13 72 44.
4.2.7 Determination of microscopic properties of hardened concrete
In order to study the microstructure of concretes, thin sections, impregnated with fluorescent epoxy dye, were prepared. In a polarizing petrographic microscope the denseness of the paste, irregularities and other structural phenomena were examined. Microstructure on a much smaller scale and chemistry were examined on polished surfaces in Scanning Electron Microscope (SEM) with EDX equipment. Air void analysis on polished surfaces, giving the total air content, Powers’ spacing factor and air void size distribution was done for the concretes which were tested on freeze-thaw resistance. A piece of concrete is polished flat, impregnated with epoxy dye incorporating TiO2, polished again and then analysed with image analysing equipment. Pore structure and pore size distribution were analysed with Mercury Intrusion Porosimetry (MIP) and by means of capillary suction. MIP uses mercury which is pressed at different pressures into small concrete or mortar samples. The amounts of mercury that can be pressed into the sample at different pressures gives a measure for the fineness of the pore structure, using the Washburn equation and the presumption of
Chapter 4 Materials and methods
52
cylindrical pores, see e.g. Stark (2000). For the capillary suction test, concrete samples with a height of 25– 30 mm were dried at 40ºC until the weight was constant, the sides of the samples were sealed and then the lower 5 mm of the samples were exposed to water. The weight change over time was registered. When the samples stopped sucking water, the test was completed by vacuum saturation.
Chapter 5 Results and discussion
53
Chapter 5
Results and discussion
5.1 Effect of ultrafine particles
The following experiments were done in order to get a better understanding of the effect of different inert ultrafine particles on the hydration of portland cement and the properties of concrete. Limestone fillers were not investigated as the effect of limestone fillers on concrete properties is well documented by other researchers.
5.1.1 Influence of ultrafine particles on heat of hydration
The heat development of hydrating cement paste is a good indicator for the progress of the cement hydration. Isothermal calorimetry was used to record this heat development as the cement hydration is an exothermal process. Cement- filler pastes with 50% of different fillers were prepared and compared to a reference sample of pure cement paste, see Figure 29 and Figure 30. No superplasticizers were used in these pastes. The curves in Figure 29 show that all fillers except wollastonite have a slightly retarding effect on the cement hydration. The dormant period is somewhat prolonged and the accelerating period appeares somewhat later. However, the intensity of the second peak and the total heat developed during the first 24 hours of hydration is increased for all filler materials. All tested fillers act as strength accelerators; they increase the reaction rate of the cement after the dormant period. The accelerating effect is quite pronounced, as one can observe that the total heat developed increases by about 1/3 (see Figure 30). Wollastonite acts also as a weak setting accelerator as it shortens the dormant period slightly. This effect is known for limestone filler as well and is described by Kjellsen (1995), Ye (2006) and others.
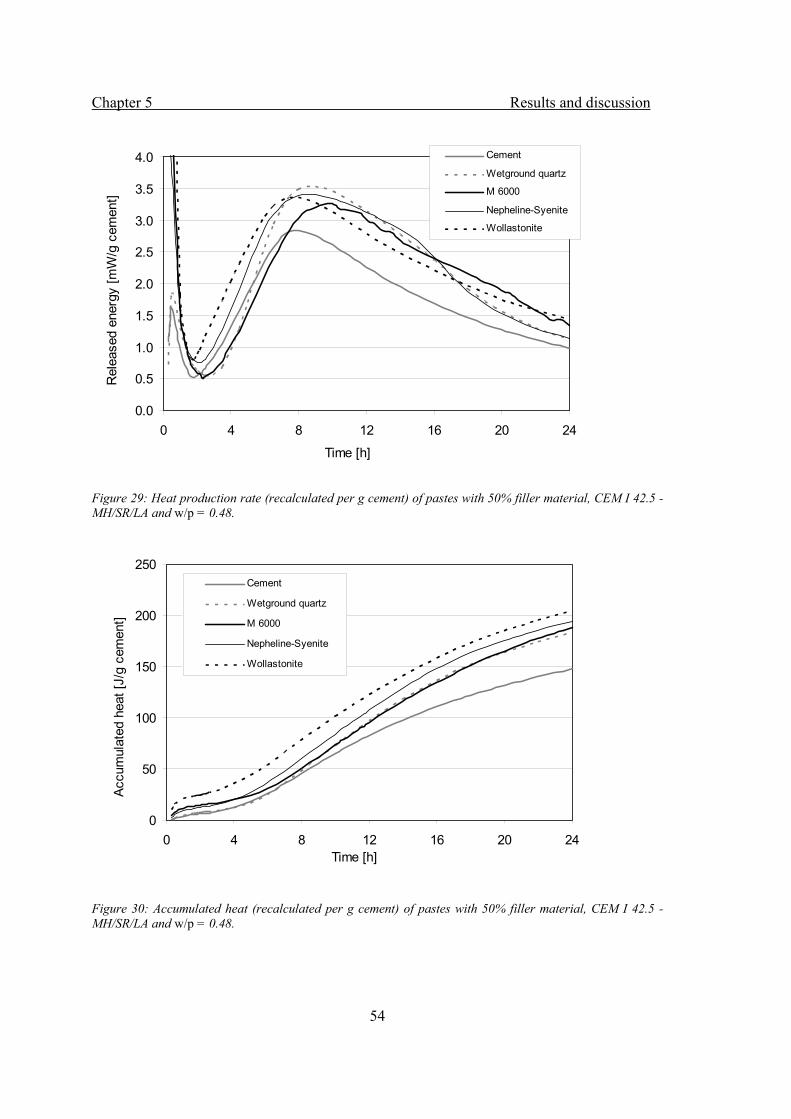
Chapter 5 Results and discussion
54
Figure 29: Heat production rate (recalculated per g cement) of pastes with 50% filler material, CEM I 42.5 -MH/SR/LA and w/p = 0.48.
Figure 30: Accumulated heat (recalculated per g cement) of pastes with 50% filler material, CEM I 42.5 -MH/SR/LA and w/p = 0.48.
0.0
0.5
1.0
1.5
2.0
2.5
3.0
3.5
4.0
0 4 8 12 16 20 24
Time [h]
Rel
ease
d en
ergy
[mW
/g c
emen
t] 5
Cement
Wetground quartz
M 6000
Nepheline-Syenite
Wollastonite
0
50
100
150
200
250
0 4 8 12 16 20 24Time [h]
Accu
mul
ated
hea
t [J/
g ce
men
t]
5
Cement
Wetground quartz
M 6000
Nepheline-Syenite
Wollastonite
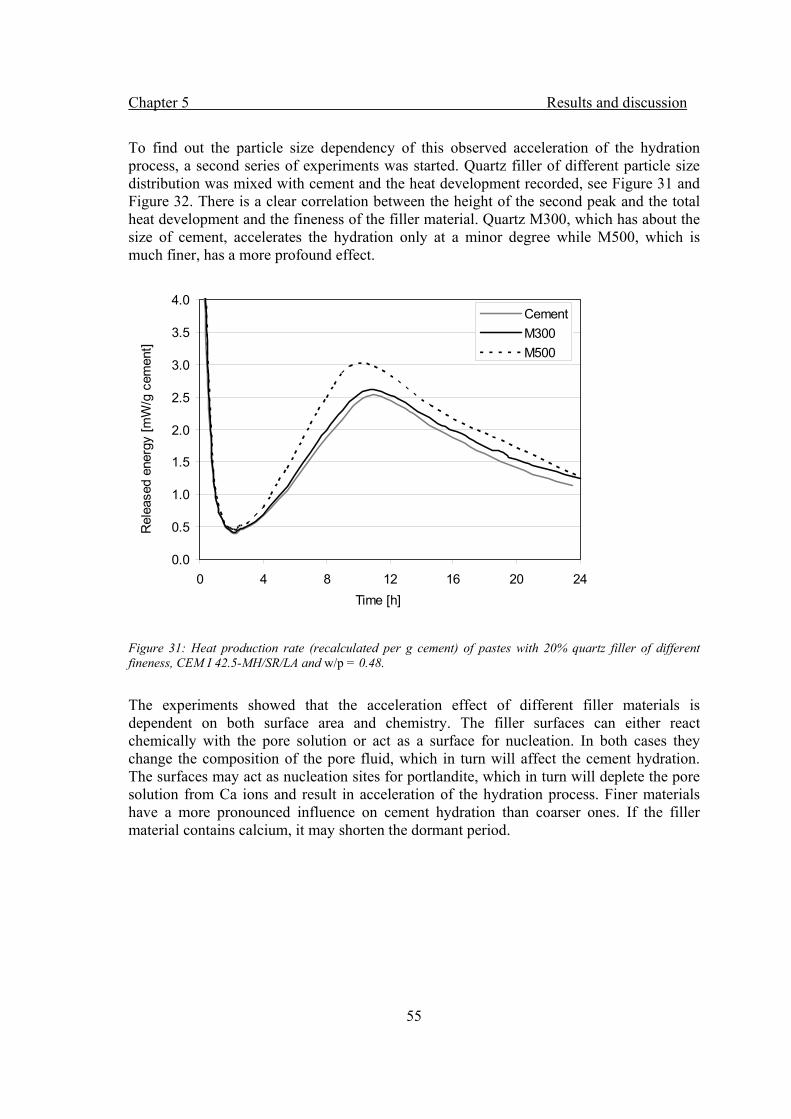
Chapter 5 Results and discussion
55
To find out the particle size dependency of this observed acceleration of the hydration process, a second series of experiments was started. Quartz filler of different particle size distribution was mixed with cement and the heat development recorded, see Figure 31 and Figure 32. There is a clear correlation between the height of the second peak and the total heat development and the fineness of the filler material. Quartz M300, which has about the size of cement, accelerates the hydration only at a minor degree while M500, which is much finer, has a more profound effect.
Figure 31: Heat production rate (recalculated per g cement) of pastes with 20% quartz filler of different fineness, CEM I 42.5-MH/SR/LA and w/p = 0.48.
The experiments showed that the acceleration effect of different filler materials is dependent on both surface area and chemistry. The filler surfaces can either react chemically with the pore solution or act as a surface for nucleation. In both cases they change the composition of the pore fluid, which in turn will affect the cement hydration. The surfaces may act as nucleation sites for portlandite, which in turn will deplete the pore solution from Ca ions and result in acceleration of the hydration process. Finer materials have a more pronounced influence on cement hydration than coarser ones. If the filler material contains calcium, it may shorten the dormant period.
0.0
0.5
1.0
1.5
2.0
2.5
3.0
3.5
4.0
0 4 8 12 16 20 24Time [h]
Rel
ease
d en
ergy
[mW
/g c
emen
t] 5
CementM300M500
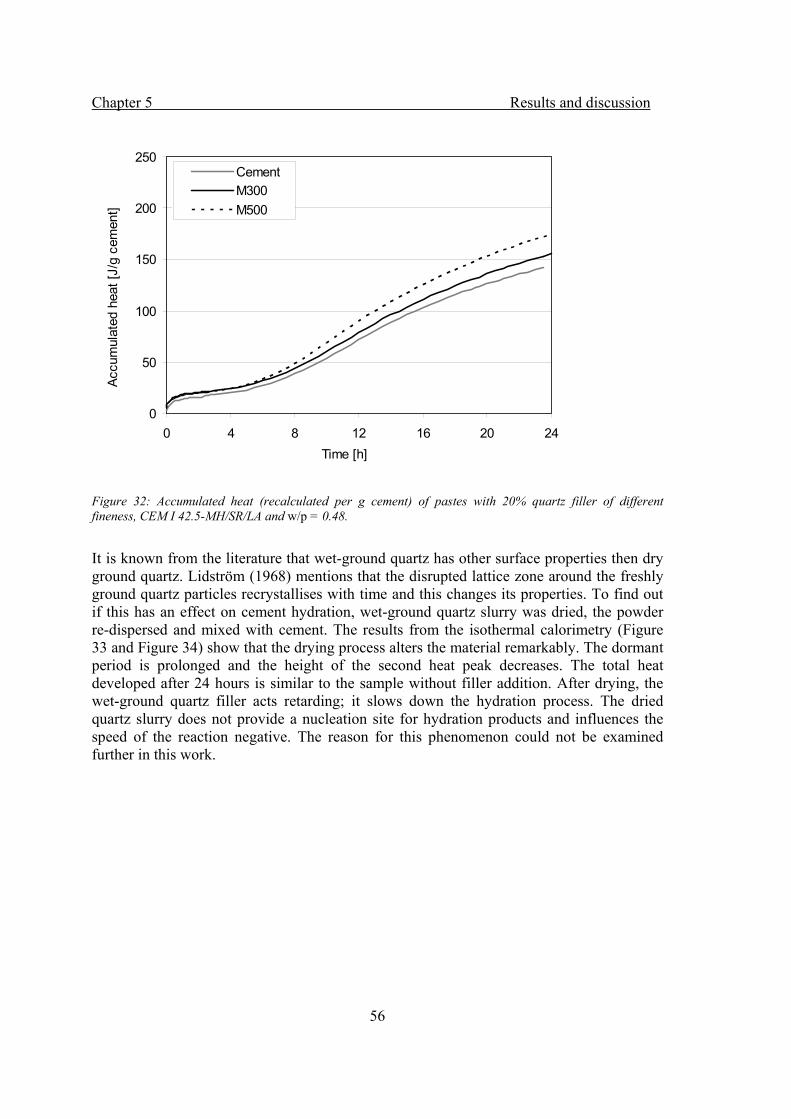
Chapter 5 Results and discussion
56
Figure 32: Accumulated heat (recalculated per g cement) of pastes with 20% quartz filler of different fineness, CEM I 42.5-MH/SR/LA and w/p = 0.48.
It is known from the literature that wet-ground quartz has other surface properties then dry ground quartz. Lidström (1968) mentions that the disrupted lattice zone around the freshly ground quartz particles recrystallises with time and this changes its properties. To find out if this has an effect on cement hydration, wet-ground quartz slurry was dried, the powder re-dispersed and mixed with cement. The results from the isothermal calorimetry (Figure 33 and Figure 34) show that the drying process alters the material remarkably. The dormant period is prolonged and the height of the second heat peak decreases. The total heat developed after 24 hours is similar to the sample without filler addition. After drying, the wet-ground quartz filler acts retarding; it slows down the hydration process. The dried quartz slurry does not provide a nucleation site for hydration products and influences the speed of the reaction negative. The reason for this phenomenon could not be examined further in this work.
0
50
100
150
200
250
0 4 8 12 16 20 24Time [h]
Accu
mul
ated
hea
t [J/
g ce
men
t]
5
CementM300M500
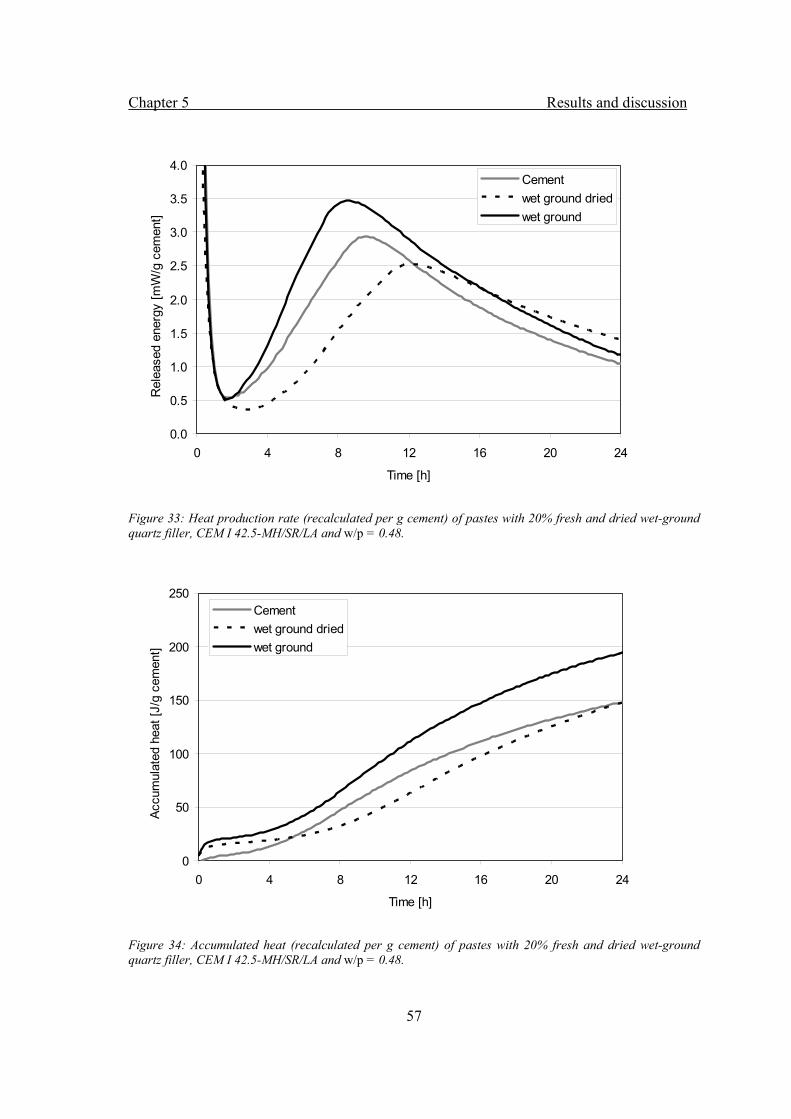
Chapter 5 Results and discussion
57
Figure 33: Heat production rate (recalculated per g cement) of pastes with 20% fresh and dried wet-ground quartz filler, CEM I 42.5-MH/SR/LA and w/p = 0.48.
Figure 34: Accumulated heat (recalculated per g cement) of pastes with 20% fresh and dried wet-ground quartz filler, CEM I 42.5-MH/SR/LA and w/p = 0.48.
0.0
0.5
1.0
1.5
2.0
2.5
3.0
3.5
4.0
0 4 8 12 16 20 24
Time [h]
Rel
ease
d en
ergy
[mW
/g c
emen
t] 5
Cementwet ground driedwet ground
0
50
100
150
200
250
0 4 8 12 16 20 24
Time [h]
Accu
mul
ated
hea
t [J/
g ce
men
t] 5
Cementwet ground driedwet ground
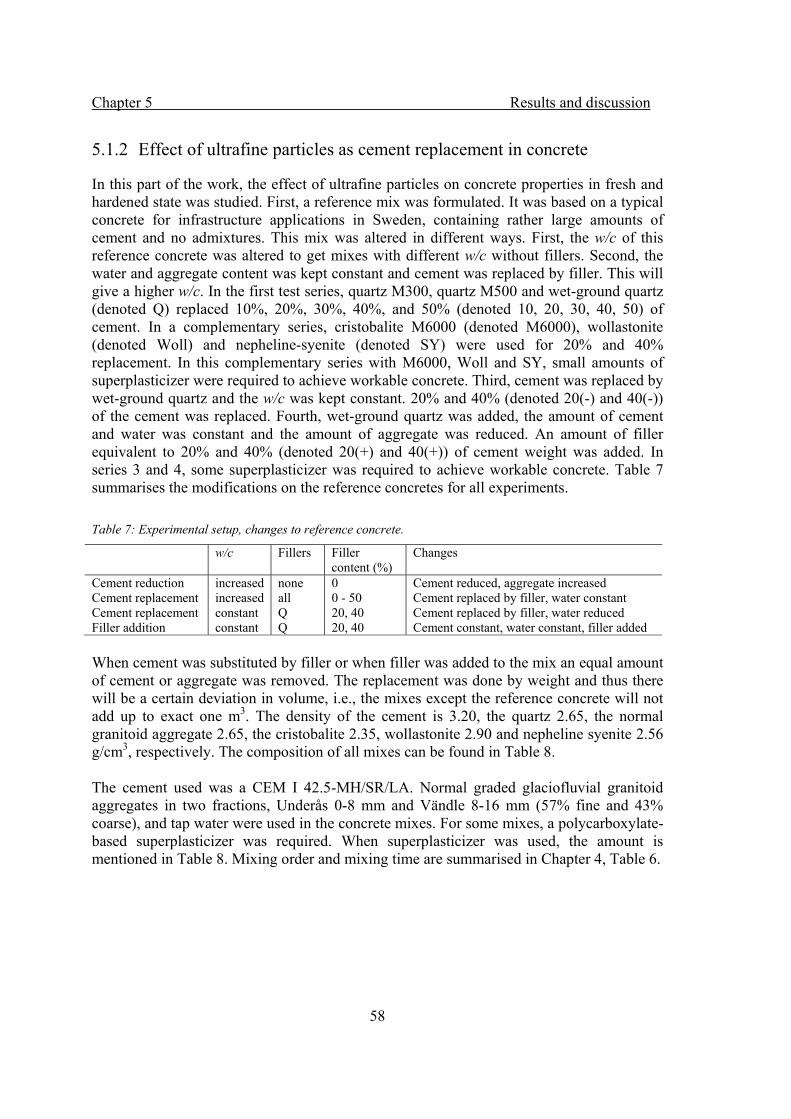
Chapter 5 Results and discussion
58
5.1.2 Effect of ultrafine particles as cement replacement in concrete
In this part of the work, the effect of ultrafine particles on concrete properties in fresh and hardened state was studied. First, a reference mix was formulated. It was based on a typical concrete for infrastructure applications in Sweden, containing rather large amounts of cement and no admixtures. This mix was altered in different ways. First, the w/c of this reference concrete was altered to get mixes with different w/c without fillers. Second, the water and aggregate content was kept constant and cement was replaced by filler. This will give a higher w/c. In the first test series, quartz M300, quartz M500 and wet-ground quartz (denoted Q) replaced 10%, 20%, 30%, 40%, and 50% (denoted 10, 20, 30, 40, 50) of cement. In a complementary series, cristobalite M6000 (denoted M6000), wollastonite (denoted Woll) and nepheline-syenite (denoted SY) were used for 20% and 40% replacement. In this complementary series with M6000, Woll and SY, small amounts of superplasticizer were required to achieve workable concrete. Third, cement was replaced by wet-ground quartz and the w/c was kept constant. 20% and 40% (denoted 20(-) and 40(-)) of the cement was replaced. Fourth, wet-ground quartz was added, the amount of cement and water was constant and the amount of aggregate was reduced. An amount of filler equivalent to 20% and 40% (denoted 20(+) and 40(+)) of cement weight was added. In series 3 and 4, some superplasticizer was required to achieve workable concrete. Table 7 summarises the modifications on the reference concretes for all experiments. Table 7: Experimental setup, changes to reference concrete.
w/c Fillers Filler content (%)
Changes
Cement reduction increased none 0 Cement reduced, aggregate increased Cement replacement increased all 0 - 50 Cement replaced by filler, water constant Cement replacement constant Q 20, 40 Cement replaced by filler, water reduced Filler addition constant Q 20, 40 Cement constant, water constant, filler added When cement was substituted by filler or when filler was added to the mix an equal amount of cement or aggregate was removed. The replacement was done by weight and thus there will be a certain deviation in volume, i.e., the mixes except the reference concrete will not add up to exact one m3. The density of the cement is 3.20, the quartz 2.65, the normal granitoid aggregate 2.65, the cristobalite 2.35, wollastonite 2.90 and nepheline syenite 2.56 g/cm3, respectively. The composition of all mixes can be found in Table 8. The cement used was a CEM I 42.5-MH/SR/LA. Normal graded glaciofluvial granitoid aggregates in two fractions, Underås 0-8 mm and Vändle 8-16 mm (57% fine and 43% coarse), and tap water were used in the concrete mixes. For some mixes, a polycarboxylate-based superplasticizer was required. When superplasticizer was used, the amount is mentioned in Table 8. Mixing order and mixing time are summarised in Chapter 4, Table 6.

Chapter 5 Results and discussion
59
Table 8: Mixture proportions for concrete specimens. All mixes based on or close to 1 m3. w/c = water/cement; w/p = water/(cement + filler). SP = PCE superplasticizer, dry content.
Cement Water Filler Aggr. w/c w/p SP Name Filler type kg kg kg kg - - kg Ref1 None 433.0 207.8 - 1672 0.48 0.48 - Ref2 None 340.7 207.8 - 1764 0.61 0.61 - Ref3 None 256.5 207.8 - 1834 0.81 0.81 - 10 Q,M300,M500, 389.8 207.8 43.2 1672 0.54 0.48 - 20 Q,M300,M500,M6000,Woll,SY 346.2 207.8 86.8 1672 0.61 0.48 - 30 Q,M300,M500 303.1 207.8 129.9 1672 0.69 0.48 - 40 Q,M300,M500,M6000,Woll,SY 259.9 207.8 173.1 1672 0.81 0.48 - 50 Q,M300,M500 216.7 207.8 216.7 1672 0.96 0.48 - 20(-) Q 346.2 166.2 86.8 1672 0.48 0.38 0.56 40(-) Q 259.9 124.6 173.1 1672 0.48 0.29 0.84 20(+) Q 433.0 209.8 86.8 1585 0.48 0.40 0.21 40(+) Q 433.0 209.8 173.1 1498 0.48 0.35 0.42 Effect of ultrafine filler material on fresh concrete properties When increasing the amount of fine particles in concrete at constant water content, the result is usually a less workable concrete. This was also observed in this test series. Table 9 shows the recorded slump values for the mixes with quartz M300, quartz M500 and wet-ground quartz. When cement is replaced by quartz M500 and wet-ground quartz Q, the measured slump value decreases. This is presumably due to the fact that these filler materials are finer than cement. The larger surface area of the filler particles increases the water requirement; but the water content in the concrete is fixed, resulting in a reduced workability. Quartz filler M300 has approximately the same fineness as cement but also when M300 is replacing cement, the slump value decreases. A possible explanation could be that the surface charge of quartz and cement are different, leading to different degrees of flocculation. The literature, e.g. Moosberg-Bustnes (2003), gives results for measurements of zeta-potentials which can be used to explain the phenomena. This work does not aim to examine the effect further. In the following, superplasticizer was used to achieve workable concrete, regardless the fineness of the added filler. Table 9: Influence of filler content on concrete slump, filler replaced cement at different rates and no superplasticizer was added.
Content of fillers in the concrete Filler 0% 10% 20% 30% 40% 50% M300 210 mm 190 mm 185 mm 180 mm 160 mm 130 mm M500 210 mm 170 mm 145 mm 105 mm 70 mm 30 mm Q 210 mm 200 mm 180 mm 170 mm 160 mm 110 mm However, a clear correlation between particle size distribution of the fillers and workability could be seen. The finer a material, the lower the recorded slump value at the same level of cement replacement.
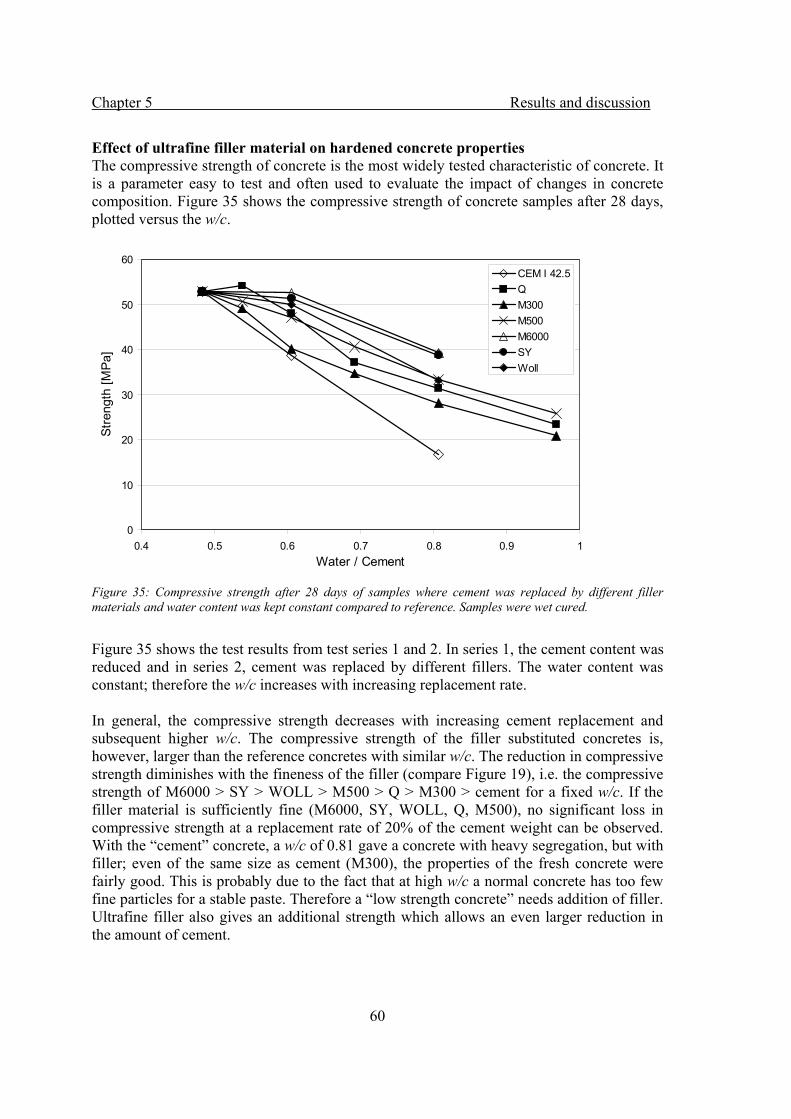
Chapter 5 Results and discussion
60
Effect of ultrafine filler material on hardened concrete properties The compressive strength of concrete is the most widely tested characteristic of concrete. It is a parameter easy to test and often used to evaluate the impact of changes in concrete composition. Figure 35 shows the compressive strength of concrete samples after 28 days, plotted versus the w/c.
Figure 35: Compressive strength after 28 days of samples where cement was replaced by different filler materials and water content was kept constant compared to reference. Samples were wet cured.
Figure 35 shows the test results from test series 1 and 2. In series 1, the cement content was reduced and in series 2, cement was replaced by different fillers. The water content was constant; therefore the w/c increases with increasing replacement rate. In general, the compressive strength decreases with increasing cement replacement and subsequent higher w/c. The compressive strength of the filler substituted concretes is, however, larger than the reference concretes with similar w/c. The reduction in compressive strength diminishes with the fineness of the filler (compare Figure 19), i.e. the compressive strength of M6000 > SY > WOLL > M500 > Q > M300 > cement for a fixed w/c. If the filler material is sufficiently fine (M6000, SY, WOLL, Q, M500), no significant loss in compressive strength at a replacement rate of 20% of the cement weight can be observed. With the “cement” concrete, a w/c of 0.81 gave a concrete with heavy segregation, but with filler; even of the same size as cement (M300), the properties of the fresh concrete were fairly good. This is probably due to the fact that at high w/c a normal concrete has too few fine particles for a stable paste. Therefore a “low strength concrete” needs addition of filler. Ultrafine filler also gives an additional strength which allows an even larger reduction in the amount of cement.
0
10
20
30
40
50
60
0.4 0.5 0.6 0.7 0.8 0.9 1Water / Cement
Stre
ngth
[MPa
]
CEM I 42.5Q M300M500M6000SYWoll
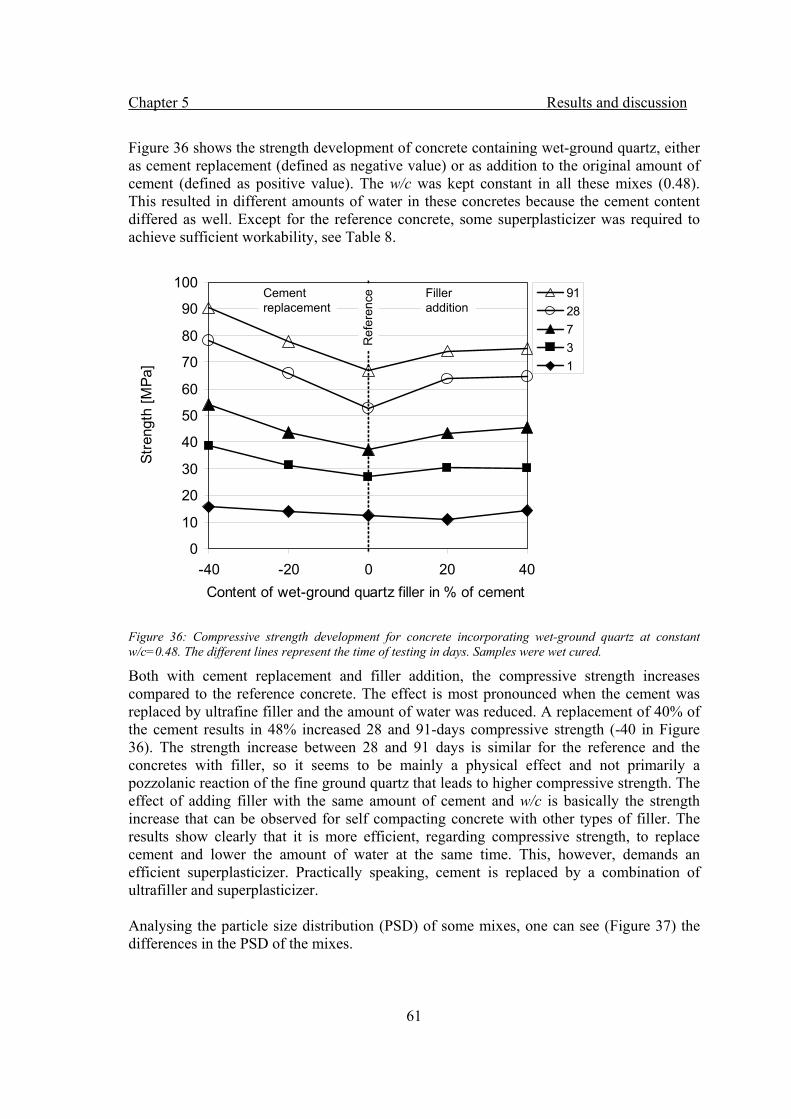
Chapter 5 Results and discussion
61
Figure 36 shows the strength development of concrete containing wet-ground quartz, either as cement replacement (defined as negative value) or as addition to the original amount of cement (defined as positive value). The w/c was kept constant in all these mixes (0.48). This resulted in different amounts of water in these concretes because the cement content differed as well. Except for the reference concrete, some superplasticizer was required to achieve sufficient workability, see Table 8.
Figure 36: Compressive strength development for concrete incorporating wet-ground quartz at constant w/c=0.48. The different lines represent the time of testing in days. Samples were wet cured.
Both with cement replacement and filler addition, the compressive strength increases compared to the reference concrete. The effect is most pronounced when the cement was replaced by ultrafine filler and the amount of water was reduced. A replacement of 40% of the cement results in 48% increased 28 and 91-days compressive strength (-40 in Figure 36). The strength increase between 28 and 91 days is similar for the reference and the concretes with filler, so it seems to be mainly a physical effect and not primarily a pozzolanic reaction of the fine ground quartz that leads to higher compressive strength. The effect of adding filler with the same amount of cement and w/c is basically the strength increase that can be observed for self compacting concrete with other types of filler. The results show clearly that it is more efficient, regarding compressive strength, to replace cement and lower the amount of water at the same time. This, however, demands an efficient superplasticizer. Practically speaking, cement is replaced by a combination of ultrafiller and superplasticizer. Analysing the particle size distribution (PSD) of some mixes, one can see (Figure 37) the differences in the PSD of the mixes.
0
10
20
30
40
50
60
70
80
90
100
-40 -20 0 20 40Content of wet-ground quartz filler in % of cement
Stre
ngth
[MPa
]
9128731
Cementreplacement
Filler addition
Ref
eren
ce
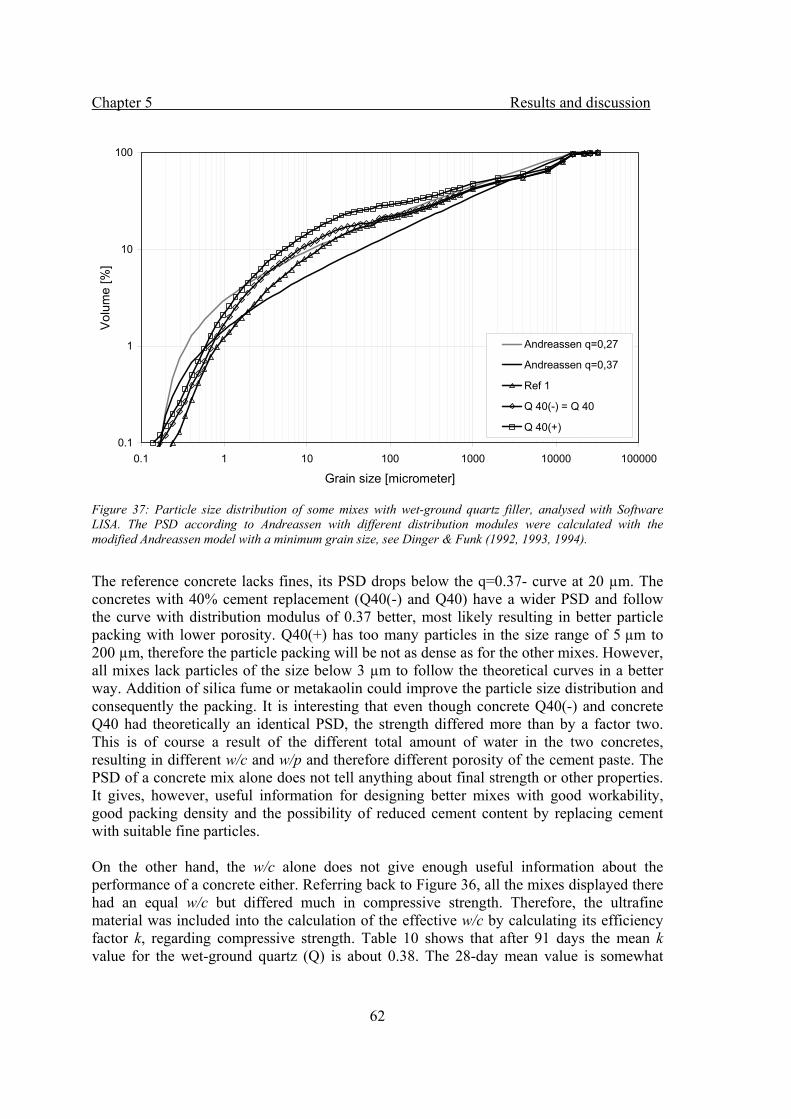
Chapter 5 Results and discussion
62
Figure 37: Particle size distribution of some mixes with wet-ground quartz filler, analysed with Software LISA. The PSD according to Andreassen with different distribution modules were calculated with the modified Andreassen model with a minimum grain size, see Dinger & Funk (1992, 1993, 1994).
The reference concrete lacks fines, its PSD drops below the q=0.37- curve at 20 µm. The concretes with 40% cement replacement (Q40(-) and Q40) have a wider PSD and follow the curve with distribution modulus of 0.37 better, most likely resulting in better particle packing with lower porosity. Q40(+) has too many particles in the size range of 5 µm to 200 µm, therefore the particle packing will be not as dense as for the other mixes. However, all mixes lack particles of the size below 3 µm to follow the theoretical curves in a better way. Addition of silica fume or metakaolin could improve the particle size distribution and consequently the packing. It is interesting that even though concrete Q40(-) and concrete Q40 had theoretically an identical PSD, the strength differed more than by a factor two. This is of course a result of the different total amount of water in the two concretes, resulting in different w/c and w/p and therefore different porosity of the cement paste. The PSD of a concrete mix alone does not tell anything about final strength or other properties. It gives, however, useful information for designing better mixes with good workability, good packing density and the possibility of reduced cement content by replacing cement with suitable fine particles. On the other hand, the w/c alone does not give enough useful information about the performance of a concrete either. Referring back to Figure 36, all the mixes displayed there had an equal w/c but differed much in compressive strength. Therefore, the ultrafine material was included into the calculation of the effective w/c by calculating its efficiency factor k, regarding compressive strength. Table 10 shows that after 91 days the mean k value for the wet-ground quartz (Q) is about 0.38. The 28-day mean value is somewhat
0.1
1
10
100
0.1 1 10 100 1000 10000 100000
Grain size [micrometer]
Vol
ume
[%]
Andreassen q=0,27
Andreassen q=0,37
Ref 1
Q 40(-) = Q 40
Q 40(+)
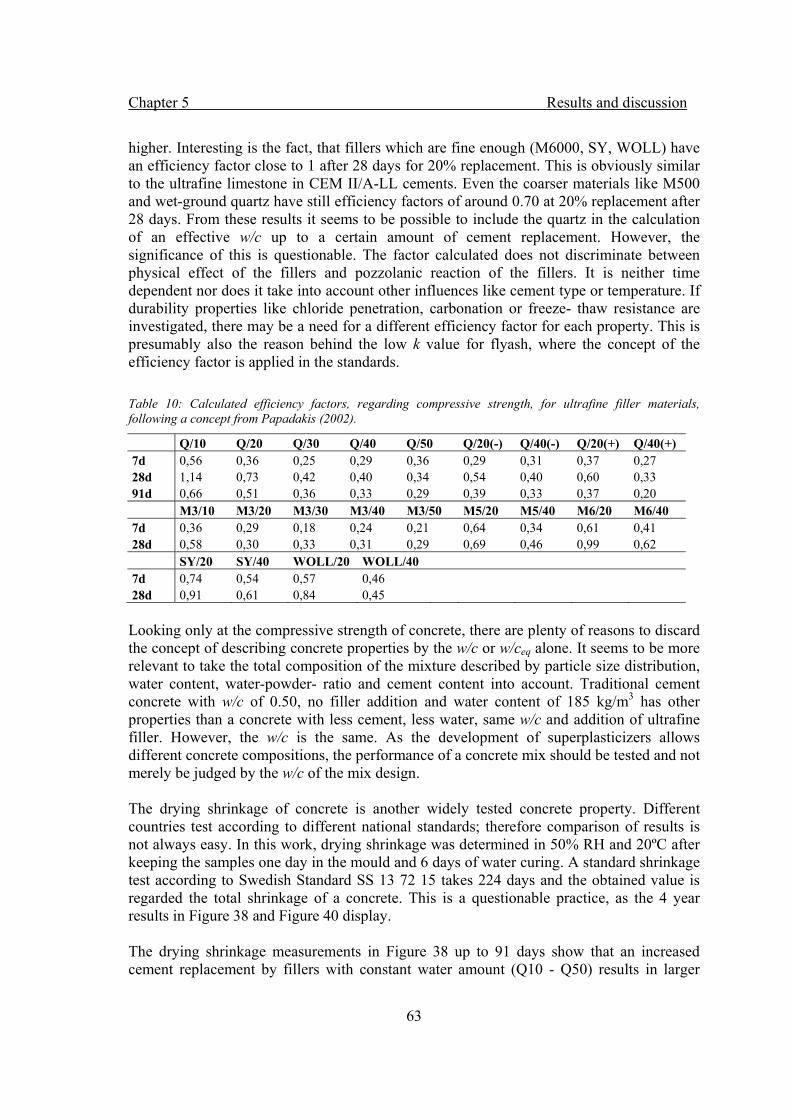
Chapter 5 Results and discussion
63
higher. Interesting is the fact, that fillers which are fine enough (M6000, SY, WOLL) have an efficiency factor close to 1 after 28 days for 20% replacement. This is obviously similar to the ultrafine limestone in CEM II/A-LL cements. Even the coarser materials like M500 and wet-ground quartz have still efficiency factors of around 0.70 at 20% replacement after 28 days. From these results it seems to be possible to include the quartz in the calculation of an effective w/c up to a certain amount of cement replacement. However, the significance of this is questionable. The factor calculated does not discriminate between physical effect of the fillers and pozzolanic reaction of the fillers. It is neither time dependent nor does it take into account other influences like cement type or temperature. If durability properties like chloride penetration, carbonation or freeze- thaw resistance are investigated, there may be a need for a different efficiency factor for each property. This is presumably also the reason behind the low k value for flyash, where the concept of the efficiency factor is applied in the standards. Table 10: Calculated efficiency factors, regarding compressive strength, for ultrafine filler materials, following a concept from Papadakis (2002).
Q/10 Q/20 Q/30 Q/40 Q/50 Q/20(-) Q/40(-) Q/20(+) Q/40(+) 7d 0,56 0,36 0,25 0,29 0,36 0,29 0,31 0,37 0,27 28d 1,14 0,73 0,42 0,40 0,34 0,54 0,40 0,60 0,33 91d 0,66 0,51 0,36 0,33 0,29 0,39 0,33 0,37 0,20 M3/10 M3/20 M3/30 M3/40 M3/50 M5/20 M5/40 M6/20 M6/40 7d 0,36 0,29 0,18 0,24 0,21 0,64 0,34 0,61 0,41 28d 0,58 0,30 0,33 0,31 0,29 0,69 0,46 0,99 0,62 SY/20 SY/40 WOLL/20 WOLL/40 7d 0,74 0,54 0,57 0,46 28d 0,91 0,61 0,84 0,45 Looking only at the compressive strength of concrete, there are plenty of reasons to discard the concept of describing concrete properties by the w/c or w/ceq alone. It seems to be more relevant to take the total composition of the mixture described by particle size distribution, water content, water-powder- ratio and cement content into account. Traditional cement concrete with w/c of 0.50, no filler addition and water content of 185 kg/m3 has other properties than a concrete with less cement, less water, same w/c and addition of ultrafine filler. However, the w/c is the same. As the development of superplasticizers allows different concrete compositions, the performance of a concrete mix should be tested and not merely be judged by the w/c of the mix design. The drying shrinkage of concrete is another widely tested concrete property. Different countries test according to different national standards; therefore comparison of results is not always easy. In this work, drying shrinkage was determined in 50% RH and 20ºC after keeping the samples one day in the mould and 6 days of water curing. A standard shrinkage test according to Swedish Standard SS 13 72 15 takes 224 days and the obtained value is regarded the total shrinkage of a concrete. This is a questionable practice, as the 4 year results in Figure 38 and Figure 40 display. The drying shrinkage measurements in Figure 38 up to 91 days show that an increased cement replacement by fillers with constant water amount (Q10 - Q50) results in larger
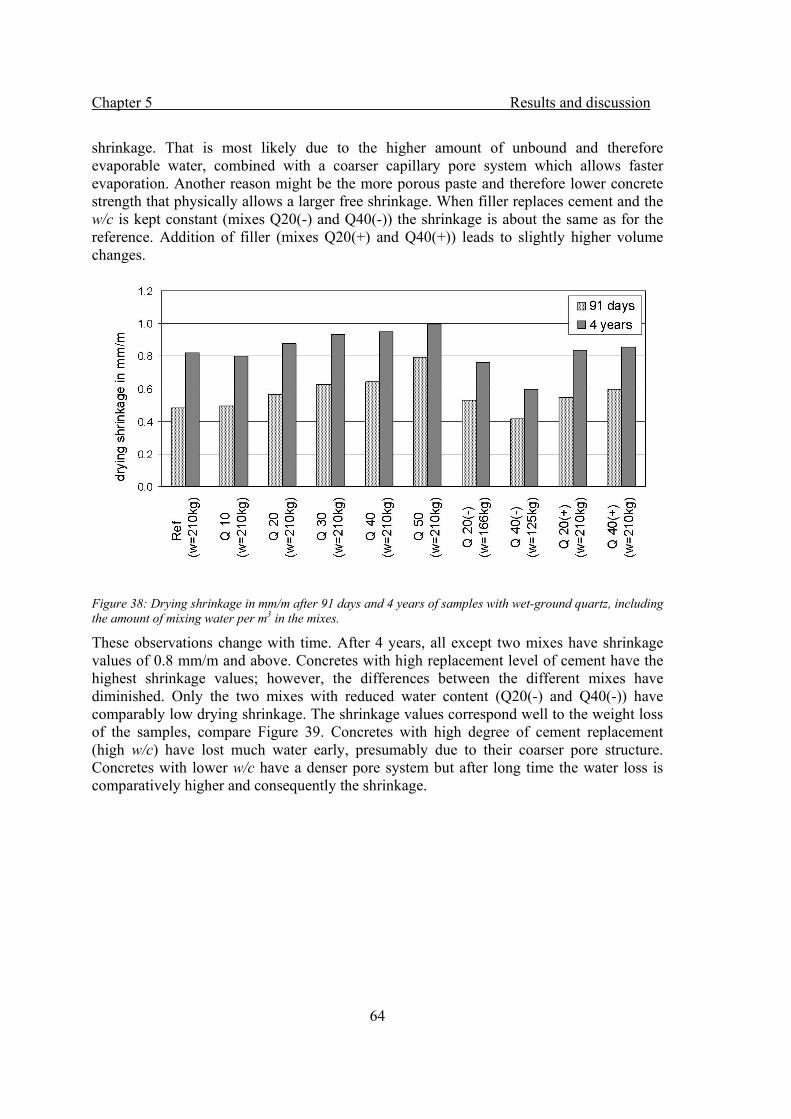
Chapter 5 Results and discussion
64
shrinkage. That is most likely due to the higher amount of unbound and therefore evaporable water, combined with a coarser capillary pore system which allows faster evaporation. Another reason might be the more porous paste and therefore lower concrete strength that physically allows a larger free shrinkage. When filler replaces cement and the w/c is kept constant (mixes Q20(-) and Q40(-)) the shrinkage is about the same as for the reference. Addition of filler (mixes Q20(+) and Q40(+)) leads to slightly higher volume changes.
Figure 38: Drying shrinkage in mm/m after 91 days and 4 years of samples with wet-ground quartz, including the amount of mixing water per m3 in the mixes.
These observations change with time. After 4 years, all except two mixes have shrinkage values of 0.8 mm/m and above. Concretes with high replacement level of cement have the highest shrinkage values; however, the differences between the different mixes have diminished. Only the two mixes with reduced water content (Q20(-) and Q40(-)) have comparably low drying shrinkage. The shrinkage values correspond well to the weight loss of the samples, compare Figure 39. Concretes with high degree of cement replacement (high w/c) have lost much water early, presumably due to their coarser pore structure. Concretes with lower w/c have a denser pore system but after long time the water loss is comparatively higher and consequently the shrinkage.
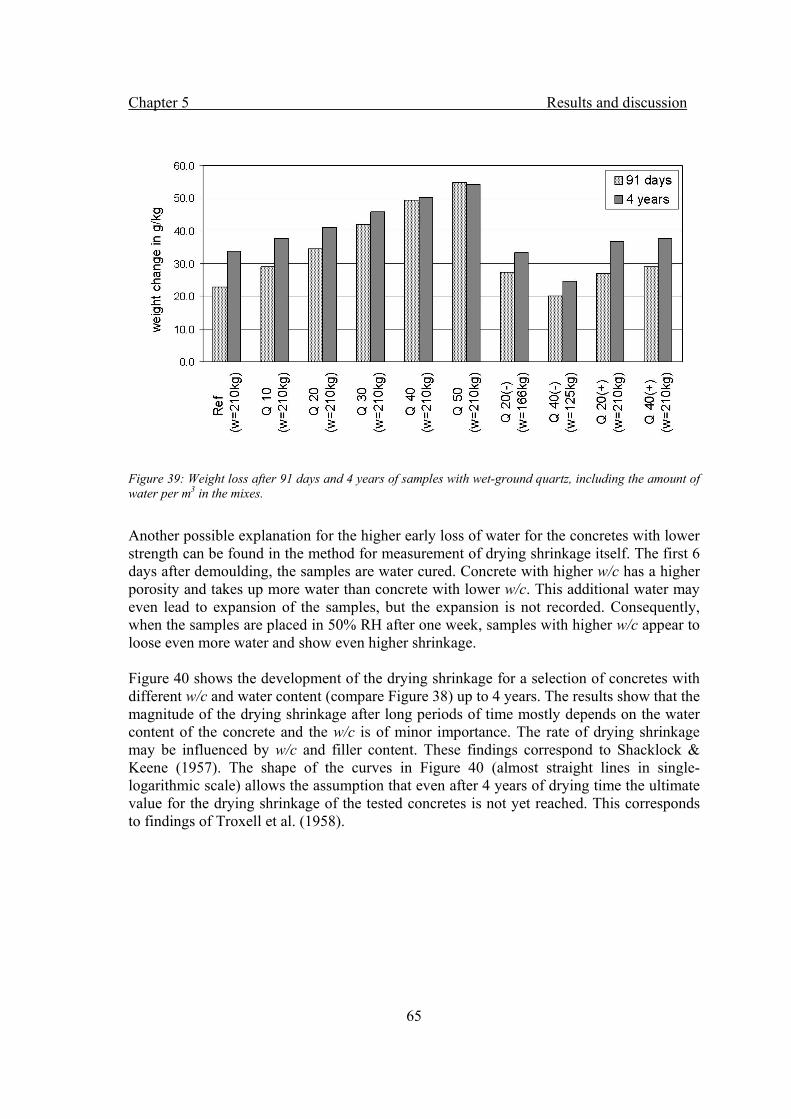
Chapter 5 Results and discussion
65
Figure 39: Weight loss after 91 days and 4 years of samples with wet-ground quartz, including the amount of water per m3 in the mixes.
Another possible explanation for the higher early loss of water for the concretes with lower strength can be found in the method for measurement of drying shrinkage itself. The first 6 days after demoulding, the samples are water cured. Concrete with higher w/c has a higher porosity and takes up more water than concrete with lower w/c. This additional water may even lead to expansion of the samples, but the expansion is not recorded. Consequently, when the samples are placed in 50% RH after one week, samples with higher w/c appear to loose even more water and show even higher shrinkage. Figure 40 shows the development of the drying shrinkage for a selection of concretes with different w/c and water content (compare Figure 38) up to 4 years. The results show that the magnitude of the drying shrinkage after long periods of time mostly depends on the water content of the concrete and the w/c is of minor importance. The rate of drying shrinkage may be influenced by w/c and filler content. These findings correspond to Shacklock & Keene (1957). The shape of the curves in Figure 40 (almost straight lines in single-logarithmic scale) allows the assumption that even after 4 years of drying time the ultimate value for the drying shrinkage of the tested concretes is not yet reached. This corresponds to findings of Troxell et al. (1958).
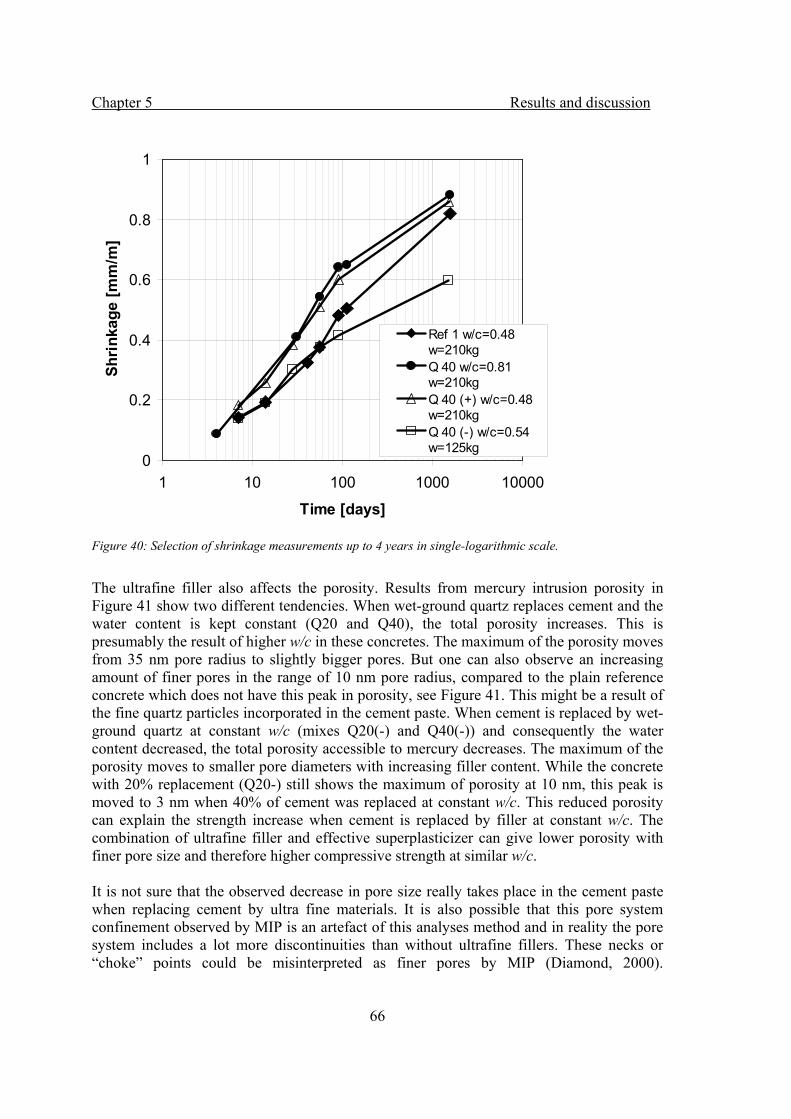
Chapter 5 Results and discussion
66
Figure 40: Selection of shrinkage measurements up to 4 years in single-logarithmic scale.
The ultrafine filler also affects the porosity. Results from mercury intrusion porosity in Figure 41 show two different tendencies. When wet-ground quartz replaces cement and the water content is kept constant (Q20 and Q40), the total porosity increases. This is presumably the result of higher w/c in these concretes. The maximum of the porosity moves from 35 nm pore radius to slightly bigger pores. But one can also observe an increasing amount of finer pores in the range of 10 nm pore radius, compared to the plain reference concrete which does not have this peak in porosity, see Figure 41. This might be a result of the fine quartz particles incorporated in the cement paste. When cement is replaced by wet-ground quartz at constant w/c (mixes Q20(-) and Q40(-)) and consequently the water content decreased, the total porosity accessible to mercury decreases. The maximum of the porosity moves to smaller pore diameters with increasing filler content. While the concrete with 20% replacement (Q20-) still shows the maximum of porosity at 10 nm, this peak is moved to 3 nm when 40% of cement was replaced at constant w/c. This reduced porosity can explain the strength increase when cement is replaced by filler at constant w/c. The combination of ultrafine filler and effective superplasticizer can give lower porosity with finer pore size and therefore higher compressive strength at similar w/c. It is not sure that the observed decrease in pore size really takes place in the cement paste when replacing cement by ultra fine materials. It is also possible that this pore system confinement observed by MIP is an artefact of this analyses method and in reality the pore system includes a lot more discontinuities than without ultrafine fillers. These necks or “choke” points could be misinterpreted as finer pores by MIP (Diamond, 2000).
0
0.2
0.4
0.6
0.8
1
1 10 100 1000 10000
Time [days]
Shri
nkag
e [m
m/m
]
Ref 1 w/c=0.48w=210kgQ 40 w/c=0.81w=210kgQ 40 (+) w/c=0.48w=210kgQ 40 (-) w/c=0.54w=125kg
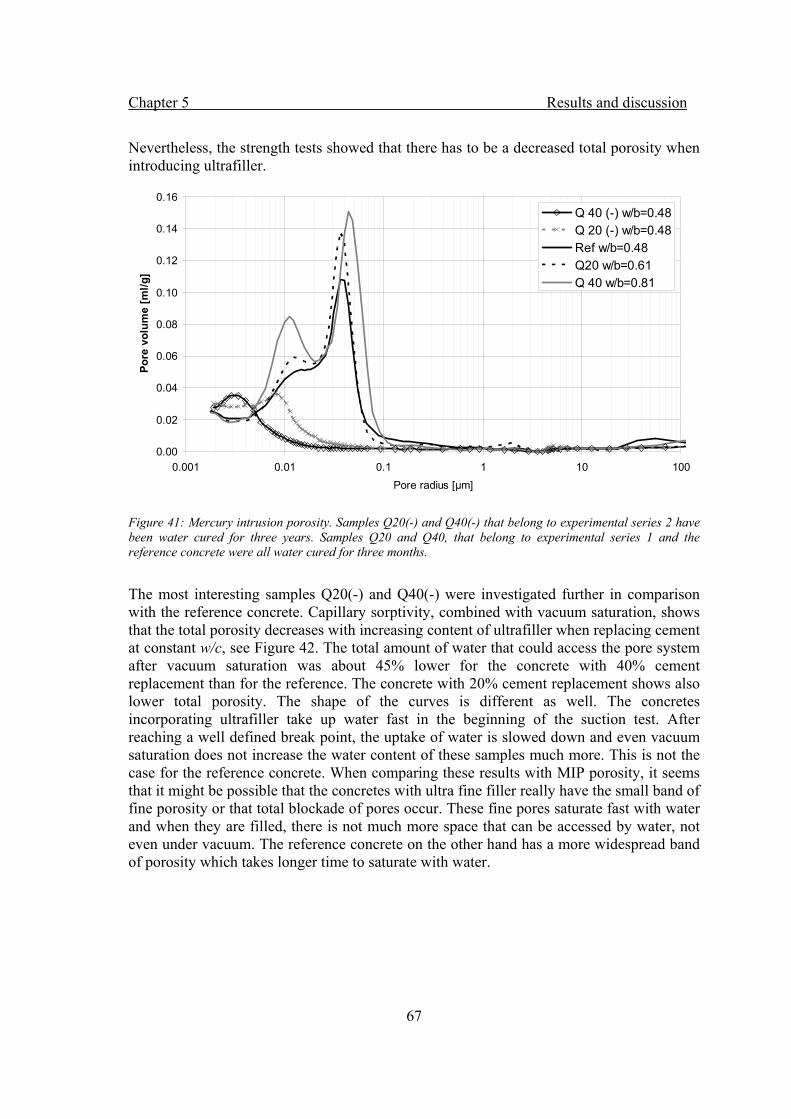
Chapter 5 Results and discussion
67
Nevertheless, the strength tests showed that there has to be a decreased total porosity when introducing ultrafiller.
Figure 41: Mercury intrusion porosity. Samples Q20(-) and Q40(-) that belong to experimental series 2 have been water cured for three years. Samples Q20 and Q40, that belong to experimental series 1 and the reference concrete were all water cured for three months.
The most interesting samples Q20(-) and Q40(-) were investigated further in comparison with the reference concrete. Capillary sorptivity, combined with vacuum saturation, shows that the total porosity decreases with increasing content of ultrafiller when replacing cement at constant w/c, see Figure 42. The total amount of water that could access the pore system after vacuum saturation was about 45% lower for the concrete with 40% cement replacement than for the reference. The concrete with 20% cement replacement shows also lower total porosity. The shape of the curves is different as well. The concretes incorporating ultrafiller take up water fast in the beginning of the suction test. After reaching a well defined break point, the uptake of water is slowed down and even vacuum saturation does not increase the water content of these samples much more. This is not the case for the reference concrete. When comparing these results with MIP porosity, it seems that it might be possible that the concretes with ultra fine filler really have the small band of fine porosity or that total blockade of pores occur. These fine pores saturate fast with water and when they are filled, there is not much more space that can be accessed by water, not even under vacuum. The reference concrete on the other hand has a more widespread band of porosity which takes longer time to saturate with water.
0.00
0.02
0.04
0.06
0.08
0.10
0.12
0.14
0.16
0.001 0.01 0.1 1 10 100Pore radius [μm]
Pore
vol
ume
[ml/g
]
Q 40 (-) w/b=0.48Q 20 (-) w/b=0.48Ref w/b=0.48Q20 w/b=0.61Q 40 w/b=0.81
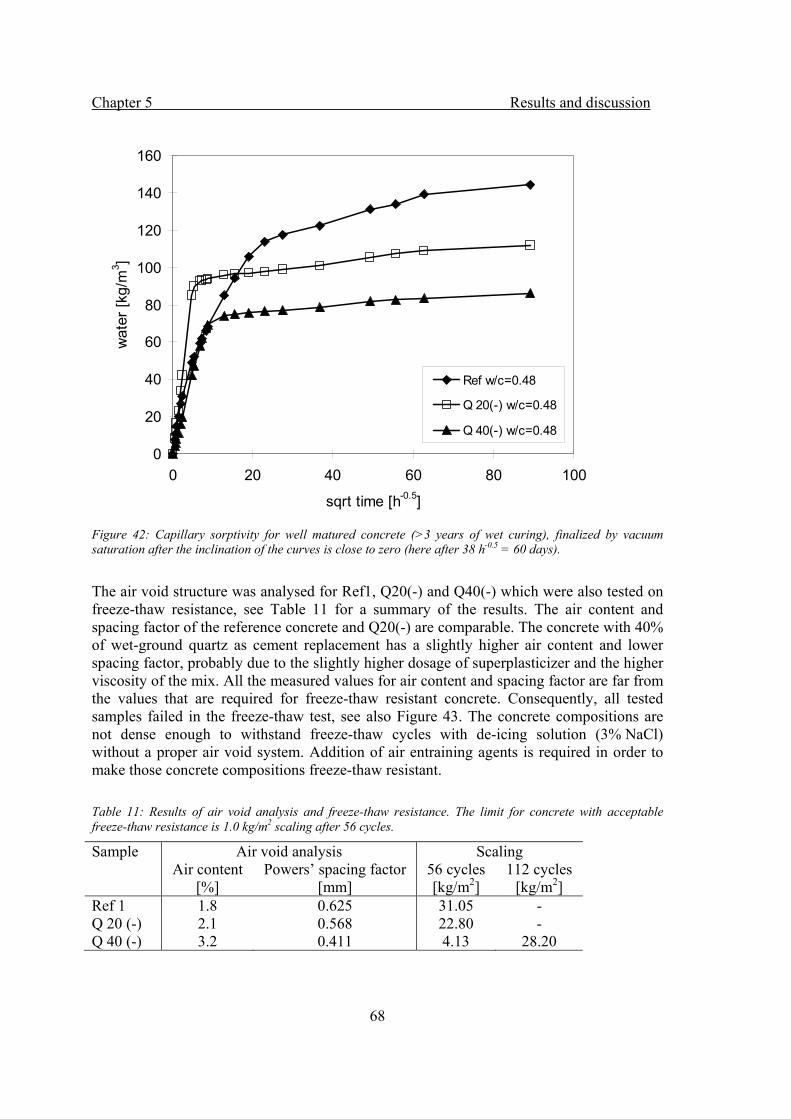
Chapter 5 Results and discussion
68
Figure 42: Capillary sorptivity for well matured concrete (>3 years of wet curing), finalized by vacuum saturation after the inclination of the curves is close to zero (here after 38 h-0.5 = 60 days).
The air void structure was analysed for Ref1, Q20(-) and Q40(-) which were also tested on freeze-thaw resistance, see Table 11 for a summary of the results. The air content and spacing factor of the reference concrete and Q20(-) are comparable. The concrete with 40% of wet-ground quartz as cement replacement has a slightly higher air content and lower spacing factor, probably due to the slightly higher dosage of superplasticizer and the higher viscosity of the mix. All the measured values for air content and spacing factor are far from the values that are required for freeze-thaw resistant concrete. Consequently, all tested samples failed in the freeze-thaw test, see also Figure 43. The concrete compositions are not dense enough to withstand freeze-thaw cycles with de-icing solution (3% NaCl) without a proper air void system. Addition of air entraining agents is required in order to make those concrete compositions freeze-thaw resistant. Table 11: Results of air void analysis and freeze-thaw resistance. The limit for concrete with acceptable freeze-thaw resistance is 1.0 kg/m2 scaling after 56 cycles.
Sample Air void analysis Scaling Air content
[%] Powers’ spacing factor
[mm] 56 cycles [kg/m2]
112 cycles [kg/m2]
Ref 1 1.8 0.625 31.05 - Q 20 (-) 2.1 0.568 22.80 - Q 40 (-) 3.2 0.411 4.13 28.20
0
20
40
60
80
100
120
140
160
0 20 40 60 80 100
sqrt time [h-0.5]
wat
er [k
g/m
3 ]
Ref w/c=0.48
Q 20(-) w/c=0.48
Q 40(-) w/c=0.48
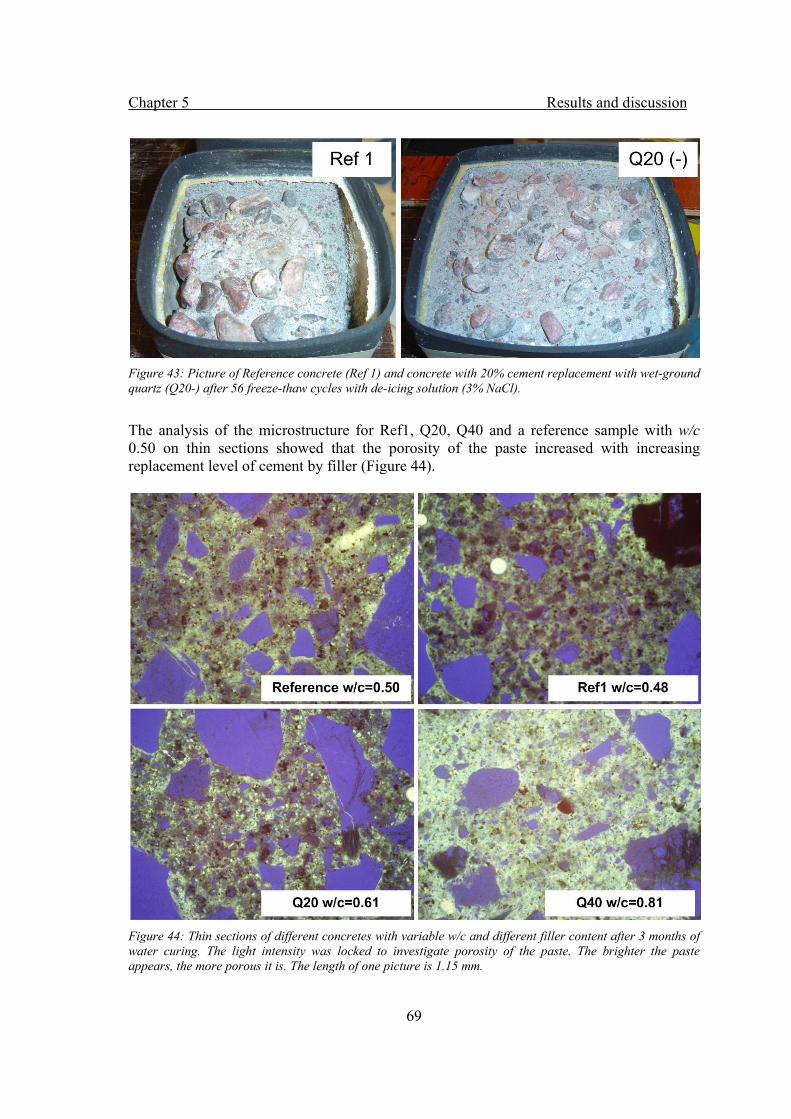
Chapter 5 Results and discussion
69
Figure 43: Picture of Reference concrete (Ref 1) and concrete with 20% cement replacement with wet-ground quartz (Q20-) after 56 freeze-thaw cycles with de-icing solution (3% NaCl).
The analysis of the microstructure for Ref1, Q20, Q40 and a reference sample with w/c 0.50 on thin sections showed that the porosity of the paste increased with increasing replacement level of cement by filler (Figure 44).
Figure 44: Thin sections of different concretes with variable w/c and different filler content after 3 months of water curing. The light intensity was locked to investigate porosity of the paste. The brighter the paste appears, the more porous it is. The length of one picture is 1.15 mm.
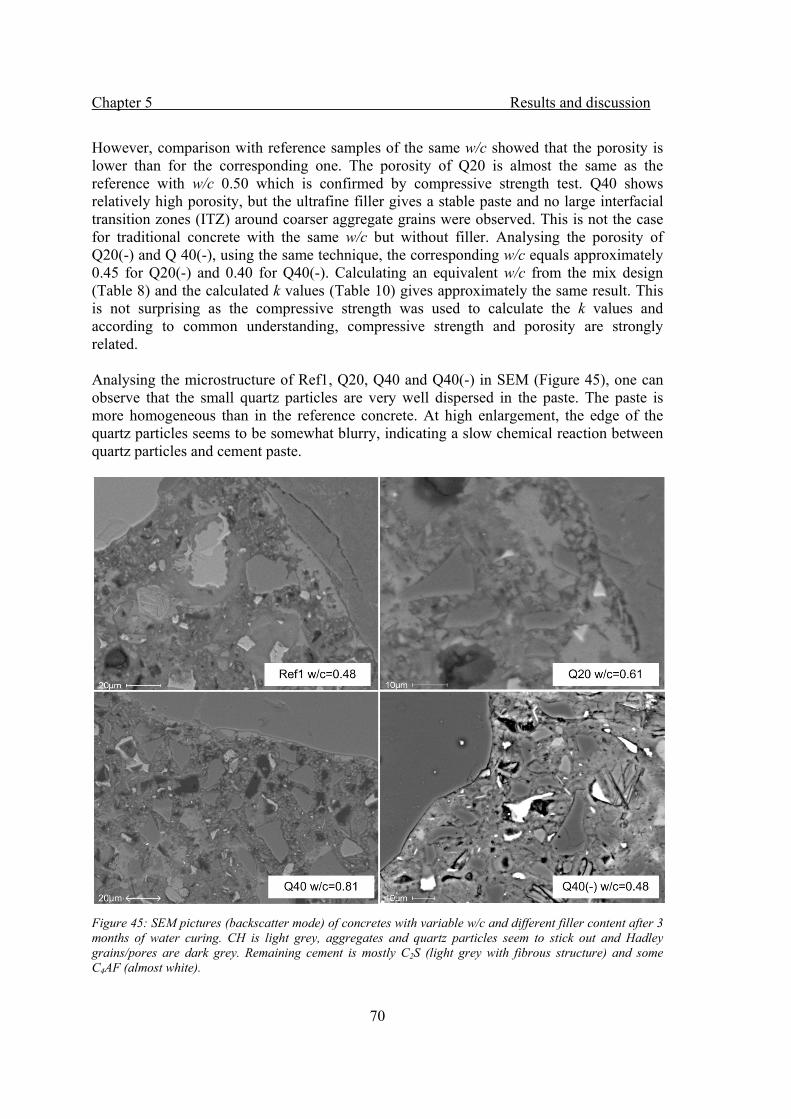
Chapter 5 Results and discussion
70
However, comparison with reference samples of the same w/c showed that the porosity is lower than for the corresponding one. The porosity of Q20 is almost the same as the reference with w/c 0.50 which is confirmed by compressive strength test. Q40 shows relatively high porosity, but the ultrafine filler gives a stable paste and no large interfacial transition zones (ITZ) around coarser aggregate grains were observed. This is not the case for traditional concrete with the same w/c but without filler. Analysing the porosity of Q20(-) and Q 40(-), using the same technique, the corresponding w/c equals approximately 0.45 for Q20(-) and 0.40 for Q40(-). Calculating an equivalent w/c from the mix design (Table 8) and the calculated k values (Table 10) gives approximately the same result. This is not surprising as the compressive strength was used to calculate the k values and according to common understanding, compressive strength and porosity are strongly related. Analysing the microstructure of Ref1, Q20, Q40 and Q40(-) in SEM (Figure 45), one can observe that the small quartz particles are very well dispersed in the paste. The paste is more homogeneous than in the reference concrete. At high enlargement, the edge of the quartz particles seems to be somewhat blurry, indicating a slow chemical reaction between quartz particles and cement paste.
Figure 45: SEM pictures (backscatter mode) of concretes with variable w/c and different filler content after 3 months of water curing. CH is light grey, aggregates and quartz particles seem to stick out and Hadley grains/pores are dark grey. Remaining cement is mostly C2S (light grey with fibrous structure) and some C4AF (almost white).
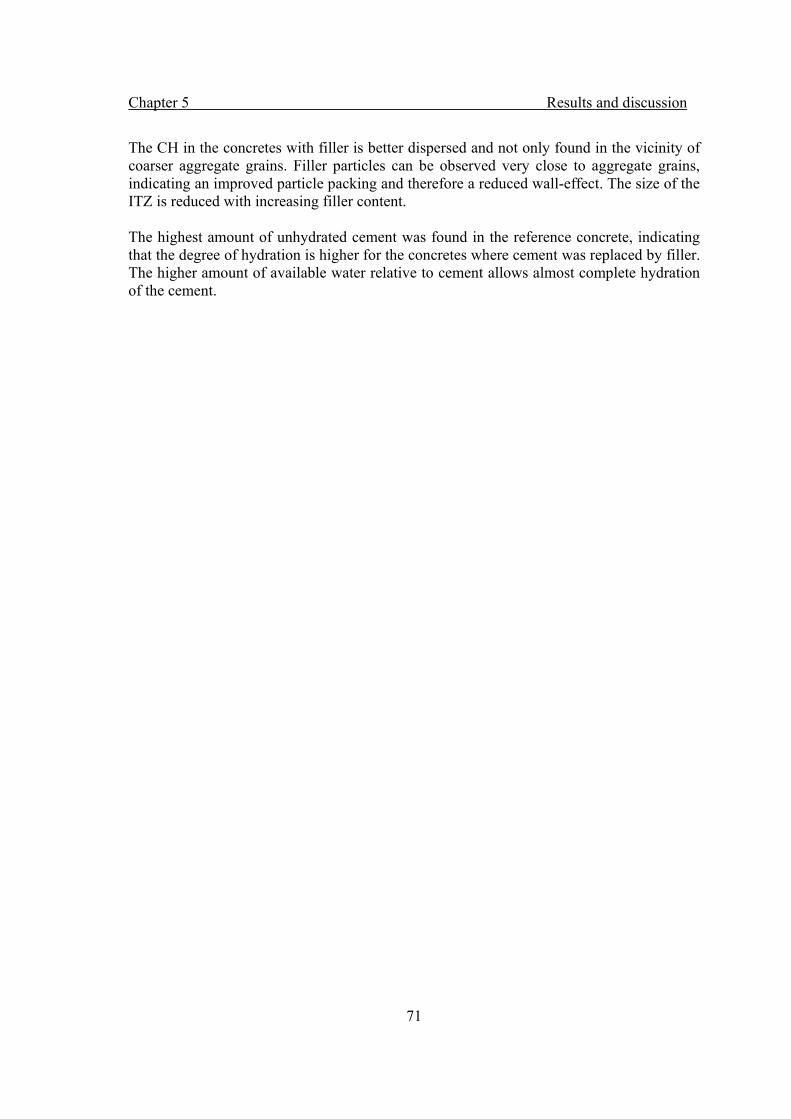
Chapter 5 Results and discussion
71
The CH in the concretes with filler is better dispersed and not only found in the vicinity of coarser aggregate grains. Filler particles can be observed very close to aggregate grains, indicating an improved particle packing and therefore a reduced wall-effect. The size of the ITZ is reduced with increasing filler content. The highest amount of unhydrated cement was found in the reference concrete, indicating that the degree of hydration is higher for the concretes where cement was replaced by filler. The higher amount of available water relative to cement allows almost complete hydration of the cement.
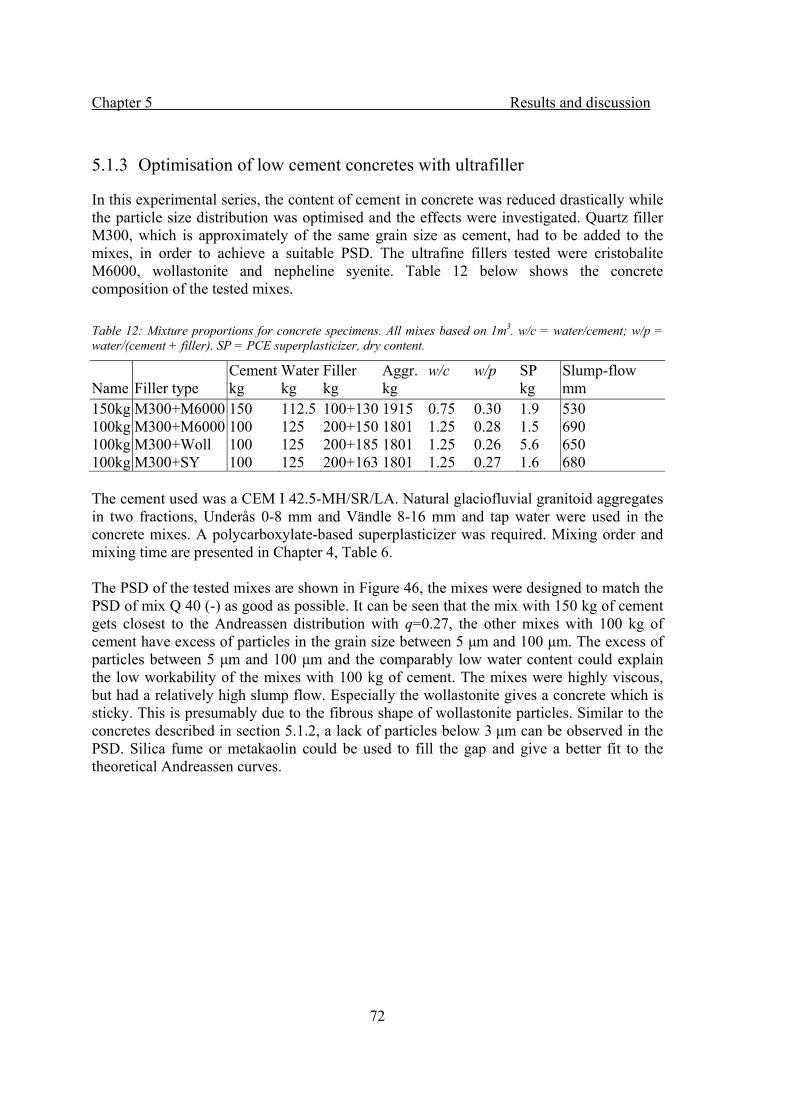
Chapter 5 Results and discussion
72
5.1.3 Optimisation of low cement concretes with ultrafiller
In this experimental series, the content of cement in concrete was reduced drastically while the particle size distribution was optimised and the effects were investigated. Quartz filler M300, which is approximately of the same grain size as cement, had to be added to the mixes, in order to achieve a suitable PSD. The ultrafine fillers tested were cristobalite M6000, wollastonite and nepheline syenite. Table 12 below shows the concrete composition of the tested mixes. Table 12: Mixture proportions for concrete specimens. All mixes based on 1m3. w/c = water/cement; w/p = water/(cement + filler). SP = PCE superplasticizer, dry content.
Cement Water Filler Aggr. w/c w/p SP Slump-flow Name Filler type kg kg kg kg kg mm 150kg M300+M6000 150 112.5 100+130 1915 0.75 0.30 1.9 530 100kg M300+M6000 100 125 200+150 1801 1.25 0.28 1.5 690 100kg M300+Woll 100 125 200+185 1801 1.25 0.26 5.6 650 100kg M300+SY 100 125 200+163 1801 1.25 0.27 1.6 680 The cement used was a CEM I 42.5-MH/SR/LA. Natural glaciofluvial granitoid aggregates in two fractions, Underås 0-8 mm and Vändle 8-16 mm and tap water were used in the concrete mixes. A polycarboxylate-based superplasticizer was required. Mixing order and mixing time are presented in Chapter 4, Table 6. The PSD of the tested mixes are shown in Figure 46, the mixes were designed to match the PSD of mix Q 40 (-) as good as possible. It can be seen that the mix with 150 kg of cement gets closest to the Andreassen distribution with q=0.27, the other mixes with 100 kg of cement have excess of particles in the grain size between 5 μm and 100 μm. The excess of particles between 5 μm and 100 μm and the comparably low water content could explain the low workability of the mixes with 100 kg of cement. The mixes were highly viscous, but had a relatively high slump flow. Especially the wollastonite gives a concrete which is sticky. This is presumably due to the fibrous shape of wollastonite particles. Similar to the concretes described in section 5.1.2, a lack of particles below 3 μm can be observed in the PSD. Silica fume or metakaolin could be used to fill the gap and give a better fit to the theoretical Andreassen curves.
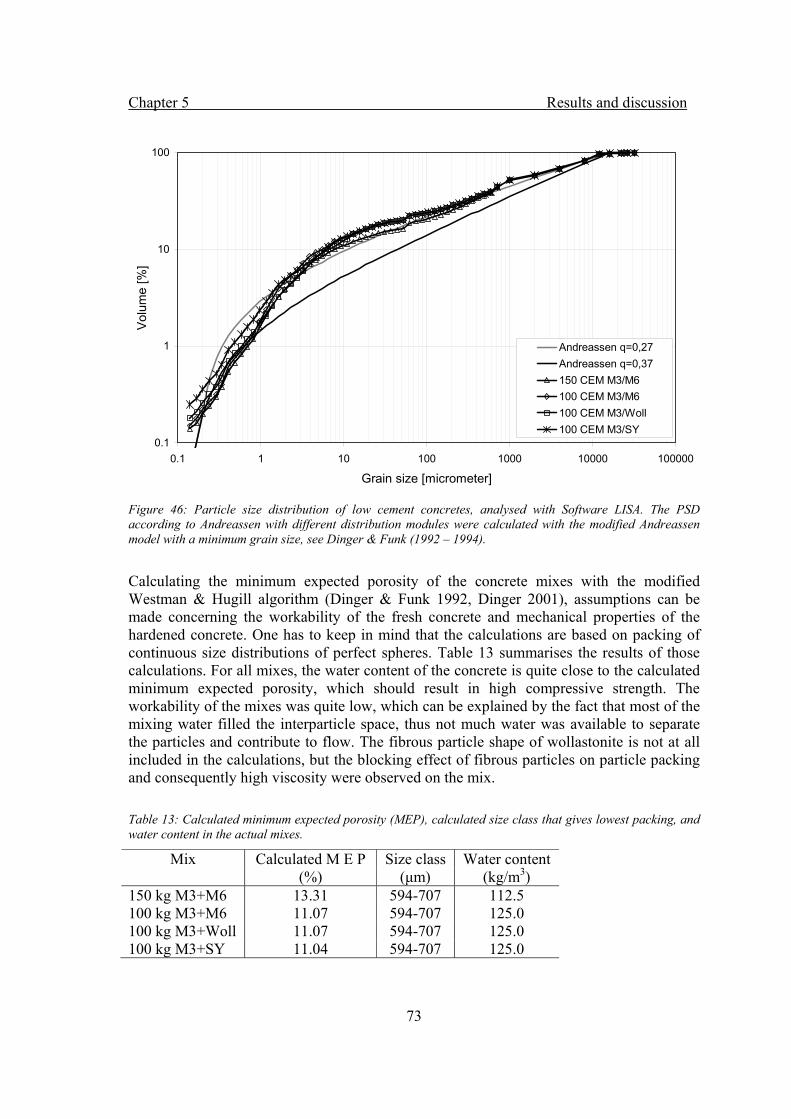
Chapter 5 Results and discussion
73
Figure 46: Particle size distribution of low cement concretes, analysed with Software LISA. The PSD according to Andreassen with different distribution modules were calculated with the modified Andreassen model with a minimum grain size, see Dinger & Funk (1992 – 1994).
Calculating the minimum expected porosity of the concrete mixes with the modified Westman & Hugill algorithm (Dinger & Funk 1992, Dinger 2001), assumptions can be made concerning the workability of the fresh concrete and mechanical properties of the hardened concrete. One has to keep in mind that the calculations are based on packing of continuous size distributions of perfect spheres. Table 13 summarises the results of those calculations. For all mixes, the water content of the concrete is quite close to the calculated minimum expected porosity, which should result in high compressive strength. The workability of the mixes was quite low, which can be explained by the fact that most of the mixing water filled the interparticle space, thus not much water was available to separate the particles and contribute to flow. The fibrous particle shape of wollastonite is not at all included in the calculations, but the blocking effect of fibrous particles on particle packing and consequently high viscosity were observed on the mix. Table 13: Calculated minimum expected porosity (MEP), calculated size class that gives lowest packing, and water content in the actual mixes.
Mix Calculated M E P Size class Water content (%) (μm) (kg/m3)
150 kg M3+M6 13.31 594-707 112.5 100 kg M3+M6 11.07 594-707 125.0 100 kg M3+Woll 11.07 594-707 125.0 100 kg M3+SY 11.04 594-707 125.0
0.1
1
10
100
0.1 1 10 100 1000 10000 100000
Grain size [micrometer]
Vol
ume
[%]
Andreassen q=0,27Andreassen q=0,37150 CEM M3/M6100 CEM M3/M6100 CEM M3/Woll100 CEM M3/SY
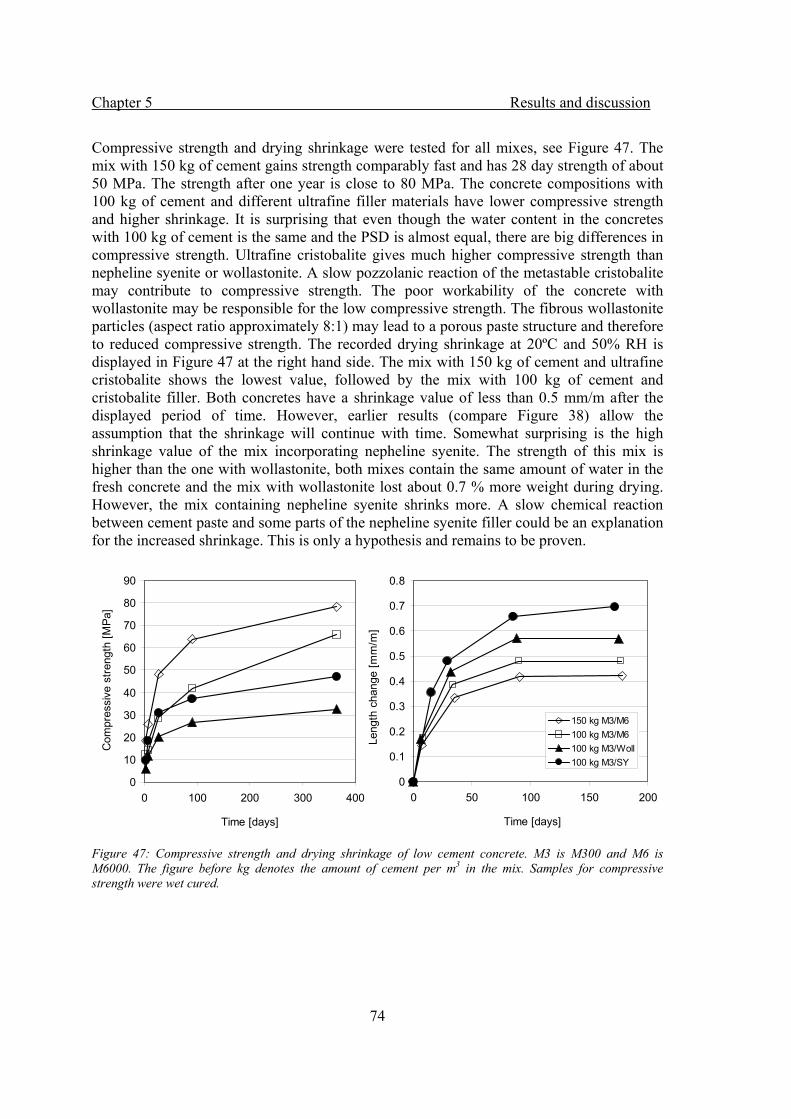
Chapter 5 Results and discussion
74
Compressive strength and drying shrinkage were tested for all mixes, see Figure 47. The mix with 150 kg of cement gains strength comparably fast and has 28 day strength of about 50 MPa. The strength after one year is close to 80 MPa. The concrete compositions with 100 kg of cement and different ultrafine filler materials have lower compressive strength and higher shrinkage. It is surprising that even though the water content in the concretes with 100 kg of cement is the same and the PSD is almost equal, there are big differences in compressive strength. Ultrafine cristobalite gives much higher compressive strength than nepheline syenite or wollastonite. A slow pozzolanic reaction of the metastable cristobalite may contribute to compressive strength. The poor workability of the concrete with wollastonite may be responsible for the low compressive strength. The fibrous wollastonite particles (aspect ratio approximately 8:1) may lead to a porous paste structure and therefore to reduced compressive strength. The recorded drying shrinkage at 20ºC and 50% RH is displayed in Figure 47 at the right hand side. The mix with 150 kg of cement and ultrafine cristobalite shows the lowest value, followed by the mix with 100 kg of cement and cristobalite filler. Both concretes have a shrinkage value of less than 0.5 mm/m after the displayed period of time. However, earlier results (compare Figure 38) allow the assumption that the shrinkage will continue with time. Somewhat surprising is the high shrinkage value of the mix incorporating nepheline syenite. The strength of this mix is higher than the one with wollastonite, both mixes contain the same amount of water in the fresh concrete and the mix with wollastonite lost about 0.7 % more weight during drying. However, the mix containing nepheline syenite shrinks more. A slow chemical reaction between cement paste and some parts of the nepheline syenite filler could be an explanation for the increased shrinkage. This is only a hypothesis and remains to be proven.
Figure 47: Compressive strength and drying shrinkage of low cement concrete. M3 is M300 and M6 is M6000. The figure before kg denotes the amount of cement per m3 in the mix. Samples for compressive strength were wet cured.
0
0.1
0.2
0.3
0.4
0.5
0.6
0.7
0.8
0 50 100 150 200
Time [days]
Leng
th c
hang
e [m
m/m
] .
.
150 kg M3/M6100 kg M3/M6100 kg M3/Woll100 kg M3/SY
0
10
20
30
40
50
60
70
80
90
0 100 200 300 400
Time [days]
Com
pres
sive
stre
ngth
[MPa
]
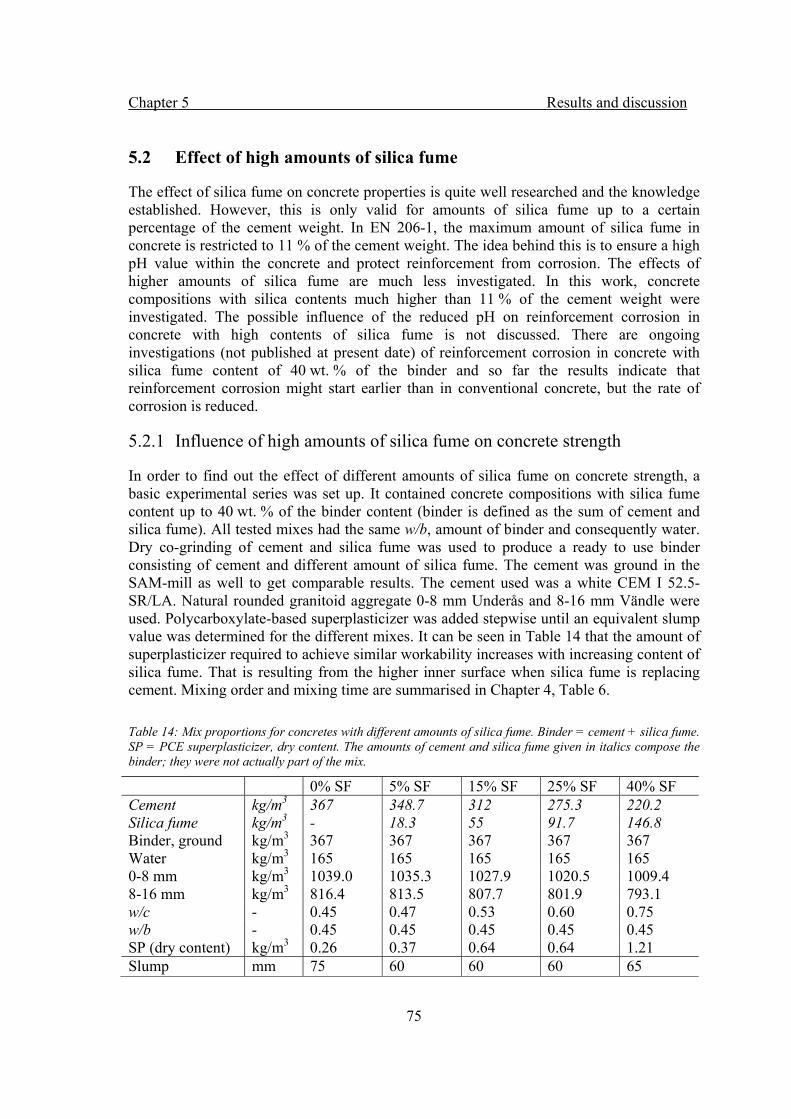
Chapter 5 Results and discussion
75
5.2 Effect of high amounts of silica fume
The effect of silica fume on concrete properties is quite well researched and the knowledge established. However, this is only valid for amounts of silica fume up to a certain percentage of the cement weight. In EN 206-1, the maximum amount of silica fume in concrete is restricted to 11 % of the cement weight. The idea behind this is to ensure a high pH value within the concrete and protect reinforcement from corrosion. The effects of higher amounts of silica fume are much less investigated. In this work, concrete compositions with silica contents much higher than 11 % of the cement weight were investigated. The possible influence of the reduced pH on reinforcement corrosion in concrete with high contents of silica fume is not discussed. There are ongoing investigations (not published at present date) of reinforcement corrosion in concrete with silica fume content of 40 wt. % of the binder and so far the results indicate that reinforcement corrosion might start earlier than in conventional concrete, but the rate of corrosion is reduced.
5.2.1 Influence of high amounts of silica fume on concrete strength
In order to find out the effect of different amounts of silica fume on concrete strength, a basic experimental series was set up. It contained concrete compositions with silica fume content up to 40 wt. % of the binder content (binder is defined as the sum of cement and silica fume). All tested mixes had the same w/b, amount of binder and consequently water. Dry co-grinding of cement and silica fume was used to produce a ready to use binder consisting of cement and different amount of silica fume. The cement was ground in the SAM-mill as well to get comparable results. The cement used was a white CEM I 52.5-SR/LA. Natural rounded granitoid aggregate 0-8 mm Underås and 8-16 mm Vändle were used. Polycarboxylate-based superplasticizer was added stepwise until an equivalent slump value was determined for the different mixes. It can be seen in Table 14 that the amount of superplasticizer required to achieve similar workability increases with increasing content of silica fume. That is resulting from the higher inner surface when silica fume is replacing cement. Mixing order and mixing time are summarised in Chapter 4, Table 6. Table 14: Mix proportions for concretes with different amounts of silica fume. Binder = cement + silica fume. SP = PCE superplasticizer, dry content. The amounts of cement and silica fume given in italics compose the binder; they were not actually part of the mix.
0% SF 5% SF 15% SF 25% SF 40% SF Cement kg/m3 367 348.7 312 275.3 220.2 Silica fume kg/m3 - 18.3 55 91.7 146.8 Binder, ground kg/m3 367 367 367 367 367 Water kg/m3 165 165 165 165 165 0-8 mm kg/m3 1039.0 1035.3 1027.9 1020.5 1009.4 8-16 mm kg/m3 816.4 813.5 807.7 801.9 793.1 w/c - 0.45 0.47 0.53 0.60 0.75 w/b - 0.45 0.45 0.45 0.45 0.45 SP (dry content) kg/m3 0.26 0.37 0.64 0.64 1.21 Slump mm 75 60 60 60 65

Chapter 5 Results and discussion
76
The compressive strength of all mixes was tested after 1, 3, 7, 28 and 91 days. The results are displayed in Figure 48. It can be seen that all tested concretes have a rather high strength after one day, between 27 MPa with 40 % SF and 46 MPa with 15 % SF. This high early compressive strength is presumably a result of the grinding process, which results in more fine-ground cement with fresh and highly reactive surfaces, see Lidström & Westerberg (1997). The concrete with 15 % silica fume has the highest compressive strength at all tested time points while the mix with 40 % SF has lower strength at earlier ages but after 91 days reaches almost the value of the mix with 15 % SF. Mixes without SF and with 5 % SF have comparable early strength but do not show the same strength gain at later ages like the mixes with higher SF content. Interesting is the fact that the mix with 40 % SF shows an almost linear curve on a single-logarithmic scale in the strength-time diagram. One could draw the conclusion that for such mixes the compressive strength will increase for longer periods of time, compared to concrete without or with low amounts of SF. More data is required to strengthen this hypothesis. To be able to determine the influence of grinding, mixes without SF and with 25 % SF were prepared with un-ground binder. The compressive strength after 91 days was 17% (without SF) and 22 % (with 25 % SF) higher after grinding.
Figure 48: Compressive strength of concrete with different amounts of silica fume. The amount of binder and water was kept constant (binder = cement + silica fume). Samples were wet cured.
Analysing the PSD of the prepared mixes, see Figure 49, one can see how the replacement of cement by silica fume influences the PSD. Especially below a grain size of 10 µm increased replacement of cement by silica fume leads to excess of particles. One could
0
20
40
60
80
100
120
1 10 100time (days)
Stre
ngth
(MPa
)
0% SF
5% SF
15% SF
25% SF
40% SF
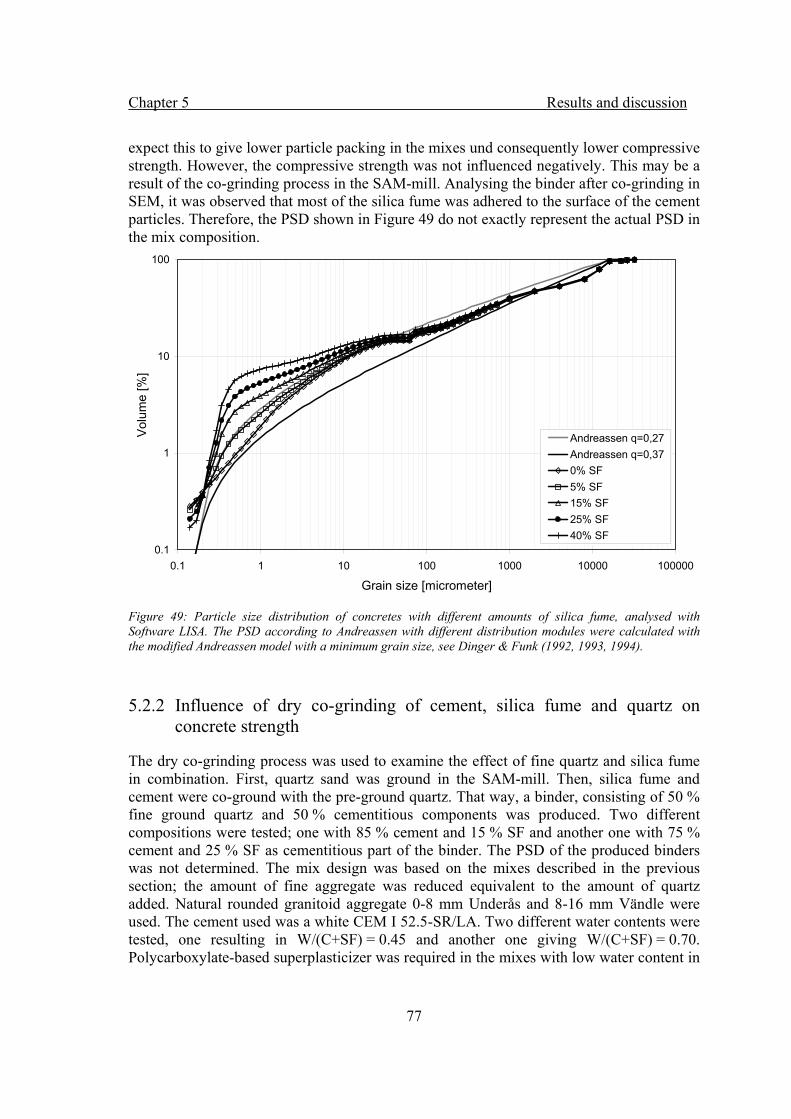
Chapter 5 Results and discussion
77
expect this to give lower particle packing in the mixes und consequently lower compressive strength. However, the compressive strength was not influenced negatively. This may be a result of the co-grinding process in the SAM-mill. Analysing the binder after co-grinding in SEM, it was observed that most of the silica fume was adhered to the surface of the cement particles. Therefore, the PSD shown in Figure 49 do not exactly represent the actual PSD in the mix composition.
Figure 49: Particle size distribution of concretes with different amounts of silica fume, analysed with Software LISA. The PSD according to Andreassen with different distribution modules were calculated with the modified Andreassen model with a minimum grain size, see Dinger & Funk (1992, 1993, 1994).
5.2.2 Influence of dry co-grinding of cement, silica fume and quartz on concrete strength
The dry co-grinding process was used to examine the effect of fine quartz and silica fume in combination. First, quartz sand was ground in the SAM-mill. Then, silica fume and cement were co-ground with the pre-ground quartz. That way, a binder, consisting of 50 % fine ground quartz and 50 % cementitious components was produced. Two different compositions were tested; one with 85 % cement and 15 % SF and another one with 75 % cement and 25 % SF as cementitious part of the binder. The PSD of the produced binders was not determined. The mix design was based on the mixes described in the previous section; the amount of fine aggregate was reduced equivalent to the amount of quartz added. Natural rounded granitoid aggregate 0-8 mm Underås and 8-16 mm Vändle were used. The cement used was a white CEM I 52.5-SR/LA. Two different water contents were tested, one resulting in W/(C+SF) = 0.45 and another one giving W/(C+SF) = 0.70. Polycarboxylate-based superplasticizer was required in the mixes with low water content in
0.1
1
10
100
0.1 1 10 100 1000 10000 100000
Grain size [micrometer]
Vol
ume
[%]
Andreassen q=0,27Andreassen q=0,370% SF5% SF15% SF25% SF40% SF
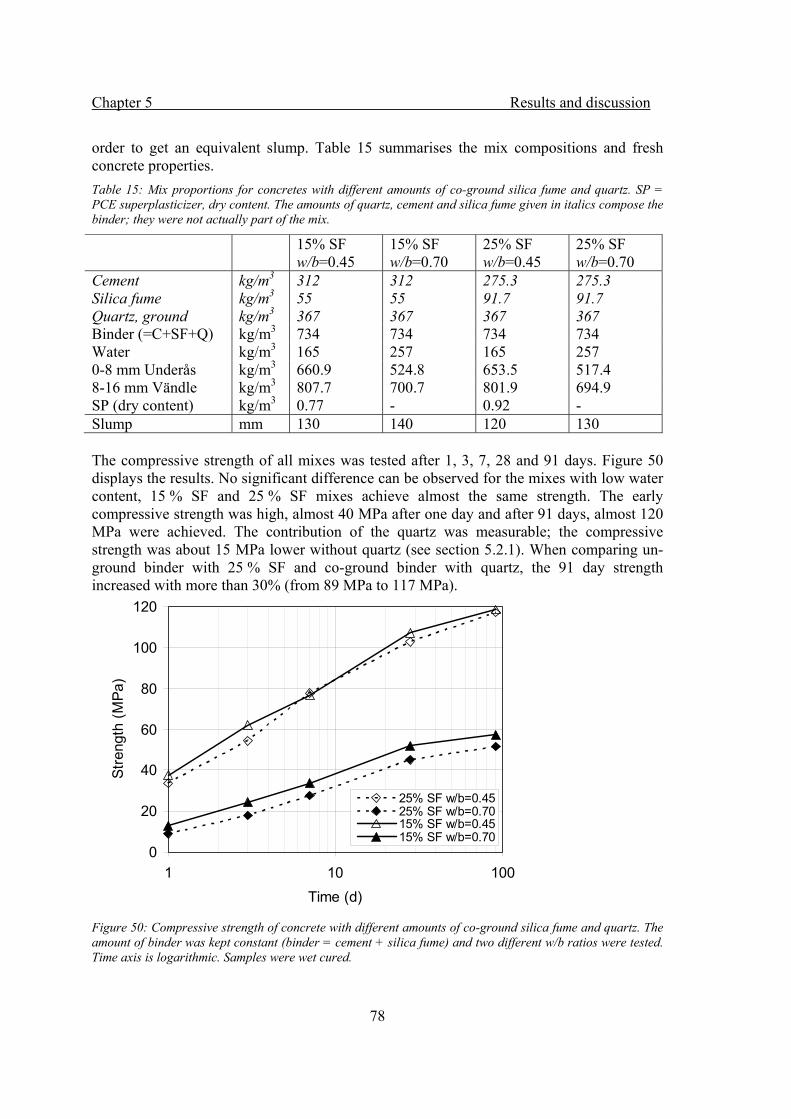
Chapter 5 Results and discussion
78
order to get an equivalent slump. Table 15 summarises the mix compositions and fresh concrete properties. Table 15: Mix proportions for concretes with different amounts of co-ground silica fume and quartz. SP = PCE superplasticizer, dry content. The amounts of quartz, cement and silica fume given in italics compose the binder; they were not actually part of the mix.
15% SF w/b=0.45
15% SF w/b=0.70
25% SF w/b=0.45
25% SF w/b=0.70
Cement kg/m3 312 312 275.3 275.3 Silica fume kg/m3 55 55 91.7 91.7 Quartz, ground kg/m3 367 367 367 367 Binder (=C+SF+Q) kg/m3 734 734 734 734 Water kg/m3 165 257 165 257 0-8 mm Underås kg/m3 660.9 524.8 653.5 517.4 8-16 mm Vändle kg/m3 807.7 700.7 801.9 694.9 SP (dry content) kg/m3 0.77 - 0.92 - Slump mm 130 140 120 130 The compressive strength of all mixes was tested after 1, 3, 7, 28 and 91 days. Figure 50 displays the results. No significant difference can be observed for the mixes with low water content, 15 % SF and 25 % SF mixes achieve almost the same strength. The early compressive strength was high, almost 40 MPa after one day and after 91 days, almost 120 MPa were achieved. The contribution of the quartz was measurable; the compressive strength was about 15 MPa lower without quartz (see section 5.2.1). When comparing un-ground binder with 25 % SF and co-ground binder with quartz, the 91 day strength increased with more than 30% (from 89 MPa to 117 MPa).
Figure 50: Compressive strength of concrete with different amounts of co-ground silica fume and quartz. The amount of binder was kept constant (binder = cement + silica fume) and two different w/b ratios were tested. Time axis is logarithmic. Samples were wet cured.
0
20
40
60
80
100
120
1 10 100Time (d)
Stre
ngth
(MPa
)
25% SF w/b=0.4525% SF w/b=0.7015% SF w/b=0.4515% SF w/b=0.70
Chapter 5 Results and discussion
79
Co-grinding of quartz, cement and silica fume can be used to produce highly efficient binders. Using only 367 kg of reactive binder per cubic meter concrete and a comparably high w/b of 0.45, high-strength concrete with more than 100 MPa in compressive strength after 28 days of curing was achieved. Ronin & Jonasson (1994), Ronin (1997) and Justnes et al (2007) made experiments with co-ground binders of cement and different additions like quartz and flyash. They denoted these binders energetically modified cement (EMC). They achieved high concrete strength with low porosity and good durability. However, there are some drawbacks to the concept of co-grinding. First, the grinding process is energy intensive and therefore costly. Second, it would require an additional step in cement or concrete production as freshly ground binder is most effective. And third, the industrial use of fine ground crystalline quartz is restricted due to health risks.
Chapter 5 Results and discussion
80
5.3 Combination of ultrafine inert particles and silica fume
The concept of achieving high strength concrete with low cement content by combining fine ground quartz and large amounts of silica fume origins from ACEL in Canada, see Breton (1996). Their original goal was to develop a concrete with very low heat of hydration for large volume structures in a repository for spent nuclear fuel. However, more was achieved. The concrete developed exceptionally high strength, regarding the amount of binder and w/b. Triggered by the results described in the previous section, the following experiments were started in order to get a better understanding of the effects when combining ultrafine inert filler and silica fume in concrete.
5.3.1 Low cement concretes with silica fume and ultrafine particles
The concrete composition described in Lagerblad (2001) was taken as starting point. This mix was prepared again in the present series and is denoted LCSC1, see Table 16. The concretes are denoted low cement silica concrete (LCSC) as they contain little cement but high amounts of siliceous components. The influence of increased content of silica fume and even lower cement content was investigated. Natural rounded granitoid aggregate 0-8 mm Underås and 8-16 mm Vändle was used. The cement used was a white CEM I 52.5-SR/LA. Carboxylate-based superplasticizer was required in order to get workable mixes. Mixing order and mixing time are summarised in Chapter 4, Table 6. Table 16: Mix proportions for low cement silica concretes (LCSC) with different amounts of silica fume and quartz filler. Binder = cement + silica fume. SP= PCE superplasticizer, dry content. The maximum aggregates size is 16 mm for LCSC1-4 and 8 mm for LCSC5.
name filler type cement water filler SF Aggr. w/c w/b w/p SP slump kg/m3 kg/m3 kg/m3 kg/m3 kg/m3 - - - kg/m3 mm LCSC1 M300+
M6000 150 114 100+
100 30 2009 0.76 0.63 0.30 1.75 280
LCSC2 Q 150 114 200 30 2010 0.76 0.63 0.30 1.75 230 LCSC3 Q 150 118 200 45 2010 0.79 0.61 0.30 2.73 245 LCSC4 Q 100 126 300 20 1855 1.26 0.95 0.30 1.47 220 LCSC5 M300+
M6000 60 150 200+
150 60 1679 2.50 1.25 0.32 4.38 SCC
The PSD of LCSC1 was analysed with software LISA, using the mix proportion and PSD of the ingredients. Figure 51 shows that the PSD of LCSC 1 follows the modified Andreassen curve with q = 0.27 quite well. According to Lagerblad (personal conversation), the original mix was composed without analysing particle size distributions but by a worker with many years of experience in concrete mixing. Based on the analysis of LCSC1, the other concrete compositions were composed to follow the modified Andreassen curve with q = 0.27. LCSC3 follows the theoretical curve best.
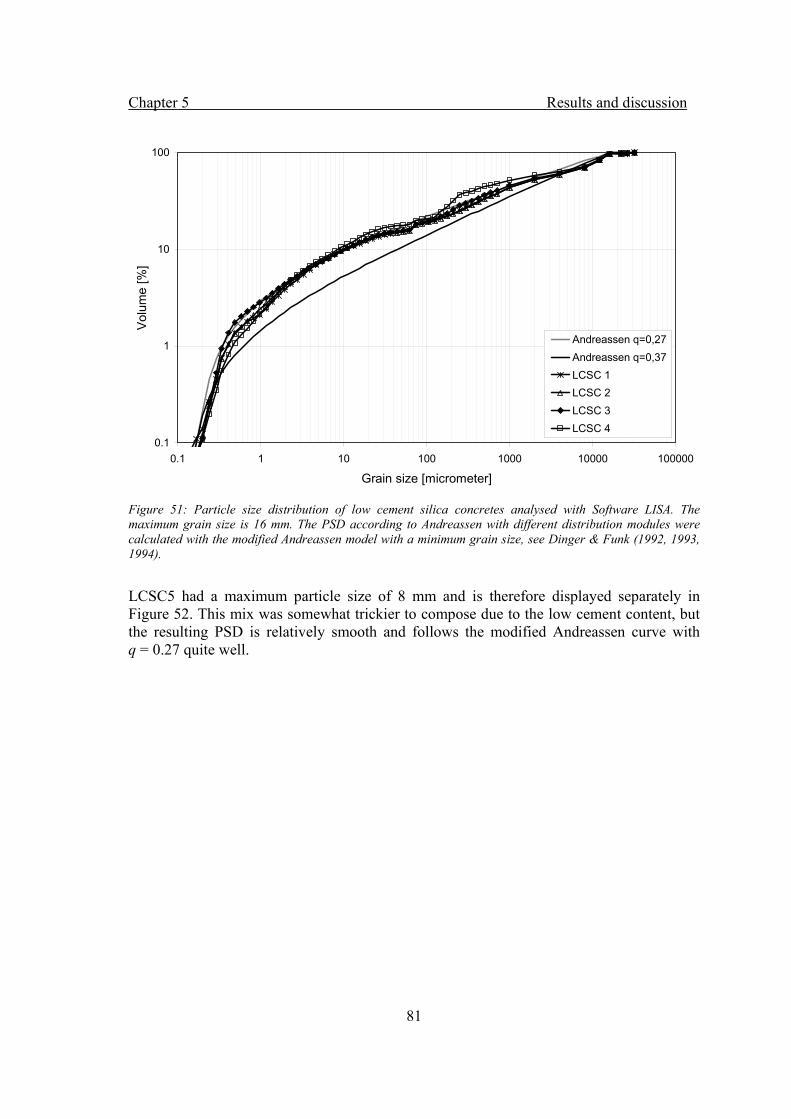
Chapter 5 Results and discussion
81
Figure 51: Particle size distribution of low cement silica concretes analysed with Software LISA. The maximum grain size is 16 mm. The PSD according to Andreassen with different distribution modules were calculated with the modified Andreassen model with a minimum grain size, see Dinger & Funk (1992, 1993, 1994).
LCSC5 had a maximum particle size of 8 mm and is therefore displayed separately in Figure 52. This mix was somewhat trickier to compose due to the low cement content, but the resulting PSD is relatively smooth and follows the modified Andreassen curve with q = 0.27 quite well.
0.1
1
10
100
0.1 1 10 100 1000 10000 100000
Grain size [micrometer]
Vol
ume
[%]
Andreassen q=0,27Andreassen q=0,37LCSC 1LCSC 2LCSC 3LCSC 4
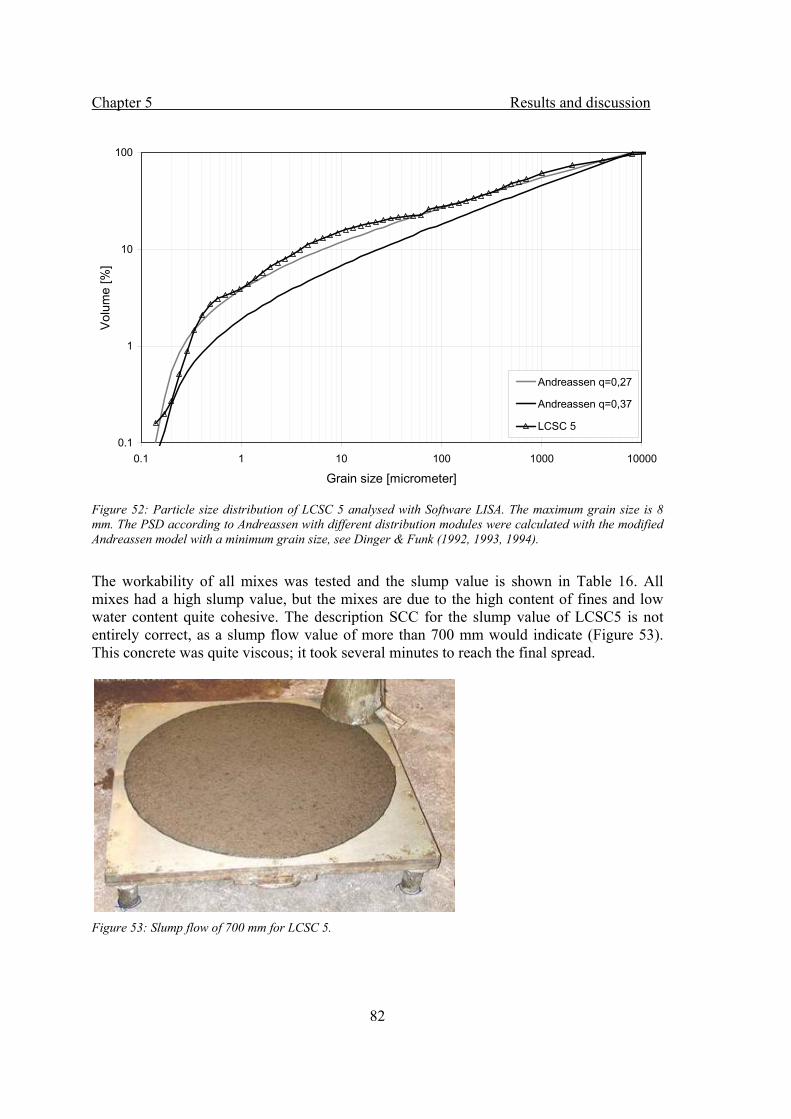
Chapter 5 Results and discussion
82
Figure 52: Particle size distribution of LCSC 5 analysed with Software LISA. The maximum grain size is 8 mm. The PSD according to Andreassen with different distribution modules were calculated with the modified Andreassen model with a minimum grain size, see Dinger & Funk (1992, 1993, 1994).
The workability of all mixes was tested and the slump value is shown in Table 16. All mixes had a high slump value, but the mixes are due to the high content of fines and low water content quite cohesive. The description SCC for the slump value of LCSC5 is not entirely correct, as a slump flow value of more than 700 mm would indicate (Figure 53). This concrete was quite viscous; it took several minutes to reach the final spread.
Figure 53: Slump flow of 700 mm for LCSC 5.
0.1
1
10
100
0.1 1 10 100 1000 10000
Grain size [micrometer]
Vol
ume
[%]
Andreassen q=0,27
Andreassen q=0,37
LCSC 5
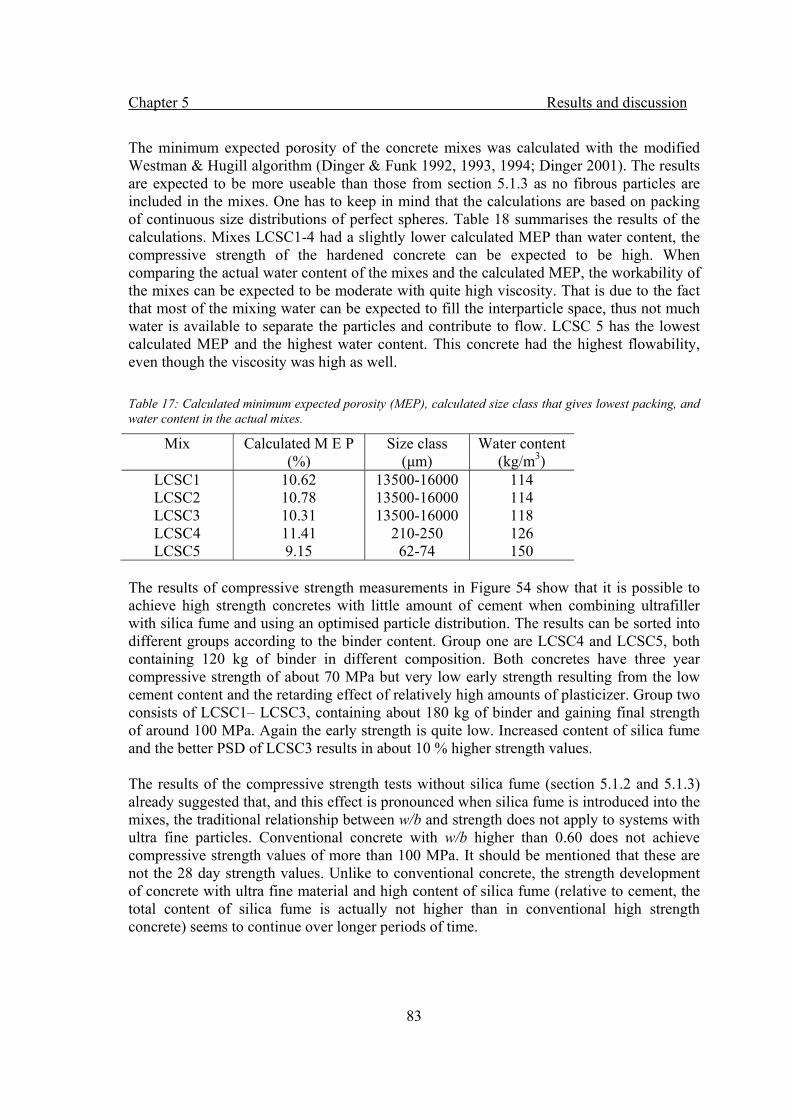
Chapter 5 Results and discussion
83
The minimum expected porosity of the concrete mixes was calculated with the modified Westman & Hugill algorithm (Dinger & Funk 1992, 1993, 1994; Dinger 2001). The results are expected to be more useable than those from section 5.1.3 as no fibrous particles are included in the mixes. One has to keep in mind that the calculations are based on packing of continuous size distributions of perfect spheres. Table 18 summarises the results of the calculations. Mixes LCSC1-4 had a slightly lower calculated MEP than water content, the compressive strength of the hardened concrete can be expected to be high. When comparing the actual water content of the mixes and the calculated MEP, the workability of the mixes can be expected to be moderate with quite high viscosity. That is due to the fact that most of the mixing water can be expected to fill the interparticle space, thus not much water is available to separate the particles and contribute to flow. LCSC 5 has the lowest calculated MEP and the highest water content. This concrete had the highest flowability, even though the viscosity was high as well. Table 17: Calculated minimum expected porosity (MEP), calculated size class that gives lowest packing, and water content in the actual mixes.
Mix Calculated M E P Size class Water content (%) (μm) (kg/m3)
LCSC1 10.62 13500-16000 114 LCSC2 10.78 13500-16000 114 LCSC3 10.31 13500-16000 118 LCSC4 11.41 210-250 126 LCSC5 9.15 62-74 150
The results of compressive strength measurements in Figure 54 show that it is possible to achieve high strength concretes with little amount of cement when combining ultrafiller with silica fume and using an optimised particle distribution. The results can be sorted into different groups according to the binder content. Group one are LCSC4 and LCSC5, both containing 120 kg of binder in different composition. Both concretes have three year compressive strength of about 70 MPa but very low early strength resulting from the low cement content and the retarding effect of relatively high amounts of plasticizer. Group two consists of LCSC1– LCSC3, containing about 180 kg of binder and gaining final strength of around 100 MPa. Again the early strength is quite low. Increased content of silica fume and the better PSD of LCSC3 results in about 10 % higher strength values. The results of the compressive strength tests without silica fume (section 5.1.2 and 5.1.3) already suggested that, and this effect is pronounced when silica fume is introduced into the mixes, the traditional relationship between w/b and strength does not apply to systems with ultra fine particles. Conventional concrete with w/b higher than 0.60 does not achieve compressive strength values of more than 100 MPa. It should be mentioned that these are not the 28 day strength values. Unlike to conventional concrete, the strength development of concrete with ultra fine material and high content of silica fume (relative to cement, the total content of silica fume is actually not higher than in conventional high strength concrete) seems to continue over longer periods of time.
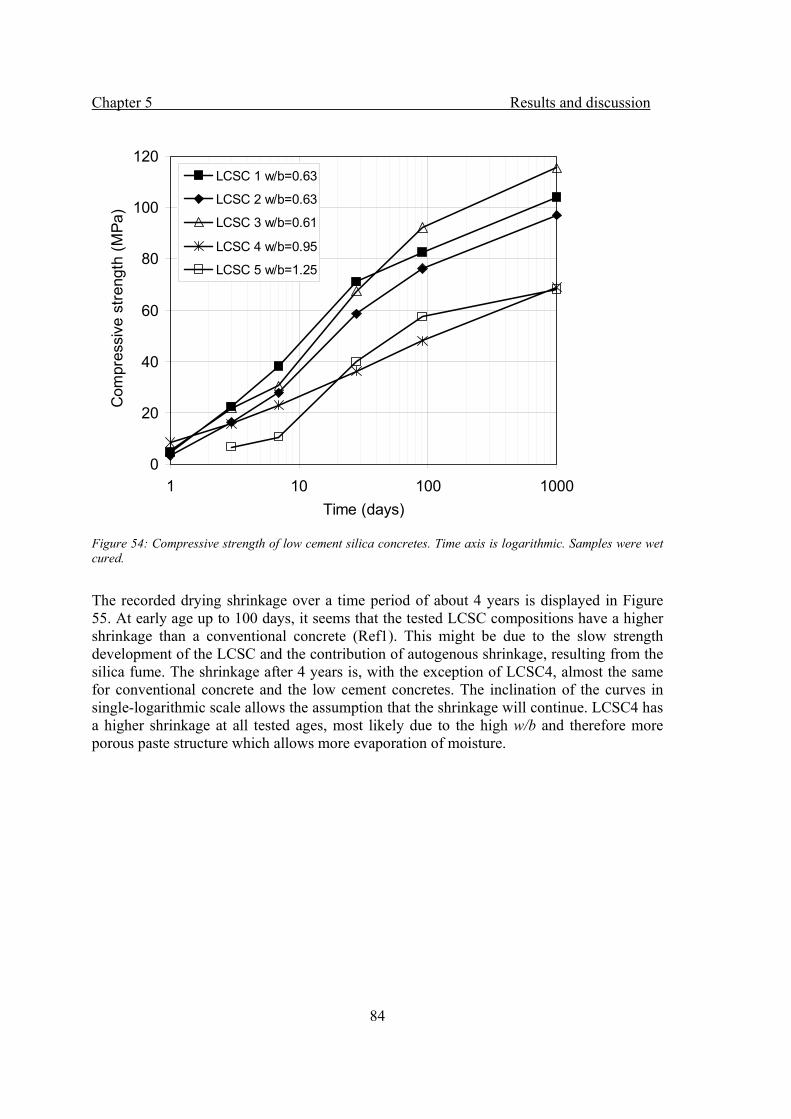
Chapter 5 Results and discussion
84
Figure 54: Compressive strength of low cement silica concretes. Time axis is logarithmic. Samples were wet cured.
The recorded drying shrinkage over a time period of about 4 years is displayed in Figure 55. At early age up to 100 days, it seems that the tested LCSC compositions have a higher shrinkage than a conventional concrete (Ref1). This might be due to the slow strength development of the LCSC and the contribution of autogenous shrinkage, resulting from the silica fume. The shrinkage after 4 years is, with the exception of LCSC4, almost the same for conventional concrete and the low cement concretes. The inclination of the curves in single-logarithmic scale allows the assumption that the shrinkage will continue. LCSC4 has a higher shrinkage at all tested ages, most likely due to the high w/b and therefore more porous paste structure which allows more evaporation of moisture.
0
20
40
60
80
100
120
1 10 100 1000Time (days)
Com
pres
sive
stre
ngth
(MPa
)
LCSC 1 w/b=0.63
LCSC 2 w/b=0.63
LCSC 3 w/b=0.61
LCSC 4 w/b=0.95
LCSC 5 w/b=1.25
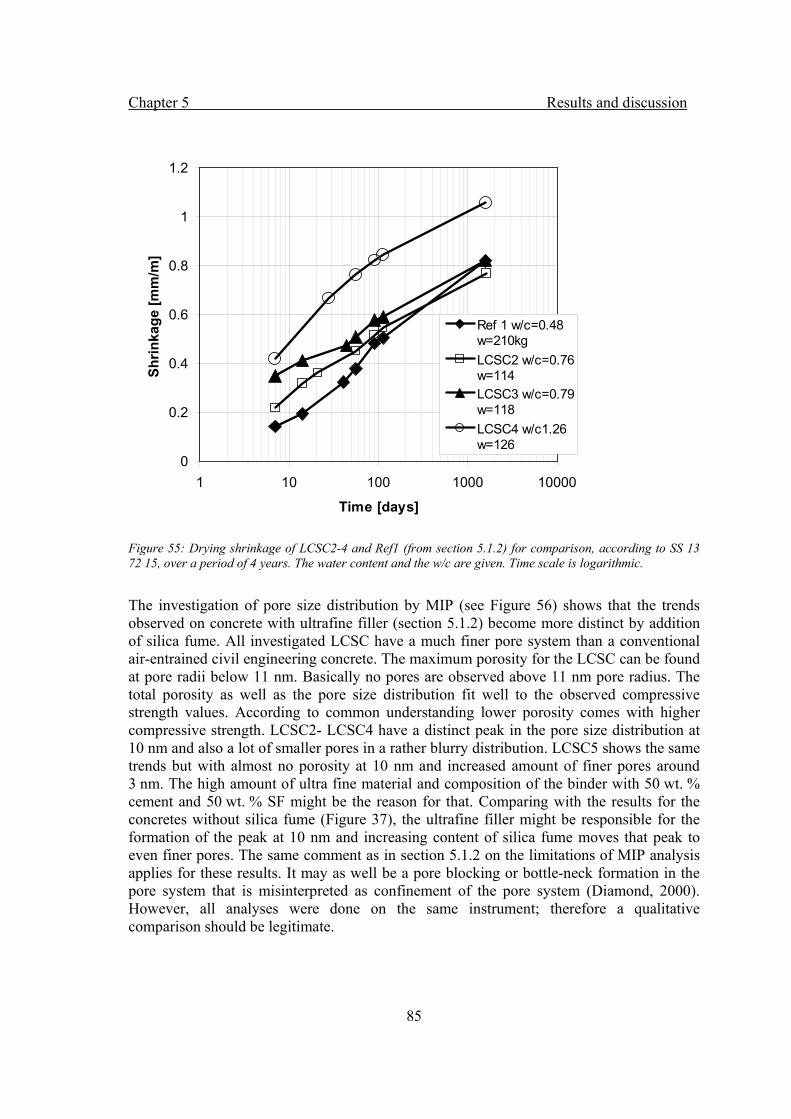
Chapter 5 Results and discussion
85
Figure 55: Drying shrinkage of LCSC2-4 and Ref1 (from section 5.1.2) for comparison, according to SS 13 72 15, over a period of 4 years. The water content and the w/c are given. Time scale is logarithmic.
The investigation of pore size distribution by MIP (see Figure 56) shows that the trends observed on concrete with ultrafine filler (section 5.1.2) become more distinct by addition of silica fume. All investigated LCSC have a much finer pore system than a conventional air-entrained civil engineering concrete. The maximum porosity for the LCSC can be found at pore radii below 11 nm. Basically no pores are observed above 11 nm pore radius. The total porosity as well as the pore size distribution fit well to the observed compressive strength values. According to common understanding lower porosity comes with higher compressive strength. LCSC2- LCSC4 have a distinct peak in the pore size distribution at 10 nm and also a lot of smaller pores in a rather blurry distribution. LCSC5 shows the same trends but with almost no porosity at 10 nm and increased amount of finer pores around 3 nm. The high amount of ultra fine material and composition of the binder with 50 wt. % cement and 50 wt. % SF might be the reason for that. Comparing with the results for the concretes without silica fume (Figure 37), the ultrafine filler might be responsible for the formation of the peak at 10 nm and increasing content of silica fume moves that peak to even finer pores. The same comment as in section 5.1.2 on the limitations of MIP analysis applies for these results. It may as well be a pore blocking or bottle-neck formation in the pore system that is misinterpreted as confinement of the pore system (Diamond, 2000). However, all analyses were done on the same instrument; therefore a qualitative comparison should be legitimate.
0
0.2
0.4
0.6
0.8
1
1.2
1 10 100 1000 10000
Time [days]
Shrin
kage
[mm
/m]
Ref 1 w/c=0.48w=210kgLCSC2 w/c=0.76w=114LCSC3 w/c=0.79w=118LCSC4 w/c1.26w=126
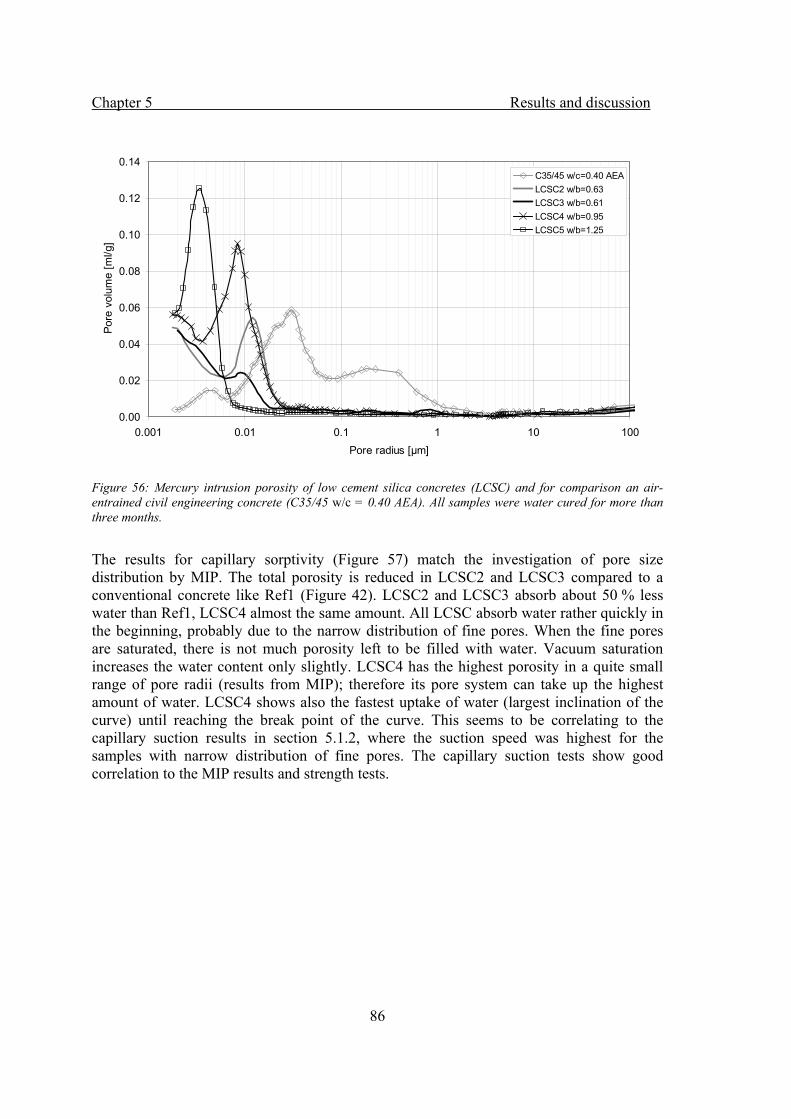
Chapter 5 Results and discussion
86
Figure 56: Mercury intrusion porosity of low cement silica concretes (LCSC) and for comparison an air-entrained civil engineering concrete (C35/45 w/c = 0.40 AEA). All samples were water cured for more than three months.
The results for capillary sorptivity (Figure 57) match the investigation of pore size distribution by MIP. The total porosity is reduced in LCSC2 and LCSC3 compared to a conventional concrete like Ref1 (Figure 42). LCSC2 and LCSC3 absorb about 50 % less water than Ref1, LCSC4 almost the same amount. All LCSC absorb water rather quickly in the beginning, probably due to the narrow distribution of fine pores. When the fine pores are saturated, there is not much porosity left to be filled with water. Vacuum saturation increases the water content only slightly. LCSC4 has the highest porosity in a quite small range of pore radii (results from MIP); therefore its pore system can take up the highest amount of water. LCSC4 shows also the fastest uptake of water (largest inclination of the curve) until reaching the break point of the curve. This seems to be correlating to the capillary suction results in section 5.1.2, where the suction speed was highest for the samples with narrow distribution of fine pores. The capillary suction tests show good correlation to the MIP results and strength tests.
0.00
0.02
0.04
0.06
0.08
0.10
0.12
0.14
0.001 0.01 0.1 1 10 100Pore radius [μm]
Pore
vol
ume
[ml/g
]
C35/45 w/c=0.40 AEALCSC2 w/b=0.63LCSC3 w/b=0.61LCSC4 w/b=0.95LCSC5 w/b=1.25
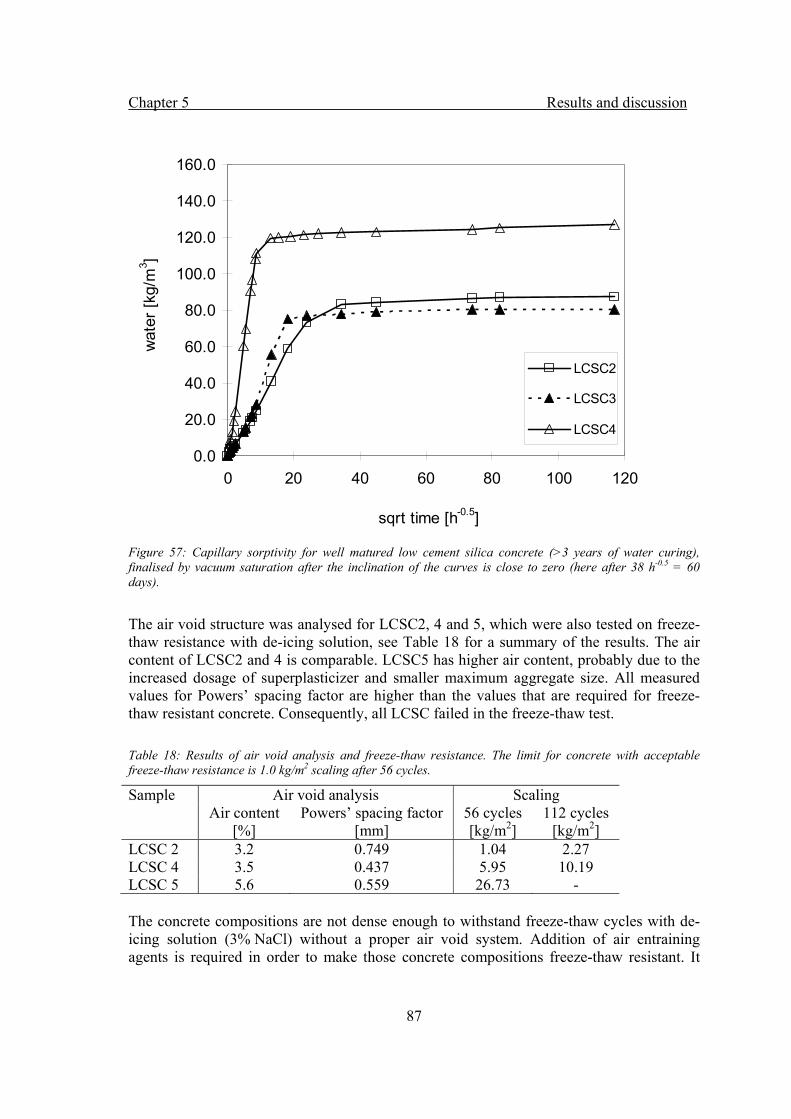
Chapter 5 Results and discussion
87
Figure 57: Capillary sorptivity for well matured low cement silica concrete (>3 years of water curing), finalised by vacuum saturation after the inclination of the curves is close to zero (here after 38 h-0.5 = 60 days).
The air void structure was analysed for LCSC2, 4 and 5, which were also tested on freeze-thaw resistance with de-icing solution, see Table 18 for a summary of the results. The air content of LCSC2 and 4 is comparable. LCSC5 has higher air content, probably due to the increased dosage of superplasticizer and smaller maximum aggregate size. All measured values for Powers’ spacing factor are higher than the values that are required for freeze-thaw resistant concrete. Consequently, all LCSC failed in the freeze-thaw test. Table 18: Results of air void analysis and freeze-thaw resistance. The limit for concrete with acceptable freeze-thaw resistance is 1.0 kg/m2 scaling after 56 cycles.
Sample Air void analysis Scaling Air content
[%] Powers’ spacing factor
[mm] 56 cycles [kg/m2]
112 cycles [kg/m2]
LCSC 2 3.2 0.749 1.04 2.27 LCSC 4 3.5 0.437 5.95 10.19 LCSC 5 5.6 0.559 26.73 - The concrete compositions are not dense enough to withstand freeze-thaw cycles with de-icing solution (3% NaCl) without a proper air void system. Addition of air entraining agents is required in order to make those concrete compositions freeze-thaw resistant. It
0.0
20.0
40.0
60.0
80.0
100.0
120.0
140.0
160.0
0 20 40 60 80 100 120
sqrt time [h-0.5]
wat
er [k
g/m
3 ]
LCSC2
LCSC3
LCSC4
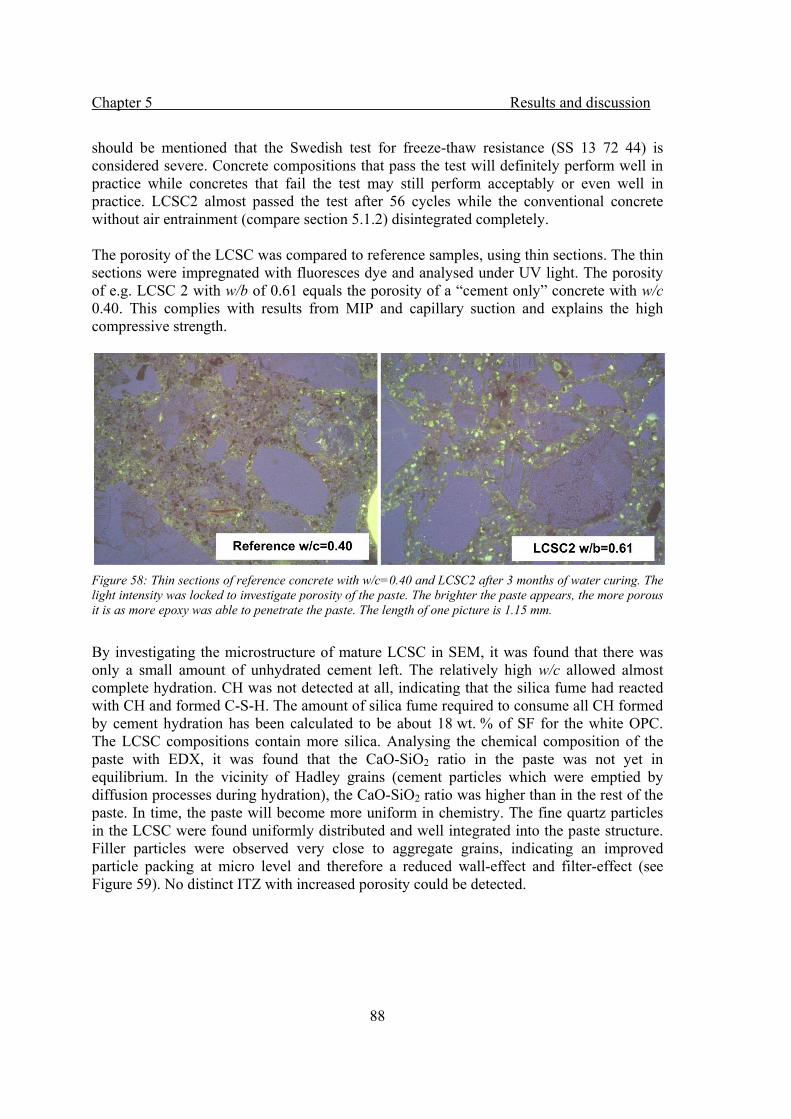
Chapter 5 Results and discussion
88
should be mentioned that the Swedish test for freeze-thaw resistance (SS 13 72 44) is considered severe. Concrete compositions that pass the test will definitely perform well in practice while concretes that fail the test may still perform acceptably or even well in practice. LCSC2 almost passed the test after 56 cycles while the conventional concrete without air entrainment (compare section 5.1.2) disintegrated completely. The porosity of the LCSC was compared to reference samples, using thin sections. The thin sections were impregnated with fluoresces dye and analysed under UV light. The porosity of e.g. LCSC 2 with w/b of 0.61 equals the porosity of a “cement only” concrete with w/c 0.40. This complies with results from MIP and capillary suction and explains the high compressive strength.
Figure 58: Thin sections of reference concrete with w/c=0.40 and LCSC2 after 3 months of water curing. The light intensity was locked to investigate porosity of the paste. The brighter the paste appears, the more porous it is as more epoxy was able to penetrate the paste. The length of one picture is 1.15 mm.
By investigating the microstructure of mature LCSC in SEM, it was found that there was only a small amount of unhydrated cement left. The relatively high w/c allowed almost complete hydration. CH was not detected at all, indicating that the silica fume had reacted with CH and formed C-S-H. The amount of silica fume required to consume all CH formed by cement hydration has been calculated to be about 18 wt. % of SF for the white OPC. The LCSC compositions contain more silica. Analysing the chemical composition of the paste with EDX, it was found that the CaO-SiO2 ratio in the paste was not yet in equilibrium. In the vicinity of Hadley grains (cement particles which were emptied by diffusion processes during hydration), the CaO-SiO2 ratio was higher than in the rest of the paste. In time, the paste will become more uniform in chemistry. The fine quartz particles in the LCSC were found uniformly distributed and well integrated into the paste structure. Filler particles were observed very close to aggregate grains, indicating an improved particle packing at micro level and therefore a reduced wall-effect and filter-effect (see Figure 59). No distinct ITZ with increased porosity could be detected.
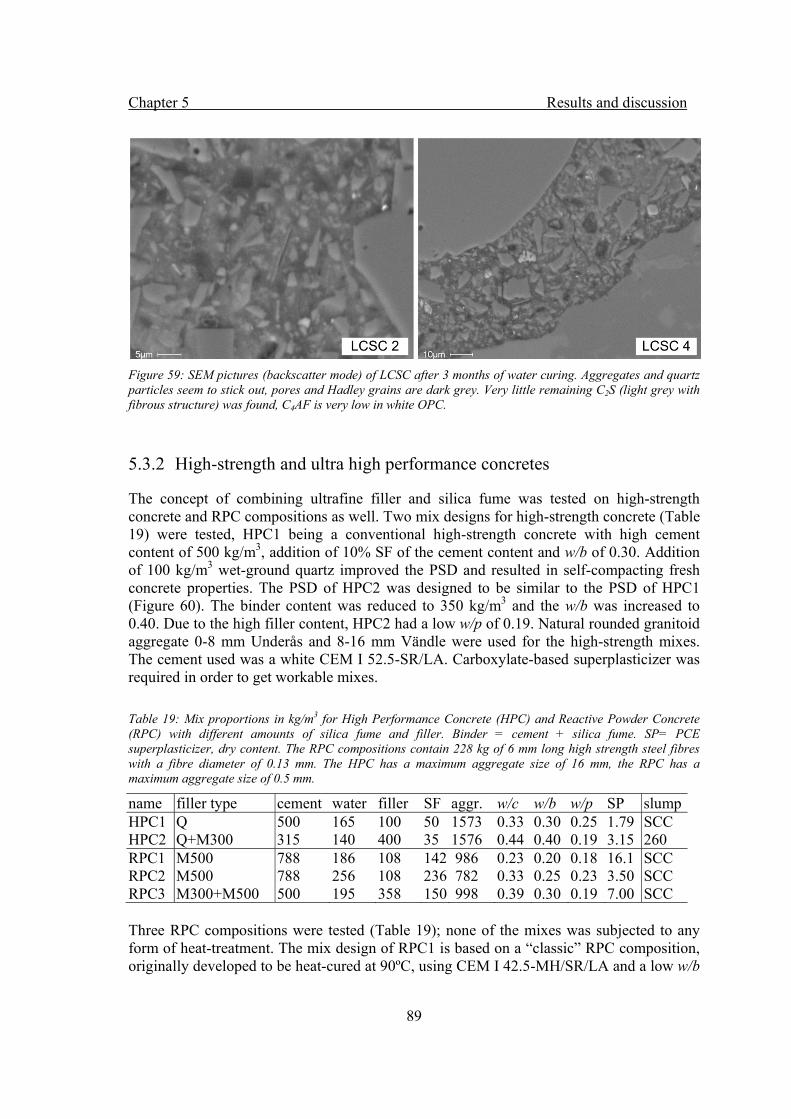
Chapter 5 Results and discussion
89
Figure 59: SEM pictures (backscatter mode) of LCSC after 3 months of water curing. Aggregates and quartz particles seem to stick out, pores and Hadley grains are dark grey. Very little remaining C2S (light grey with fibrous structure) was found, C4AF is very low in white OPC.
5.3.2 High-strength and ultra high performance concretes
The concept of combining ultrafine filler and silica fume was tested on high-strength concrete and RPC compositions as well. Two mix designs for high-strength concrete (Table 19) were tested, HPC1 being a conventional high-strength concrete with high cement content of 500 kg/m3, addition of 10% SF of the cement content and w/b of 0.30. Addition of 100 kg/m3 wet-ground quartz improved the PSD and resulted in self-compacting fresh concrete properties. The PSD of HPC2 was designed to be similar to the PSD of HPC1 (Figure 60). The binder content was reduced to 350 kg/m3 and the w/b was increased to 0.40. Due to the high filler content, HPC2 had a low w/p of 0.19. Natural rounded granitoid aggregate 0-8 mm Underås and 8-16 mm Vändle were used for the high-strength mixes. The cement used was a white CEM I 52.5-SR/LA. Carboxylate-based superplasticizer was required in order to get workable mixes. Table 19: Mix proportions in kg/m3 for High Performance Concrete (HPC) and Reactive Powder Concrete (RPC) with different amounts of silica fume and filler. Binder = cement + silica fume. SP= PCE superplasticizer, dry content. The RPC compositions contain 228 kg of 6 mm long high strength steel fibres with a fibre diameter of 0.13 mm. The HPC has a maximum aggregate size of 16 mm, the RPC has a maximum aggregate size of 0.5 mm.
name filler type cement water filler SF aggr. w/c w/b w/p SP slumpHPC1 Q 500 165 100 50 1573 0.33 0.30 0.25 1.79 SCC HPC2 Q+M300 315 140 400 35 1576 0.44 0.40 0.19 3.15 260 RPC1 M500 788 186 108 142 986 0.23 0.20 0.18 16.1 SCC RPC2 M500 788 256 108 236 782 0.33 0.25 0.23 3.50 SCC RPC3 M300+M500 500 195 358 150 998 0.39 0.30 0.19 7.00 SCC Three RPC compositions were tested (Table 19); none of the mixes was subjected to any form of heat-treatment. The mix design of RPC1 is based on a “classic” RPC composition, originally developed to be heat-cured at 90ºC, using CEM I 42.5-MH/SR/LA and a low w/b
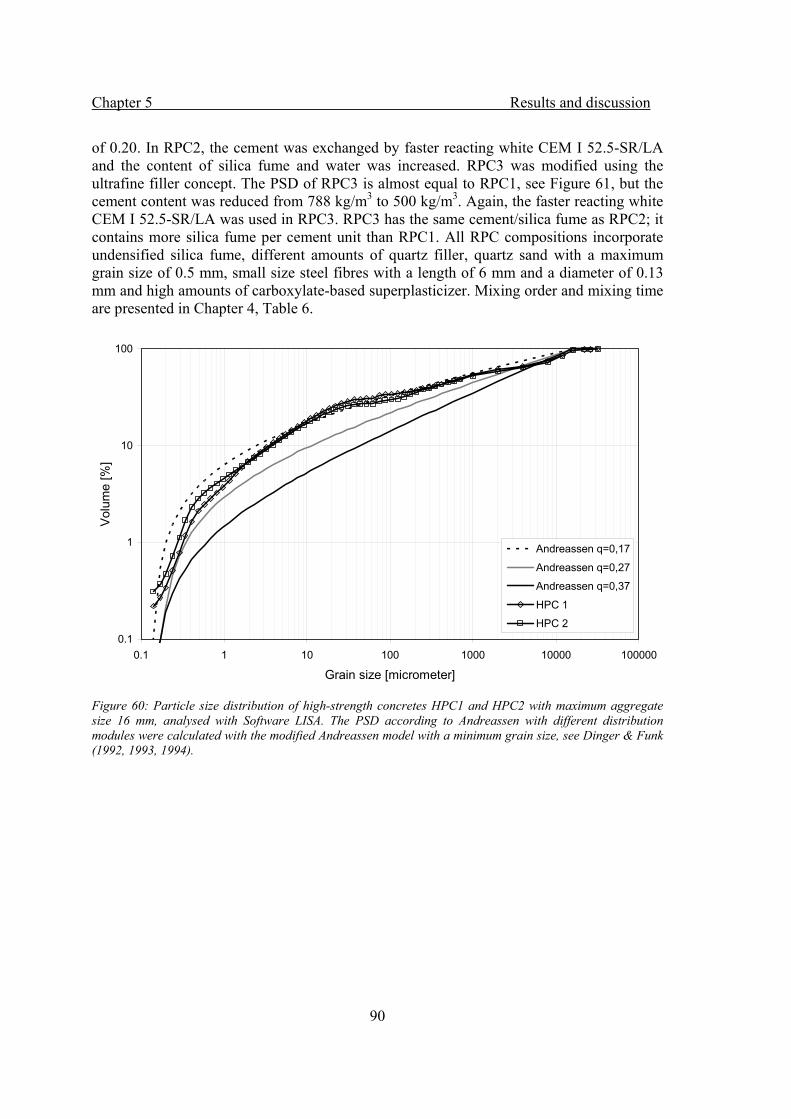
Chapter 5 Results and discussion
90
of 0.20. In RPC2, the cement was exchanged by faster reacting white CEM I 52.5-SR/LA and the content of silica fume and water was increased. RPC3 was modified using the ultrafine filler concept. The PSD of RPC3 is almost equal to RPC1, see Figure 61, but the cement content was reduced from 788 kg/m3 to 500 kg/m3. Again, the faster reacting white CEM I 52.5-SR/LA was used in RPC3. RPC3 has the same cement/silica fume as RPC2; it contains more silica fume per cement unit than RPC1. All RPC compositions incorporate undensified silica fume, different amounts of quartz filler, quartz sand with a maximum grain size of 0.5 mm, small size steel fibres with a length of 6 mm and a diameter of 0.13 mm and high amounts of carboxylate-based superplasticizer. Mixing order and mixing time are presented in Chapter 4, Table 6.
Figure 60: Particle size distribution of high-strength concretes HPC1 and HPC2 with maximum aggregate size 16 mm, analysed with Software LISA. The PSD according to Andreassen with different distribution modules were calculated with the modified Andreassen model with a minimum grain size, see Dinger & Funk (1992, 1993, 1994).
0.1
1
10
100
0.1 1 10 100 1000 10000 100000
Grain size [micrometer]
Vol
ume
[%]
Andreassen q=0,17
Andreassen q=0,27
Andreassen q=0,37
HPC 1
HPC 2
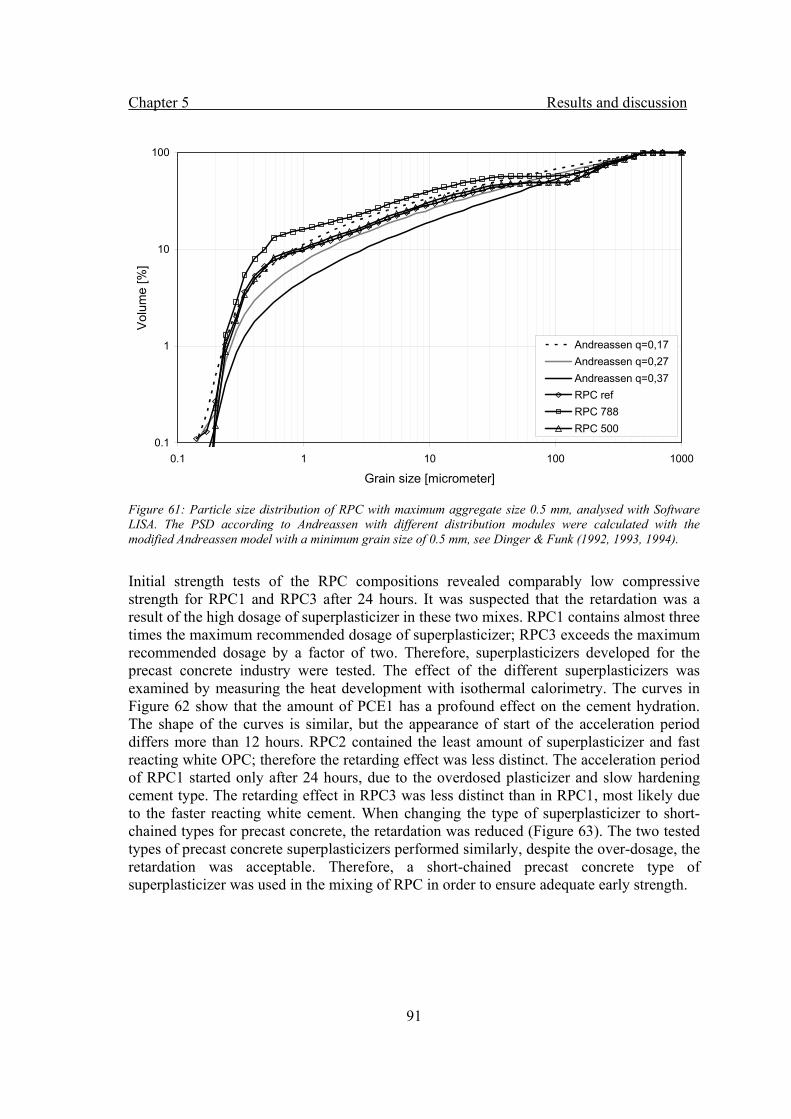
Chapter 5 Results and discussion
91
Figure 61: Particle size distribution of RPC with maximum aggregate size 0.5 mm, analysed with Software LISA. The PSD according to Andreassen with different distribution modules were calculated with the modified Andreassen model with a minimum grain size of 0.5 mm, see Dinger & Funk (1992, 1993, 1994).
Initial strength tests of the RPC compositions revealed comparably low compressive strength for RPC1 and RPC3 after 24 hours. It was suspected that the retardation was a result of the high dosage of superplasticizer in these two mixes. RPC1 contains almost three times the maximum recommended dosage of superplasticizer; RPC3 exceeds the maximum recommended dosage by a factor of two. Therefore, superplasticizers developed for the precast concrete industry were tested. The effect of the different superplasticizers was examined by measuring the heat development with isothermal calorimetry. The curves in Figure 62 show that the amount of PCE1 has a profound effect on the cement hydration. The shape of the curves is similar, but the appearance of start of the acceleration period differs more than 12 hours. RPC2 contained the least amount of superplasticizer and fast reacting white OPC; therefore the retarding effect was less distinct. The acceleration period of RPC1 started only after 24 hours, due to the overdosed plasticizer and slow hardening cement type. The retarding effect in RPC3 was less distinct than in RPC1, most likely due to the faster reacting white cement. When changing the type of superplasticizer to short-chained types for precast concrete, the retardation was reduced (Figure 63). The two tested types of precast concrete superplasticizers performed similarly, despite the over-dosage, the retardation was acceptable. Therefore, a short-chained precast concrete type of superplasticizer was used in the mixing of RPC in order to ensure adequate early strength.
0.1
1
10
100
0.1 1 10 100 1000
Grain size [micrometer]
Vol
ume
[%]
Andreassen q=0,17Andreassen q=0,27Andreassen q=0,37RPC refRPC 788RPC 500
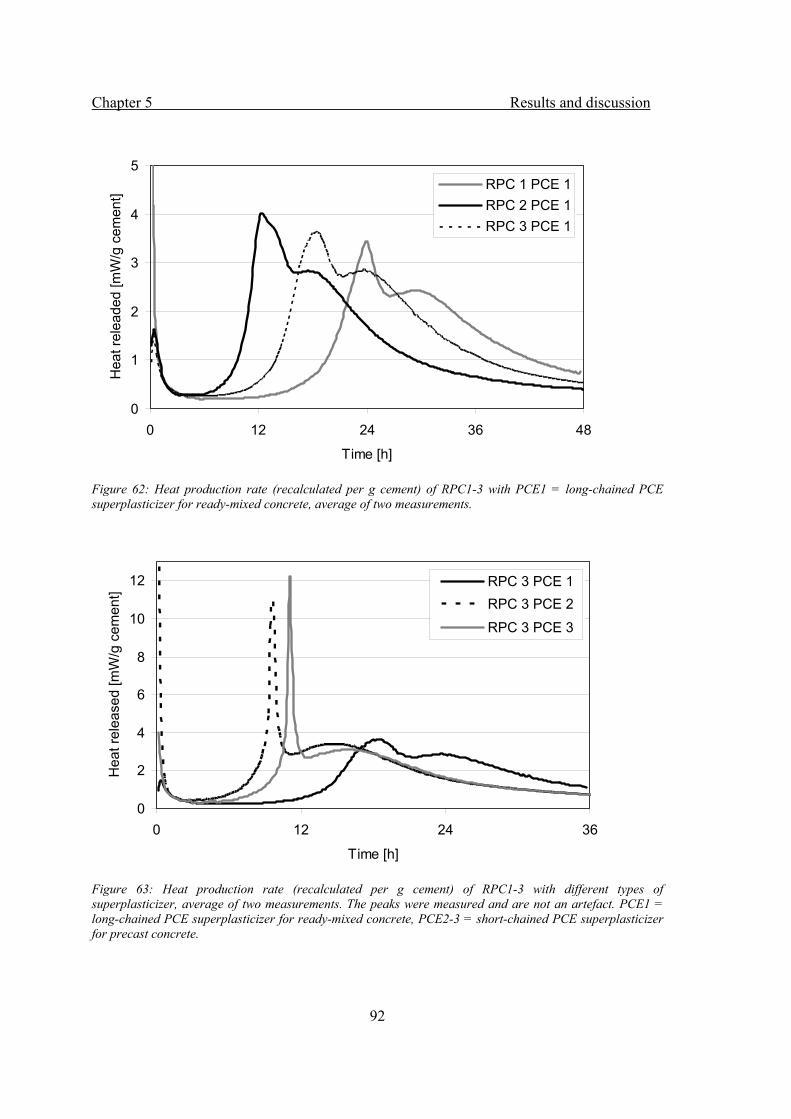
Chapter 5 Results and discussion
92
Figure 62: Heat production rate (recalculated per g cement) of RPC1-3 with PCE1 = long-chained PCE superplasticizer for ready-mixed concrete, average of two measurements.
Figure 63: Heat production rate (recalculated per g cement) of RPC1-3 with different types of superplasticizer, average of two measurements. The peaks were measured and are not an artefact. PCE1 = long-chained PCE superplasticizer for ready-mixed concrete, PCE2-3 = short-chained PCE superplasticizer for precast concrete.
0
1
2
3
4
5
0 12 24 36 48
Time [h]
Hea
t rel
eade
d [m
W/g
cem
ent]
RPC 1 PCE 1RPC 2 PCE 1RPC 3 PCE 1
0
2
4
6
8
10
12
0 12 24 36
Time [h]
Hea
t rel
ease
d [m
W/g
cem
ent]
RPC 3 PCE 1RPC 3 PCE 2
RPC 3 PCE 3
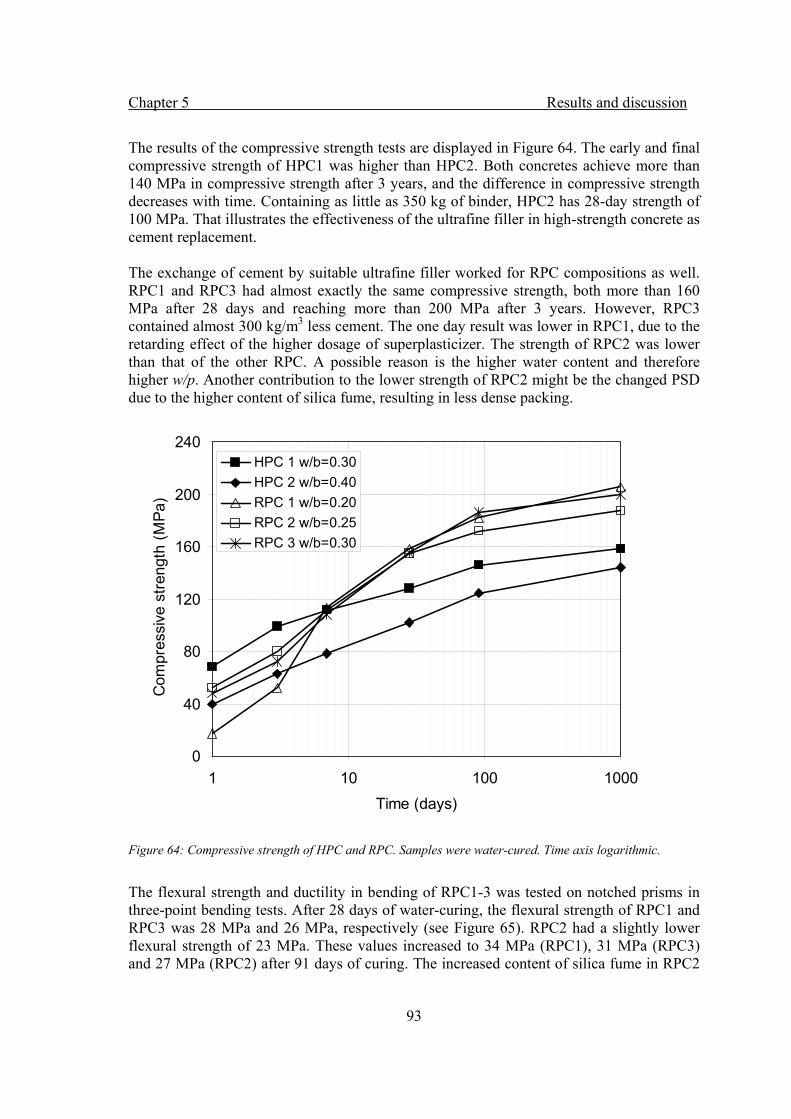
Chapter 5 Results and discussion
93
The results of the compressive strength tests are displayed in Figure 64. The early and final compressive strength of HPC1 was higher than HPC2. Both concretes achieve more than 140 MPa in compressive strength after 3 years, and the difference in compressive strength decreases with time. Containing as little as 350 kg of binder, HPC2 has 28-day strength of 100 MPa. That illustrates the effectiveness of the ultrafine filler in high-strength concrete as cement replacement. The exchange of cement by suitable ultrafine filler worked for RPC compositions as well. RPC1 and RPC3 had almost exactly the same compressive strength, both more than 160 MPa after 28 days and reaching more than 200 MPa after 3 years. However, RPC3 contained almost 300 kg/m3 less cement. The one day result was lower in RPC1, due to the retarding effect of the higher dosage of superplasticizer. The strength of RPC2 was lower than that of the other RPC. A possible reason is the higher water content and therefore higher w/p. Another contribution to the lower strength of RPC2 might be the changed PSD due to the higher content of silica fume, resulting in less dense packing.
Figure 64: Compressive strength of HPC and RPC. Samples were water-cured. Time axis logarithmic.
The flexural strength and ductility in bending of RPC1-3 was tested on notched prisms in three-point bending tests. After 28 days of water-curing, the flexural strength of RPC1 and RPC3 was 28 MPa and 26 MPa, respectively (see Figure 65). RPC2 had a slightly lower flexural strength of 23 MPa. These values increased to 34 MPa (RPC1), 31 MPa (RPC3) and 27 MPa (RPC2) after 91 days of curing. The increased content of silica fume in RPC2
0
40
80
120
160
200
240
1 10 100 1000Time (days)
Com
pres
sive
stre
ngth
(MPa
)
HPC 1 w/b=0.30HPC 2 w/b=0.40RPC 1 w/b=0.20RPC 2 w/b=0.25RPC 3 w/b=0.30
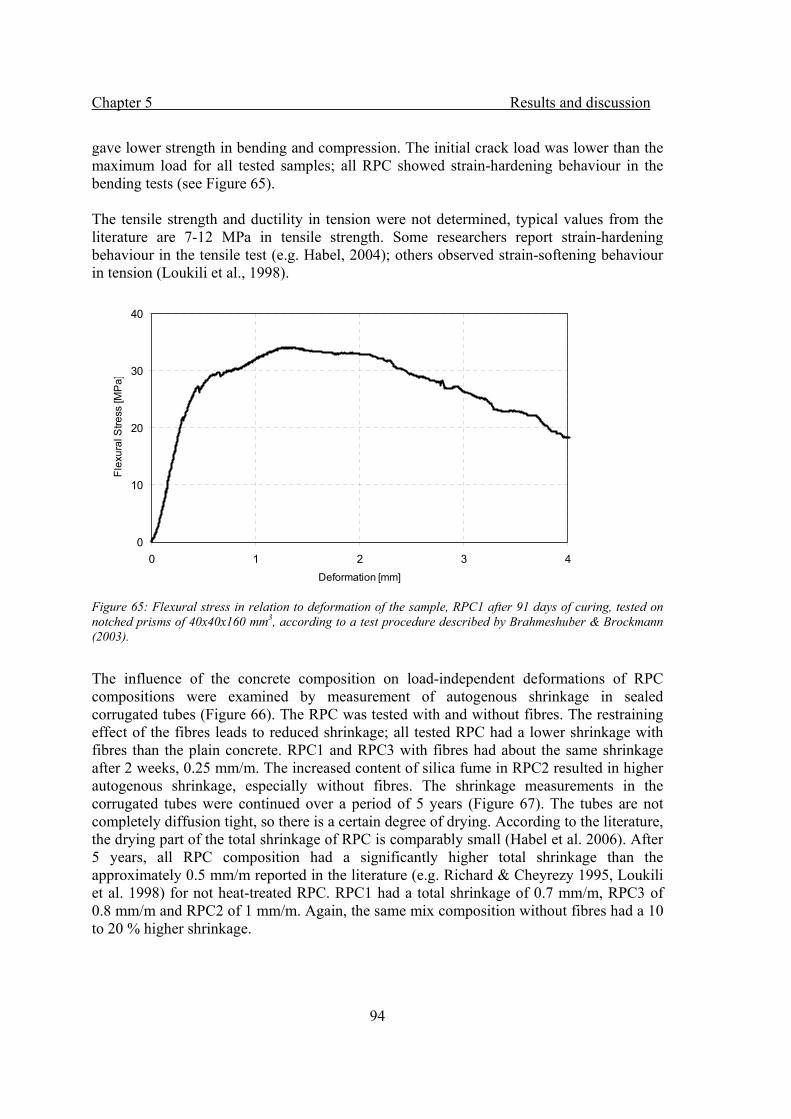
Chapter 5 Results and discussion
94
gave lower strength in bending and compression. The initial crack load was lower than the maximum load for all tested samples; all RPC showed strain-hardening behaviour in the bending tests (see Figure 65). The tensile strength and ductility in tension were not determined, typical values from the literature are 7-12 MPa in tensile strength. Some researchers report strain-hardening behaviour in the tensile test (e.g. Habel, 2004); others observed strain-softening behaviour in tension (Loukili et al., 1998).
Figure 65: Flexural stress in relation to deformation of the sample, RPC1 after 91 days of curing, tested on notched prisms of 40x40x160 mm3, according to a test procedure described by Brahmeshuber & Brockmann (2003).
The influence of the concrete composition on load-independent deformations of RPC compositions were examined by measurement of autogenous shrinkage in sealed corrugated tubes (Figure 66). The RPC was tested with and without fibres. The restraining effect of the fibres leads to reduced shrinkage; all tested RPC had a lower shrinkage with fibres than the plain concrete. RPC1 and RPC3 with fibres had about the same shrinkage after 2 weeks, 0.25 mm/m. The increased content of silica fume in RPC2 resulted in higher autogenous shrinkage, especially without fibres. The shrinkage measurements in the corrugated tubes were continued over a period of 5 years (Figure 67). The tubes are not completely diffusion tight, so there is a certain degree of drying. According to the literature, the drying part of the total shrinkage of RPC is comparably small (Habel et al. 2006). After 5 years, all RPC composition had a significantly higher total shrinkage than the approximately 0.5 mm/m reported in the literature (e.g. Richard & Cheyrezy 1995, Loukili et al. 1998) for not heat-treated RPC. RPC1 had a total shrinkage of 0.7 mm/m, RPC3 of 0.8 mm/m and RPC2 of 1 mm/m. Again, the same mix composition without fibres had a 10 to 20 % higher shrinkage.
0
10
20
30
40
0 1 2 3 4Deformation [mm]
Flex
ural
Stre
ss [M
Pa]
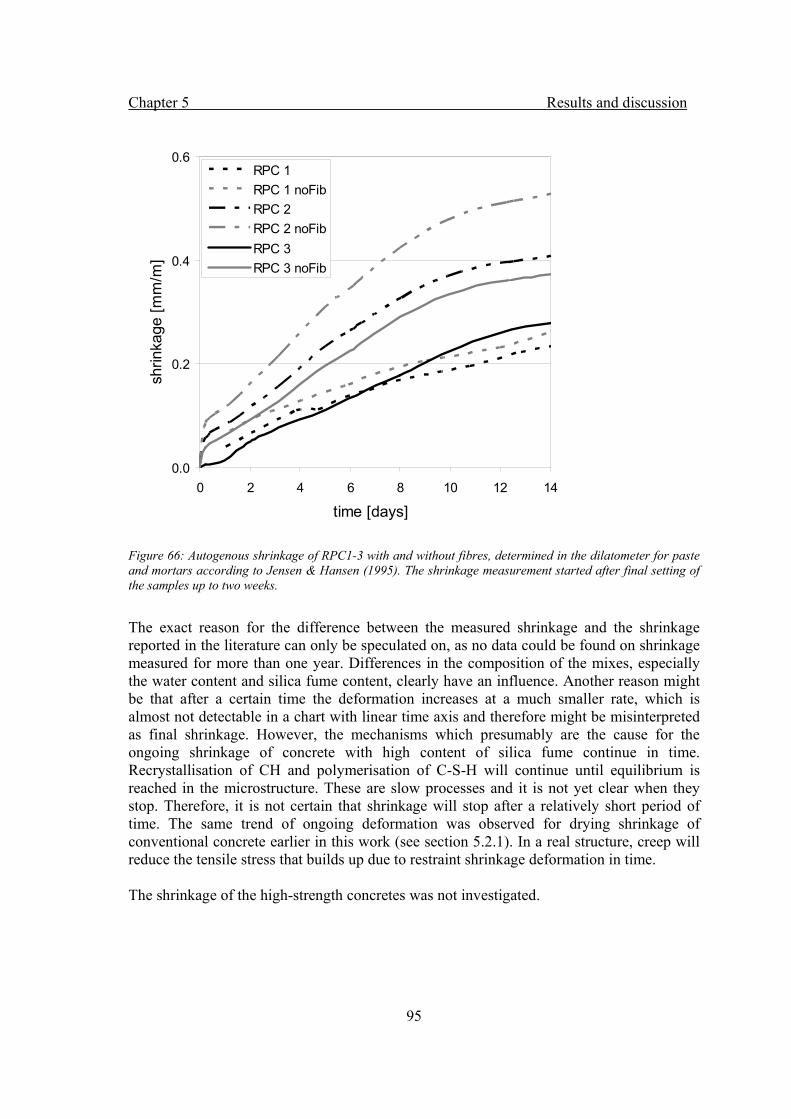
Chapter 5 Results and discussion
95
Figure 66: Autogenous shrinkage of RPC1-3 with and without fibres, determined in the dilatometer for paste and mortars according to Jensen & Hansen (1995). The shrinkage measurement started after final setting of the samples up to two weeks.
The exact reason for the difference between the measured shrinkage and the shrinkage reported in the literature can only be speculated on, as no data could be found on shrinkage measured for more than one year. Differences in the composition of the mixes, especially the water content and silica fume content, clearly have an influence. Another reason might be that after a certain time the deformation increases at a much smaller rate, which is almost not detectable in a chart with linear time axis and therefore might be misinterpreted as final shrinkage. However, the mechanisms which presumably are the cause for the ongoing shrinkage of concrete with high content of silica fume continue in time. Recrystallisation of CH and polymerisation of C-S-H will continue until equilibrium is reached in the microstructure. These are slow processes and it is not yet clear when they stop. Therefore, it is not certain that shrinkage will stop after a relatively short period of time. The same trend of ongoing deformation was observed for drying shrinkage of conventional concrete earlier in this work (see section 5.2.1). In a real structure, creep will reduce the tensile stress that builds up due to restraint shrinkage deformation in time. The shrinkage of the high-strength concretes was not investigated.
0.0
0.2
0.4
0.6
0 2 4 6 8 10 12 14
time [days]
shrin
kage
[mm
/m]
6RPC 1RPC 1 noFibRPC 2RPC 2 noFibRPC 3RPC 3 noFib

Chapter 5 Results and discussion
96
Figure 67: Autogenous shrinkage of RPC1-3 with and without fibres, determined in the dilatometer for paste and mortars according to Jensen & Hansen (1995). Measurement from 24 hours up to 5 years, zeroed at 24 hours.
The porosity was examined using MIP, see Figure 68. The porosity and the pore size of HPC2 and RPC are much lower than that of an air-entrained civil engineering concrete (C35/45 w/c = 0.40 AEA). The RPC has almost no pores accessible to mercury. The total porosity determined by MIP is about 3%. There is very little difference in the porosity of RPC1 and RPC3 (with reduced cement content) which correlates to the observed strength values. The porosity of HPC2 is, compared to an air-entrained civil engineering concrete, reduced and the pores are finer. The maximum of pores is detected at 10 nm. This 10 nm peak was detected in the MIP investigations earlier in this work on the concretes with quartz filler and LCSC (sections 5.2.1 and 5.3.1). The particle size distribution of the ultrafine quartz may lead to the formation of pores with this radius.
0.0
0.2
0.4
0.6
0.8
1.0
1.2
1.4
1 10 100 1000 10000
time [days]
shrin
kage
[mm
/m]
RPC 1RPC 1 noFibRPC 2RPC 2 noFibRPC 3RPC 3 noFib
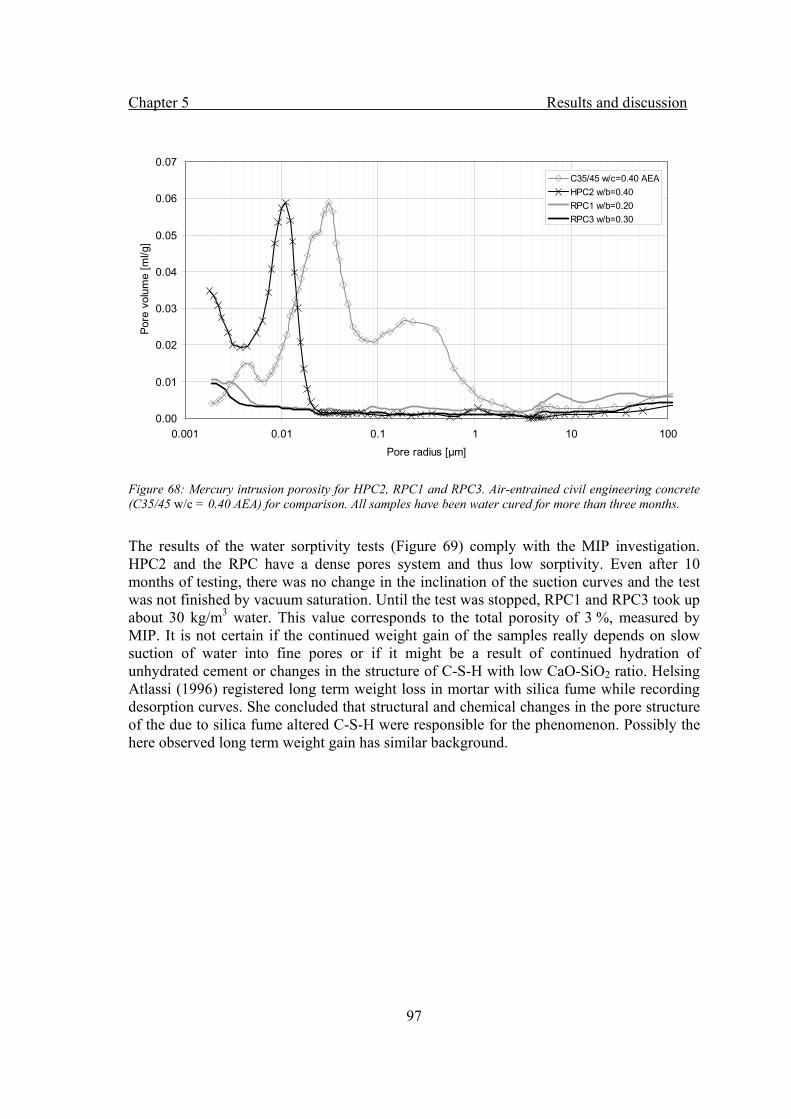
Chapter 5 Results and discussion
97
Figure 68: Mercury intrusion porosity for HPC2, RPC1 and RPC3. Air-entrained civil engineering concrete (C35/45 w/c = 0.40 AEA) for comparison. All samples have been water cured for more than three months.
The results of the water sorptivity tests (Figure 69) comply with the MIP investigation. HPC2 and the RPC have a dense pores system and thus low sorptivity. Even after 10 months of testing, there was no change in the inclination of the suction curves and the test was not finished by vacuum saturation. Until the test was stopped, RPC1 and RPC3 took up about 30 kg/m3 water. This value corresponds to the total porosity of 3 %, measured by MIP. It is not certain if the continued weight gain of the samples really depends on slow suction of water into fine pores or if it might be a result of continued hydration of unhydrated cement or changes in the structure of C-S-H with low CaO-SiO2 ratio. Helsing Atlassi (1996) registered long term weight loss in mortar with silica fume while recording desorption curves. She concluded that structural and chemical changes in the pore structure of the due to silica fume altered C-S-H were responsible for the phenomenon. Possibly the here observed long term weight gain has similar background.
0.00
0.01
0.02
0.03
0.04
0.05
0.06
0.07
0.001 0.01 0.1 1 10 100Pore radius [μm]
Pore
vol
ume
[ml/g
]
C35/45 w/c=0.40 AEAHPC2 w/b=0.40RPC1 w/b=0.20RPC3 w/b=0.30
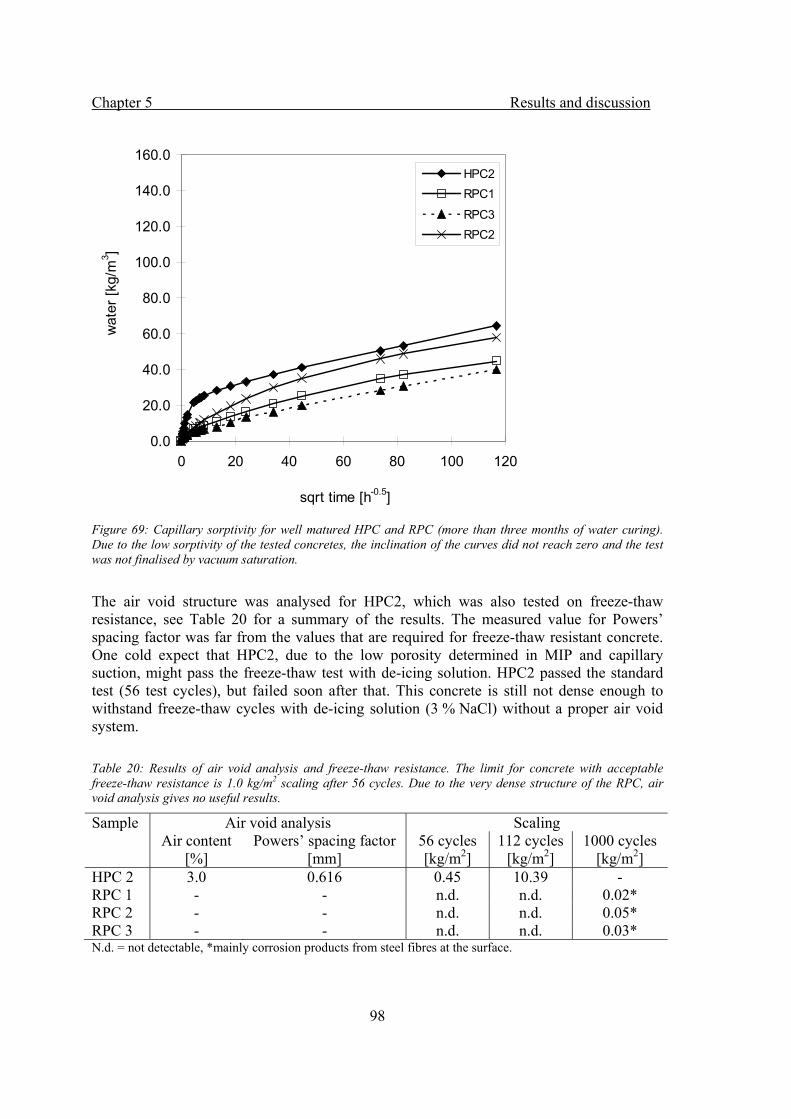
Chapter 5 Results and discussion
98
Figure 69: Capillary sorptivity for well matured HPC and RPC (more than three months of water curing). Due to the low sorptivity of the tested concretes, the inclination of the curves did not reach zero and the test was not finalised by vacuum saturation.
The air void structure was analysed for HPC2, which was also tested on freeze-thaw resistance, see Table 20 for a summary of the results. The measured value for Powers’ spacing factor was far from the values that are required for freeze-thaw resistant concrete. One cold expect that HPC2, due to the low porosity determined in MIP and capillary suction, might pass the freeze-thaw test with de-icing solution. HPC2 passed the standard test (56 test cycles), but failed soon after that. This concrete is still not dense enough to withstand freeze-thaw cycles with de-icing solution (3 % NaCl) without a proper air void system. Table 20: Results of air void analysis and freeze-thaw resistance. The limit for concrete with acceptable freeze-thaw resistance is 1.0 kg/m2 scaling after 56 cycles. Due to the very dense structure of the RPC, air void analysis gives no useful results.
Sample Air void analysis Scaling Air content
[%] Powers’ spacing factor
[mm] 56 cycles [kg/m2]
112 cycles [kg/m2]
1000 cycles [kg/m2]
HPC 2 3.0 0.616 0.45 10.39 - RPC 1 - - n.d. n.d. 0.02* RPC 2 - - n.d. n.d. 0.05* RPC 3 - - n.d. n.d. 0.03* N.d. = not detectable, *mainly corrosion products from steel fibres at the surface.
0.0
20.0
40.0
60.0
80.0
100.0
120.0
140.0
160.0
0 20 40 60 80 100 120
sqrt time [h-0.5]
wat
er [k
g/m
3 ]
HPC2RPC1
RPC3RPC2
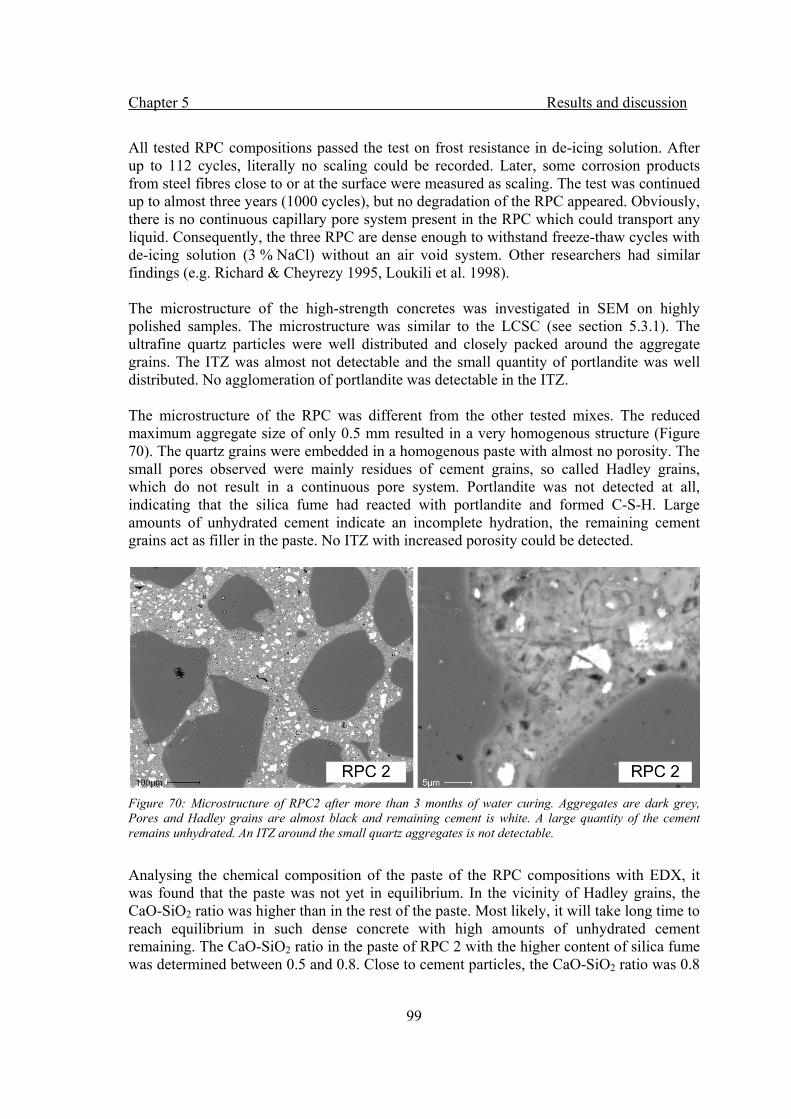
Chapter 5 Results and discussion
99
All tested RPC compositions passed the test on frost resistance in de-icing solution. After up to 112 cycles, literally no scaling could be recorded. Later, some corrosion products from steel fibres close to or at the surface were measured as scaling. The test was continued up to almost three years (1000 cycles), but no degradation of the RPC appeared. Obviously, there is no continuous capillary pore system present in the RPC which could transport any liquid. Consequently, the three RPC are dense enough to withstand freeze-thaw cycles with de-icing solution (3 % NaCl) without an air void system. Other researchers had similar findings (e.g. Richard & Cheyrezy 1995, Loukili et al. 1998). The microstructure of the high-strength concretes was investigated in SEM on highly polished samples. The microstructure was similar to the LCSC (see section 5.3.1). The ultrafine quartz particles were well distributed and closely packed around the aggregate grains. The ITZ was almost not detectable and the small quantity of portlandite was well distributed. No agglomeration of portlandite was detectable in the ITZ. The microstructure of the RPC was different from the other tested mixes. The reduced maximum aggregate size of only 0.5 mm resulted in a very homogenous structure (Figure 70). The quartz grains were embedded in a homogenous paste with almost no porosity. The small pores observed were mainly residues of cement grains, so called Hadley grains, which do not result in a continuous pore system. Portlandite was not detected at all, indicating that the silica fume had reacted with portlandite and formed C-S-H. Large amounts of unhydrated cement indicate an incomplete hydration, the remaining cement grains act as filler in the paste. No ITZ with increased porosity could be detected.
Figure 70: Microstructure of RPC2 after more than 3 months of water curing. Aggregates are dark grey, Pores and Hadley grains are almost black and remaining cement is white. A large quantity of the cement remains unhydrated. An ITZ around the small quartz aggregates is not detectable.
Analysing the chemical composition of the paste of the RPC compositions with EDX, it was found that the paste was not yet in equilibrium. In the vicinity of Hadley grains, the CaO-SiO2 ratio was higher than in the rest of the paste. Most likely, it will take long time to reach equilibrium in such dense concrete with high amounts of unhydrated cement remaining. The CaO-SiO2 ratio in the paste of RPC 2 with the higher content of silica fume was determined between 0.5 and 0.8. Close to cement particles, the CaO-SiO2 ratio was 0.8
Chapter 5 Results and discussion
100
to 1.0. A C-S-H gel with such a composition will give a pH of around 11.5 (Harris et al., 2002). RPC3 had a similar chemical composition as RPC2 due to the identical ratio of cement and silica fume. The CaO-SiO2 ratio in RPC1 was higher, due to the lower content of silica fume in the mix. Still, the pH in this composition will be reduced compared to conventional concrete.
Chapter 5 Results and discussion
101
5.4 Discussion
The influence of ultrafine particles on concrete properties was investigated for different minerals, in combination with silica fume and for different water- binder ratios. Heat of hydration, compressive strength, shrinkage, frost resistance and characterisation of the microstructure were used to describe the effect of ultrafine particles. The results from isothermal calorimetry of pastes show that the ultrafine particles speed up the cement hydration. They provide nucleation sites for the hydration products of the cement clinker, thus helping to deplete the pore solution of calcium and silica. This results in increased dissolution of cement clinker and gives a faster strength development, it is known from the literature as the filler effect (Taylor 1997, Kjellsen & Lagerblad 1994). Increasing fineness of the added minerals results in increased acceleration of the cement hydration. The amount of water, relative to cement, increases as well when fillers replace cement, therefore more water is available for hydration. Minerals containing calcium, e.g. calcite (results from the literature) and wollastonite (own experiments) affect the early strength development. These minerals work as setting accelerators, they shorten the dormant period of the cement hydration. Lagerblad & Fjällberg (2008) propose a hypothesis on the mechanism. The calcium from the additions contributes to the formation of the shell of hydration products around the cement particles which is required to form before the next phase of hydration can start. Quartz and other non-calcium based minerals do not work as setting accelerators. Quartz and especially cristobalite may work as slow pozzolanas. The grinding process creates a disrupted lattice layer with highly soluble silica (silica that lost its crystalline properties) around the particles (Lidström, 1968). Aging rebuilds the crystal structure in the disrupted lattice layer. Stressed quartz reacts pozzolanicly and therefore the bond strength between quartz particles and hydration products will be high. Initial experiments on the effect of ultrafine particles in concrete showed that the best effect, considering compressive strength, is achieved when cement is replaced by ultrafine particles and the water-cement ratio is kept constant. In doing so, cement is replaced by ultrafine particles and superplasticizer. Investigations of the microstructure show that the ultrafine particles become an integrated part of the hardened paste structure, reinforcing the paste and distribute the cement particles. The densification of the paste was shown by MIP and capillary suction tests. The ultrafine particles are able to pack close to the larger aggregate grains, reducing the thickness of the interfacial transition zone. k values were calculated from compressive strength for the ultrafine filler materials, which were found to strongly depend on curing time, mix composition and filler fineness. k values were determined ranging from 0.20 to 1.14 for the same filler material. Therefore, the concept of k values for evaluation of the performance of the ultrafine filler was found to be of little use. The complete mix design has to be taken into account in order to evaluate the performance of the concrete. Drying shrinkage as it is tested according to standard was found to be misleading. Values recorded for up to one year showed substantial differences between the mixes. After 4 years the data indicated that it is mainly the total water content of the concrete that defines the final shrinkage, this correlates with Bureau of Reclamation (1942) and Aïtcin (199). On a logarithmic timescale, the shrinkage curves produce inclined
Chapter 5 Results and discussion
102
straight lines which indicate that shrinkage will continue for long periods of time, see also Troxell et al. (1958). Shrinkage data for concrete mixes to be found in the literature, tested for less than a year and denoted final shrinkage, are questionable. The effect of high contents of silica fume was investigated in another basic series of experiments. Silica fume contents up to 40 wt. % of the binder were tested. It was found that a silica fume content of more than 15 wt. % of the binder gave a distinct increase in compressive strength. The final strength of concrete with 15 wt. %, 25 wt. % and 40 wt. %, respectively, was found to be similar, only the strength development differs. The higher the silica fume content, the slower the compressive strength develops. This is presumably a result of the reduced content of clinker. When using such high content of silica fume in concrete, all portlandite is consumed and forms strength-contributing C-S-H. However, with silica fume content of more than about 18 wt. % of the binder, not enough portlandite is available for reaction with silica fume and consequently the chemistry of the C-S-H will be altered. Investigations of the microstructure were not performed in this basic series but the literature points out that the interfacial transition zone will be improved (Kronlöf 1994, Kjellsen & Lagerblad 1999). Shrinkage values are most likely to increase with higher content of silica fume; the literature gives clear indications (e.g. Jensen & Hansen 2001) that the autogenous shrinkage will increase. The possibilities that arise when inert ultrafine particles and silica fume are combined could be seen when cement and silica fume were inter-ground with quartz sand. The particle size distribution of the produced binder was not determined but presumably some percentage of the quartz was ground ultrafine. The observed increase in compressive strength may be contributed to the fine ground quartz as the binder which was used for comparison was inter-ground as well, but without quartz sand. When replacing cement with ultrafine particles, it was observed that the particle size distributions of the complete mix composition got closer to continuous grading curves according to the modified Andreassen model than in conventional concrete. Therefore, this model was used to optimise concrete compositions with low cement content. The particle size distribution was adjusted to follow a grading curve with a distribution modulus between 0.20 and 0.30. According to the literature (Brouwers & Radix 2005, Brameshuber & Uebachs 2006 amongst others) and experiments by the author, particle systems which follow a particle size distribution with those distribution modules result in concrete with good workability and strength. Calculations of the minimum expected porosity showed that a dense particle packing was achieved (assuming all particles as perfect spheres). First, optimisations were done on concrete compositions with low cement content and ultrafine filler. Even though the determined particle size distributions were similar, concrete properties were not. The particle size analyses of the ultrafine particles includes several assumptions, amongst other is an equivalent spherical diameter calculated for the analysed particles when using laser diffraction. The wollastonite used in the experiments had an aspect ratio of approximately 8:1. Presumably, the particles size distribution measured with laser diffraction was not even close to the real PSD of the wollastonite. In case of fibrous wollastonite as ultrafine filler, the concrete had bad workability, comparably low compressive strength and high drying shrinkage. The fibrous wollastonite particles were most likely not able to be packed densely, they were hindering the formation of a dense
Chapter 5 Results and discussion
103
microstructure and led to increased capillary porosity. Ultrafine quartz/cristobalite proved to be suitable materials (besides limestone which is known to give good results). Mixes with only 150 kg/m3 and 100 kg/m3 of cement and high content of quartz and cristobalite filler achieved one year compressive strength of 80 MPa and 65 MPa. The drying shrinkage of those mixes 6 months after casting was below 0.5 mm/m, which is presumably a result of the low water content. However, earlier results indicate that the shrinkage will continue for long periods of time, so these values are likely to increase. In order to be able to utilise the full effect of ultrafine particles and achieve the best possible packing according to the modified Andreassen model, the concrete compositions with low cement content had to be completed with silica fume (or other materials of similar fineness). The cement content of those mixes was between 60 and 150 kg/m3 concrete. The grading curves of the tested concretes were adjusted as closely as possible to the Andreassen grading curves, especially at a grain size below 125 μm. That required content of silica fume above 20 wt. % of the binder content. In combination with large amounts of ultrafine quartz particles, densely packed systems with relatively low internal porosity were achieved. Quartz particles have a suitable particle shape and no internal porosity which had positive influence on the workability of the concrete mixes. Still, effective superplasticizers were a necessity in order to avoid flocculation and enable flow in these densely packed particle systems with low amounts of cement and water. Optimised concrete mixes with only 150 kg/m3 of portland cement may still achieve more than 100 MPa in long-term compressive strength. The strength development of these mix compositions was slow, but unlike conventional concrete, the compressive strength keeps increasing for years. Investigations of the microstructure showed that the ultrafine quartz particles reinforce the cement paste, separate cement grains and are closely packed to large aggregate grains. In combination with silica fume, the thickness of the ITZ was greatly reduced, mostly to a value not detectable at all. The high content of silica fume gave a cement paste without portlandite. Large portlandite crystals are often formed in the vicinity of larger aggregate grains. They reduce the bond between cement paste and aggregate grains. The pore structure of the paste was altered by addition of the ultrafine particles, almost no coarse capillary porosity was detectable. Due to the high content of silica fume and low amount of water in the mixes, the recorded drying shrinkage was presumably only partly a result of water loss. Changes in the chemistry and structure of the paste (recrystallisation and polymerisation) may have a large contribution to the recorded shrinkage. Similar to results obtained on concretes where cement was replaced by ultrafine filler, the shrinkage continued for long periods of time. Up to one year, it seemed that the high content of silica fume might result in higher shrinkage than for conventional concrete. After 4 years, no difference between optimised concrete with low cement content and ultrafine filler and conventional concrete was recorded. The inclination of the recorded shrinkage curves in logarithmic timescale implies that shrinkage will not stop for long time. The modification of the complete particle size distribution of a concrete according to the modified Andreassen distribution was also successful for high-strength concrete and RPC compositions. Based on the results of the earlier experiments, quartz was chosen as ultrafine filler. Exchanging more than 30 wt. % of the binder with suitable ultrafine particles gave a better grading curve and allowed also some reduction of the total water content of the mix compositions. The mixes with reduced binder content had similar

Chapter 5 Results and discussion
104
workability of the fresh concrete and similar final strength. The strength development of the high-strength concrete was slowed down slightly, presumably due to the increased content of superplasticizer (retarding effect). Still, containing only 350 kg/m3 binder at a w/b of 0.40 resulted in 28-day compressive strength of 100 MPa and 3 year compressive strength of more than 160 MPa. This illustrates the effectiveness of the ultrafine particles. The investigations of the microstructure showed again, as observed in the earlier test series, that the ultrafine particles in combination with silica fume eliminated the ITZ around the larger aggregate grains. The paste was homogenous at macro- and micro-level; the similarity condition on which Andreassen based his theory of particle packing could be observed on samples of hardened concrete in the microscope. The slightly blurred edges of the ultrafine quartz particles in high resolution SEM investigations indicated a slow pozzolanic reaction. That should improve the bond between cement paste and ultrafine filler and could explain the observed strength increase over long time. This applies also to the RPC compositions with the difference that the aggregate size is largely reduced and high amounts of unreacted cement remain. The reduced aggregate size enhanced the homogeneity of the concrete structure, ITZ around aggregate particles were not detected. Due to the low water-binder ratio, large contents of cement remain unhydrated and act as additional filler that is well integrated into the paste structure. Due to its reactivity, a cement particle will be bound well to the surrounding paste. The pH in the paste of the RPC compositions is presumably lower than in conventional concrete, comparison of the measured CaO-SiO2 ratio with data from the literature indicated a pH of 11-12. The porosity of the high-strength concrete was measured to contain mainly gel pores and very fine capillary pores, the RPC had almost no measurable porosity, regardless modifications. Autogenous shrinkage of RPC was found to be linear in a logarithmic time scale, after 5 years of testing there was no indication that the determined shrinkage curves will deviate from straight lines in single-logarithmic scale. Higher content of silica fume resulted in increased autogenouse shrinkage. Chemical processes (recrystallisation and polymerisation) may be responsible for the ongoing shrinkage. A restraining effect of large amounts of small fibres on free autogenous shrinkage was observed. It was found that modification of concrete with ultrafine filler and effective packing was not sufficient measures to realise freeze-thaw resistant concrete in the presence of de-icing solution. All concrete compositions with exception of the RPC, which had an extremely dense microstructure, failed the Swedish test on frost resistance with de-icing solution. The microstructure, with exception of the RPC, was not dense enough to hinder salt solution from entering the capillary system, as a result critical saturation was reached and scaling occurred. However, increased packing density by means of inert ultrafine particles and silica fume improved the resistance of the optimised concretes to frost scaling, compared to a conventional concrete. The denser pore structure made it more difficult for water to fill the capillary system and reach critical saturation. Still, entrained air would be required in order to make the concrete compositions frost resistant. In case of the RPC, it was found that the substitution of almost one third of the cement content with ultrafine filler had no negative influence on the excellent frost resistance. The results from MIP, capillary suction and compressive strength already indicated that the microstructure was equally dense, which was confirmed by the freeze-thaw tests.
Chapter 6 Conclusions
105
Chapter 6
Conclusions
6.1 General
The influence of ultrafine particles on concrete properties was investigated. Different minerals were tested, all of them are commonly regarded as inert or possibly low reactive. The results show that ultrafine minerals have a profound effect on concrete properties. The ultrafine particles influence cement hydration, particle packing, compressive strength and shrinkage amongst others. Ultrafine particles can replace substantial amounts of cement in concrete. Important for the effectiveness of the ultrafine fillers is the mode of cement replacement and the degree of packing that can be achieved in the complete particle system that builds up concrete. Different grading curves with higher contents of fines, resulting in higher packing density of the particle system, are applicable to concrete mixes today due to the development of efficient superplasticizers. The concept of ultrafine particles is already utilised to a certain extent in CEM II-L cements where up to 20 wt. % of clinker is substituted by limestone. As limestone is softer than cement clinker, it becomes ultrafine within the grinding process. The results from this work show that this replacement can be done with more minerals and in an improved way. Some of the essential properties of the particle system building up concrete are its particle size distribution and packing density. Highly packed systems with a suitable particle size distribution give good workability in the fresh state and strong and durable concrete in the hardened state. Continuous particle size distributions are common in the ingredients for concrete and therefore a particle packing theory based on continuous size distributions was used in the experiments. Concretes were composed according to the modified Andreassen model (Dinger & Funk, 1992, 1993, 1994). This model is rather well established in ceramics and other processing industries dealing with ultrafine particles. Ideal grading according to the modified Andreassen model requires addition of particles finer than cement. Silica fume as solitary additive is too fine, addition of particles in the size between cement and silica fume is required. By doing so, mixes with low internal porosity can be designed. That allows mix compositions with low water and cement content. Due to the low content of cement clinker, the compressive strength development is slow but high long-term strength is achievable. The compressive strength keeps increasing over long time, especially in combination with silica fume. The modified Andreassen model is also
Chapter 6 Conclusions
106
applicable to high-strength concrete and RPC. Large contents of cement can be replaced by suitable ultrafine particles without strength reduction or negative influence on other concrete properties. The workability of the fresh concrete can be influenced by the choice of the distribution modulus q in the modified Andreassen model. For conventionally vibrated concrete, a distribution modulus of 0.30 was found to be suitable. Self-compacting mixes should have a lower distribution modulus between 0.20 and 0.25. Such a distribution modulus results in higher content of fines in the mix, ensuring stability and flowability. The concept of calculating k values for ultrafine inert materials from compressive strength was tested and found to be inconclusive. The calculated k values were strongly depended on the fineness of the particles and the mode of cement replacement. For low percentage of cement replacement by ultrafine inert materials (up to 20 wt. %), a k value of 1 may be used. This is similar to CEM II-L cements. At higher content of ultrafine inert materials in concrete, k values of 0.3 – 0.4 are more realistic. Still, prediction of the compressive strength based on the equivalent w/c alone will be inaccurate and should only be used to get an idea of the compressive strength of the mixes. Shrinkage (drying and autogenous) was tested over long time (up to 5 years) and found to be ongoing for the whole test period. Shrinkage plots on a logarithmic timescale produce almost straight inclined lines. For drying shrinkage, the governing factor was found to be the total water content of the mixes, not the cement content, w/c or the mechanical strength. That was already proposed by Shacklock & Keene (1957). Autogenous shrinkage of concrete with high content of silica fume was found to go on in time as well, most likely due to chemical reactions and rearrangements in the paste. Investigations of the microstructure of modified concrete compositions with MIP, capillary sorption and microscopy explained the observed results. The paste structure is densified due to improved packing on a micro-level. The frost resistance of concrete in presence of de-icing solutions can be improved when modifying the concrete with ultrafine particles. But except for extremely dense RPC compositions, entrained air is still required in order to ensure frost resistance with de-icing solutions.
Chapter 6 Conclusions
107
6.2 Application of ultrafine particles to mix designs
The suggested mix design concept is based on packing of particles and optimisation of the grading of the aggregate and powder fraction of a concrete mix. At present time, most mix design methods optimise primarily the grading of the aggregates. In the mix design concept suggested here, cement is regarded as powder and the powder content is adjusted in order to achieve a good fit to the modified Andreassen distribution. Water is added as necessary in order to achieve flowability. This implies that no attention is paid to minimum cement contents or equivalent water-cement ratios in concrete as prescribed by recent concrete standards (e.g. EN 206-1). The suggested mix design concept will be most suitable for a performance based design concept or special applications. Implementation in today’s prescriptive design concept (e.g. EN 206-1) is of course possible but presumably one will get unnecessarily high cement content and final strength. Differentiation is made between simply replacing a certain content of cement by ultrafine particles and modification of the whole mix design in order to utilise the full effect of particle packing. When replacing up to 20 wt. % of cement by suitable ultrafine particles, the mix design will only need minor adjustments. Due to the higher specific surface of the ultrafines, the dosage of superplasticizer may have to be increased for similar workability. As the experiments showed, the compressive strength, long-term shrinkage and porosity of the modified concrete will be similar. However, this is not how the full effect of ultrafine particles may be utilised. Optimising a concrete mix is an iterative process. It is essential to determine the particle size distributions of all involved materials before starting the optimisation process of a mix design. Many parameters characterising a mix design may be determined theoretically but trial mixes in the laboratory are unavoidable. Based on the experiments and findings in this work, the following procedure is recommended. When following the steps of the optimisation process manually, one may be forced to go back one or two steps in order to achieve the desired results. In a computer programmed procedure, this iteration process can be included.
1) Identification of requirements on concrete composition and choice of packing model
First, the requirements on the concrete mix the mix design must be identified. Based on the findings of this work, only some properties of a mix design can be included at present time. Choices must be made concerning the desired workability (vibrated or self-compacting concrete) and the compressive strength. Further research is required before predictions of the durability can be included. Until then, tests of the durability of the finished mix design are required. Within the context of this work, the modified Andreassen model proved to be a valuable tool for optimising the granular mix of concrete. Therefore, this model will be used in the optimisation process.
Chapter 6 Conclusions
108
2) Choice of distribution modulus A distribution modulus for the modified Andreassen distribution has to be chosen, depending on the desired flowability of the resulting concrete mix. For vibrated concrete, a distribution modulus of 0.30 to 0.35 is suitable. Self-compacting concrete requires higher content of fines, a distribution modulus of 0.20 to 0.25 is recommended (Brouwers & Radix 2005, Brameshuber & Uebachs 2006, Fennis et al. 2007, Hüskens & Brouwers 2008). For high-strength concrete and RPC, the author recommends a distribution modulus of 0.20 or below.
3) Choice of powder content and powder composition The powders in the concrete mix are silica fume, cement and ultrafine fillers. The fines of the aggregates are neglected in this step. For the best performance, a binder composition (binder = cement + silica fume) with at least 10 wt. % of silica fume is recommended. The minimum volume of powder that is required to ensure a high degree of packing according to the modified Andreassen model depends on the distribution modulus that was chosen in step 2 and can be found in Figure 71 or calculated from (Eq.10) in section 3.1.2. The powder composition can be defined by the required compressive strength of the mix. Based on the experiments in this work, the long-term compressive strength (one year value) of fully optimised mixes will be at least around 0.22-0.25 MPa/kg equivalent binder. This was found to be valid as long as the water-powder ratio of the final mix is around 0.30 or below. Predictions of the compressive strength at earlier age can be done using a linear development of the compressive strength on a logarithmic time scale. Based on the results of the experimental work, the equivalent binder content can be calculated from the amounts of powders in the mix. This can be done using the estimated correlation factors in Table 21 for the powders other than cement. All experiments in this work were done using CEM I. There are no experiences with other types of cement like composite cement or slag cement. The lowest cement content tested was 60 kg/m3 concrete. Naturally, the strength development was slow. Higher content of cement in the powder fraction will result in faster strength development and also increased final strength. Based on the findings of this work, suitable ultrafine fillers are quartz, limestone and cristobalite. Table 21: Estimated correlation factors for calculation of an equivalent binder content.
ideal other Silica fume 2 (up to 25 wt. % of C + SF) 1.5 (above 25 wt. % of C + SF) Cement CEM I 1 1 Ultrafine filler 0.4 (median grain size < 5 μm) 0.3 (median grain size > 5 μm) The final composition of the equivalent binder depends on the grading curves of the available powders, the results from curve fitting (step 5) may force one to repeat this step.
Chapter 6 Conclusions
109
4) Choice of water content The choice of the correct water content of a concrete mix, based only on material properties and mix composition, is difficult. Laboratory testing of all involved materials is a necessity. The literature (de Larrard (1999), Marquardt (2001) and Brouwers & Radix (2005) amongst others) provides solutions for the determination of water demands of the ingredients in a mix design. The water content of the concrete mix can be calculated from the water demands of the ingredients. Another, quicker possibility is to define the water content of the concrete mix according to experience and simple key values. For concrete with maximum aggregate size of 16 mm, a water-powder ratio of 0.30 has proven to result in workable mixes within the limitations of this work. Using the powder content determined in step 3 and a water-powder ratio of 0.30, the water content of the concrete mix can be calculated. If the mix design aims for high-strength concrete, the water-powder ratio may have to be lower than 0.30. Independent of the way of determinating the water content in the mix design, laboratory testing will be required.
5) Optimisation of proportions of aggregates and powders In order to be able to optimise the complete mix design according to the modified Andreassen model, the PSD of aggregates and powders have to be tested. Aggregates are preferably tested by sieving, powders with laser diffraction or other approved methods. The contents of the different aggregate fractions and powders are determined using curve fitting to the modified Andreassen distributions, see Figure 71. Curve fitting may be done manually with the help of graphical display of the combined grading curve of aggregates and powders. In the graphical solution, it is suitable to optimise the aggregate fraction from 0.125 mm up to the maximum grain size using a single-logarithmic graph. The powder from a grain size of 0.125 mm to the minimum grain size should be optimised using a double-logarithmic graph. This can easily be done with the help of spread sheet software. The curve fitting problem can also be solved numerically e.g. by the method of least squares or another suitable mathematical procedure. The results of the curve fitting may force one to go back to step 3 if the calculated powder composition and content differ too much from the composition that will provide the required compressive strength. Note that this work is based on the use of natural fine aggregate (0-8 mm), crushed fine aggregate was not tested.
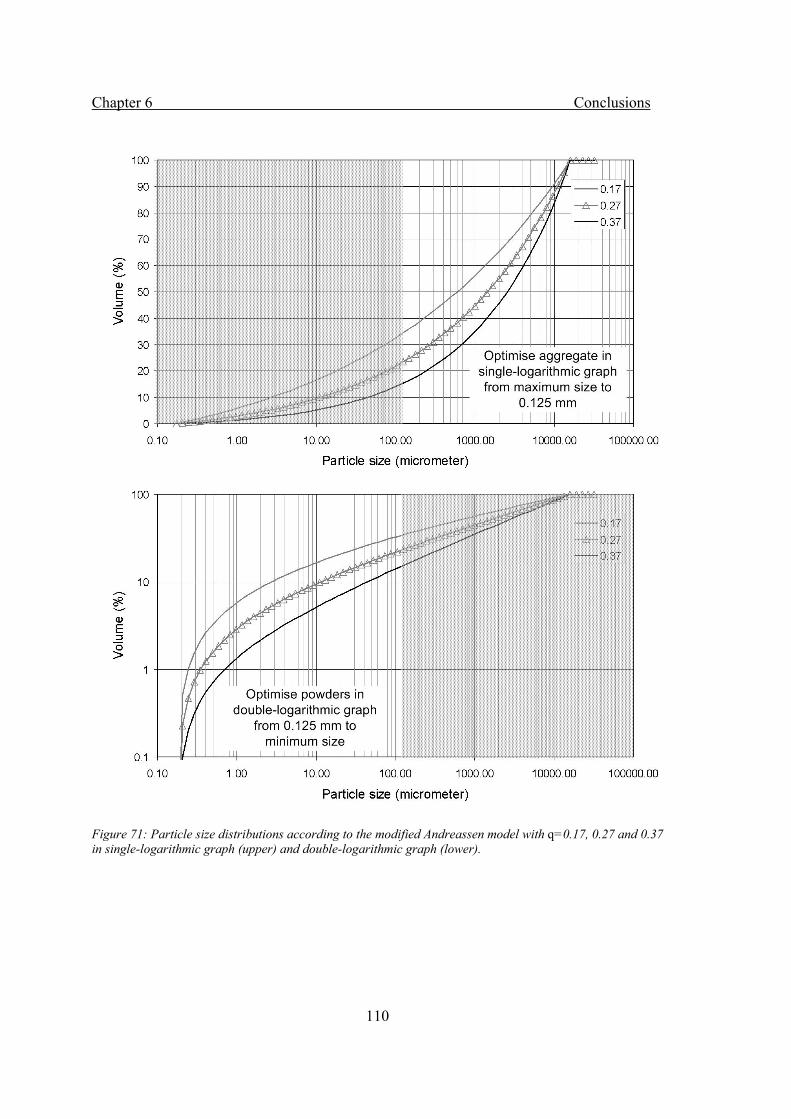
Chapter 6 Conclusions
110
Figure 71: Particle size distributions according to the modified Andreassen model with q=0.17, 0.27 and 0.37 in single-logarithmic graph (upper) and double-logarithmic graph (lower).
Chapter 6 Conclusions
111
6) Determination of admixture content Having calculated the amounts of powders, aggregates and water in the mix, the content of admixtures has to be determined. This should be done by performing trial mixes in the laboratory. The required amount of superplasticizer depends on the desired workability of the mix. Rheological measurements (concrete viscometer) or measurement of the workability (slump, slump flow, L-box, J-ring or others) can be used to find out the required content of superplasticizer. Viscosity modifying agents were not tested in this work but they may be beneficial for increased stability of high flowable and self-compacting mixes; their content should be determined with the help of rheological measurements or measurements of workability. Air entraining agents were not tested in this work but are likely to work as expected. For each volume percent of entrained air, the compressive strength will be reduced by approximately 5- 6 % (Neville, 1995).
7) Final mix composition Recalculate the mix design with respect to the content of admixtures and their water content. The small volume deviations are preferably corrected by adjusting the aggregate content.
Chapter 6 Conclusions
112
6.3 Future research
The modification of concrete with ultrafine particles has a great potential. Concrete with lower environmental impact and improved properties can be produced. The results of this work imply that a replacement of substantial amounts of cement by suitable ultrafine particles does not have a negative influence on important concrete properties. The subject is obviously of interest, as other researchers from different countries are investigating the influence of ultrafine particles on concrete properties as well. The results of this work should be taken as a starting point for further development. Within the limitations of this work, not all relevant properties of the modified mix compositions could be investigated. The influence of the altered concrete composition with ultrafines on e.g. carbonation, permeability, chloride diffusion, sulphate resistance, alkali silica reaction, reinforcement corrosion, and creep needs to be investigated and quantified. The results from MIP and capillary suction suggest that the microstructure will be at least as dense as in conventional concrete when ultrafines replace cement in the right way. Therefore, the ingress of deteriorating substances is not likely to be increased, resulting in similar durability considering permeability and chloride diffusion. As the amount of cement is reduced, the binding capacity for chlorides and carbon dioxide is reduced. That suggests that the threshold value for chloride induced reinforcement corrosion may be lower and carbonation may progress faster. However, if a reduced permeability is achieved by means of ultrafines, diffusion of deteriorating substances may be slower. Considering harmful reactions of hydration products with e.g. sulphates or reactive aggregate, reduced cement content usually results in better concrete durability. In order to make the concept of concrete with ultrafine particles interesting for the industry, cost efficiency is required. At present time, some of the ultrafine minerals used in this work are too costly for concrete mass production. Intensified research on suitable by-products with lower environmental impact and cost is required. The investigation done by Moosberg-Bustnes (2003) gives suggestions and describes suitable test methods to identify by-products that could be used in concrete. Silica fume is costly and not always available; metakaoline or ultrafine ground slag could be used instead. A mix design concept, which is based on the modified Andreassen model and includes ultrafine particles in the concrete composition, was suggested. This concept should be improved and refined. Especially refinements of the water requirement of calculated mixes and predictions of the workability seem necessary. Intensified investigations on the fresh concrete properties with ultrafines are recommended. Within this work, naturally rounded fine aggregate was tested. Due to environmental issues, the accessibility to this type of fine aggregate will be reduced in the future. Therefore, crushed fine aggregate in combination with ultrafine particles should be examined and the suitability of the modified Andreassen model for crushed fine aggregate should be tested.
Chapter 7 Applications
113
Chapter 7
Applications
In this chapter, applications for some of the concepts which were developed in this work are described.
7.1 Low pH self-compacting concrete
This application of the low cement silica concrete (LCSC) describes some parts of a project ordered by the Swedish Nuclear Waste Management (SKB AB). SKB required a low pH concrete to construct plugs in order to seal off deposition tunnels in a planned repository for nuclear waste. According to current understanding, the use of low pH concrete should not disturb the swelling function of the bentonite, which is the primary sealing mechanism in the repository concept. A low pH concrete is a concrete with a pH (pH < 11) lower than normal concrete (pH > 12.5). The low pH concrete in this program is achieved by replacing 40 % by weight of the binder with silica fume. The concrete should be self-compacting, have at least 50 MPa in compressive strength, develop low heat during hydration, have low shrinkage and be producible in a normal concrete plant. The thermal, viscoelastic and shrinkage properties of the concrete had to be quantified as they are required for evaluation of the thermal crack risk and structural calculations. For more information, see the complete report (Vogt et al, 2009). In the previous section, quartz filler was used in the LCSC compositions. As the industrial use of fine ground crystalline quartz is restricted due to health hazards, crushed limestone was used as filler material. In order to utilise the advantages of ultrafine particles, Limus 25 which is one of the most fine-ground limestone filler for concrete applications on the Swedish market, was used. The other components used are cement CEM I 42.5-MH/SR/LA, densified silica fume 920 D, natural fine aggregates (0-8 mm) from Vimmerby and crushed coarse aggregates (8-16 mm) from Kolmetorp as well as polycarboxylate based superplasticizer. Grading curves and material properties can be found in section 4.1. The previous positive experiences with application of the modified Andreassen model to the particle size distribution in concrete were used. The binder content of the concrete was fixed, two binder contents of 200kg/m3 and 300kg/m3 were investigated. The PSD of the
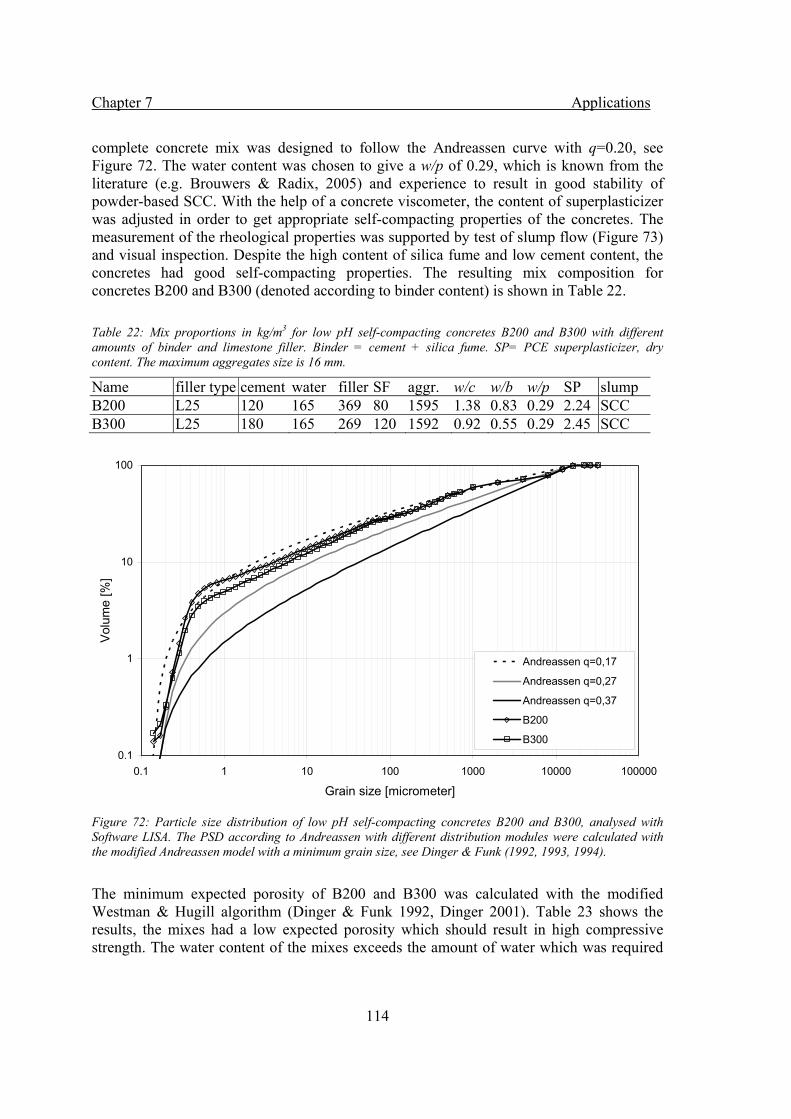
Chapter 7 Applications
114
complete concrete mix was designed to follow the Andreassen curve with q=0.20, see Figure 72. The water content was chosen to give a w/p of 0.29, which is known from the literature (e.g. Brouwers & Radix, 2005) and experience to result in good stability of powder-based SCC. With the help of a concrete viscometer, the content of superplasticizer was adjusted in order to get appropriate self-compacting properties of the concretes. The measurement of the rheological properties was supported by test of slump flow (Figure 73) and visual inspection. Despite the high content of silica fume and low cement content, the concretes had good self-compacting properties. The resulting mix composition for concretes B200 and B300 (denoted according to binder content) is shown in Table 22. Table 22: Mix proportions in kg/m3 for low pH self-compacting concretes B200 and B300 with different amounts of binder and limestone filler. Binder = cement + silica fume. SP= PCE superplasticizer, dry content. The maximum aggregates size is 16 mm.
Name filler type cement water filler SF aggr. w/c w/b w/p SP slump B200 L25 120 165 369 80 1595 1.38 0.83 0.29 2.24 SCC B300 L25 180 165 269 120 1592 0.92 0.55 0.29 2.45 SCC
Figure 72: Particle size distribution of low pH self-compacting concretes B200 and B300, analysed with Software LISA. The PSD according to Andreassen with different distribution modules were calculated with the modified Andreassen model with a minimum grain size, see Dinger & Funk (1992, 1993, 1994).
The minimum expected porosity of B200 and B300 was calculated with the modified Westman & Hugill algorithm (Dinger & Funk 1992, Dinger 2001). Table 23 shows the results, the mixes had a low expected porosity which should result in high compressive strength. The water content of the mixes exceeds the amount of water which was required
0.1
1
10
100
0.1 1 10 100 1000 10000 100000
Grain size [micrometer]
Vol
ume
[%]
Andreassen q=0,17
Andreassen q=0,27
Andreassen q=0,37
B200
B300
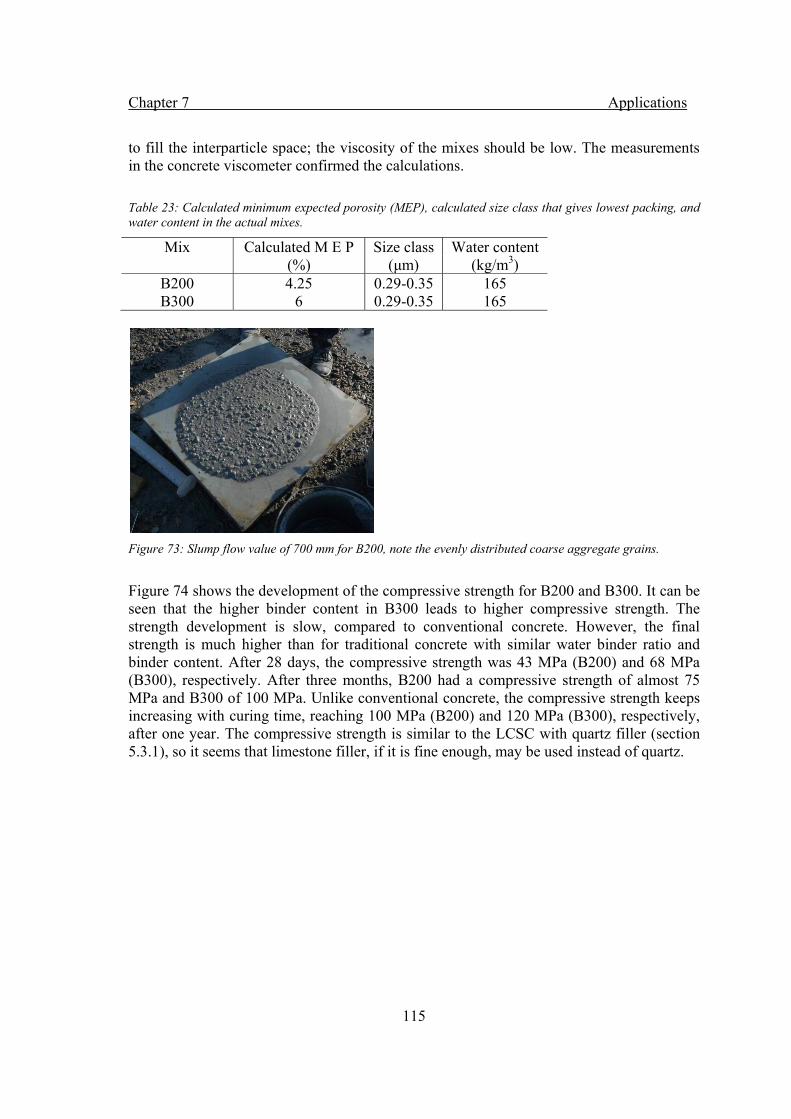
Chapter 7 Applications
115
to fill the interparticle space; the viscosity of the mixes should be low. The measurements in the concrete viscometer confirmed the calculations. Table 23: Calculated minimum expected porosity (MEP), calculated size class that gives lowest packing, and water content in the actual mixes.
Mix Calculated M E P Size class Water content (%) (μm) (kg/m3)
B200 4.25 0.29-0.35 165 B300 6 0.29-0.35 165
Figure 73: Slump flow value of 700 mm for B200, note the evenly distributed coarse aggregate grains.
Figure 74 shows the development of the compressive strength for B200 and B300. It can be seen that the higher binder content in B300 leads to higher compressive strength. The strength development is slow, compared to conventional concrete. However, the final strength is much higher than for traditional concrete with similar water binder ratio and binder content. After 28 days, the compressive strength was 43 MPa (B200) and 68 MPa (B300), respectively. After three months, B200 had a compressive strength of almost 75 MPa and B300 of 100 MPa. Unlike conventional concrete, the compressive strength keeps increasing with curing time, reaching 100 MPa (B200) and 120 MPa (B300), respectively, after one year. The compressive strength is similar to the LCSC with quartz filler (section 5.3.1), so it seems that limestone filler, if it is fine enough, may be used instead of quartz.
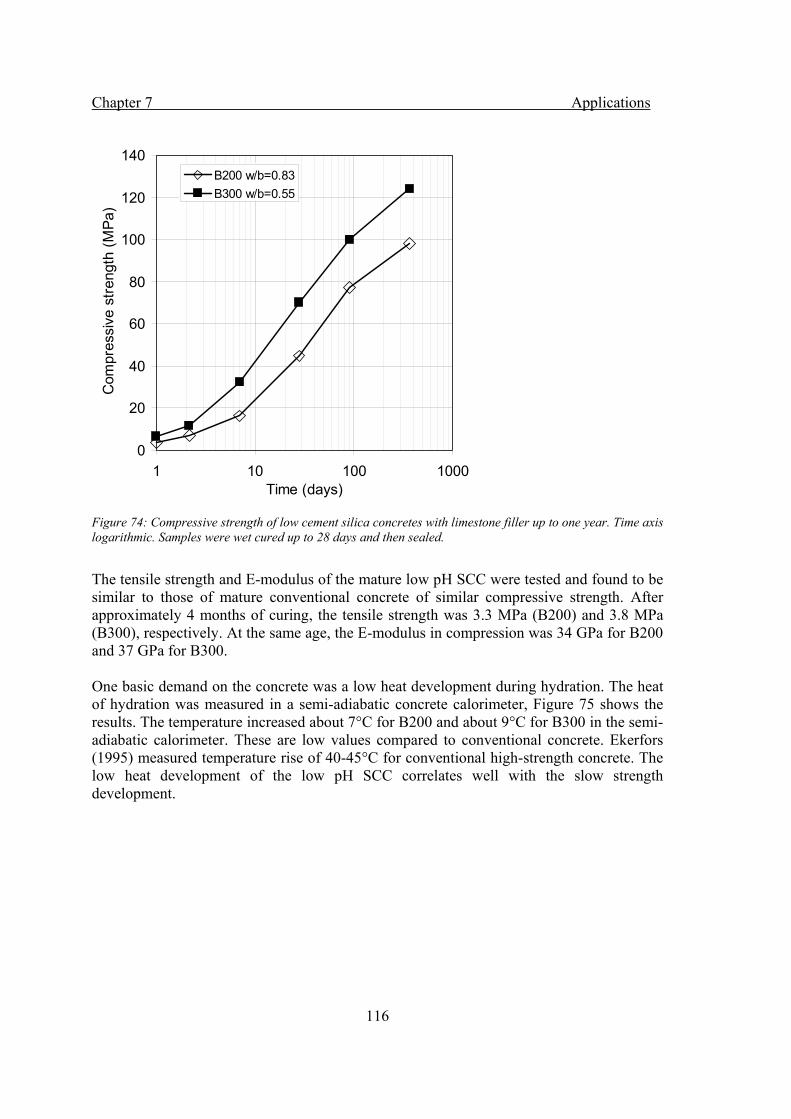
Chapter 7 Applications
116
Figure 74: Compressive strength of low cement silica concretes with limestone filler up to one year. Time axis logarithmic. Samples were wet cured up to 28 days and then sealed.
The tensile strength and E-modulus of the mature low pH SCC were tested and found to be similar to those of mature conventional concrete of similar compressive strength. After approximately 4 months of curing, the tensile strength was 3.3 MPa (B200) and 3.8 MPa (B300), respectively. At the same age, the E-modulus in compression was 34 GPa for B200 and 37 GPa for B300. One basic demand on the concrete was a low heat development during hydration. The heat of hydration was measured in a semi-adiabatic concrete calorimeter, Figure 75 shows the results. The temperature increased about 7°C for B200 and about 9°C for B300 in the semi-adiabatic calorimeter. These are low values compared to conventional concrete. Ekerfors (1995) measured temperature rise of 40-45°C for conventional high-strength concrete. The low heat development of the low pH SCC correlates well with the slow strength development.
0
20
40
60
80
100
120
140
1 10 100 1000Time (days)
Com
pres
sive
stre
ngth
(MPa
)
B200 w/b=0.83B300 w/b=0.55
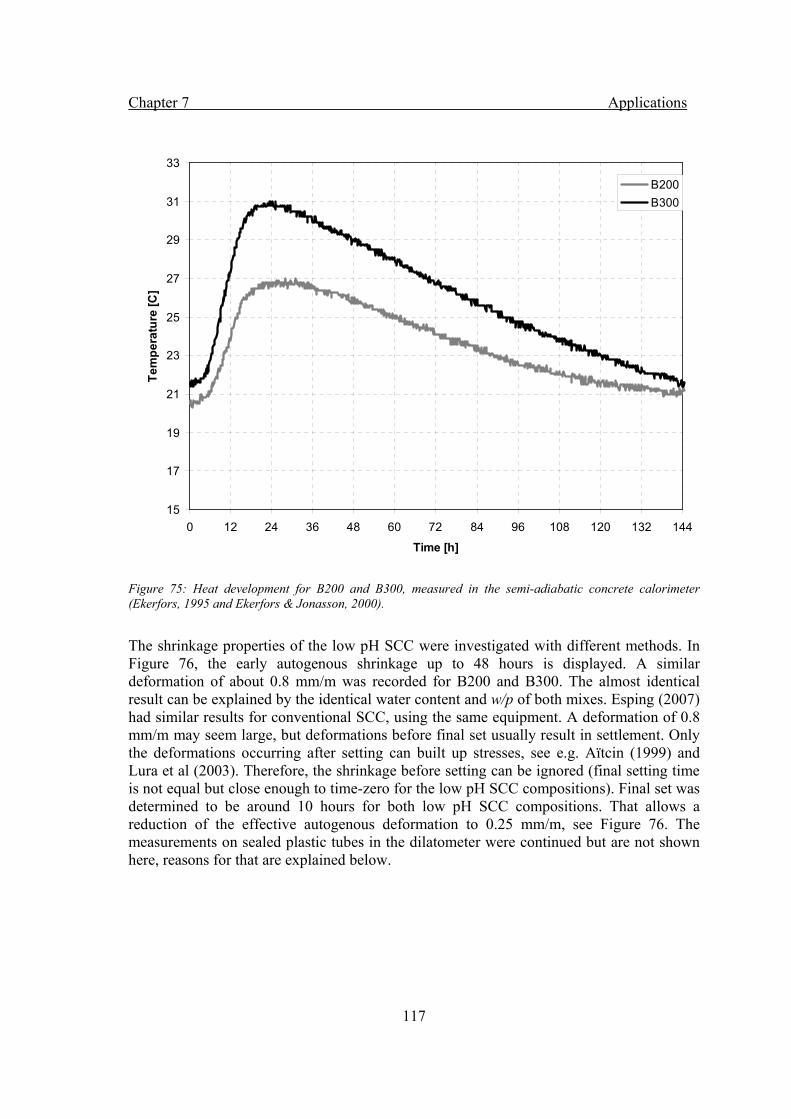
Chapter 7 Applications
117
Figure 75: Heat development for B200 and B300, measured in the semi-adiabatic concrete calorimeter (Ekerfors, 1995 and Ekerfors & Jonasson, 2000).
The shrinkage properties of the low pH SCC were investigated with different methods. In Figure 76, the early autogenous shrinkage up to 48 hours is displayed. A similar deformation of about 0.8 mm/m was recorded for B200 and B300. The almost identical result can be explained by the identical water content and w/p of both mixes. Esping (2007) had similar results for conventional SCC, using the same equipment. A deformation of 0.8 mm/m may seem large, but deformations before final set usually result in settlement. Only the deformations occurring after setting can built up stresses, see e.g. Aïtcin (1999) and Lura et al (2003). Therefore, the shrinkage before setting can be ignored (final setting time is not equal but close enough to time-zero for the low pH SCC compositions). Final set was determined to be around 10 hours for both low pH SCC compositions. That allows a reduction of the effective autogenous deformation to 0.25 mm/m, see Figure 76. The measurements on sealed plastic tubes in the dilatometer were continued but are not shown here, reasons for that are explained below.
15
17
19
21
23
25
27
29
31
33
0 12 24 36 48 60 72 84 96 108 120 132 144
Time [h]
Tem
pera
ture
[C]
B200B300

Chapter 7 Applications
118
Figure 76: Measurement of early autogenous deformations for B200 and B300, using the modified dilatometer after Esping (2007). The measurement started 30 min after water addition. The final set was determined to be approximately 10 hours. Early compressive strength values are displayed as well.
Autogenous shrinkage after 24 hours was measured on sealed beam samples (Figure 77). The higher binder content in concrete B300 results in a higher shrinkage. The values are low, 0.24 mm/m for B200 and 0.33 mm/m for B300 after about two years. However, the measurement started after 24 hours, so the total autogenous deformation is larger. About 0.25 mm/m have to be added, these values were determined with the dilatometer. The drying shrinkage (not measured according to SS 13 72 15, start of drying 24 hours after casting, no water curing up to 7 days) after about two years (Figure 77) was recorded to be 0.45 mm/m for B200 and 0.52 mm/m for B300, respectively. Those are low values of drying shrinkage, compared to conventional concrete.
0
0,1
0,2
0,3
0,4
0,5
0,6
0,7
0,8
0,9
1
0 4 8 12 16 20 24 28 32 36 40 44 48
Time (h)
Shri
nkag
e (m
m/m
)
0
1
2
3
4
5
6
7
8
9
Com
pres
sive
str
engt
h (M
Pa)
B200B300B200B300
Fina
l set
Early autogenous
shrinkage resulting in stresses
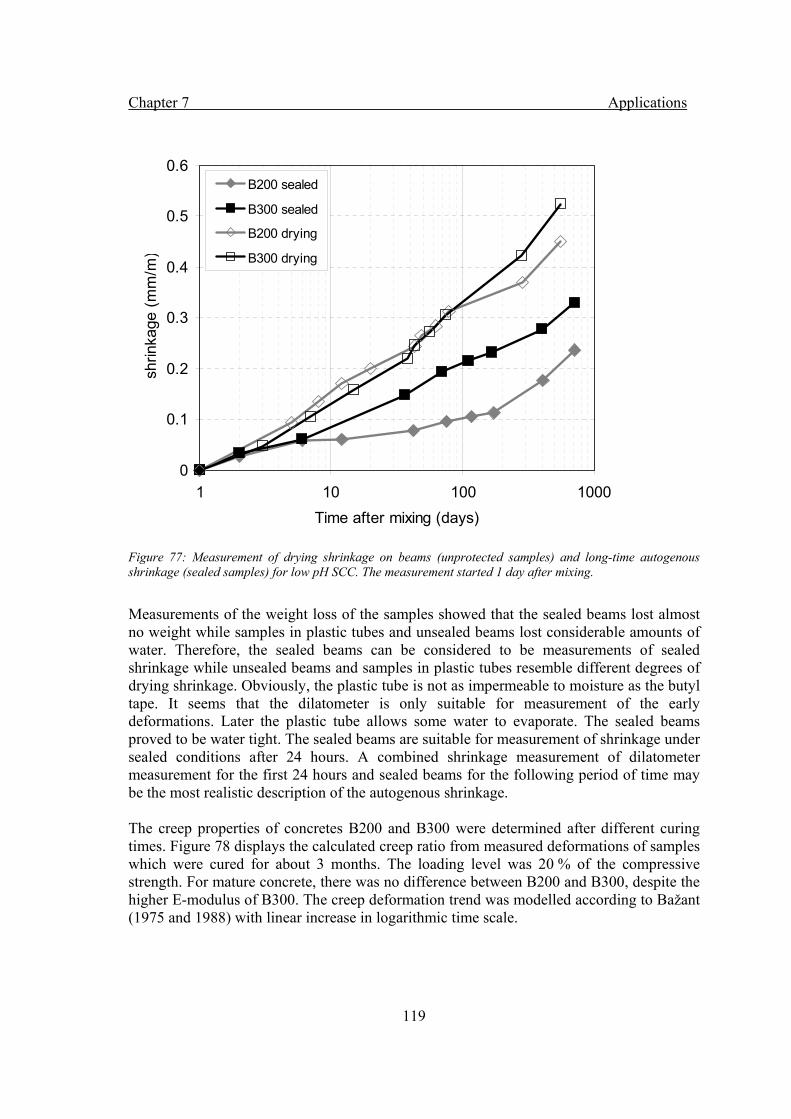
Chapter 7 Applications
119
Figure 77: Measurement of drying shrinkage on beams (unprotected samples) and long-time autogenous shrinkage (sealed samples) for low pH SCC. The measurement started 1 day after mixing.
Measurements of the weight loss of the samples showed that the sealed beams lost almost no weight while samples in plastic tubes and unsealed beams lost considerable amounts of water. Therefore, the sealed beams can be considered to be measurements of sealed shrinkage while unsealed beams and samples in plastic tubes resemble different degrees of drying shrinkage. Obviously, the plastic tube is not as impermeable to moisture as the butyl tape. It seems that the dilatometer is only suitable for measurement of the early deformations. Later the plastic tube allows some water to evaporate. The sealed beams proved to be water tight. The sealed beams are suitable for measurement of shrinkage under sealed conditions after 24 hours. A combined shrinkage measurement of dilatometer measurement for the first 24 hours and sealed beams for the following period of time may be the most realistic description of the autogenous shrinkage. The creep properties of concretes B200 and B300 were determined after different curing times. Figure 78 displays the calculated creep ratio from measured deformations of samples which were cured for about 3 months. The loading level was 20 % of the compressive strength. For mature concrete, there was no difference between B200 and B300, despite the higher E-modulus of B300. The creep deformation trend was modelled according to Bažant (1975 and 1988) with linear increase in logarithmic time scale.
0
0.1
0.2
0.3
0.4
0.5
0.6
1 10 100 1000Time after mixing (days)
shrin
kage
(mm
/m)
B200 sealed
B300 sealed
B200 drying
B300 drying
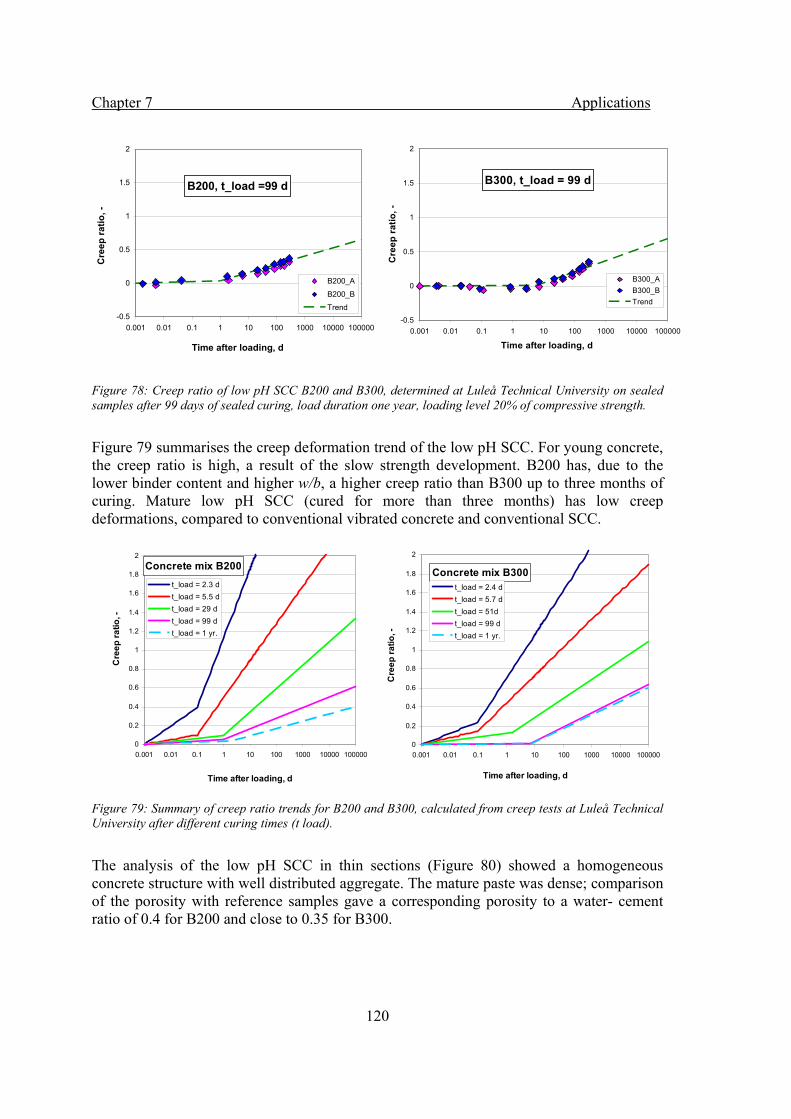
Chapter 7 Applications
120
B200, t_load =99 d
-0.5
0
0.5
1
1.5
2
0.001 0.01 0.1 1 10 100 1000 10000 100000
Time after loading, d
Cre
ep ra
tio, -
B200_A
B200_B
Trend
B300, t_load = 99 d
-0.5
0
0.5
1
1.5
2
0.001 0.01 0.1 1 10 100 1000 10000 100000
Time after loading, d
Cre
ep ra
tio, -
B300_AB300_BTrend
Figure 78: Creep ratio of low pH SCC B200 and B300, determined at Luleå Technical University on sealed samples after 99 days of sealed curing, load duration one year, loading level 20% of compressive strength.
Figure 79 summarises the creep deformation trend of the low pH SCC. For young concrete, the creep ratio is high, a result of the slow strength development. B200 has, due to the lower binder content and higher w/b, a higher creep ratio than B300 up to three months of curing. Mature low pH SCC (cured for more than three months) has low creep deformations, compared to conventional vibrated concrete and conventional SCC.
Figure 79: Summary of creep ratio trends for B200 and B300, calculated from creep tests at Luleå Technical University after different curing times (t load).
The analysis of the low pH SCC in thin sections (Figure 80) showed a homogeneous concrete structure with well distributed aggregate. The mature paste was dense; comparison of the porosity with reference samples gave a corresponding porosity to a water- cement ratio of 0.4 for B200 and close to 0.35 for B300.
Concrete mix B200
0
0.2
0.4
0.6
0.8
1
1.2
1.4
1.6
1.8
2
0.001 0.01 0.1 1 10 100 1000 10000 100000
Time after loading, d
Cre
ep ra
tio, -
t_load = 2.3 dt_load = 5.5 dt_load = 29 dt_load = 99 dt_load = 1 yr.
Concrete mix B300
0
0.2
0.4
0.6
0.8
1
1.2
1.4
1.6
1.8
2
0.001 0.01 0.1 1 10 100 1000 10000 100000
Time after loading, d
Cre
ep ra
tio, -
t_load = 2.4 dt_load = 5.7 dt_load = 51dt_load = 99 dt_load = 1 yr.
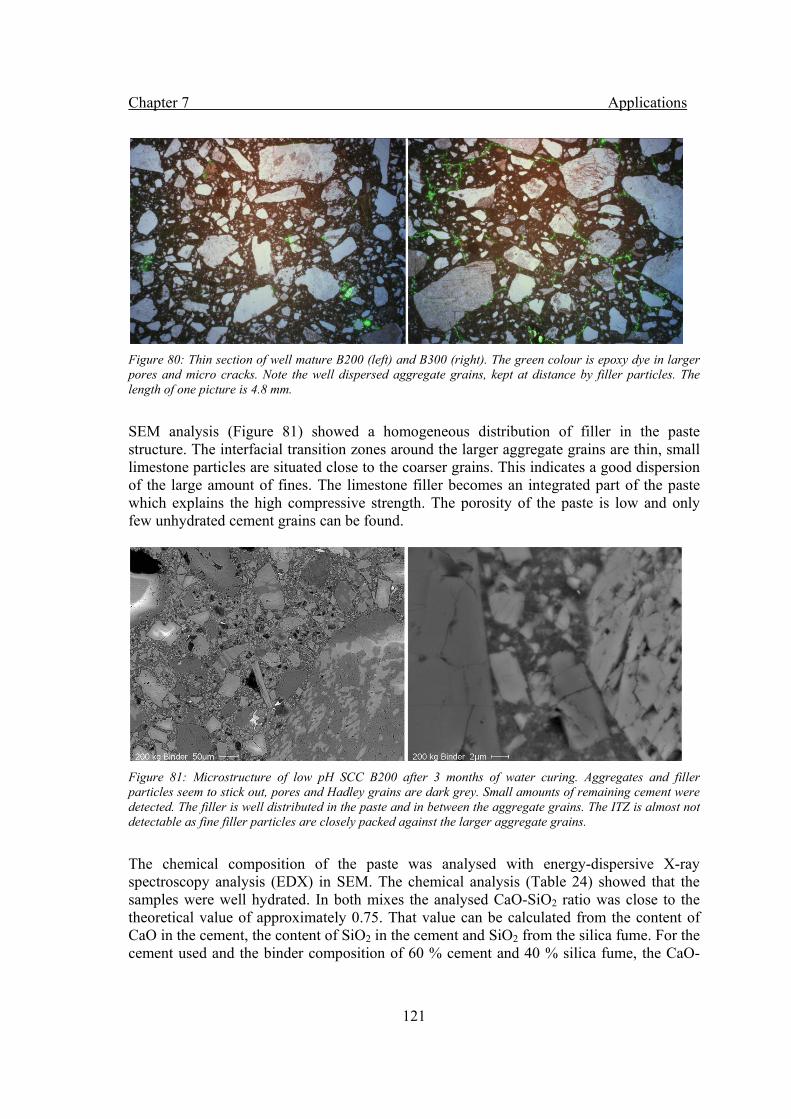
Chapter 7 Applications
121
Figure 80: Thin section of well mature B200 (left) and B300 (right). The green colour is epoxy dye in larger pores and micro cracks. Note the well dispersed aggregate grains, kept at distance by filler particles. The length of one picture is 4.8 mm.
SEM analysis (Figure 81) showed a homogeneous distribution of filler in the paste structure. The interfacial transition zones around the larger aggregate grains are thin, small limestone particles are situated close to the coarser grains. This indicates a good dispersion of the large amount of fines. The limestone filler becomes an integrated part of the paste which explains the high compressive strength. The porosity of the paste is low and only few unhydrated cement grains can be found.
Figure 81: Microstructure of low pH SCC B200 after 3 months of water curing. Aggregates and filler particles seem to stick out, pores and Hadley grains are dark grey. Small amounts of remaining cement were detected. The filler is well distributed in the paste and in between the aggregate grains. The ITZ is almost not detectable as fine filler particles are closely packed against the larger aggregate grains.
The chemical composition of the paste was analysed with energy-dispersive X-ray spectroscopy analysis (EDX) in SEM. The chemical analysis (Table 24) showed that the samples were well hydrated. In both mixes the analysed CaO-SiO2 ratio was close to the theoretical value of approximately 0.75. That value can be calculated from the content of CaO in the cement, the content of SiO2 in the cement and SiO2 from the silica fume. For the cement used and the binder composition of 60 % cement and 40 % silica fume, the CaO-
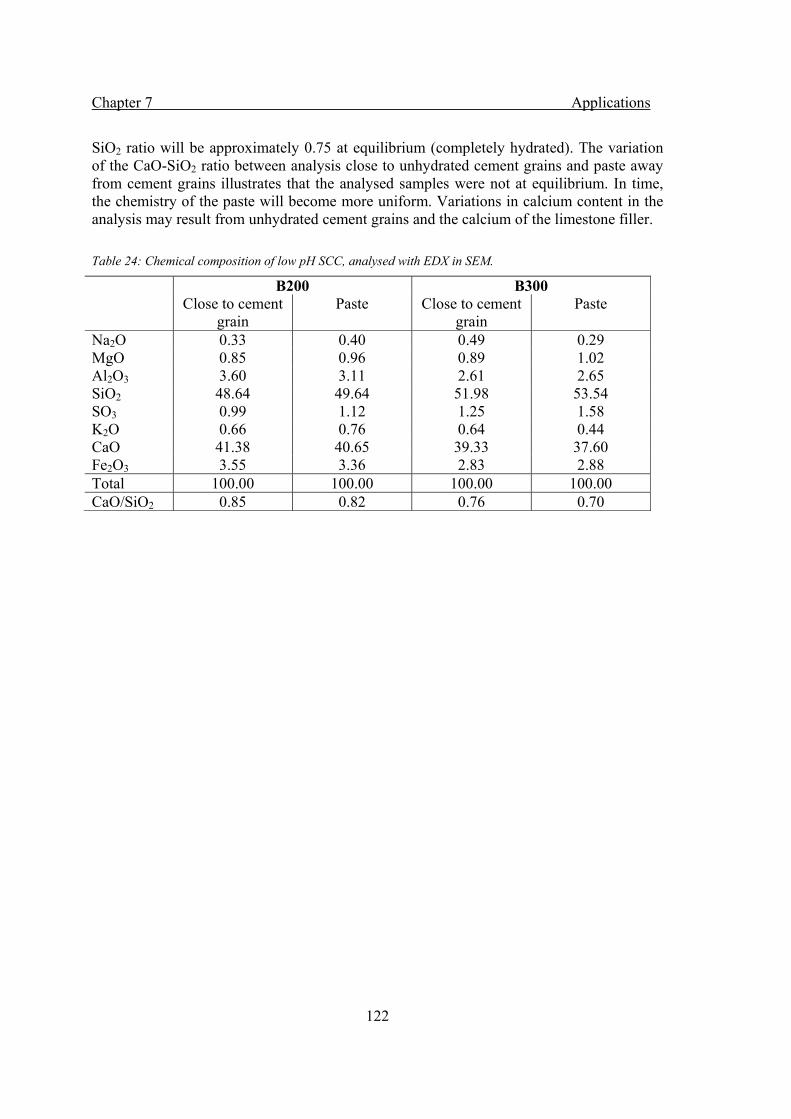
Chapter 7 Applications
122
SiO2 ratio will be approximately 0.75 at equilibrium (completely hydrated). The variation of the CaO-SiO2 ratio between analysis close to unhydrated cement grains and paste away from cement grains illustrates that the analysed samples were not at equilibrium. In time, the chemistry of the paste will become more uniform. Variations in calcium content in the analysis may result from unhydrated cement grains and the calcium of the limestone filler. Table 24: Chemical composition of low pH SCC, analysed with EDX in SEM.
B200 B300 Close to cement
grain Paste Close to cement
grain Paste
Na2O 0.33 0.40 0.49 0.29 MgO 0.85 0.96 0.89 1.02 Al2O3 3.60 3.11 2.61 2.65 SiO2 48.64 49.64 51.98 53.54 SO3 0.99 1.12 1.25 1.58 K2O 0.66 0.76 0.64 0.44 CaO 41.38 40.65 39.33 37.60 Fe2O3 3.55 3.36 2.83 2.88 Total 100.00 100.00 100.00 100.00 CaO/SiO2 0.85 0.82 0.76 0.70
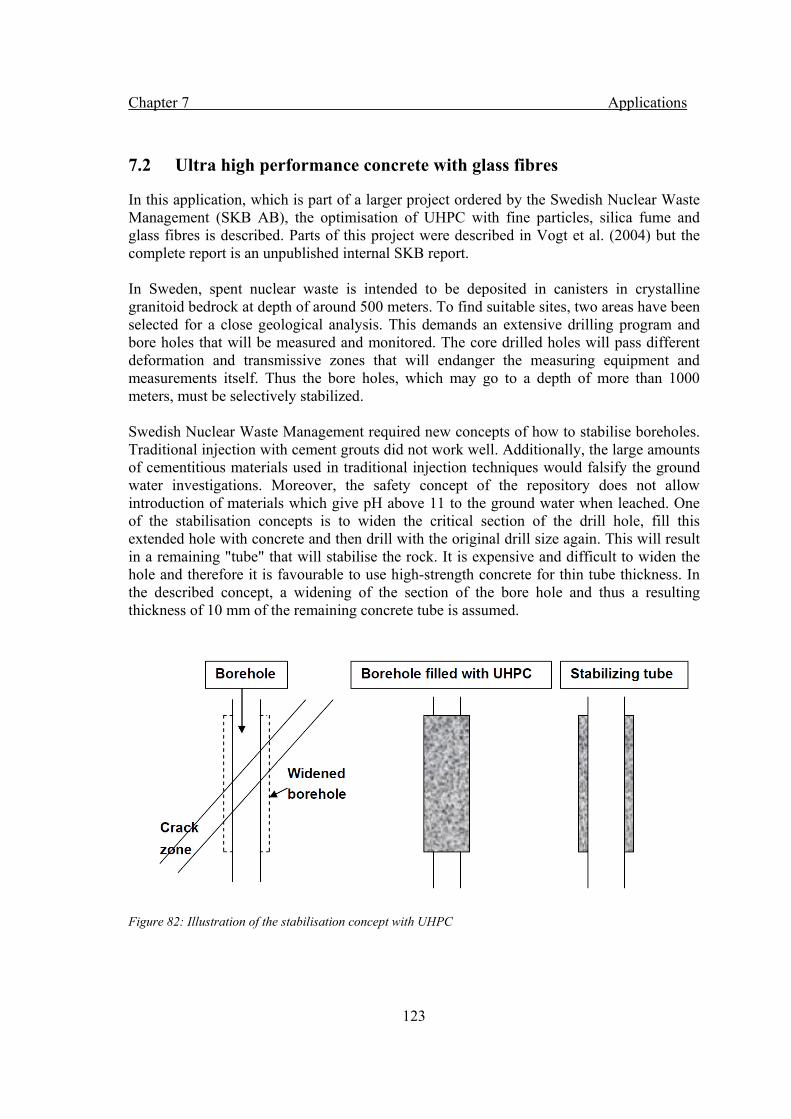
Chapter 7 Applications
123
7.2 Ultra high performance concrete with glass fibres
In this application, which is part of a larger project ordered by the Swedish Nuclear Waste Management (SKB AB), the optimisation of UHPC with fine particles, silica fume and glass fibres is described. Parts of this project were described in Vogt et al. (2004) but the complete report is an unpublished internal SKB report. In Sweden, spent nuclear waste is intended to be deposited in canisters in crystalline granitoid bedrock at depth of around 500 meters. To find suitable sites, two areas have been selected for a close geological analysis. This demands an extensive drilling program and bore holes that will be measured and monitored. The core drilled holes will pass different deformation and transmissive zones that will endanger the measuring equipment and measurements itself. Thus the bore holes, which may go to a depth of more than 1000 meters, must be selectively stabilized. Swedish Nuclear Waste Management required new concepts of how to stabilise boreholes. Traditional injection with cement grouts did not work well. Additionally, the large amounts of cementitious materials used in traditional injection techniques would falsify the ground water investigations. Moreover, the safety concept of the repository does not allow introduction of materials which give pH above 11 to the ground water when leached. One of the stabilisation concepts is to widen the critical section of the drill hole, fill this extended hole with concrete and then drill with the original drill size again. This will result in a remaining "tube" that will stabilise the rock. It is expensive and difficult to widen the hole and therefore it is favourable to use high-strength concrete for thin tube thickness. In the described concept, a widening of the section of the bore hole and thus a resulting thickness of 10 mm of the remaining concrete tube is assumed.
Figure 82: Illustration of the stabilisation concept with UHPC
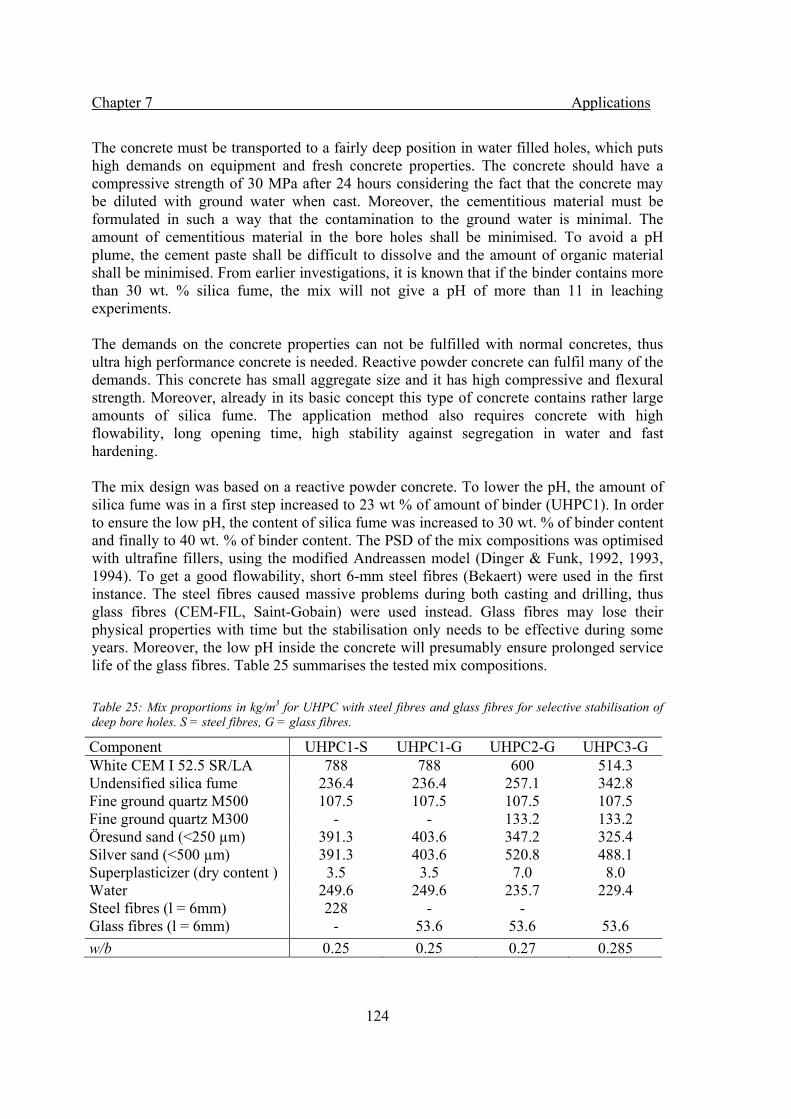
Chapter 7 Applications
124
The concrete must be transported to a fairly deep position in water filled holes, which puts high demands on equipment and fresh concrete properties. The concrete should have a compressive strength of 30 MPa after 24 hours considering the fact that the concrete may be diluted with ground water when cast. Moreover, the cementitious material must be formulated in such a way that the contamination to the ground water is minimal. The amount of cementitious material in the bore holes shall be minimised. To avoid a pH plume, the cement paste shall be difficult to dissolve and the amount of organic material shall be minimised. From earlier investigations, it is known that if the binder contains more than 30 wt. % silica fume, the mix will not give a pH of more than 11 in leaching experiments. The demands on the concrete properties can not be fulfilled with normal concretes, thus ultra high performance concrete is needed. Reactive powder concrete can fulfil many of the demands. This concrete has small aggregate size and it has high compressive and flexural strength. Moreover, already in its basic concept this type of concrete contains rather large amounts of silica fume. The application method also requires concrete with high flowability, long opening time, high stability against segregation in water and fast hardening. The mix design was based on a reactive powder concrete. To lower the pH, the amount of silica fume was in a first step increased to 23 wt % of amount of binder (UHPC1). In order to ensure the low pH, the content of silica fume was increased to 30 wt. % of binder content and finally to 40 wt. % of binder content. The PSD of the mix compositions was optimised with ultrafine fillers, using the modified Andreassen model (Dinger & Funk, 1992, 1993, 1994). To get a good flowability, short 6-mm steel fibres (Bekaert) were used in the first instance. The steel fibres caused massive problems during both casting and drilling, thus glass fibres (CEM-FIL, Saint-Gobain) were used instead. Glass fibres may lose their physical properties with time but the stabilisation only needs to be effective during some years. Moreover, the low pH inside the concrete will presumably ensure prolonged service life of the glass fibres. Table 25 summarises the tested mix compositions. Table 25: Mix proportions in kg/m3 for UHPC with steel fibres and glass fibres for selective stabilisation of deep bore holes. S = steel fibres, G = glass fibres.
Component UHPC1-S UHPC1-G UHPC2-G UHPC3-G White CEM I 52.5 SR/LA 788 788 600 514.3 Undensified silica fume 236.4 236.4 257.1 342.8 Fine ground quartz M500 107.5 107.5 107.5 107.5 Fine ground quartz M300 - - 133.2 133.2 Öresund sand (<250 µm) 391.3 403.6 347.2 325.4 Silver sand (<500 µm) 391.3 403.6 520.8 488.1 Superplasticizer (dry content ) 3.5 3.5 7.0 8.0 Water 249.6 249.6 235.7 229.4 Steel fibres (l = 6mm) 228 - - Glass fibres (l = 6mm) - 53.6 53.6 53.6 w/b 0.25 0.25 0.27 0.285
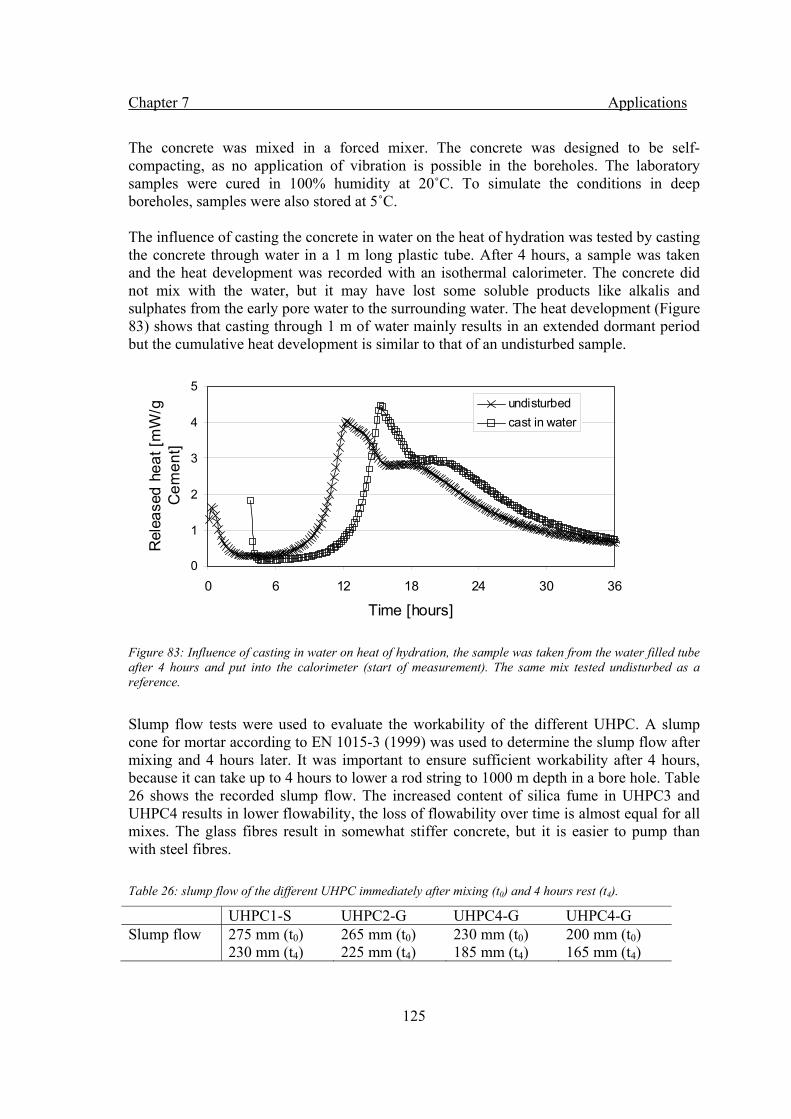
Chapter 7 Applications
125
The concrete was mixed in a forced mixer. The concrete was designed to be self-compacting, as no application of vibration is possible in the boreholes. The laboratory samples were cured in 100% humidity at 20˚C. To simulate the conditions in deep boreholes, samples were also stored at 5˚C. The influence of casting the concrete in water on the heat of hydration was tested by casting the concrete through water in a 1 m long plastic tube. After 4 hours, a sample was taken and the heat development was recorded with an isothermal calorimeter. The concrete did not mix with the water, but it may have lost some soluble products like alkalis and sulphates from the early pore water to the surrounding water. The heat development (Figure 83) shows that casting through 1 m of water mainly results in an extended dormant period but the cumulative heat development is similar to that of an undisturbed sample.
Figure 83: Influence of casting in water on heat of hydration, the sample was taken from the water filled tube after 4 hours and put into the calorimeter (start of measurement). The same mix tested undisturbed as a reference.
Slump flow tests were used to evaluate the workability of the different UHPC. A slump cone for mortar according to EN 1015-3 (1999) was used to determine the slump flow after mixing and 4 hours later. It was important to ensure sufficient workability after 4 hours, because it can take up to 4 hours to lower a rod string to 1000 m depth in a bore hole. Table 26 shows the recorded slump flow. The increased content of silica fume in UHPC3 and UHPC4 results in lower flowability, the loss of flowability over time is almost equal for all mixes. The glass fibres result in somewhat stiffer concrete, but it is easier to pump than with steel fibres. Table 26: slump flow of the different UHPC immediately after mixing (t0) and 4 hours rest (t4).
UHPC1-S UHPC2-G UHPC4-G UHPC4-G Slump flow 275 mm (t0)
230 mm (t4) 265 mm (t0) 225 mm (t4)
230 mm (t0) 185 mm (t4)
200 mm (t0) 165 mm (t4)
0
1
2
3
4
5
0 6 12 18 24 30 36
Time [hours]
Rel
ease
d he
at [m
W/g
C
emen
t]
undisturbedcast in water
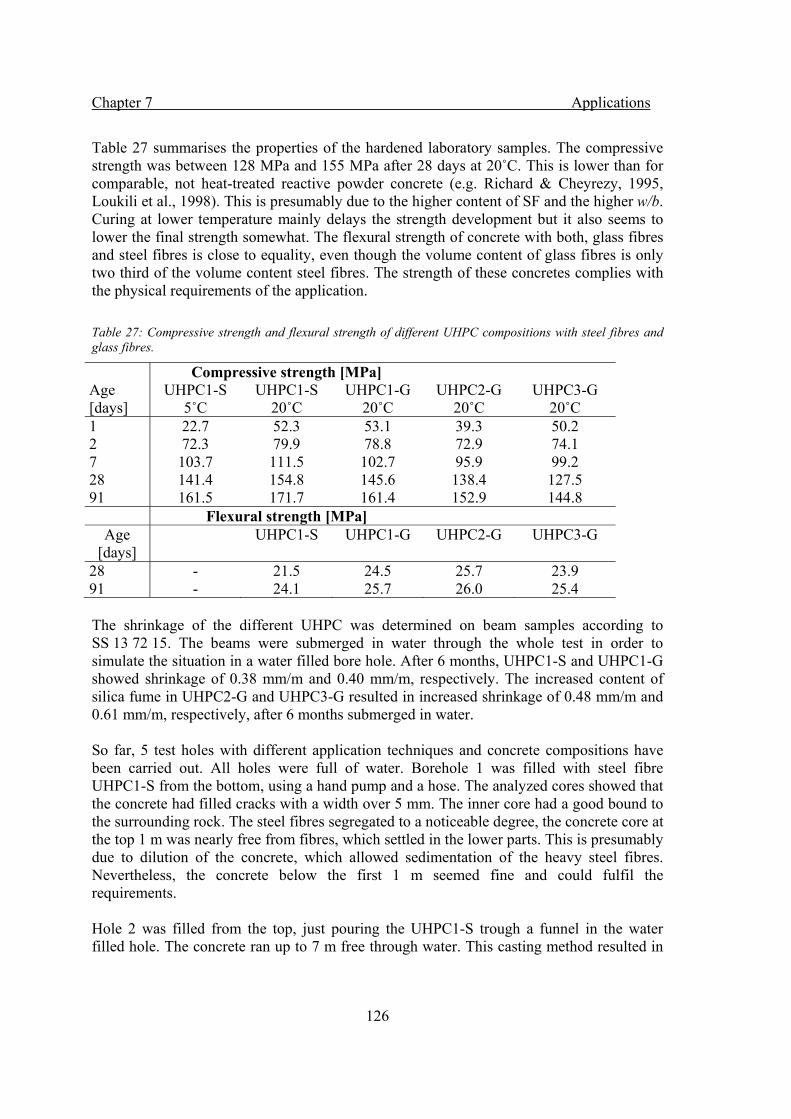
Chapter 7 Applications
126
Table 27 summarises the properties of the hardened laboratory samples. The compressive strength was between 128 MPa and 155 MPa after 28 days at 20˚C. This is lower than for comparable, not heat-treated reactive powder concrete (e.g. Richard & Cheyrezy, 1995, Loukili et al., 1998). This is presumably due to the higher content of SF and the higher w/b. Curing at lower temperature mainly delays the strength development but it also seems to lower the final strength somewhat. The flexural strength of concrete with both, glass fibres and steel fibres is close to equality, even though the volume content of glass fibres is only two third of the volume content steel fibres. The strength of these concretes complies with the physical requirements of the application. Table 27: Compressive strength and flexural strength of different UHPC compositions with steel fibres and glass fibres.
Compressive strength [MPa] Age [days]
UHPC1-S 5˚C
UHPC1-S 20˚C
UHPC1-G 20˚C
UHPC2-G 20˚C
UHPC3-G 20˚C
1 22.7 52.3 53.1 39.3 50.2 2 72.3 79.9 78.8 72.9 74.1 7 103.7 111.5 102.7 95.9 99.2 28 141.4 154.8 145.6 138.4 127.5 91 161.5 171.7 161.4 152.9 144.8
Flexural strength [MPa] Age
[days] UHPC1-S UHPC1-G UHPC2-G UHPC3-G
28 - 21.5 24.5 25.7 23.9 91 - 24.1 25.7 26.0 25.4 The shrinkage of the different UHPC was determined on beam samples according to SS 13 72 15. The beams were submerged in water through the whole test in order to simulate the situation in a water filled bore hole. After 6 months, UHPC1-S and UHPC1-G showed shrinkage of 0.38 mm/m and 0.40 mm/m, respectively. The increased content of silica fume in UHPC2-G and UHPC3-G resulted in increased shrinkage of 0.48 mm/m and 0.61 mm/m, respectively, after 6 months submerged in water. So far, 5 test holes with different application techniques and concrete compositions have been carried out. All holes were full of water. Borehole 1 was filled with steel fibre UHPC1-S from the bottom, using a hand pump and a hose. The analyzed cores showed that the concrete had filled cracks with a width over 5 mm. The inner core had a good bound to the surrounding rock. The steel fibres segregated to a noticeable degree, the concrete core at the top 1 m was nearly free from fibres, which settled in the lower parts. This is presumably due to dilution of the concrete, which allowed sedimentation of the heavy steel fibres. Nevertheless, the concrete below the first 1 m seemed fine and could fulfil the requirements. Hole 2 was filled from the top, just pouring the UHPC1-S trough a funnel in the water filled hole. The concrete ran up to 7 m free through water. This casting method resulted in
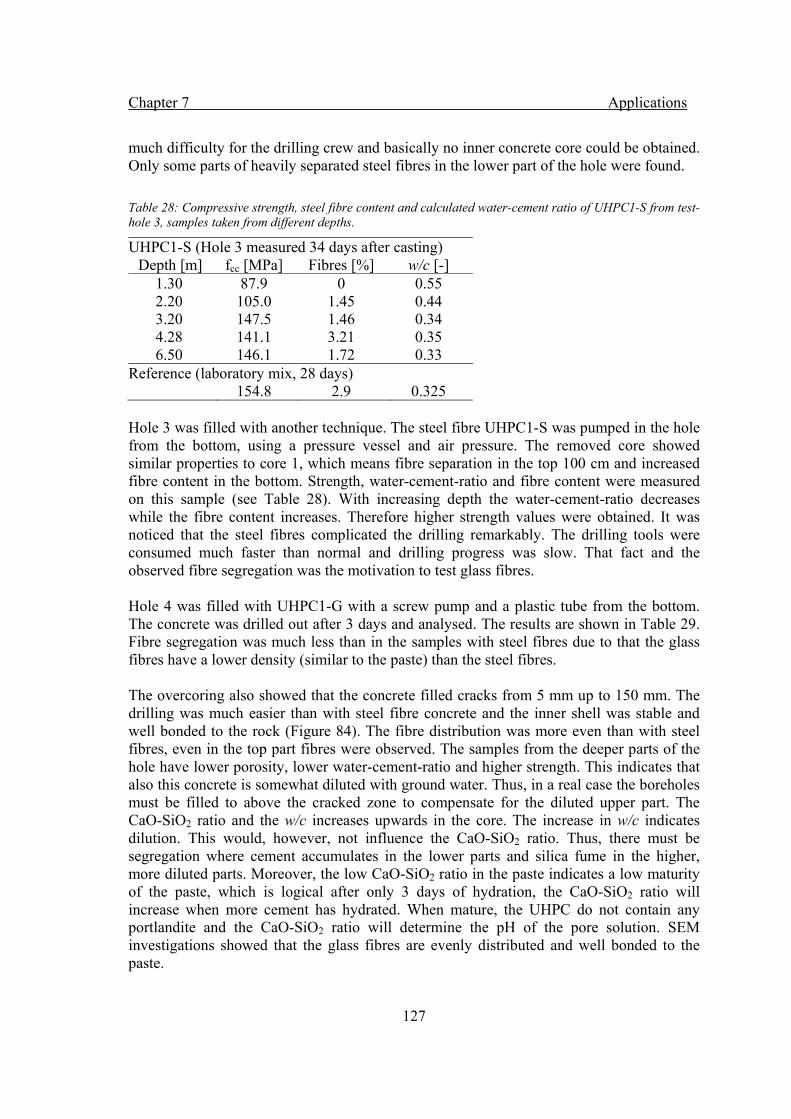
Chapter 7 Applications
127
much difficulty for the drilling crew and basically no inner concrete core could be obtained. Only some parts of heavily separated steel fibres in the lower part of the hole were found. Table 28: Compressive strength, steel fibre content and calculated water-cement ratio of UHPC1-S from test-hole 3, samples taken from different depths.
UHPC1-S (Hole 3 measured 34 days after casting) Depth [m] fcc [MPa] Fibres [%] w/c [-]
1.30 87.9 0 0.55 2.20 105.0 1.45 0.44 3.20 147.5 1.46 0.34 4.28 141.1 3.21 0.35 6.50 146.1 1.72 0.33
Reference (laboratory mix, 28 days) 154.8 2.9 0.325
Hole 3 was filled with another technique. The steel fibre UHPC1-S was pumped in the hole from the bottom, using a pressure vessel and air pressure. The removed core showed similar properties to core 1, which means fibre separation in the top 100 cm and increased fibre content in the bottom. Strength, water-cement-ratio and fibre content were measured on this sample (see Table 28). With increasing depth the water-cement-ratio decreases while the fibre content increases. Therefore higher strength values were obtained. It was noticed that the steel fibres complicated the drilling remarkably. The drilling tools were consumed much faster than normal and drilling progress was slow. That fact and the observed fibre segregation was the motivation to test glass fibres. Hole 4 was filled with UHPC1-G with a screw pump and a plastic tube from the bottom. The concrete was drilled out after 3 days and analysed. The results are shown in Table 29. Fibre segregation was much less than in the samples with steel fibres due to that the glass fibres have a lower density (similar to the paste) than the steel fibres. The overcoring also showed that the concrete filled cracks from 5 mm up to 150 mm. The drilling was much easier than with steel fibre concrete and the inner shell was stable and well bonded to the rock (Figure 84). The fibre distribution was more even than with steel fibres, even in the top part fibres were observed. The samples from the deeper parts of the hole have lower porosity, lower water-cement-ratio and higher strength. This indicates that also this concrete is somewhat diluted with ground water. Thus, in a real case the boreholes must be filled to above the cracked zone to compensate for the diluted upper part. The CaO-SiO2 ratio and the w/c increases upwards in the core. The increase in w/c indicates dilution. This would, however, not influence the CaO-SiO2 ratio. Thus, there must be segregation where cement accumulates in the lower parts and silica fume in the higher, more diluted parts. Moreover, the low CaO-SiO2 ratio in the paste indicates a low maturity of the paste, which is logical after only 3 days of hydration, the CaO-SiO2 ratio will increase when more cement has hydrated. When mature, the UHPC do not contain any portlandite and the CaO-SiO2 ratio will determine the pH of the pore solution. SEM investigations showed that the glass fibres are evenly distributed and well bonded to the paste.

Chapter 7 Applications
128
Table 29: Compressive strength, glass fibre content (vol. %), calculated water-cement ratio, porosity and CaO-SiO2 ratio of UHPC1-G from test-hole 4, samples taken from different depths. The CaO-SiO2 ratio was determined by energy dispersive analysis on spots on flat polished samples.
UHPC1-G (Hole 4) (measured 3 days after casting) Depth [m] fcc [MPa] Fibres [%] w/c [-] Porosity [%] CaO-SiO2 ratio (mean value)
1.43 30.9 1.36 0.55 14.1 0.56 - 0.93 (0.704) 1.78 38.3 2.02 0.54 10.3 0.59 - 0.76 (0.704) 3.74 66.5 2.61 0.31 7.3 0.64 - 0.99 (0.856) 5.67 62.1 2.83 0.35 6.7 0.65 - 1.09 (0.846)
Reference (laboratory mix, 2 days) 78.8 2.00 0.325
Figure 84: Sample from bore hole 4, overcored 3 days after casting. The UHPC1-G forms an inner tube and is well bonded to the granite.
Hole 5 was a full scale borehole to test different stabilisation methods. The hole had a diameter of 76 mm and a final depth of more than 350 m. The drilling and placing equipment, concrete and application method were tested under practical circumstances. Experience from the four previous test holes led to the decision to design the application tool with a removable top piston that will follow the concrete into the hole and expand above the concrete to protect it from water, see Figure 85. The removed concrete cores were analysed and showed an even fibre distribution. The density of samples from the upper and lower part of the core was close to equality but the strength differs. The concrete seems to be diluted somewhat with water, especially at the top. Table 30 summarises the results.
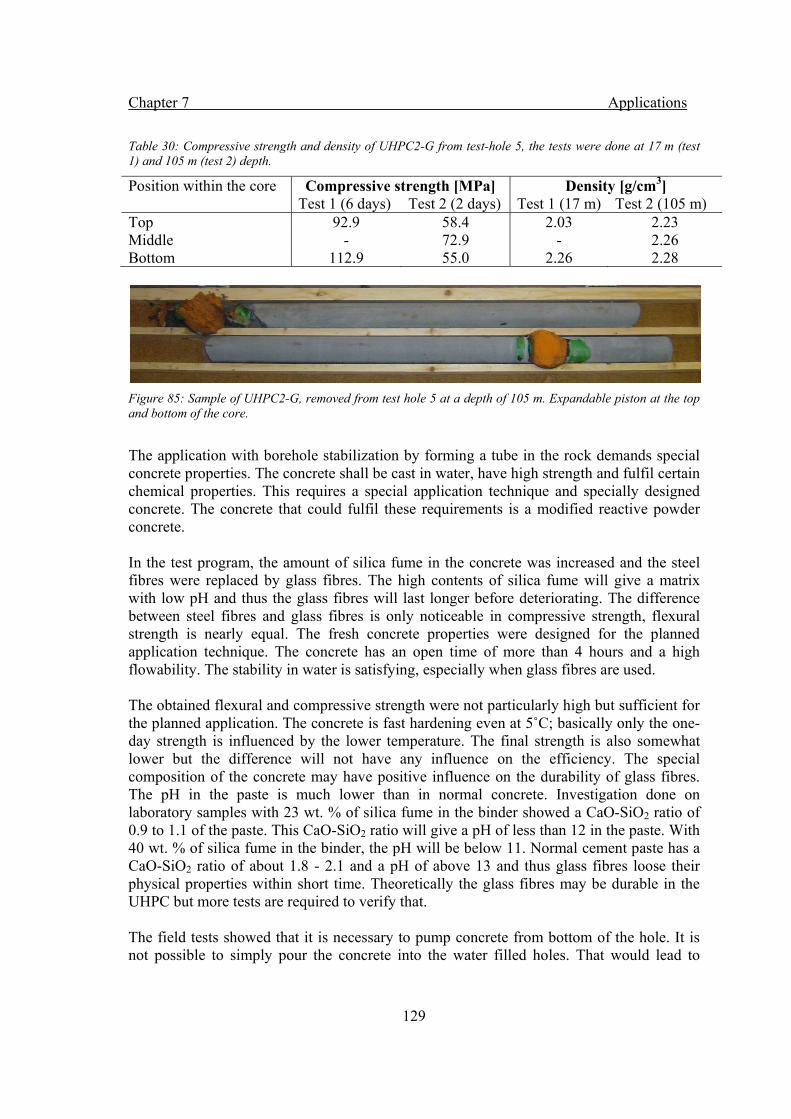
Chapter 7 Applications
129
Table 30: Compressive strength and density of UHPC2-G from test-hole 5, the tests were done at 17 m (test 1) and 105 m (test 2) depth.
Position within the core Compressive strength [MPa] Density [g/cm3] Test 1 (6 days) Test 2 (2 days) Test 1 (17 m) Test 2 (105 m) Top 92.9 58.4 2.03 2.23 Middle - 72.9 - 2.26 Bottom 112.9 55.0 2.26 2.28
Figure 85: Sample of UHPC2-G, removed from test hole 5 at a depth of 105 m. Expandable piston at the top and bottom of the core.
The application with borehole stabilization by forming a tube in the rock demands special concrete properties. The concrete shall be cast in water, have high strength and fulfil certain chemical properties. This requires a special application technique and specially designed concrete. The concrete that could fulfil these requirements is a modified reactive powder concrete. In the test program, the amount of silica fume in the concrete was increased and the steel fibres were replaced by glass fibres. The high contents of silica fume will give a matrix with low pH and thus the glass fibres will last longer before deteriorating. The difference between steel fibres and glass fibres is only noticeable in compressive strength, flexural strength is nearly equal. The fresh concrete properties were designed for the planned application technique. The concrete has an open time of more than 4 hours and a high flowability. The stability in water is satisfying, especially when glass fibres are used. The obtained flexural and compressive strength were not particularly high but sufficient for the planned application. The concrete is fast hardening even at 5˚C; basically only the one-day strength is influenced by the lower temperature. The final strength is also somewhat lower but the difference will not have any influence on the efficiency. The special composition of the concrete may have positive influence on the durability of glass fibres. The pH in the paste is much lower than in normal concrete. Investigation done on laboratory samples with 23 wt. % of silica fume in the binder showed a CaO-SiO2 ratio of 0.9 to 1.1 of the paste. This CaO-SiO2 ratio will give a pH of less than 12 in the paste. With 40 wt. % of silica fume in the binder, the pH will be below 11. Normal cement paste has a CaO-SiO2 ratio of about 1.8 - 2.1 and a pH of above 13 and thus glass fibres loose their physical properties within short time. Theoretically the glass fibres may be durable in the UHPC but more tests are required to verify that. The field tests showed that it is necessary to pump concrete from bottom of the hole. It is not possible to simply pour the concrete into the water filled holes. That would lead to

Chapter 7 Applications
130
extreme fibre segregation as the concrete is not sufficiently stable when cast in water. Underwater compounds might increase the stability but were not allowed in this application, as the content of organic components had to be minimised. The tests also demonstrated that glass fibres are superior to steel fibres for this special application. Glass fibres make it easier to handle the concrete and segregate less when cast into water filled boreholes. Glass fibre reinforced concrete is much easier to drill than steel fibre concrete. The UHPC has the ability to fill cracks and forms a stable inner tube in the boreholes.
Chapter 7 Applications
131
7.3 Ultra high performance concrete with glass fibres as repair material
Based on some preliminary results of this work and the application described in section 7.2, additional studies have been performed by students of the Bauhaus University in Weimar, Germany and the Royal Institute of Technology in Stockholm, Sweden. The author made contributions to the experimental part of these studies. The addition of higher amounts of silica fume to RPC resulted in a material with high strength and lower internal pH. The idea arose that this lower pH may contribute to increased durability of glass fibres as fibre reinforcement. Therefore, three studies were performed to investigate the possibility of utilisation of glass fibre reinforced UHPC as repair material. In the following, the basic setup and the main findings of these studies are briefly presented. The first study (Goedecke, 2005) investigated the durability of glass fibres in the alkaline environment of UHPC. Study two (Gerhardsson & Löfgren, 2006) and three (Perez, 2006) were performed in order to investigate the strengthening effect of glass fibre reinforced UHPC on structural members of concrete, specifically beams and columns.
7.3.1 Durability of glass fibres
This study was done by H. K. Goedecke in 2005 at the Swedish Cement and Concrete Research Institute in Stockholm for the Bauhaus University in Weimar, Germany. The influence of different amounts of silica fume in the binder of UHPC on the durability of glass fibres was investigated. UHPC compositions with constant binder content but different content of silica fume in the binder were produced. The tested content of silica fume was 0 wt. %, 15 wt. % and 30 wt. % of the binder. The w/b was constant. Alkali resistant glass fibres, conventional glass fibres (usually not used in concrete) and steel fibres for comparison were tested in the three different UHPC mix compositions. The samples were subjected to three different treatments after 28 days of standard moist curing. Group one of the samples was subjected to an additional standard curing at 20ºC and 100 % RH for another 28 days. Group two of the samples was subjected to heat treatment of 80ºC for 28 days. Group three of the samples was subjected to climate changes in a climate box developed by Gram (1983). The climate box ran four heat-moisture cycles a day. The climate box was heated to 105°C for 5.5 hours. Then the samples were sprinkled with water of 20°C for 0.5 hours. Treatment one was used as reference, treatment two and three were used to accelerate the degradation of the glass fibres. Flexural strength and ductility was tested on notched prisms of 40x40x160 mm3 (see Brahmeshuber 2003). Compressive strength, shrinkage and microstructure were examined as well. The results of the study showed that an amount of more than 15 wt. % of silica fume in the binder was required in order to ensure long-term durability of glass fibres. Only the samples with 30 wt. % of silica fume in the binder showed no reduced flexural strength and ductility for alkali resistant glass fibres after heat treatment and climate box compared to the reference samples. Even conventional glass fibres which normally degrade rapidly in concrete showed sufficient flexural strength and ductility after the accelerated procedures.
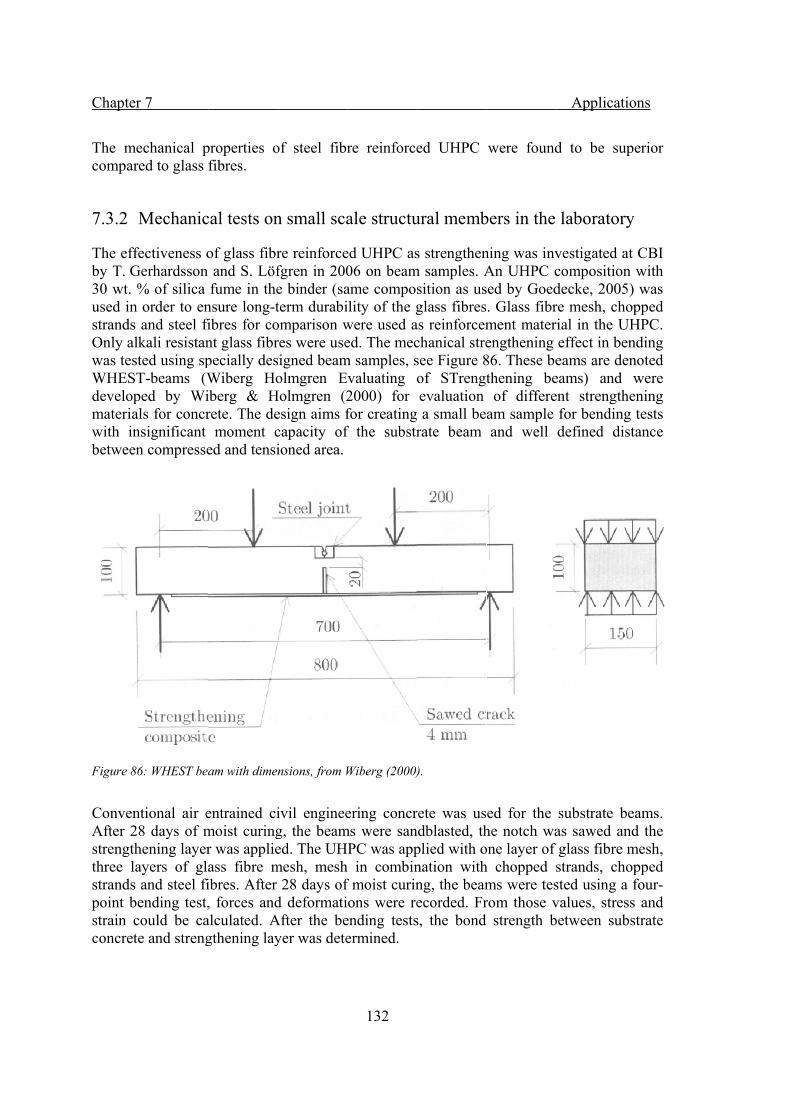
Chapter
The mecompare
7.3.2 M
The effeby T. G30 wt. %used in strands Only alkwas testWHESTdevelopmaterialwith inbetween
Figure 86
ConvenAfter 28strengththree lastrands point bestrain cconcrete
r 7
echanical ped to glass f
Mechanic
fectiveness oGerhardsson % of silica order to enand steel fikali resistanted using spT-beams (Wped by Wils for concr
nsignificant n compresse
6: WHEST bea
ntional air e8 days of mhening layerayers of glaand steel fiending test,
could be cae and streng
properties ofibres.
cal tests on
of glass fibrand S. Löffume in the
nsure long-tibres for cont glass fibrpecially desWiberg Hoiberg & Hrete. The de
moment ced and tensi
am with dimen
entrained cimoist curingr was applieass fibre mibres. After , forces andalculated. Agthening lay
of steel fibr
n small sca
re reinforcefgren in 200e binder (saterm durabiomparison wres were useigned beamolmgren Ev
Holmgren (2esign aims fcapacity of ioned area.
nsions, from W
ivil engineeg, the beamed. The UHmesh, mesh
28 days of d deformati
After the beyer was dete
132
re reinforce
ale structu
ed UHPC as06 on beamame composlity of the g
were used aed. The mec
m samples, svaluating o2000) for for creatingf the substr
Wiberg (2000)
ering concrms were san
PC was app in combin
f moist curinons were re
ending testsermined.
ed UHPC
ural memb
s strengthenm samples. A
sition as usglass fibres
as reinforcemchanical stresee Figure 8of STrengtevaluation a small berate beam
).
rete was usndblasted, thplied with onation withng, the beamecorded. Frs, the bond
were found
bers in the
ning was invAn UHPC ced by Goed. Glass fibrment materengthening 86. These bethening beof differe
am sample and well
ed for the he notch waone layer of h chopped sms were tesrom those v
strength b
Applicati
d to be su
laboratory
vestigated acompositiondecke, 2005re mesh, chrial in the Ueffect in beeams are deeams) and ent strength
for bendingdefined dis
substrate bas sawed anglass fibre strands, chsted using avalues, stresbetween sub
ions
uperior
y
at CBI n with 5) was opped
UHPC. ending enoted
were hening g tests stance
beams. nd the mesh, opped
a four-ss and bstrate
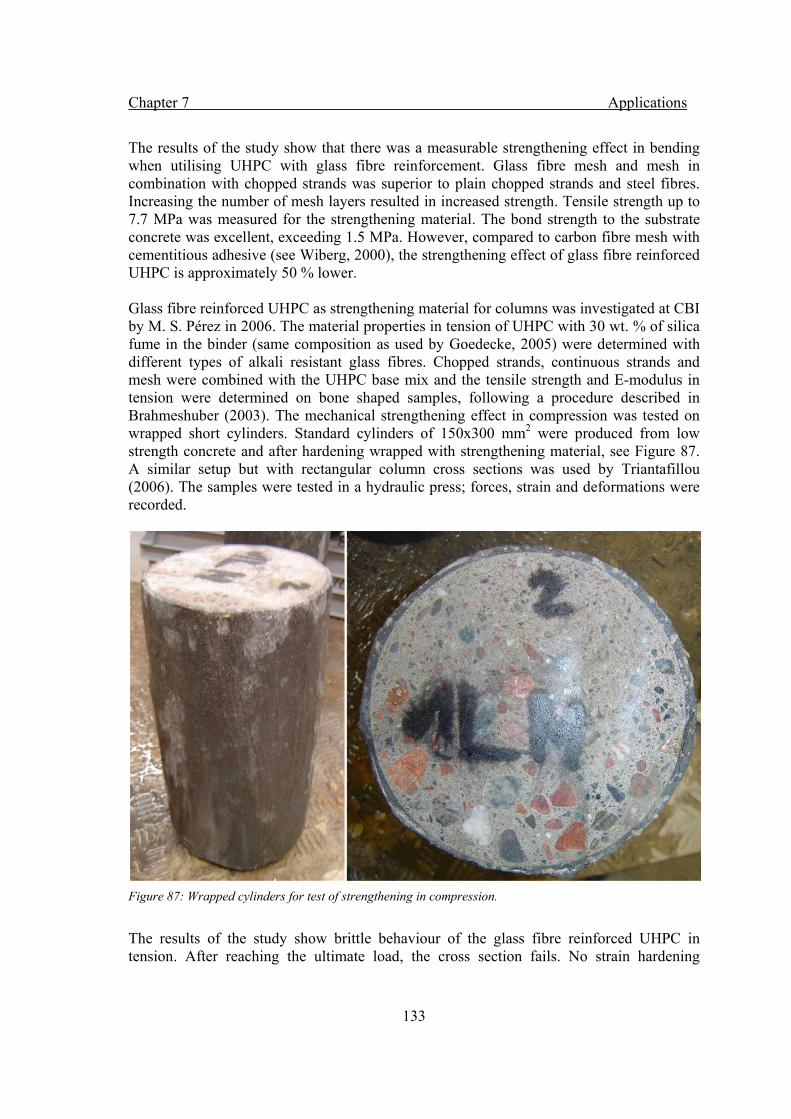
Chapter 7 Applications
133
The results of the study show that there was a measurable strengthening effect in bending when utilising UHPC with glass fibre reinforcement. Glass fibre mesh and mesh in combination with chopped strands was superior to plain chopped strands and steel fibres. Increasing the number of mesh layers resulted in increased strength. Tensile strength up to 7.7 MPa was measured for the strengthening material. The bond strength to the substrate concrete was excellent, exceeding 1.5 MPa. However, compared to carbon fibre mesh with cementitious adhesive (see Wiberg, 2000), the strengthening effect of glass fibre reinforced UHPC is approximately 50 % lower. Glass fibre reinforced UHPC as strengthening material for columns was investigated at CBI by M. S. Pérez in 2006. The material properties in tension of UHPC with 30 wt. % of silica fume in the binder (same composition as used by Goedecke, 2005) were determined with different types of alkali resistant glass fibres. Chopped strands, continuous strands and mesh were combined with the UHPC base mix and the tensile strength and E-modulus in tension were determined on bone shaped samples, following a procedure described in Brahmeshuber (2003). The mechanical strengthening effect in compression was tested on wrapped short cylinders. Standard cylinders of 150x300 mm2 were produced from low strength concrete and after hardening wrapped with strengthening material, see Figure 87. A similar setup but with rectangular column cross sections was used by Triantafillou (2006). The samples were tested in a hydraulic press; forces, strain and deformations were recorded.
Figure 87: Wrapped cylinders for test of strengthening in compression.
The results of the study show brittle behaviour of the glass fibre reinforced UHPC in tension. After reaching the ultimate load, the cross section fails. No strain hardening
Chapter 7 Applications
134
behaviour was observed. Increasing the amount of glass fibre reinforcement resulted in higher tensile strength. The E-modulus in tension was found to be similar to corresponding value of conventional concrete. The test of the confined cylinders showed that the load bearing capacity increased with about 20 %, independent of the amount of glass fibre reinforcement tested. The failure mode was brittle. There was a certain confinement effect of the cylinders, the samples wrapped with glass fibre reinforced UHPC had a more ductile failure mode than the untreated ones. In summary, the mechanical tests of glass fibre reinforced UHPC showed unsatisfying performance as strengthening material in bending and compression. There is a measurable strengthening effect but it is not sufficient from a structural point of view. As repair material, there is a great potential for glass fibre reinforced UHPC due to its superior durability and easier handling compared to steel fibre reinforced UHPC.
Chapter 8 References
135
Chapter 8
References
Aïctin, P C (1999): Autogenous shrinkage measurement, in Autogenous shrinkage of concrete, edited by Tazawa, E & FN Spon, 1999. Alford N McN, Birchall J D (1984): The Properties and Potential Application of Macro-Defect-Free Cement, in proceedings to the Materials Research Society Symposium on Very high-strength Cement-based materials, ed. by J F Young, Boston, Massachusetts, 1984. Andreassen A H M, Andersen J (1930): Über die Beziehung zwischen Kornabstufung und Zwischenraum in Produkten aus losen Körnern (mit einigen Experimenten), Kolloid-Z. 50, 1930 (in German). Bache H H (1981): Densified cement/ultrafine particle based materials, presented at the Second International Conference on Superplasticizers in Concrete, June 1981, Ottawa, Canada, CBL Report no. 40, Aalborg, Denmark. Bache HH (1992): Ny beton – ny teknologi, 8/04/1992, CtO, Aalborg, Denmark, 1992. Bažant Z P (1975): Theory of Creep and shrinkage in Concrete. A Précis of Recent Developments. Mechanics Today, Vol. 2, 1975. Bazant Z P, Wittman F H (1982): Creep and shrinkage in concrete structures, John Wiley & Sons, New York, 1982. Bažant Z P /editor/ (1988): Mathematical Modelling of Creep and Shrinkage of Concrete, Fourth RILEM Int. Symp. on Creep and Shrinkage of Concrete: Mathematical Modelling. Northwestern University, 1986, John Wiley & Sons. Betonghandbok 2nd ed (1994), AB Svensk Byggtjänst, Solna, Sweden, 1994 (in Swedish). Birchall J D, Howard A J, Kendrall K (1981): Flexural strength and porosity of cement, Nature vol. 289, London, 1981.
Chapter 8 References
136
Bolomey J (1926): Bestimmung der Druckfestigkeit von Mörtel und Beton, Schweizerische Bauzeitung, Vol 28, 1926 (in German). Brameshuber W, Brockmann T (2003): Textilbewehrter ultrahochfester Beton, in Ultrahochfester Beton- Innovationen im Bauwesen, Bauwerk Verlag, Berlin, Germany, 2003 (in German). Brameshuber W, Uebachs S (2006): Einfluss der Granulometrie des Zementes und der Betonzusatzstoffe auf die rheologischen Eigenschaften von selbstverdichtenden Mörteln, in proceedings of IBAUSIL 2006, Weimar, Germany, (in German). Breton D (1996): Low- heat high-performance concrete, United States Patent 5531823, 1996. Brooks J J, Neville A (1992): Creep and shrinkage of concrete as affected by admixtures and cement replacement materials, in Creep and Shrinkage of Concrete: Effect of Materials and Environment, ACI SP-135, 1992. Brouwers H J H, Radix H J (2005): Self-compacting concrete: Theoretical and experimental study, Cement and Concrete Research vol 35, 2005. Bureau of Reclamation, United States Department of the Interior (1942): Concrete Manual, 4th edition, Denver, USA, 1942. Cumberland D J, Crawford R J (1987): Handbook of powder technology: The packing of particles, Elsevier, Amsterdam, The Netherlands, 1987. Davis H E (1940): Autogenous Volume changes of concrete, Proceedings of the American Society Tests Materials, Vol. 32(40), 1940. de Larrard F (1999): Concrete mixture proportioning; a scientific approach, E & FN Spon, London, UK, 1999. Diamond S (2000): Mercury porosimetry – An inappropriate method for the measurement of pore size distributions in cement-based materials, Cement and Concrete Research, Vol. 30, No 10, 2000. Dinger D R, Funk J E (1992): Particle Packing Part 1 to 5, Interceram Vol. 41 no.1, 2 & 3 1992, Vol. 42 no. 3 1993 and Vol. 43 no. 2 1994. Dinger D R (2001): Particle Calculations for Ceramists, published by Dinger ceramics Consulting Services, Clemson, USA, printed by Morris Publishing, Kearney USA, ISBN 0-9715696-0-6, 2001.

Chapter 8 References
137
Esping O (2007): Early age properties of self-compacting concrete- Effects of fine aggregate and limestone filler, doctoral thesis, Chalmers University of Technology, Göteborg, Sweden, 2007. Ekerfors K (1995): Mognadsutveckling i ung betong, temperaturkänslighet, hållfasthet och värmeutveckling (in Swedish). Luleå University of Technology, Division of Structural Engineering. Licentiate thesis 1995:34 L, 1995 (in Swedish). Ekerfors K, Jonasson J-E (2000): Maturity Development in Young Concrete – Temperature Sensitivity, Strength and Heat Development. Nordic Concrete Research, Publication No. 25, 2/2000, ISBN 82-91341-41-9, pp 35-47. Fennis (2006): Personal communication. Fennis S, Walraven J, Den Uijl J (2007): The use of particle packing models to reduce the water demand of concrete, CONSEC’07, Tours, France, pp 937-942, 2007. Ferraris C, Wittmann F H (1987): Shrinkage mechanisms of hardened cement paste, Cement and Concrete research, Vol. 17, 1987. Fuller W B, Thompson S E (1907): The laws of proportioning concrete, Transactions of the American Society of Civil Engineers 33, pp 222-298. Furnas C C (1931): Grading the aggregates I – mathematical relations for beds of broken solids of maximum density, Ind. & Eng. Chemistry 23 (9), 1931. Gerhardsson T, Löfgren S (2006): Reinforcement of concrete structures with glass fibre reinforced ultrahigh performance concrete, Master Thesis, KTH, Stockholm, Sweden, 2006, (in Swedish). Goedeke H K (2005): Performance and durability of chopped glass fibres in reactive powder concrete, Studienarbeit, Bauhaus-Universität Weimar, Weimar, Germany, 2005. Gram H-E (1983): Durability of natural fibers in concrete, CBI forskning/research 1-83, Stockholm, Sweden, 1983. Gray M N, Shenton B S (1998): For better concrete, take out some of the cement, ACI/CANMET Symposium on the durability of concrete, 1998, Bangkok, Thailand. Habel K (2004): Structural Behaviour of Elements Combining Ultra-High Performance Concrete Fibre Reinforced Concrete (UHPFRC) and Reinforced Concrete, Doctoral thesis, No. 3036, EPFL, Lausanne, Switzerland, 2004. Habel K, Charron J-P, Denarié E, Brühweiler E (2006): Autogenous deformations and viscoelasticity of UHPFRC in structures. Part I: experimental results. Magazine of Concrete Research 58, no 3, 2006.
Chapter 8 References
138
Harris A W, Manning M C, Tearle W M, Tweed C J (2002): Testing of models of the dissolution of cements-leaching of synthetic CSH gels, Cement and Concrete Research 32, 2002. Helsing Atlassi E (1996): Influence of silica fume on the pore structure of mortar when measured by water vapour sorption isotherms, in The Modelling of Microstructure and Its Potential for Studying Transport Properties and Durabiliaty, ed. by Jennings H et al, Kluwer Academic Publishers, 1996. Hochella M F (1990): Atomic structure, microtopography, composition and reactivity of mineral surfaces, Reviews in Mineralogy, Mineral- Water Interface Geochemistry, mineralogical Society of America Vol. 23, 1990 Hüsken G, Brouwers H J H (2008): A new mix design concept for earth moist concrete: A theoretical and experimental study, Cement and Concrete Research 38, 2008. Jensen O M, Freiesleben Hansen P (1995): A dilatometer for measuring the autogenous deformation in hardening Portland cement paste, Materials and Structures 28, 1995. Jensen O M, Hansen P F (1996): Autogenous Deformation and Change of the Relative Humidity in Silica Fume-Modified Cement Paste, ACI Materials Journal 93, 1996. Jensen O M, Hansen P F (2001): Water-entrained cement-based materials – I. Principles and theoretical background, Cement and Concrete Research 31, 2001. Johansen V, Andersen P J (1989): Particle packing and concrete properties, American Ceramic Society, 1989. Justnes H (2004): Autogenous shrinkage of Cementitious Paste—State-of-the-Art, Seventh CANMET/ACI International Conference on Recent Advances in Concrete Technology, edited by Malhotra V M, ACI SP-222, 2004. Justnes H, Dahl P A, Ronin V, Jonasson J-E, Elfgren L (2007): Microstructure and performance of energetically modified cement (EMC) with high filler content, Cement & Concrete Composites 29, 2007. Kjellsen K O, Lagerblad B (1994): Effect of mineralogy of fillers on the cement hydration, in proceedings of the NATO/RILEM workshop ”The modelling of microstructure and its potential for studying transport properties and durability”, St. Remy- les Chevreuse, 1994, Kluwer academic publishers. Kjellsen K O, Lagerblad B (1995): Influence of natural minerals in the filler fraction on hydration and properties of mortars, CBI report 3:95; 1995, CBI Stockholm, Sweden. Kjellsen K O, Jennings H M, Lagerblad B (1996): Evidence of hollow shells in the microstructure of cement paste, Cement and Concrete Research, Vol.26, No.4, 1996, pp 593-599.
Chapter 8 References
139
Kronlöf A (1994): Effect of very fine aggregate on concrete strength, Materials and Structures 27, 1994. Lagerblad B, Utkin P (1993): Silica granulates in concrete-dispersion and durability aspects, CBI-report 3-93, Stockholm, Sweden, 1993. Lagerblad B, Kjellsen K O (1999): Normal and high strength concretes with conventional aggregates, Engineering and transport properties of the Interfacial Transition Zone in cementitious materials, RILEM report 20, 1999, RILEM publications. Lagerblad B (2001): High performance concrete with low pH, SKB AR TS-01-03, Stockholm, Sweden, 2001 (not published). Lagerblad B, Jennings H M, Chen J J (2004): Modifications of cement paste with silica fume- a NMR study, in proceedings of 1st International Symposium on Nanotechnology in Construction, Paisley, Scotland, 2004, Royal Society of Chemistry (RSC). Lagerblad B (2007): Mechanism and mode of carbonation of cementitious materials, in proceedings of the International Conference on Sustainability in the Cement and Concrete Industry, ed. by Jacobsen S, Jahren P, Kjellsen K O, Lillehammer, Norway, 2007. Lagerblad B, Fjällberg L (2008): Early hydration - ruling mechanisms and model, CBI-report 2008:2, Stockholm, Sweden, 2008 (in Swedish). Lankard D R (1984): Slurry infiltrated fiber concrete (SIFCON): Properties and Applications, in proceedings to the Materials Research Society Symposium on Very High-strength Cement-based materials, ed. by J F Young, Boston, Massachusetts, 1984. Lea, edited by Hewlett P C (2000): Lea’s Chemistry of Cement and Concrete, 4th edit. Arnold, 2000. Lidström L (1968): Surface and bond forming properties of quartz and silicate minerals and their application in mineral processing techniques, Acta Polytecnica Scandinavia No. 75, Stockholm, 1968. Lidström L, Westerberg B (1997): Finmalt Cement, malning, injektering, betong, Slutrapport Ultrafint Cement, 1997 (in Swedish). LISA – language independent size distribution analyser, developed by Elkem, Norway, version 2.0, www.elkem.no. Locher F W, Richartz W, Sprung S (1976): Erstarren von Zement, Zement Kalk Gips, Vol. 29(10), pp. 435-442, 1976 (in German).

Chapter 8 References
140
Loukili A, Richard P, Lamirault J (1998): A Study on Delayed Deformations of a Ultra High Strength Cementitious Material, in proceedings of the fourth CANMET/ACI/JCI International conference, 1998, Tokushima, Japan. Lura P, Jensen O M, van Breugel K (2002): Autogenous shrinkage of high-performance paste: An evaluation of basic mechanisms, Cement and Concrete Research 33, 2002. Lyman C G (1934): Growth and movement in Portland cement concrete, Oxford University Press, pp. 25-45, London, 1934. Marquardt I (2001): Ein Mischungskonzept für selbstverdichtenden Beton auf Basis der Volumenkenngrössen und Wasseransprüche der Ausgangsstoffe, Doctoral thesis, Universitär Rostock, 2001 (in German). McGeary R K (1961): Mechanical packing of spherical particles, Journal of American Ceramic Society Vol. 44, 1961. Mehta P K (1986): Concrete structure, properties and materials, Prentice- Hall, New Jersey, USA, 1986. Moosberg-Bustnes H (2003): Fine particulate by-products from mineral and metallurgical industries as filler in cement based materials, Doctoral Thesis, Luleå University of Technology, Luleå, Sweden, 2003. Neville A M (1995): Properties of concrete, 4th ed, Longman Group Limited, Essex, England, 1995. Papadakis V G, Tsimas S (2002): Supplementary cementing materials in concrete, Part 1 & 2, Cement and Concrete Research Vol. 32, 2002. Pérez M S (2006): Wrapping of concrete columns with glass fibres cement and mortars, Master Thesis, KTH, Stockholm, Sweden, 2006. Poppe A, De Schutter G (2003): Effect of limestone filler on the cement hydration in SCC, 3rd International symposium on SCC, Reykjavik, 2003. Powers T C (1935): Absorption of water by Portland cement paste during the hardening process, Industrial and Engineering Chemistry 27, 1935. Powers T C, Brownyard T L (1948): Studies of physical properties of hardened Portland cement paste, Journal of American Institute, Vol. 43, Bulletin 22, Research Laboratories of Portland Cement Association, Chicago, 1948. Power T C (1960): Physical properties of cement paste, Proceedings of the Fourth International Symposium on the Chemistry of Cement, Washington DC, 1960.
Chapter 8 References
141
Ramachandran V S (1995): Concrete admixtures handbook, 2nd edit., Noyes Publications, 1995, Park Ridge, New Jersey, USA. Rhodes M (1999): Introduction to particle Technology, John Wiley & sons, 1999, Brisbane, Australia. Richard P, Cheyrezy M (1995): Composition of Reactive Powder Concrete, Cement and Concrete Research, Vol.25 No7, 1995. Richard P (1996): Reactive Powder Concrete: A New Ultra- high- strength Cementitious Material, in proceedings of the fourth international symposium on the utilization of high strength/ high performance concrete, 29- 31 may 1996, Paris, France. RILEM Technical Committee 181-EAS (2002): Early Age Shrinkage Induced Stresses and Cracking in Cementitious Systems, edited by Bentur A, RILEM Report 25, 2002. Ronin V, Jonasson J-E (1994): Investigation of the effective winter concreting with the use of energetically modified cement (EMC) – material science aspects. Report 1994:3, Div. Structural Engineering Luleå University of Technology, Luleå, Sweden, 1994. Ronin V et al. (1997): Method for producing cement, European Patent EP 0696261 B1, 1997. Röhling, Eifert, Kaden (2000): Betonbau – Planung und Ausführung, Verlag Bauwesen, Berlin, 2000 (in German). Scrivener K L, Pratt P L (1996): Characterisation of interfacial microstructure, RILEM TC 108-ICC: Interfacial Transition Zone in concrete, 1996. Sellevold E J (1992): Shrinkage of concrete: effect of binder composition and aggregate volume fraction from 0 to 60 %, Nordic Concrete Research, Publication no 11, 1992. Shacklock B W, Keene, P W (1957): The effect of mix proportions and testing conditions on drying shrinkage and moisture movement of concrete, Cement Concrete Association Technical Report TRA/266, 1957. Stark J, Wicht B (1998): Anorganische Bindemittel, Schriften der Bauhaus-Universität Weimar, Heft 109, F.A. Finger-Institut für Baustoffkunde, 1998, Weimar (in German). Stark, J, Krug H (2000): Baustoffpraktikum, Band 1- 3, Schriften der Bauhaus-Universität Weimar F.A. Finger-Institut für Baustoffkunde, 2000, Weimar (in German). Stark J, Wicht B (2001): Dauerhaftigkeit von Beton, Birkhäuser Verlag, 2001, Basel, Schweiz (in German).

Chapter 8 References
142
Stovall T, de Larrard F, Buil M (1986): Linear packing density model of grain mixtures, Powder Technology 48, 1986. Taylor H W F (1997): Cement chemistry, 2nd ed., Thomas Telford, 1997, London, UK. Triantafillou T C, Papanicolau C G, Zissimopoulos P, Laourdekis T (2006): Concrete confinement with textile-reinforced mortar jackets, ACI Structural Journal, Vol. 103, No.1, 2006. Troxell G E, Raphael J M, Davis R E (1958): Long-time creep and shrinkage tests on plain and reinforced concrete, Proc. ASTM, Vol. 58, 1958. Vogt C, Lagerblad B, Hugo-Persson, T (2004): Optimization of UHPC for selective stabilization of deep boreholes, in proceedings of the International Symposium on Ultra-High Performance Concrete, Kassel, Germany, 2004. Vogt C, Wallin K, Jonasson J-E (2006): Comparison of heat development and thermal crack risk between SCC and conventional concretes in civil engineering constructions, in Proceedings of the 5th International RILEM Symposium on Self-compacting concrete, Ghent, Belgium, 2007. Vogt C, Jonasson J-E, Wallin K, Lagerblad B, Baldy F (2009): Low pH self compacting concrete for deposition tunnel plugs, ISSN 1402-3091, SKB Rapport R-09-07, Stockholm, Sweden, 2009. Westman A E R, Hugill H R (1930): The Packing of Particles, Journal of American Ceramic Society 13, 1930. White H E, Walton S F (1936): Particle packing and particle shape, Journal of American Ceramic Society 20, 1936. Wiberg A (2000): Strengthening and repair of structural concrete with advanced, cementitious composites, Licentiate thesis, Trita-BKN, Bulletin 58, 2000, KTH, Stockholm, Sweden. Wittmann F H (1968): Surface tension shrinkage and strength of hardened cement paste, Matériaux et Constructions, Vol. 1, No 6, 1968. Wittmann F H (1976): On the action of capillary pressure in fresh concrete, Cement and Concrete Research, Vol. 6, No 1, 1976. Ye G, Poppe A, De Schutter G (2006): Numerical Simulation of the hydration process and the development of microstructure of self-compacting cement paste containing limestone as filler, 2006, Materials and Structures.
Chapter 8 References
143
STANDARDS AND RECOMMENDATIONS EN 196-1 (1995): Methods of testing cement –Determination of strength, 1995. EN 197-1 (2000): Cement - Part 1: Composition, specifications and conformity criteria for common cements, 2000. EN 206-1 (2001): Concrete – Part 1: Specification, performance, production and conformity, 2001. EN 933-1 (2004), Tests for geometrical properties of aggregates - Part 1: Determination of particle size distribution - Sieving method, 2004. EN 933-2 (1996), Tests for geometrical properties of aggregates - Part 2: Determination of particle size distribution - Test sieves, nominal size of apertures, 1996. EN 1015-3 (1999), Methods of test for mortar for masonry - Part 3: Determination of consistence of fresh mortar (by flow table), 1999. EN 12350-2 (2000): Testing fresh concrete - Part 2: Slump test, 2000. EN 12390-1 (2001): Testing hardened concrete – Part 1: Shape, dimensions and other requirements for specimens and moulds, 2001. EN 12390-2 (2001): Testing hardened concrete – Part 2: Making and curing specimens for strength tests, 2001. EN 12390-3 (2002): Testing hardened concrete – Part 3: Compressive strength of test specimens, 2002. SS 13 72 15 (2000): Concrete testing – Hardened concrete – Shrinkage, 2000. SS 13 72 44 (1995): Concrete testing – Hardened concrete – Scaling at freezing, 1995. The European Guidelines for Self-Compacting Concrete - Specification, Production and Use (2005), www.efnarc.org, 2005.
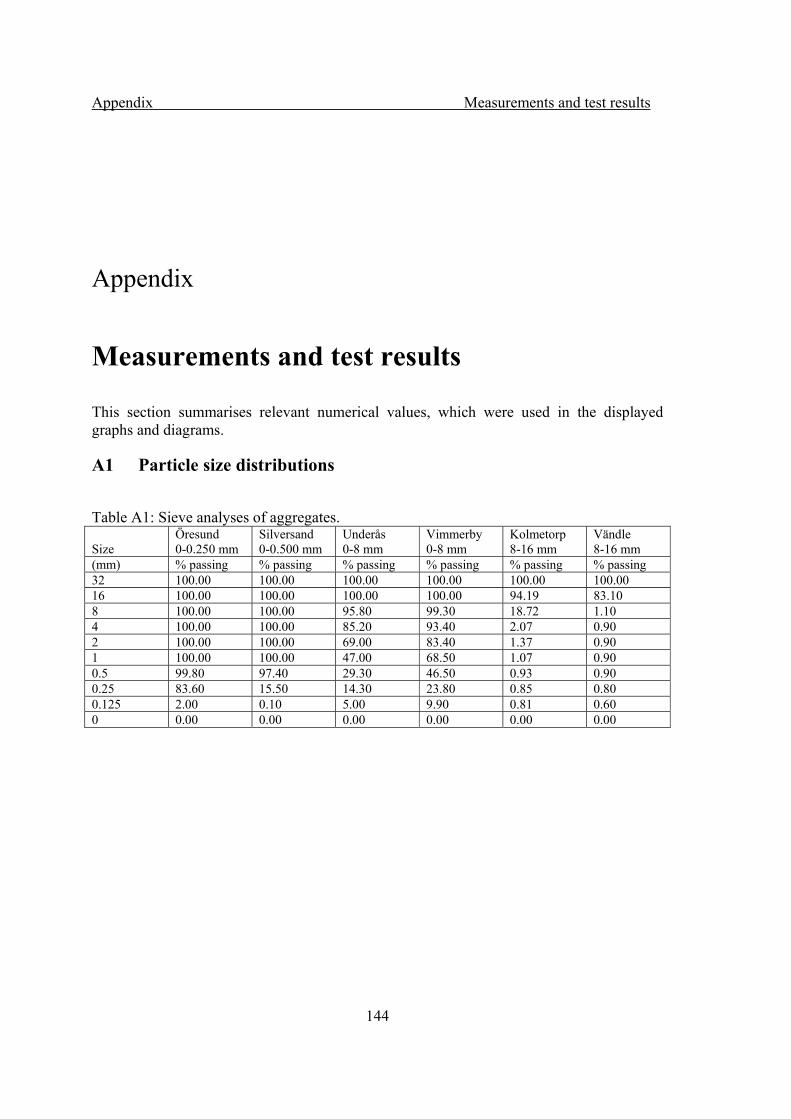
Appendix Measurements and test results
144
Appendix
Measurements and test results
This section summarises relevant numerical values, which were used in the displayed graphs and diagrams.
A1 Particle size distributions
Table A1: Sieve analyses of aggregates.
Size Öresund 0-0.250 mm
Silversand 0-0.500 mm
Underås 0-8 mm
Vimmerby 0-8 mm
Kolmetorp 8-16 mm
Vändle 8-16 mm
(mm) % passing % passing % passing % passing % passing % passing 32 100.00 100.00 100.00 100.00 100.00 100.00 16 100.00 100.00 100.00 100.00 94.19 83.10 8 100.00 100.00 95.80 99.30 18.72 1.10 4 100.00 100.00 85.20 93.40 2.07 0.90 2 100.00 100.00 69.00 83.40 1.37 0.90 1 100.00 100.00 47.00 68.50 1.07 0.90 0.5 99.80 97.40 29.30 46.50 0.93 0.90 0.25 83.60 15.50 14.30 23.80 0.85 0.80 0.125 2.00 0.10 5.00 9.90 0.81 0.60 0 0.00 0.00 0.00 0.00 0.00 0.00
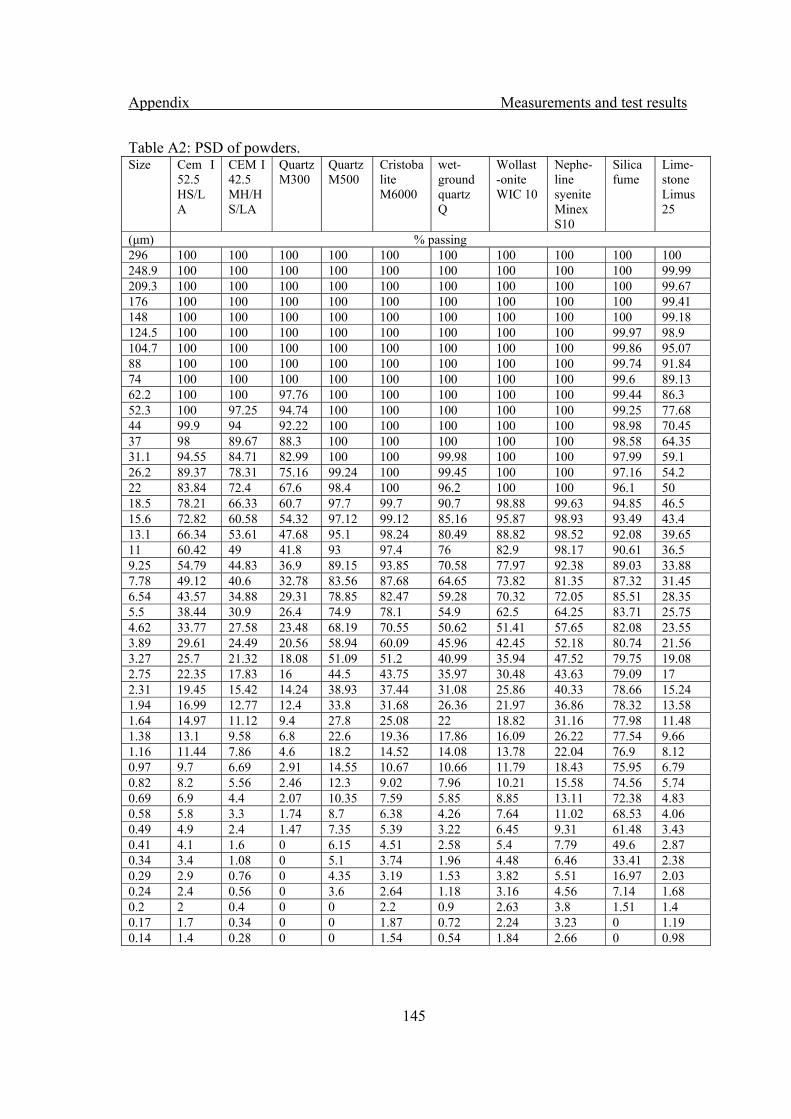
Appendix Measurements and test results
145
Table A2: PSD of powders. Size Cem I
52.5 HS/LA
CEM I 42.5 MH/HS/LA
Quartz M300
Quartz M500
Cristobalite M6000
wet-ground quartz Q
Wollast-onite WIC 10
Nephe-line syenite Minex S10
Silica fume
Lime-stone Limus 25
(μm) % passing 296 100 100 100 100 100 100 100 100 100 100 248.9 100 100 100 100 100 100 100 100 100 99.99 209.3 100 100 100 100 100 100 100 100 100 99.67 176 100 100 100 100 100 100 100 100 100 99.41 148 100 100 100 100 100 100 100 100 100 99.18 124.5 100 100 100 100 100 100 100 100 99.97 98.9 104.7 100 100 100 100 100 100 100 100 99.86 95.07 88 100 100 100 100 100 100 100 100 99.74 91.84 74 100 100 100 100 100 100 100 100 99.6 89.13 62.2 100 100 97.76 100 100 100 100 100 99.44 86.3 52.3 100 97.25 94.74 100 100 100 100 100 99.25 77.68 44 99.9 94 92.22 100 100 100 100 100 98.98 70.45 37 98 89.67 88.3 100 100 100 100 100 98.58 64.35 31.1 94.55 84.71 82.99 100 100 99.98 100 100 97.99 59.1 26.2 89.37 78.31 75.16 99.24 100 99.45 100 100 97.16 54.2 22 83.84 72.4 67.6 98.4 100 96.2 100 100 96.1 50 18.5 78.21 66.33 60.7 97.7 99.7 90.7 98.88 99.63 94.85 46.5 15.6 72.82 60.58 54.32 97.12 99.12 85.16 95.87 98.93 93.49 43.4 13.1 66.34 53.61 47.68 95.1 98.24 80.49 88.82 98.52 92.08 39.65 11 60.42 49 41.8 93 97.4 76 82.9 98.17 90.61 36.5 9.25 54.79 44.83 36.9 89.15 93.85 70.58 77.97 92.38 89.03 33.88 7.78 49.12 40.6 32.78 83.56 87.68 64.65 73.82 81.35 87.32 31.45 6.54 43.57 34.88 29.31 78.85 82.47 59.28 70.32 72.05 85.51 28.35 5.5 38.44 30.9 26.4 74.9 78.1 54.9 62.5 64.25 83.71 25.75 4.62 33.77 27.58 23.48 68.19 70.55 50.62 51.41 57.65 82.08 23.55 3.89 29.61 24.49 20.56 58.94 60.09 45.96 42.45 52.18 80.74 21.56 3.27 25.7 21.32 18.08 51.09 51.2 40.99 35.94 47.52 79.75 19.08 2.75 22.35 17.83 16 44.5 43.75 35.97 30.48 43.63 79.09 17 2.31 19.45 15.42 14.24 38.93 37.44 31.08 25.86 40.33 78.66 15.24 1.94 16.99 12.77 12.4 33.8 31.68 26.36 21.97 36.86 78.32 13.58 1.64 14.97 11.12 9.4 27.8 25.08 22 18.82 31.16 77.98 11.48 1.38 13.1 9.58 6.8 22.6 19.36 17.86 16.09 26.22 77.54 9.66 1.16 11.44 7.86 4.6 18.2 14.52 14.08 13.78 22.04 76.9 8.12 0.97 9.7 6.69 2.91 14.55 10.67 10.66 11.79 18.43 75.95 6.79 0.82 8.2 5.56 2.46 12.3 9.02 7.96 10.21 15.58 74.56 5.74 0.69 6.9 4.4 2.07 10.35 7.59 5.85 8.85 13.11 72.38 4.83 0.58 5.8 3.3 1.74 8.7 6.38 4.26 7.64 11.02 68.53 4.06 0.49 4.9 2.4 1.47 7.35 5.39 3.22 6.45 9.31 61.48 3.43 0.41 4.1 1.6 0 6.15 4.51 2.58 5.4 7.79 49.6 2.87 0.34 3.4 1.08 0 5.1 3.74 1.96 4.48 6.46 33.41 2.38 0.29 2.9 0.76 0 4.35 3.19 1.53 3.82 5.51 16.97 2.03 0.24 2.4 0.56 0 3.6 2.64 1.18 3.16 4.56 7.14 1.68 0.2 2 0.4 0 0 2.2 0.9 2.63 3.8 1.51 1.4 0.17 1.7 0.34 0 0 1.87 0.72 2.24 3.23 0 1.19 0.14 1.4 0.28 0 0 1.54 0.54 1.84 2.66 0 0.98
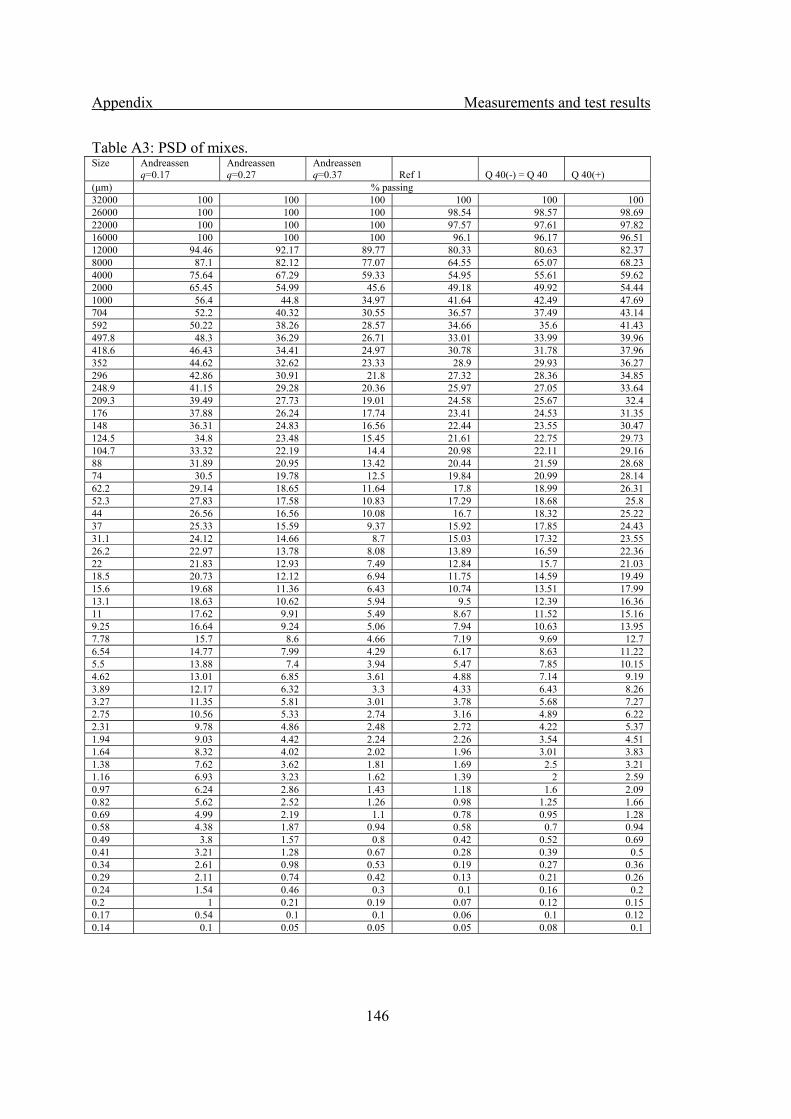
Appendix Measurements and test results
146
Table A3: PSD of mixes. Size Andreassen
q=0.17 Andreassen q=0.27
Andreassen q=0.37 Ref 1 Q 40(-) = Q 40 Q 40(+)
(μm) % passing 32000 100 100 100 100 100 100 26000 100 100 100 98.54 98.57 98.69 22000 100 100 100 97.57 97.61 97.82 16000 100 100 100 96.1 96.17 96.51 12000 94.46 92.17 89.77 80.33 80.63 82.37 8000 87.1 82.12 77.07 64.55 65.07 68.23 4000 75.64 67.29 59.33 54.95 55.61 59.62 2000 65.45 54.99 45.6 49.18 49.92 54.44 1000 56.4 44.8 34.97 41.64 42.49 47.69 704 52.2 40.32 30.55 36.57 37.49 43.14 592 50.22 38.26 28.57 34.66 35.6 41.43 497.8 48.3 36.29 26.71 33.01 33.99 39.96 418.6 46.43 34.41 24.97 30.78 31.78 37.96 352 44.62 32.62 23.33 28.9 29.93 36.27 296 42.86 30.91 21.8 27.32 28.36 34.85 248.9 41.15 29.28 20.36 25.97 27.05 33.64 209.3 39.49 27.73 19.01 24.58 25.67 32.4 176 37.88 26.24 17.74 23.41 24.53 31.35 148 36.31 24.83 16.56 22.44 23.55 30.47 124.5 34.8 23.48 15.45 21.61 22.75 29.73 104.7 33.32 22.19 14.4 20.98 22.11 29.16 88 31.89 20.95 13.42 20.44 21.59 28.68 74 30.5 19.78 12.5 19.84 20.99 28.14 62.2 29.14 18.65 11.64 17.8 18.99 26.31 52.3 27.83 17.58 10.83 17.29 18.68 25.8 44 26.56 16.56 10.08 16.7 18.32 25.22 37 25.33 15.59 9.37 15.92 17.85 24.43 31.1 24.12 14.66 8.7 15.03 17.32 23.55 26.2 22.97 13.78 8.08 13.89 16.59 22.36 22 21.83 12.93 7.49 12.84 15.7 21.03 18.5 20.73 12.12 6.94 11.75 14.59 19.49 15.6 19.68 11.36 6.43 10.74 13.51 17.99 13.1 18.63 10.62 5.94 9.5 12.39 16.36 11 17.62 9.91 5.49 8.67 11.52 15.16 9.25 16.64 9.24 5.06 7.94 10.63 13.95 7.78 15.7 8.6 4.66 7.19 9.69 12.7 6.54 14.77 7.99 4.29 6.17 8.63 11.22 5.5 13.88 7.4 3.94 5.47 7.85 10.15 4.62 13.01 6.85 3.61 4.88 7.14 9.19 3.89 12.17 6.32 3.3 4.33 6.43 8.26 3.27 11.35 5.81 3.01 3.78 5.68 7.27 2.75 10.56 5.33 2.74 3.16 4.89 6.22 2.31 9.78 4.86 2.48 2.72 4.22 5.37 1.94 9.03 4.42 2.24 2.26 3.54 4.51 1.64 8.32 4.02 2.02 1.96 3.01 3.83 1.38 7.62 3.62 1.81 1.69 2.5 3.21 1.16 6.93 3.23 1.62 1.39 2 2.59 0.97 6.24 2.86 1.43 1.18 1.6 2.09 0.82 5.62 2.52 1.26 0.98 1.25 1.66 0.69 4.99 2.19 1.1 0.78 0.95 1.28 0.58 4.38 1.87 0.94 0.58 0.7 0.94 0.49 3.8 1.57 0.8 0.42 0.52 0.69 0.41 3.21 1.28 0.67 0.28 0.39 0.5 0.34 2.61 0.98 0.53 0.19 0.27 0.36 0.29 2.11 0.74 0.42 0.13 0.21 0.26 0.24 1.54 0.46 0.3 0.1 0.16 0.2 0.2 1 0.21 0.19 0.07 0.12 0.15 0.17 0.54 0.1 0.1 0.06 0.1 0.12 0.14 0.1 0.05 0.05 0.05 0.08 0.1
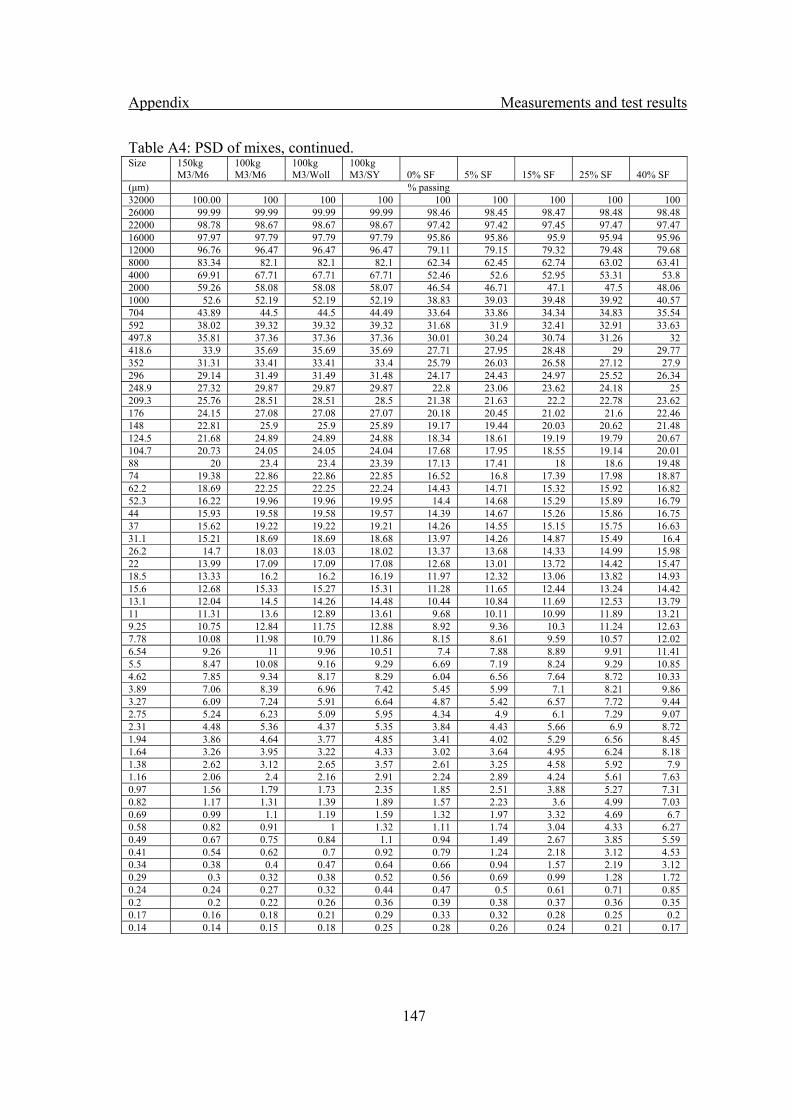
Appendix Measurements and test results
147
Table A4: PSD of mixes, continued. Size 150kg
M3/M6 100kg M3/M6
100kg M3/Woll
100kg M3/SY 0% SF 5% SF 15% SF 25% SF 40% SF
(μm) % passing 32000 100.00 100 100 100 100 100 100 100 100 26000 99.99 99.99 99.99 99.99 98.46 98.45 98.47 98.48 98.48 22000 98.78 98.67 98.67 98.67 97.42 97.42 97.45 97.47 97.47 16000 97.97 97.79 97.79 97.79 95.86 95.86 95.9 95.94 95.96 12000 96.76 96.47 96.47 96.47 79.11 79.15 79.32 79.48 79.68 8000 83.34 82.1 82.1 82.1 62.34 62.45 62.74 63.02 63.41 4000 69.91 67.71 67.71 67.71 52.46 52.6 52.95 53.31 53.8 2000 59.26 58.08 58.08 58.07 46.54 46.71 47.1 47.5 48.06 1000 52.6 52.19 52.19 52.19 38.83 39.03 39.48 39.92 40.57 704 43.89 44.5 44.5 44.49 33.64 33.86 34.34 34.83 35.54 592 38.02 39.32 39.32 39.32 31.68 31.9 32.41 32.91 33.63 497.8 35.81 37.36 37.36 37.36 30.01 30.24 30.74 31.26 32 418.6 33.9 35.69 35.69 35.69 27.71 27.95 28.48 29 29.77 352 31.31 33.41 33.41 33.4 25.79 26.03 26.58 27.12 27.9 296 29.14 31.49 31.49 31.48 24.17 24.43 24.97 25.52 26.34 248.9 27.32 29.87 29.87 29.87 22.8 23.06 23.62 24.18 25 209.3 25.76 28.51 28.51 28.5 21.38 21.63 22.2 22.78 23.62 176 24.15 27.08 27.08 27.07 20.18 20.45 21.02 21.6 22.46 148 22.81 25.9 25.9 25.89 19.17 19.44 20.03 20.62 21.48 124.5 21.68 24.89 24.89 24.88 18.34 18.61 19.19 19.79 20.67 104.7 20.73 24.05 24.05 24.04 17.68 17.95 18.55 19.14 20.01 88 20 23.4 23.4 23.39 17.13 17.41 18 18.6 19.48 74 19.38 22.86 22.86 22.85 16.52 16.8 17.39 17.98 18.87 62.2 18.69 22.25 22.25 22.24 14.43 14.71 15.32 15.92 16.82 52.3 16.22 19.96 19.96 19.95 14.4 14.68 15.29 15.89 16.79 44 15.93 19.58 19.58 19.57 14.39 14.67 15.26 15.86 16.75 37 15.62 19.22 19.22 19.21 14.26 14.55 15.15 15.75 16.63 31.1 15.21 18.69 18.69 18.68 13.97 14.26 14.87 15.49 16.4 26.2 14.7 18.03 18.03 18.02 13.37 13.68 14.33 14.99 15.98 22 13.99 17.09 17.09 17.08 12.68 13.01 13.72 14.42 15.47 18.5 13.33 16.2 16.2 16.19 11.97 12.32 13.06 13.82 14.93 15.6 12.68 15.33 15.27 15.31 11.28 11.65 12.44 13.24 14.42 13.1 12.04 14.5 14.26 14.48 10.44 10.84 11.69 12.53 13.79 11 11.31 13.6 12.89 13.61 9.68 10.11 10.99 11.89 13.21 9.25 10.75 12.84 11.75 12.88 8.92 9.36 10.3 11.24 12.63 7.78 10.08 11.98 10.79 11.86 8.15 8.61 9.59 10.57 12.02 6.54 9.26 11 9.96 10.51 7.4 7.88 8.89 9.91 11.41 5.5 8.47 10.08 9.16 9.29 6.69 7.19 8.24 9.29 10.85 4.62 7.85 9.34 8.17 8.29 6.04 6.56 7.64 8.72 10.33 3.89 7.06 8.39 6.96 7.42 5.45 5.99 7.1 8.21 9.86 3.27 6.09 7.24 5.91 6.64 4.87 5.42 6.57 7.72 9.44 2.75 5.24 6.23 5.09 5.95 4.34 4.9 6.1 7.29 9.07 2.31 4.48 5.36 4.37 5.35 3.84 4.43 5.66 6.9 8.72 1.94 3.86 4.64 3.77 4.85 3.41 4.02 5.29 6.56 8.45 1.64 3.26 3.95 3.22 4.33 3.02 3.64 4.95 6.24 8.18 1.38 2.62 3.12 2.65 3.57 2.61 3.25 4.58 5.92 7.9 1.16 2.06 2.4 2.16 2.91 2.24 2.89 4.24 5.61 7.63 0.97 1.56 1.79 1.73 2.35 1.85 2.51 3.88 5.27 7.31 0.82 1.17 1.31 1.39 1.89 1.57 2.23 3.6 4.99 7.03 0.69 0.99 1.1 1.19 1.59 1.32 1.97 3.32 4.69 6.7 0.58 0.82 0.91 1 1.32 1.11 1.74 3.04 4.33 6.27 0.49 0.67 0.75 0.84 1.1 0.94 1.49 2.67 3.85 5.59 0.41 0.54 0.62 0.7 0.92 0.79 1.24 2.18 3.12 4.53 0.34 0.38 0.4 0.47 0.64 0.66 0.94 1.57 2.19 3.12 0.29 0.3 0.32 0.38 0.52 0.56 0.69 0.99 1.28 1.72 0.24 0.24 0.27 0.32 0.44 0.47 0.5 0.61 0.71 0.85 0.2 0.2 0.22 0.26 0.36 0.39 0.38 0.37 0.36 0.35 0.17 0.16 0.18 0.21 0.29 0.33 0.32 0.28 0.25 0.2 0.14 0.14 0.15 0.18 0.25 0.28 0.26 0.24 0.21 0.17
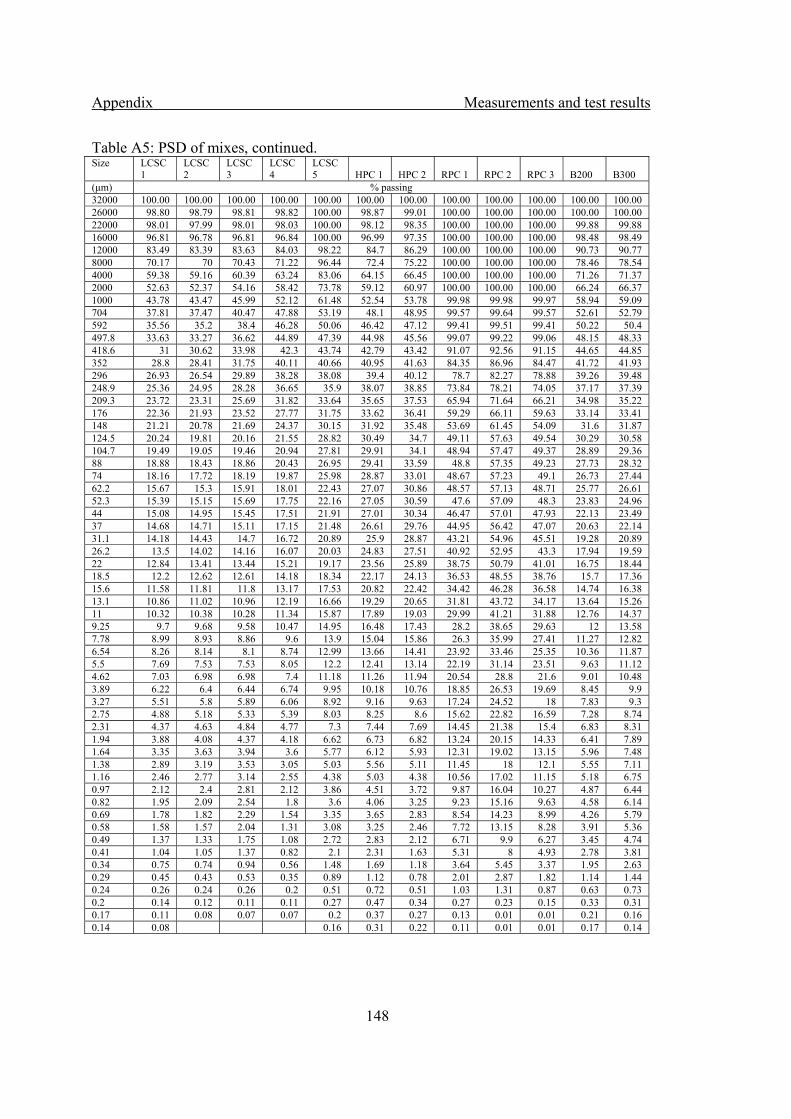
Appendix Measurements and test results
148
Table A5: PSD of mixes, continued. Size LCSC
1 LCSC 2
LCSC 3
LCSC 4
LCSC 5 HPC 1 HPC 2 RPC 1 RPC 2 RPC 3 B200 B300
(μm) % passing 32000 100.00 100.00 100.00 100.00 100.00 100.00 100.00 100.00 100.00 100.00 100.00 100.00 26000 98.80 98.79 98.81 98.82 100.00 98.87 99.01 100.00 100.00 100.00 100.00 100.00 22000 98.01 97.99 98.01 98.03 100.00 98.12 98.35 100.00 100.00 100.00 99.88 99.88 16000 96.81 96.78 96.81 96.84 100.00 96.99 97.35 100.00 100.00 100.00 98.48 98.49 12000 83.49 83.39 83.63 84.03 98.22 84.7 86.29 100.00 100.00 100.00 90.73 90.77 8000 70.17 70 70.43 71.22 96.44 72.4 75.22 100.00 100.00 100.00 78.46 78.54 4000 59.38 59.16 60.39 63.24 83.06 64.15 66.45 100.00 100.00 100.00 71.26 71.37 2000 52.63 52.37 54.16 58.42 73.78 59.12 60.97 100.00 100.00 100.00 66.24 66.37 1000 43.78 43.47 45.99 52.12 61.48 52.54 53.78 99.98 99.98 99.97 58.94 59.09 704 37.81 37.47 40.47 47.88 53.19 48.1 48.95 99.57 99.64 99.57 52.61 52.79 592 35.56 35.2 38.4 46.28 50.06 46.42 47.12 99.41 99.51 99.41 50.22 50.4 497.8 33.63 33.27 36.62 44.89 47.39 44.98 45.56 99.07 99.22 99.06 48.15 48.33 418.6 31 30.62 33.98 42.3 43.74 42.79 43.42 91.07 92.56 91.15 44.65 44.85 352 28.8 28.41 31.75 40.11 40.66 40.95 41.63 84.35 86.96 84.47 41.72 41.93 296 26.93 26.54 29.89 38.28 38.08 39.4 40.12 78.7 82.27 78.88 39.26 39.48 248.9 25.36 24.95 28.28 36.65 35.9 38.07 38.85 73.84 78.21 74.05 37.17 37.39 209.3 23.72 23.31 25.69 31.82 33.64 35.65 37.53 65.94 71.64 66.21 34.98 35.22 176 22.36 21.93 23.52 27.77 31.75 33.62 36.41 59.29 66.11 59.63 33.14 33.41 148 21.21 20.78 21.69 24.37 30.15 31.92 35.48 53.69 61.45 54.09 31.6 31.87 124.5 20.24 19.81 20.16 21.55 28.82 30.49 34.7 49.11 57.63 49.54 30.29 30.58 104.7 19.49 19.05 19.46 20.94 27.81 29.91 34.1 48.94 57.47 49.37 28.89 29.36 88 18.88 18.43 18.86 20.43 26.95 29.41 33.59 48.8 57.35 49.23 27.73 28.32 74 18.16 17.72 18.19 19.87 25.98 28.87 33.01 48.67 57.23 49.1 26.73 27.44 62.2 15.67 15.3 15.91 18.01 22.43 27.07 30.86 48.57 57.13 48.71 25.77 26.61 52.3 15.39 15.15 15.69 17.75 22.16 27.05 30.59 47.6 57.09 48.3 23.83 24.96 44 15.08 14.95 15.45 17.51 21.91 27.01 30.34 46.47 57.01 47.93 22.13 23.49 37 14.68 14.71 15.11 17.15 21.48 26.61 29.76 44.95 56.42 47.07 20.63 22.14 31.1 14.18 14.43 14.7 16.72 20.89 25.9 28.87 43.21 54.96 45.51 19.28 20.89 26.2 13.5 14.02 14.16 16.07 20.03 24.83 27.51 40.92 52.95 43.3 17.94 19.59 22 12.84 13.41 13.44 15.21 19.17 23.56 25.89 38.75 50.79 41.01 16.75 18.44 18.5 12.2 12.62 12.61 14.18 18.34 22.17 24.13 36.53 48.55 38.76 15.7 17.36 15.6 11.58 11.81 11.8 13.17 17.53 20.82 22.42 34.42 46.28 36.58 14.74 16.38 13.1 10.86 11.02 10.96 12.19 16.66 19.29 20.65 31.81 43.72 34.17 13.64 15.26 11 10.32 10.38 10.28 11.34 15.87 17.89 19.03 29.99 41.21 31.88 12.76 14.37 9.25 9.7 9.68 9.58 10.47 14.95 16.48 17.43 28.2 38.65 29.63 12 13.58 7.78 8.99 8.93 8.86 9.6 13.9 15.04 15.86 26.3 35.99 27.41 11.27 12.82 6.54 8.26 8.14 8.1 8.74 12.99 13.66 14.41 23.92 33.46 25.35 10.36 11.87 5.5 7.69 7.53 7.53 8.05 12.2 12.41 13.14 22.19 31.14 23.51 9.63 11.12 4.62 7.03 6.98 6.98 7.4 11.18 11.26 11.94 20.54 28.8 21.6 9.01 10.48 3.89 6.22 6.4 6.44 6.74 9.95 10.18 10.76 18.85 26.53 19.69 8.45 9.9 3.27 5.51 5.8 5.89 6.06 8.92 9.16 9.63 17.24 24.52 18 7.83 9.3 2.75 4.88 5.18 5.33 5.39 8.03 8.25 8.6 15.62 22.82 16.59 7.28 8.74 2.31 4.37 4.63 4.84 4.77 7.3 7.44 7.69 14.45 21.38 15.4 6.83 8.31 1.94 3.88 4.08 4.37 4.18 6.62 6.73 6.82 13.24 20.15 14.33 6.41 7.89 1.64 3.35 3.63 3.94 3.6 5.77 6.12 5.93 12.31 19.02 13.15 5.96 7.48 1.38 2.89 3.19 3.53 3.05 5.03 5.56 5.11 11.45 18 12.1 5.55 7.11 1.16 2.46 2.77 3.14 2.55 4.38 5.03 4.38 10.56 17.02 11.15 5.18 6.75 0.97 2.12 2.4 2.81 2.12 3.86 4.51 3.72 9.87 16.04 10.27 4.87 6.44 0.82 1.95 2.09 2.54 1.8 3.6 4.06 3.25 9.23 15.16 9.63 4.58 6.14 0.69 1.78 1.82 2.29 1.54 3.35 3.65 2.83 8.54 14.23 8.99 4.26 5.79 0.58 1.58 1.57 2.04 1.31 3.08 3.25 2.46 7.72 13.15 8.28 3.91 5.36 0.49 1.37 1.33 1.75 1.08 2.72 2.83 2.12 6.71 9.9 6.27 3.45 4.74 0.41 1.04 1.05 1.37 0.82 2.1 2.31 1.63 5.31 8 4.93 2.78 3.81 0.34 0.75 0.74 0.94 0.56 1.48 1.69 1.18 3.64 5.45 3.37 1.95 2.63 0.29 0.45 0.43 0.53 0.35 0.89 1.12 0.78 2.01 2.87 1.82 1.14 1.44 0.24 0.26 0.24 0.26 0.2 0.51 0.72 0.51 1.03 1.31 0.87 0.63 0.73 0.2 0.14 0.12 0.11 0.11 0.27 0.47 0.34 0.27 0.23 0.15 0.33 0.31 0.17 0.11 0.08 0.07 0.07 0.2 0.37 0.27 0.13 0.01 0.01 0.21 0.16 0.14 0.08 0.16 0.31 0.22 0.11 0.01 0.01 0.17 0.14
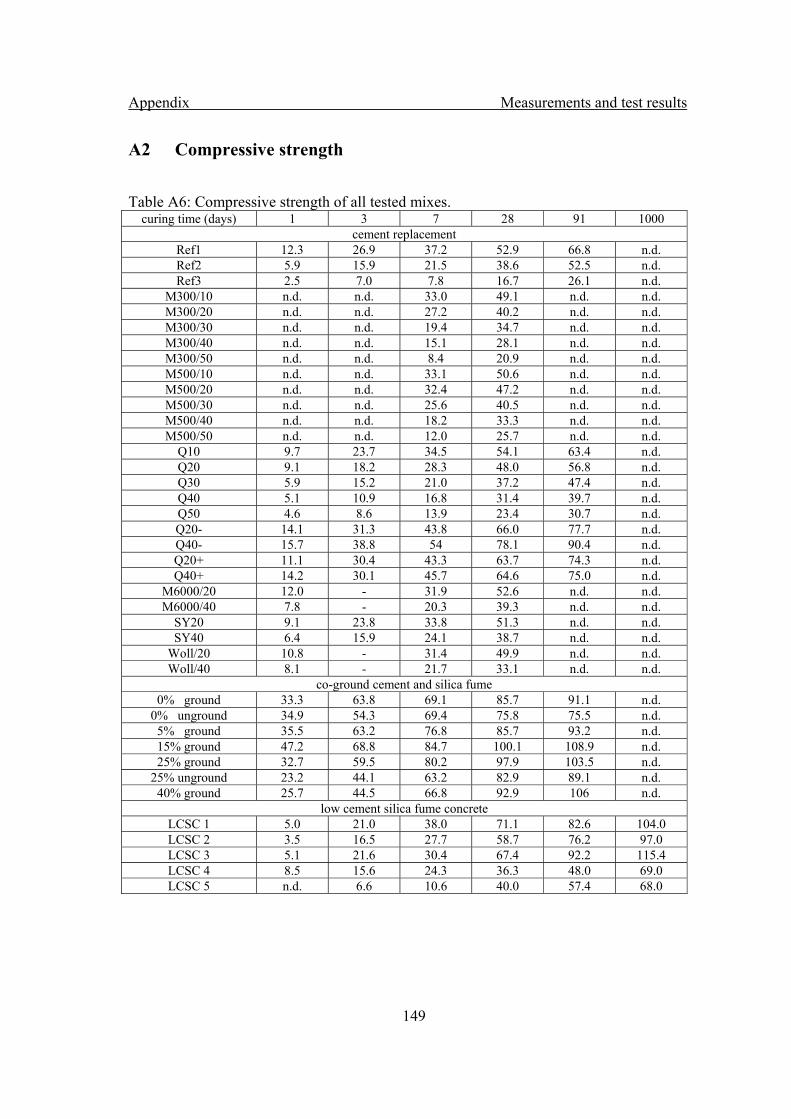
Appendix Measurements and test results
149
A2 Compressive strength
Table A6: Compressive strength of all tested mixes.
curing time (days) 1 3 7 28 91 1000 cement replacement
Ref1 12.3 26.9 37.2 52.9 66.8 n.d. Ref2 5.9 15.9 21.5 38.6 52.5 n.d. Ref3 2.5 7.0 7.8 16.7 26.1 n.d.
M300/10 n.d. n.d. 33.0 49.1 n.d. n.d. M300/20 n.d. n.d. 27.2 40.2 n.d. n.d. M300/30 n.d. n.d. 19.4 34.7 n.d. n.d. M300/40 n.d. n.d. 15.1 28.1 n.d. n.d. M300/50 n.d. n.d. 8.4 20.9 n.d. n.d. M500/10 n.d. n.d. 33.1 50.6 n.d. n.d. M500/20 n.d. n.d. 32.4 47.2 n.d. n.d. M500/30 n.d. n.d. 25.6 40.5 n.d. n.d. M500/40 n.d. n.d. 18.2 33.3 n.d. n.d. M500/50 n.d. n.d. 12.0 25.7 n.d. n.d.
Q10 9.7 23.7 34.5 54.1 63.4 n.d. Q20 9.1 18.2 28.3 48.0 56.8 n.d. Q30 5.9 15.2 21.0 37.2 47.4 n.d. Q40 5.1 10.9 16.8 31.4 39.7 n.d. Q50 4.6 8.6 13.9 23.4 30.7 n.d. Q20- 14.1 31.3 43.8 66.0 77.7 n.d. Q40- 15.7 38.8 54 78.1 90.4 n.d. Q20+ 11.1 30.4 43.3 63.7 74.3 n.d. Q40+ 14.2 30.1 45.7 64.6 75.0 n.d.
M6000/20 12.0 - 31.9 52.6 n.d. n.d. M6000/40 7.8 - 20.3 39.3 n.d. n.d.
SY20 9.1 23.8 33.8 51.3 n.d. n.d. SY40 6.4 15.9 24.1 38.7 n.d. n.d.
Woll/20 10.8 - 31.4 49.9 n.d. n.d. Woll/40 8.1 - 21.7 33.1 n.d. n.d.
co-ground cement and silica fume 0% ground 33.3 63.8 69.1 85.7 91.1 n.d.
0% unground 34.9 54.3 69.4 75.8 75.5 n.d. 5% ground 35.5 63.2 76.8 85.7 93.2 n.d. 15% ground 47.2 68.8 84.7 100.1 108.9 n.d. 25% ground 32.7 59.5 80.2 97.9 103.5 n.d.
25% unground 23.2 44.1 63.2 82.9 89.1 n.d. 40% ground 25.7 44.5 66.8 92.9 106 n.d.
low cement silica fume concrete LCSC 1 5.0 21.0 38.0 71.1 82.6 104.0 LCSC 2 3.5 16.5 27.7 58.7 76.2 97.0 LCSC 3 5.1 21.6 30.4 67.4 92.2 115.4 LCSC 4 8.5 15.6 24.3 36.3 48.0 69.0 LCSC 5 n.d. 6.6 10.6 40.0 57.4 68.0
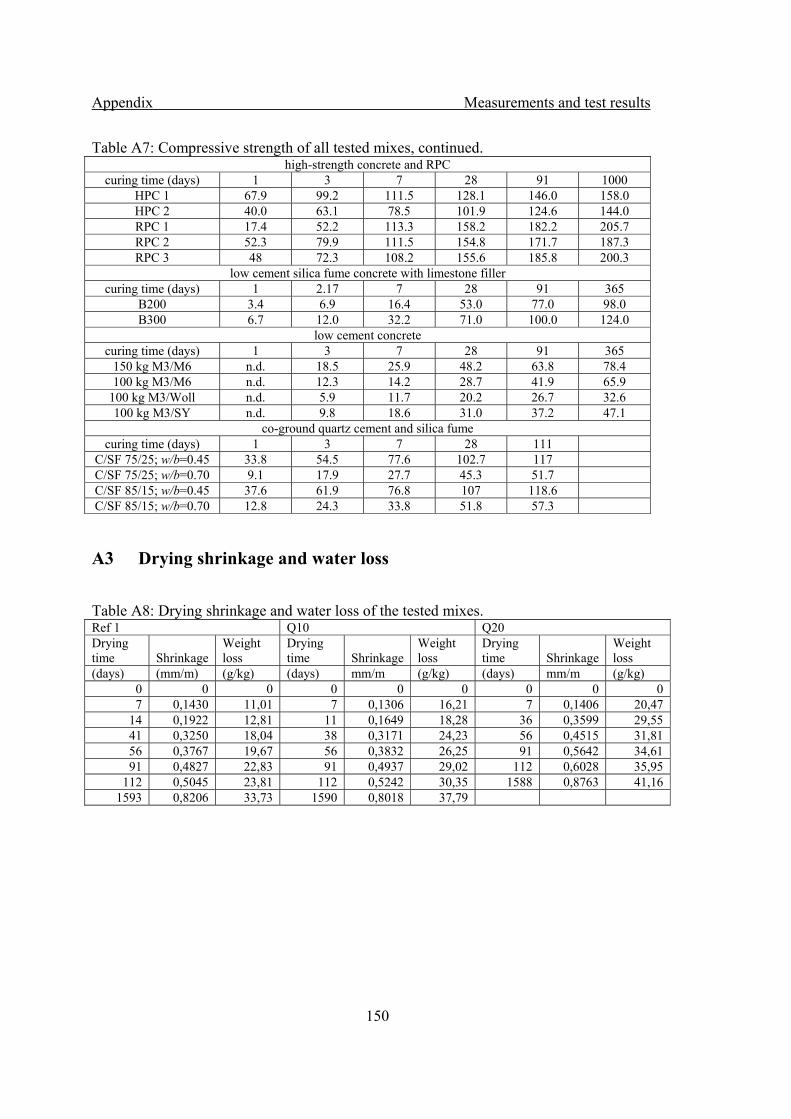
Appendix Measurements and test results
150
Table A7: Compressive strength of all tested mixes, continued. high-strength concrete and RPC
curing time (days) 1 3 7 28 91 1000 HPC 1 67.9 99.2 111.5 128.1 146.0 158.0 HPC 2 40.0 63.1 78.5 101.9 124.6 144.0 RPC 1 17.4 52.2 113.3 158.2 182.2 205.7 RPC 2 52.3 79.9 111.5 154.8 171.7 187.3 RPC 3 48 72.3 108.2 155.6 185.8 200.3
low cement silica fume concrete with limestone filler curing time (days) 1 2.17 7 28 91 365
B200 3.4 6.9 16.4 53.0 77.0 98.0 B300 6.7 12.0 32.2 71.0 100.0 124.0
low cement concrete curing time (days) 1 3 7 28 91 365
150 kg M3/M6 n.d. 18.5 25.9 48.2 63.8 78.4 100 kg M3/M6 n.d. 12.3 14.2 28.7 41.9 65.9
100 kg M3/Woll n.d. 5.9 11.7 20.2 26.7 32.6 100 kg M3/SY n.d. 9.8 18.6 31.0 37.2 47.1
co-ground quartz cement and silica fume curing time (days) 1 3 7 28 111
C/SF 75/25; w/b=0.45 33.8 54.5 77.6 102.7 117 C/SF 75/25; w/b=0.70 9.1 17.9 27.7 45.3 51.7 C/SF 85/15; w/b=0.45 37.6 61.9 76.8 107 118.6 C/SF 85/15; w/b=0.70 12.8 24.3 33.8 51.8 57.3
A3 Drying shrinkage and water loss
Table A8: Drying shrinkage and water loss of the tested mixes. Ref 1 Q10 Q20 Drying time Shrinkage
Weight loss
Drying time Shrinkage
Weight loss
Drying time Shrinkage
Weight loss
(days) (mm/m) (g/kg) (days) mm/m (g/kg) (days) mm/m (g/kg) 0 0 0 0 0 0 0 0 0 7 0,1430 11,01 7 0,1306 16,21 7 0,1406 20,47
14 0,1922 12,81 11 0,1649 18,28 36 0,3599 29,55 41 0,3250 18,04 38 0,3171 24,23 56 0,4515 31,81 56 0,3767 19,67 56 0,3832 26,25 91 0,5642 34,61 91 0,4827 22,83 91 0,4937 29,02 112 0,6028 35,95
112 0,5045 23,81 112 0,5242 30,35 1588 0,8763 41,16 1593 0,8206 33,73 1590 0,8018 37,79
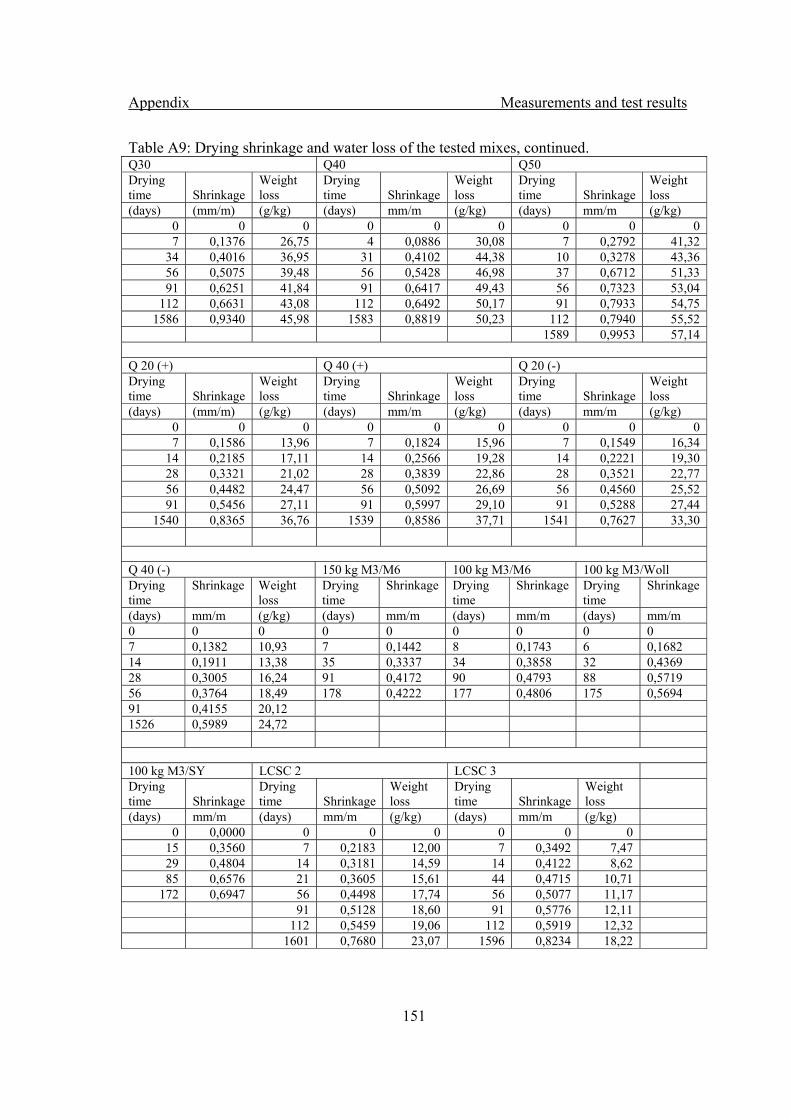
Appendix Measurements and test results
151
Table A9: Drying shrinkage and water loss of the tested mixes, continued. Q30 Q40 Q50 Drying time Shrinkage
Weight loss
Drying time Shrinkage
Weight loss
Drying time Shrinkage
Weight loss
(days) (mm/m) (g/kg) (days) mm/m (g/kg) (days) mm/m (g/kg) 0 0 0 0 0 0 0 0 0 7 0,1376 26,75 4 0,0886 30,08 7 0,2792 41,32
34 0,4016 36,95 31 0,4102 44,38 10 0,3278 43,36 56 0,5075 39,48 56 0,5428 46,98 37 0,6712 51,33 91 0,6251 41,84 91 0,6417 49,43 56 0,7323 53,04
112 0,6631 43,08 112 0,6492 50,17 91 0,7933 54,75 1586 0,9340 45,98 1583 0,8819 50,23 112 0,7940 55,52
1589 0,9953 57,14 Q 20 (+) Q 40 (+) Q 20 (-) Drying time Shrinkage
Weight loss
Drying time Shrinkage
Weight loss
Drying time Shrinkage
Weight loss
(days) (mm/m) (g/kg) (days) mm/m (g/kg) (days) mm/m (g/kg) 0 0 0 0 0 0 0 0 0 7 0,1586 13,96 7 0,1824 15,96 7 0,1549 16,34
14 0,2185 17,11 14 0,2566 19,28 14 0,2221 19,30 28 0,3321 21,02 28 0,3839 22,86 28 0,3521 22,77 56 0,4482 24,47 56 0,5092 26,69 56 0,4560 25,52 91 0,5456 27,11 91 0,5997 29,10 91 0,5288 27,44
1540 0,8365 36,76 1539 0,8586 37,71 1541 0,7627 33,30 Q 40 (-) 150 kg M3/M6 100 kg M3/M6 100 kg M3/Woll Drying time
Shrinkage Weight loss
Drying time
Shrinkage Drying time
Shrinkage Drying time
Shrinkage
(days) mm/m (g/kg) (days) mm/m (days) mm/m (days) mm/m 0 0 0 0 0 0 0 0 0 7 0,1382 10,93 7 0,1442 8 0,1743 6 0,1682 14 0,1911 13,38 35 0,3337 34 0,3858 32 0,4369 28 0,3005 16,24 91 0,4172 90 0,4793 88 0,5719 56 0,3764 18,49 178 0,4222 177 0,4806 175 0,5694 91 0,4155 20,12 1526 0,5989 24,72 100 kg M3/SY LCSC 2 LCSC 3 Drying time Shrinkage
Drying time Shrinkage
Weight loss
Drying time Shrinkage
Weight loss
(days) mm/m (days) mm/m (g/kg) (days) mm/m (g/kg) 0 0,0000 0 0 0 0 0 0
15 0,3560 7 0,2183 12,00 7 0,3492 7,47 29 0,4804 14 0,3181 14,59 14 0,4122 8,62 85 0,6576 21 0,3605 15,61 44 0,4715 10,71
172 0,6947 56 0,4498 17,74 56 0,5077 11,17 91 0,5128 18,60 91 0,5776 12,11 112 0,5459 19,06 112 0,5919 12,32 1601 0,7680 23,07 1596 0,8234 18,22
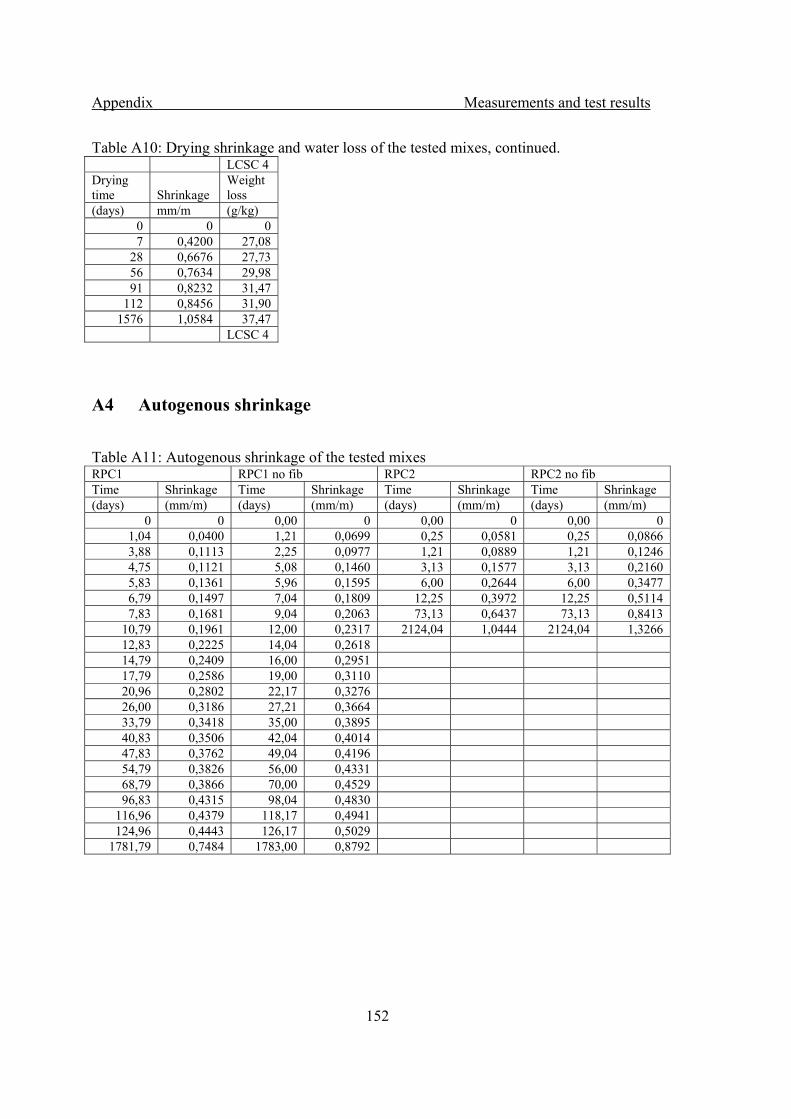
Appendix Measurements and test results
152
Table A10: Drying shrinkage and water loss of the tested mixes, continued. LCSC 4 Drying time Shrinkage
Weight loss
(days) mm/m (g/kg) 0 0 0 7 0,4200 27,08
28 0,6676 27,73 56 0,7634 29,98 91 0,8232 31,47
112 0,8456 31,90 1576 1,0584 37,47
LCSC 4
A4 Autogenous shrinkage
Table A11: Autogenous shrinkage of the tested mixes RPC1 RPC1 no fib RPC2 RPC2 no fib Time Shrinkage Time Shrinkage Time Shrinkage Time Shrinkage (days) (mm/m) (days) (mm/m) (days) (mm/m) (days) (mm/m)
0 0 0,00 0 0,00 0 0,00 0 1,04 0,0400 1,21 0,0699 0,25 0,0581 0,25 0,0866 3,88 0,1113 2,25 0,0977 1,21 0,0889 1,21 0,1246 4,75 0,1121 5,08 0,1460 3,13 0,1577 3,13 0,2160 5,83 0,1361 5,96 0,1595 6,00 0,2644 6,00 0,3477 6,79 0,1497 7,04 0,1809 12,25 0,3972 12,25 0,5114 7,83 0,1681 9,04 0,2063 73,13 0,6437 73,13 0,8413
10,79 0,1961 12,00 0,2317 2124,04 1,0444 2124,04 1,3266 12,83 0,2225 14,04 0,2618 14,79 0,2409 16,00 0,2951 17,79 0,2586 19,00 0,3110 20,96 0,2802 22,17 0,3276 26,00 0,3186 27,21 0,3664 33,79 0,3418 35,00 0,3895 40,83 0,3506 42,04 0,4014 47,83 0,3762 49,04 0,4196 54,79 0,3826 56,00 0,4331 68,79 0,3866 70,00 0,4529 96,83 0,4315 98,04 0,4830
116,96 0,4379 118,17 0,4941 124,96 0,4443 126,17 0,5029
1781,79 0,7484 1783,00 0,8792

Appendix Measurements and test results
153
Table A12: Autogenous shrinkage of the tested mixes, continued. RPC3 RPC3 no fib Time Shrinkage Time Shrinkage (days) (mm/m) (days) (mm/m)
0,00 0 0,00 0 0,25 0,0059 0,25 0,0383 1,00 0,0154 1,21 0,0683 1,96 0,0499 3,13 0,1294 2,21 0,0547 6,00 0,2264 3,17 0,0772 12,25 0,3617 5,08 0,1129 73,13 0,6107 7,96 0,1783 2124,04 1,0525
14,21 0,2794 75,08 0,4767
2126,00 0,8597
A5 Capillary suction
Table A13: Capillary suction, finished by vacuum saturation. Time Ref1 Q 20(-) Q 40(-) LCSC4 sqrt/h kg/m2 kg/m3 kg/m2 kg/m3 kg/m2 kg/m3 kg/m2 kg/m3
0 0,00 0,00 0,00 0,00 0,00 0,00 0,00 0,00 0,50 0,23 7,79 0,25 8,59 0,14 4,46 0,15 4,89 0,71 0,32 10,83 0,35 12,02 0,19 6,06 0,20 6,52 1,00 0,45 14,89 0,48 16,49 0,24 7,97 0,27 8,81 1,41 0,60 19,97 0,68 23,36 0,34 11,16 0,38 12,39 2,00 0,80 26,74 0,98 33,66 0,49 15,94 0,55 17,94 2,45 0,92 30,80 1,22 41,91 0,60 19,77 0,71 23,16 4,90 1,46 48,75 2,49 85,19 1,29 42,09 1,75 57,08 5,48 1,56 52,13 2,63 90,00 1,44 47,19 2,01 65,56 6,86 1,77 59,24 2,71 92,74 1,79 58,35 2,60 85,12 7,35 1,84 61,61 2,72 93,09 1,90 62,17 2,80 91,65 8,31 1,98 66,35 2,73 93,43 2,08 67,91 3,12 102,08 8,72 2,03 68,04 2,74 93,77 2,13 69,50 3,21 105,02
12,96 2,54 84,97 2,80 95,84 2,27 74,29 3,45 112,85 15,46 2,81 94,11 2,82 96,52 2,29 74,92 3,46 113,17 18,97 3,17 105,95 2,84 97,21 2,32 75,88 3,48 113,82 23,02 3,41 114,08 2,86 97,90 2,34 76,52 3,50 114,48 27,35 3,51 117,46 2,89 98,93 2,36 77,16 3,52 115,13 36,73 3,65 122,20 2,95 100,99 2,40 78,43 3,54 115,78 49,27 3,92 131,00 3,08 105,45 2,51 81,94 3,63 118,72 55,67 4,01 134,05 3,14 107,51 2,53 82,58 3,69 120,67 62,77 4,16 139,13 3,19 109,23 2,56 83,53 3,80 124,26

Appendix Measurements and test results
154
Table A14: Capillary suction, finished by vacuum saturation, continued. Time LCSC1 LCSC2 LCSC3 HPC2 sqrt/h kg/m2 kg/m3 kg/m2 kg/m3 kg/m2 kg/m3 kg/m2 kg/m3
0,00 0,00 0,00 0,00 0,00 0,00 0,00 0,00 0,00 0,50 0,05 1,73 0,07 2,24 0,05 1,62 0,14 4,53 0,71 0,06 2,07 0,09 2,88 0,07 2,27 0,17 5,66 1,00 0,08 2,76 0,11 3,51 0,09 2,92 0,22 7,17 1,41 0,10 3,45 0,13 4,15 0,13 4,22 0,29 9,82 2,00 0,14 4,84 0,17 5,43 0,16 5,52 0,40 13,21 2,45 0,17 5,87 0,20 6,39 0,20 6,82 0,44 14,72 4,90 0,38 13,13 0,38 12,46 0,40 13,32 0,65 21,52 5,48 0,43 15,20 0,44 14,38 0,46 15,59 0,68 22,65 6,96 0,60 21,08 0,59 19,17 0,63 21,12 0,72 24,16 7,45 0,65 22,80 0,64 20,77 0,69 23,06 0,74 24,54 8,54 0,79 27,64 0,76 24,60 0,84 28,26 0,77 25,67
13,11 1,38 48,37 1,26 40,89 1,66 55,55 0,85 28,31 18,33 1,94 67,72 1,82 58,78 2,25 75,37 0,93 30,96 24,10 2,16 75,66 2,27 73,48 2,29 76,99 1,00 33,22 34,28 2,26 79,12 2,57 83,06 2,32 77,96 1,12 37,37 44,89 2,29 80,15 2,61 84,34 2,35 78,94 1,23 41,15 73,85 2,35 82,23 2,68 86,58 2,40 80,56 1,51 50,21 82,30 2,38 83,26 2,69 86,90 2,40 80,56 1,60 53,23
Time RPC1 RPC2 RPC3 sqrt/h kg/m2 kg/m3 kg/m2 kg/m3 kg/m2 kg/m3
0,00 0,00 0,00 0,00 0,00 0,00 0,00 0,50 0,05 1,55 0,04 1,31 0,05 1,50 0,71 0,06 1,84 0,05 1,64 0,06 1,80 1,00 0,07 2,23 0,06 1,97 0,07 2,10 1,41 0,09 2,76 0,08 2,63 0,08 2,40 2,00 0,11 3,63 0,11 3,61 0,10 3,00 2,45 0,13 4,26 0,13 4,27 0,11 3,30 4,90 0,20 6,63 0,22 7,55 0,17 5,10 5,48 0,21 6,87 0,24 8,20 0,17 5,10 6,96 0,24 7,89 0,30 10,17 0,20 6,00 7,45 0,25 8,13 0,31 10,50 0,21 6,30 8,54 0,27 8,71 0,35 11,81 0,23 6,90
13,11 0,34 10,88 0,46 15,75 0,27 8,10 18,33 0,43 13,79 0,58 19,69 0,35 10,50 24,10 0,51 16,35 0,70 23,63 0,45 13,50 34,28 0,65 20,90 0,88 29,86 0,54 16,20 44,89 0,78 25,20 1,04 35,11 0,66 19,80 73,85 1,07 34,78 1,36 45,94 0,94 28,20 82,30 1,14 37,01 1,44 48,89 1,02 30,60

Appendix Measurements and test results
155
A7 Frost resistance
Table A16: Test of frost resistance according to SS 13 72 44 method A 112 cycles, scaling in kg/m2. Time 0 7 14 28 42 56 70 84 98 112 Ref1-1 0 0,45 3,14 8,66 15,83 31,05 31,05 31,05 31,05 31,05 Ref1-2 0 0,39 3,17 8,44 17,94 32,99 32,99 32,99 32,99 32,99 Q20(-) 0 0,21 2,31 7,87 15,15 22,80 22,80 22,80 22,80 22,80 Q40(-)-1 0 0,00 0,03 0,16 0,68 3,67 11,26 21,06 21,06 21,06 Q40(-)-2 0 0,01 0,06 0,48 2,04 4,59 13,03 35,34 35,34 35,34 LCSC2-1 0 0,01 0,20 0,53 0,84 1,10 1,44 1,90 1,99 2,04 LCSC2-2 0 0,01 0,16 0,44 0,75 0,97 1,29 1,68 2,20 2,50 LCSC4 0 1,02 2,03 3,38 4,78 5,95 6,85 8,15 9,48 10,19 LCSC5-1 0 1,06 3,27 7,27 14,11 32,32 32,32 32,32 32,32 32,32 LCSC5-2 0 0,93 2,79 7,01 15,15 21,13 21,13 21,13 21,13 21,13 HPC2 0 0,00 0,00 0,01 0,06 0,45 2,07 4,48 7,41 10,39
List of Bulletins from the Department of Structural Engineering, The Royal Institute of Technology, Stockholm TRITA-BKN. Bulletin Pacoste, C., On the Application of Catastrophe Theory to Stability Analyses of Elastic Structures. Doctoral Thesis, 1993. Bulletin 1. Stenmark, A-K., Dämpning av 13 m lång stålbalk "Ullevibalken". Utprovning av dämpmassor och fastsättning av motbalk samt experimentell bestämning av modformer och förlustfaktorer. Vibration tests of full-scale steel girder to determine optimum passive control. Licentiatavhandling, 1993. Bulletin 2. Silfwerbrand, J., Renovering av asfaltgolv med cementbundna plastmodifierade avjämningsmassor. 1993. Bulletin 3. Norlin, B., Two-Layered Composite Beams with Nonlinear Connectors and Geometry Tests and Theory. Doctoral Thesis, 1993. Bulletin 4. Habtezion, T., On the Behaviour of Equilibrium Near Critical States. Licentiate Thesis, 1993. Bulletin 5. Krus, J., Hållfasthet hos frostnedbruten betong. Licentiatavhandling, 1993. Bulletin 6. Wiberg, U., Material Characterization and Defect Detection by Quantitative Ultrasonics. Doctoral Thesis, 1993. Bulletin 7. Lidström, T., Finite Element Modelling Supported by Object Oriented Methods. Licentiate Thesis, 1993. Bulletin 8. Hallgren, M., Flexural and Shear Capacity of Reinforced High Strength Concrete Beams without Stirrups. Licentiate Thesis, 1994. Bulletin 9. Krus, J., Betongbalkars lastkapacitet efter miljöbelastning. 1994. Bulletin 10. Sandahl, P., Analysis Sensitivity for Wind-related Fatigue in Lattice Structures. Licentiate Thesis, 1994. Bulletin 11. Sanne, L., Information Transfer Analysis and Modelling of the Structural Steel Construction Process. Licentiate Thesis, 1994. Bulletin 12. Zhitao, H., Influence of Web Buckling on Fatigue Life of Thin-Walled Columns. Doctoral Thesis, 1994. Bulletin 13. Kjörling, M., Dynamic response of railway track components. Measurements during train passage and dynamic laboratory loading. Licentiate Thesis, 1995. Bulletin 14. Yang, L., On Analysis Methods for Reinforced Concrete Structures. Doctoral Thesis, 1995. Bulletin 15. Petersson, Ö., Svensk metod för dimensionering av betongvägar. Licentiatavhandling, 1996. Bulletin 16.
Lidström, T., Computational Methods for Finite Element Instability Analyses. Doctoral Thesis, 1996. Bulletin 17. Krus, J., Environment- and Function-induced Degradation of Concrete Structures. Doctoral Thesis, 1996. Bulletin 18. Editor, Silfwerbrand, J., Structural Loadings in the 21st Century. Sven Sahlin Workshop, June 1996. Proceedings. Bulletin 19. Ansell, A., Frequency Dependent Matrices for Dynamic Analysis of Frame Type Structures. Licentiate Thesis, 1996. Bulletin 20. Troive, S., Optimering av åtgärder för ökad livslängd hos infrastruktur¬konstruktioner. Licentiatavhandling, 1996. Bulletin 21. Karoumi, R., Dynamic Response of Cable-Stayed Bridges Subjected to Moving Vehicles. Licentiate Thesis, 1996. Bulletin 22. Hallgren, M., Punching Shear Capacity of Reinforced High Strength Concrete Slabs. Doctoral Thesis, 1996. Bulletin 23. Hellgren, M., Strength of Bolt-Channel and Screw-Groove Joints in Aluminium Extrusions. Licentiate Thesis, 1996. Bulletin 24. Yagi, T., Wind-induced Instabilities of Structures. Doctoral Thesis, 1997. Bulletin 25. Eriksson, A., and Sandberg, G., (editors), Engineering Structures and Extreme Events - proceedings from a symposium, May 1997. Bulletin 26. Paulsson, J., Effects of Repairs on the Remaining Life of Concrete Bridge Decks. Licentiate Thesis, 1997. Bulletin 27. Olsson, A., Object-oriented finite element algorithms. Licentiate Thesis, 1997. Bulletin 28. Yunhua, L., On Shear Locking in Finite Elements. Licentiate Thesis, 1997. Bulletin 29. Ekman, M., Sprickor i betongkonstruktioner och dess inverkan på beständigheten. Licentiate Thesis, 1997. Bulletin 30. Karawajczyk, E., Finite Element Approach to the Mechanics of Track-Deck Systems. Licentiate Thesis, 1997. Bulletin 31. Fransson, H., Rotation Capacity of Reinforced High Strength Concrete Beams. Licentiate Thesis, 1997. Bulletin 32. Edlund, S., Arbitrary Thin-Walled Cross Sections. Theory and Computer Implementation. Licentiate Thesis, 1997. Bulletin 33. Forsell, K., Dynamic analyses of static instability phenomena. Licentiate Thesis, 1997. Bulletin 34. Ikäheimonen, J., Construction Loads on Shores and Stability of Horizontal Formworks. Doctoral Thesis, 1997. Bulletin 35. Racutanu, G., Konstbyggnaders reella livslängd. Licentiatavhandling, 1997. Bulletin 36.
Appelqvist, I., Sammanbyggnad. Datastrukturer och utveckling av ett IT-stöd för byggprocessen. Licentiatavhandling, 1997. Bulletin 37. Alavizadeh-Farhang, A., Plain and Steel Fibre Reinforced Concrete Beams Subjected to Combined Mechanical and Thermal Loading. Licentiate Thesis, 1998. Bulletin 38. Eriksson, A. and Pacoste, C., (editors), Proceedings of the NSCM-11: Nordic Seminar on Computational Mechanics, October 1998. Bulletin 39. Luo, Y., On some Finite Element Formulations in Structural Mechanics. Doctoral Thesis, 1998. Bulletin 40. Troive, S., Structural LCC Design of Concrete Bridges. Doctoral Thesis, 1998. Bulletin 41. Tärno, I., Effects of Contour Ellipticity upon Structural Behaviour of Hyparform Suspended Roofs. Licentiate Thesis, 1998. Bulletin 42. Hassanzadeh, G., Betongplattor på pelare. Förstärkningsmetoder och dimensioneringsmetoder för plattor med icke vidhäftande spännarmering. Licentiatavhandling, 1998. Bulletin 43. Karoumi, R., Response of Cable-Stayed and Suspension Bridges to Moving Vehicles. Analysis methods and practical modeling techniques. Doctoral Thesis, 1998. Bulletin 44. Johnson, R., Progression of the Dynamic Properties of Large Suspension Bridges during Construction - A Case Study of the Höga Kusten Bridge. Licentiate Thesis, 1999. Bulletin 45. Tibert, G., Numerical Analyses of Cable Roof Structures. Licentiate Thesis, 1999. Bulletin 46. Ahlenius, E., Explosionslaster och infrastrukturkonstruktioner - Risker, värderingar och kostnader. Licentiatavhandling, 1999. Bulletin 47. Battini, J-M., Plastic instability of plane frames using a co-rotational approach. Licentiate Thesis, 1999. Bulletin 48. Ay, L., Using Steel Fiber Reinforced High Performance Concrete in the Industrialization of Bridge Structures. Licentiate Thesis, 1999. Bulletin 49. Paulsson-Tralla, J., Service Life of Repaired Concrete Bridge Decks. Doctoral Thesis, 1999. Bulletin 50. Billberg, P., Some rheology aspects on fine mortar part of concrete. Licentiate Thesis, 1999. Bulletin 51. Ansell, A., Dynamically Loaded Rock Reinforcement. Doctoral Thesis, 1999. Bulletin 52. Forsell, K., Instability analyses of structures under dynamic loads. Doctoral Thesis, 2000. Bulletin 53. Edlund, S., Buckling of T-Section Beam-Columns in Aluminium with or without Transverse Welds. Doctoral Thesis, 2000. Bulletin 54.
Löfsjögård, M., Functional Properties of Concrete Roads − General Interrelationships and Studies on Pavement Brightness and Sawcutting Times for Joints. Licentiate Thesis, 2000. Bulletin 55. Nilsson, U., Load bearing capacity of steel fibree reinforced shotcrete linings. Licentiate Thesis, 2000. Bulletin 56. Silfwerbrand, J. and Hassanzadeh, G., (editors), International Workshop on Punching Shear Capacity of RC Slabs − Proceedings. Dedicated to Professor Sven Kinnunen. Stockholm June 7-9, 2000. Bulletin 57. Wiberg, A., Strengthening and repair of structural concrete with advanced, cementitious composites. Licentiate Thesis, 2000. Bulletin 58. Racutanu, G., The Real Service Life of Swedish Road Bridges - A case study. Doctoral Thesis, 2000. Bulletin 59. Alavizadeh-Farhang, A., Concrete Structures Subjected to Combined Mechanical and Thermal Loading. Doctoral Thesis, 2000. Bulletin 60. Wäppling, M., Behaviour of Concrete Block Pavements - Field Tests and Surveys. Licentiate Thesis, 2000. Bulletin 61. Getachew, A., Trafiklaster på broar. Analys av insamlade och Monte Carlo genererade fordonsdata. Licentiatavhandling, 2000. Bulletin 62. James, G., Raising Allowable Axle Loads on Railway Bridges using Simulation and Field Data. Licentiate Thesis, 2001. Bulletin 63. Karawajczyk, E., Finite Elements Simulations of Integral Bridge Behaviour. Doctoral Thesis, 2001. Bulletin 64. Thöyrä, T., Strength of Slotted Steel Studs. Licentiate Thesis, 2001. Bulletin 65. Tranvik, P., Dynamic Behaviour under Wind Loading of a 90 m Steel Chimney. Licentiate Thesis, 2001. Bulletin 66. Ullman, R., Buckling of Aluminium Girders with Corrugated Webs. Licentiate Thesis, 2002. Bulletin 67. Getachew, A., Traffic Load Effects on Bridges. Statistical Analysis of Collected and Monte Carlo Simulated Vehicle Data. Doctoral Thesis, 2003. Bulletin 68. Quilligan, M., Bridge Weigh-in-Motion. Development of a 2-D Multi-Vehicle Algorithm. Licentiate Thesis, 2003. Bulletin 69. James, G., Analysis of Traffic Load Effects on Railway Bridges. Doctoral Thesis 2003. Bulletin 70. Nilsson, U., Structural behaviour of fibre reinforced sprayed concrete anchored in rock. Doctoral Thesis 2003. Bulletin 71. Wiberg, A., Strengthening of Concrete Beams Using Cementitious Carbon Fibre Composites. Doctoral Thesis 2003. Bulletin 72.
Löfsjögård, M., Functional Properties of Concrete Roads – Development of an Optimisation Model and Studies on Road Lighting Design and Joint Performance. Doctoral Thesis 2003. Bulletin 73. Bayoglu-Flener, E., Soil-Structure Interaction for Integral Bridges and Culverts. Licentiate Thesis 2004. Bulletin 74. Lutfi, A., Steel Fibrous Cement Based Composites. Part one: Material and mechanical properties. Part two: Behaviour in the anchorage zones of prestressed bridges. Doctoral Thesis 2004. Bulletin 75. Johansson, U., Fatigue Tests and Analysis of Reinforced Concrete Bridge Deck Models. Licentiate Thesis 2004. Bulletin 76. Roth, T., Langzeitverhalten von Spannstählen in Betonkonstruktionen. Licentitate Thesis 2004. Bulletin 77. Hedebratt, J., Integrerad projektering och produktion av industrigolv – Metoder för att förbättra kvaliteten. Licentiatavhandling, 2004. Bulletin 78. Österberg, E., Revealing of age-related deterioration of prestressed reinforced concrete containments in nuclear power plants – Requirements and NDT methods. Licentiate Thesis 2004. Bulletin 79. Broms, C.E., Concrete flat slabs and footings New design method for punching and detailing for ductility. Doctoral Thesis 2005. Bulletin 80. Wiberg, J., Bridge Monitoring to Allow for Reliable Dynamic FE Modelling - A Case Study of the New Årsta Railway Bridge. Licentiate Thesis 2006. Bulletin 81. Mattsson, H-Å., Funktionsentreprenad Brounderhåll – En pilotstudie i Uppsala län. Licentiate Thesis 2006. Bulletin 82. Masanja, D. P, Foam concrete as a structural material. Doctoral Thesis 2006. Bulletin 83. Johansson, A., Impregnation of Concrete Structures – Transportation and Fixation of Moisture in Water Repellent Treated Concrete. Licentiate Thesis 2006. Bulletin 84. Billberg, P., Form Pressure Generated by Self-Compacting Concrete – Influence of Thixotropy and Structural Behaviour at Rest. Doctoral Thesis 2006. Bulletin 85. Enckell, M., Structural Health Monitoring using Modern Sensor Technology – Long-term Monitoring of the New Årsta Railway Bridge. Licentiate Thesis 2006. Bulletin 86. Söderqvist, J., Design of Concrete Pavements – Design Criteria for Plain and Lean Concrete. Licentiate Thesis 2006. Bulletin 87. Malm, R., Shear cracks in concrete structures subjected to in-plane stresses. Licentiate Thesis 2006. Bulletin 88.
Skoglund, P., Chloride Transport and Reinforcement Corrosion in the Vicinity of the Transition Zone between Substrate and Repair Concrete. Licentiate Thesis 2006. Bulletin 89. Liljencrantz, A., Monitoring railway traffic loads using Bridge Weight-in-Motion. Licentiate Thesis 2007. Bulletin 90. Stenbeck, T., Promoting Innovation in Transportation Infrastructure Maintenance – Incentives, Contracting and Performance-Based Specifications. Doctoral Thesis 2007. Bulletin 91 Magnusson, J., Structural Concrete Elements Subjected to Air Blast Loading. Licentiate Thesis 2007. Bulletin 92. Pettersson, L., G., Full Scale Tests and Structural Evaluation of Soil Steel Flexible Culverts with low Height of Cover. Doctoral Thesis 2007. Bulletin 93 Westerberg, B., Time-dependent effects in the analysis and design of slender concrete compression members. Doctoral Thesis 2008. Bulletin 94 Mattsson, H-Å, Integrated Bridge Maintenance. Evaluation of a pilot project and future perspectives. Doctoral Thesis 2008. Bulletin 95 Andersson, A., Utmattningsanalys av järnvägsbroar. En fallstudie av stålbroarna mellan Stockholm Central och Söder Mälarstrand, baserat på teoretiska analyser och töjningsmätningar. Licentiate Thesis 2009. Bulletin 96 Malm, R., Predicting shear type crack initiation and growth in concrete with non-linear finite element method. Doctoral Thesis 2009. Bulletin 97 Bayoglu Flener, E., Static and dynamic behavior of soil-steel composite bridges obtained by field testing. Doctoral Thesis 2009. Bulletin 98 Gram, A., Numerical Modelling of Self-Compacting Concrete Flow Licentiate Thesis 2009. Bulletin 99 Wiberg, J., Railway bridge response to passing trains. Measurements and FE model updating. Doctoral Thesis 2009. Bulletin 100 Athuman M.K. Ngoma, Characterisation and Consolidation of Historical Lime Mortars in Cultural Heritage Buildings and Associated Structures in East Africa. Doctoral Thesis 2009. Bulletin 101 Ülker-Kaustell, M., Some aspects of the dynamic soil-structure interaction of a portal frame railway bridge. Licentiate Thesis 2009. Bulletin 102 The bulletins enumerated above, with the exception for those which are out of print, may be purchased from the Department of Civil and Architectural Engineering, The Royal Institute of Technology, SE-100 44 Stockholm, Sweden. The department also publishes other series. For full information see our homepage http://www.byv.kth.se