


Languages
Pages
Legal


WATER QUALITY WATER QUALITY PREDICTIONS AT PREDICTIONS AT HARDROCK MINE SITES: HARDROCK MINE SITES: METHODS, MODELS, AND METHODS, MODELS, AND CASE STUDY COMPARISONCASE STUDY COMPARISON
James Kuipers, Kuipers & James Kuipers, Kuipers & AssocAssoc
Ann Maest, Buka Ann Maest, Buka EnvironmentalEnvironmental

Study ApproachStudy Approach
Synthesize existing reviews Synthesize existing reviews Develop “toolboxes” Develop “toolboxes” Evaluate methods and modelsEvaluate methods and models Recommendations for improvementRecommendations for improvement Outside peer review (Logsdon, Outside peer review (Logsdon,
Nordstrom, Lapakko)Nordstrom, Lapakko) Case studiesCase studies
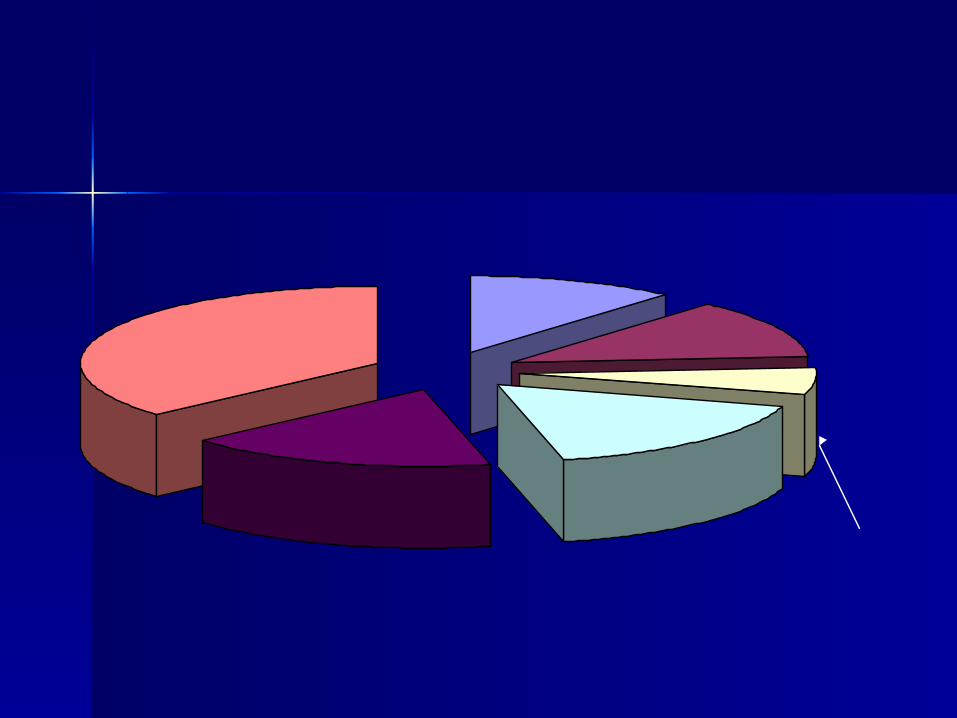
None11%
Static Only13%
Short-term leach only, 6%
Static+short-termleach, 17%
Static+kinetic17%
Static+short-termleach+kinetic, 17%
N=71
Percent of NEPA Mine Conducting Different Types of Geochemical Characterization at NEPA Mines
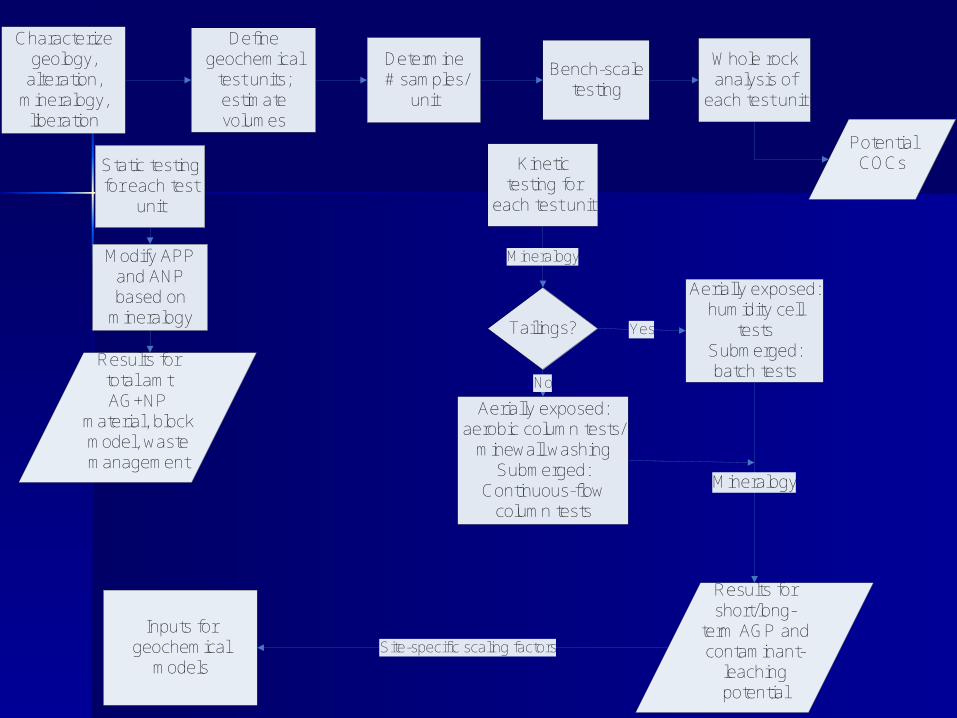
Characterize geology,
alteration, mineralogy,
liberation
Define geochemical
test units; estimate volumes
Determine # samples/
unit
Bench-scale testing
Whole rock analysis of
each test unit
Static testing for each test
unit
Modify APP and ANP based on
mineralogyTailings?
Mineralogy
Yes
Aerially exposed: humidity cell
testsSubmerged: batch tests
Aerially exposed: aerobic column tests/
minewall washingSubmerged:
Continuous-flow column tests
Site-specific scaling factors
Kinetic testing for
each test unit
No
Mineralogy
Results for total amt AG+NP
material, block model, waste management
Potential COCs
Results for short/long-
term AGP and contaminant-
leaching potential
Inputs for geochemical
models

None44%
Water Quantity25%
Water Quality1%
Water Quantity+Quality30%
N=71
Percent of NEPA Mines Using General Types of Predictive Models
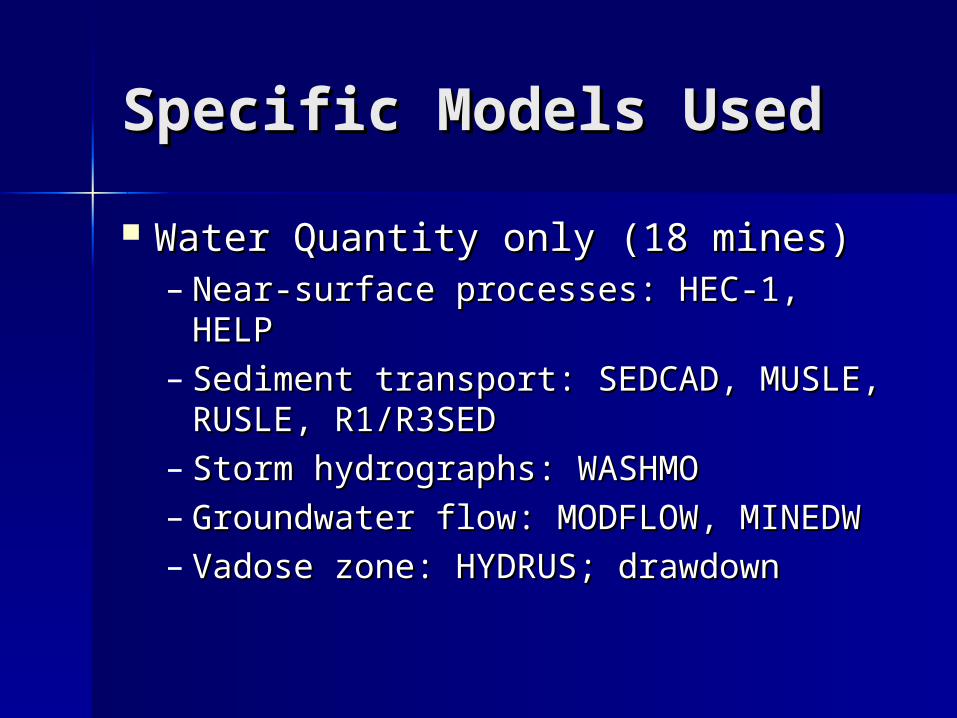
Specific Models UsedSpecific Models Used
Water Quantity only (18 mines)Water Quantity only (18 mines)– Near-surface processes: HEC-1, HELPNear-surface processes: HEC-1, HELP– Sediment transport: SEDCAD, Sediment transport: SEDCAD,
MUSLE, RUSLE, R1/R3SEDMUSLE, RUSLE, R1/R3SED– Storm hydrographs: WASHMOStorm hydrographs: WASHMO– Groundwater flow: MODFLOW, Groundwater flow: MODFLOW,
MINEDWMINEDW– Vadose zone: HYDRUS; drawdownVadose zone: HYDRUS; drawdown

Specific Models Used Specific Models Used (cont.)(cont.)
Water quantity and quality (21 mines)Water quantity and quality (21 mines)– Water quantity + PHREEQE (3), WATEQ Water quantity + PHREEQE (3), WATEQ
(1), MINTEQ (5)(1), MINTEQ (5)– Pyrite oxidation (PYROX) – 3 minesPyrite oxidation (PYROX) – 3 mines– Water balance/contam transport (LEACHM) Water balance/contam transport (LEACHM)
– 1 mine– 1 mine– Pit water flow and quality (limited): CE-Pit water flow and quality (limited): CE-
QUAL-W2 (3), CE-QUAL-R1 (1)QUAL-W2 (3), CE-QUAL-R1 (1)– Mass balance/loading: unspecified (4 Mass balance/loading: unspecified (4
mines), FLOWPATHmines), FLOWPATH– Proprietary codes for pit lake water quality Proprietary codes for pit lake water quality
or groundwater quality downgradient of or groundwater quality downgradient of waste rock pile (4 mines)waste rock pile (4 mines)
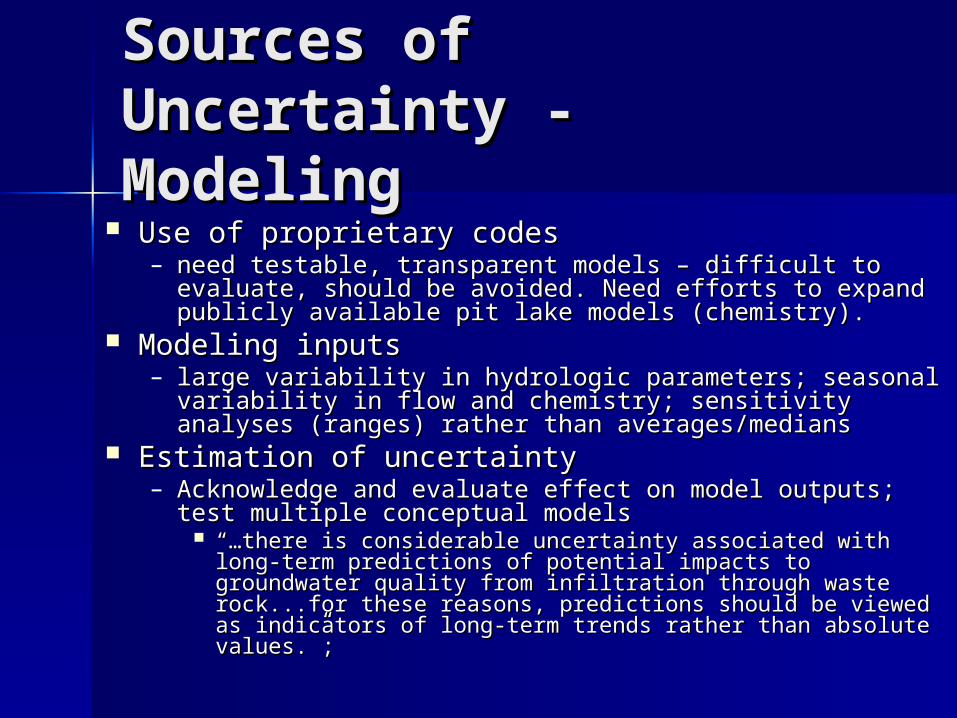
Sources of Uncertainty Sources of Uncertainty - Modeling- Modeling
Use of proprietary codesUse of proprietary codes– need testable, transparent models – difficult to evaluate, need testable, transparent models – difficult to evaluate,
should be avoided. Need efforts to expand publicly should be avoided. Need efforts to expand publicly available pit lake models (chemistry).available pit lake models (chemistry).
Modeling inputsModeling inputs– large variability in hydrologic parameters; seasonal large variability in hydrologic parameters; seasonal
variability in flow and chemistry; sensitivity analyses variability in flow and chemistry; sensitivity analyses (ranges) rather than averages/medians(ranges) rather than averages/medians
Estimation of uncertaintyEstimation of uncertainty– Acknowledge and evaluate effect on model outputs; test Acknowledge and evaluate effect on model outputs; test
multiple conceptual modelsmultiple conceptual models “…“…there is considerable uncertainty associated with long-there is considerable uncertainty associated with long-
term predictions of potential impacts to groundwater term predictions of potential impacts to groundwater quality from infiltration through waste rock...for these quality from infiltration through waste rock...for these reasons, predictions should be viewed as indicators of long-reasons, predictions should be viewed as indicators of long-term trends rather than absolute values.”;term trends rather than absolute values.”;
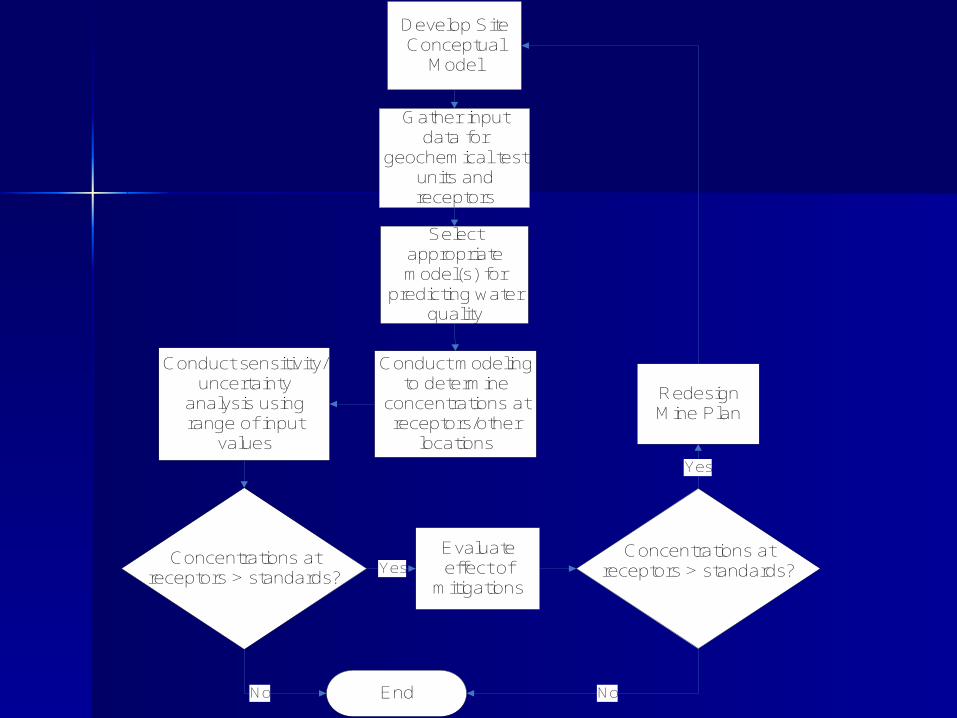
Develop Site Conceptual
Model
Gather input data for
geochemical test units and receptors
Select appropriate model(s) for
predicting water quality
Conduct modeling to determine
concentrations at receptors/other
locations
Conduct sensitivity/uncertainty
analysis using range of input
values
Evaluate effect of
mitigations
Concentrations at receptors > standards?
Yes
EndNo
Concentrations at receptors > standards?
No
Redesign Mine Plan
Yes
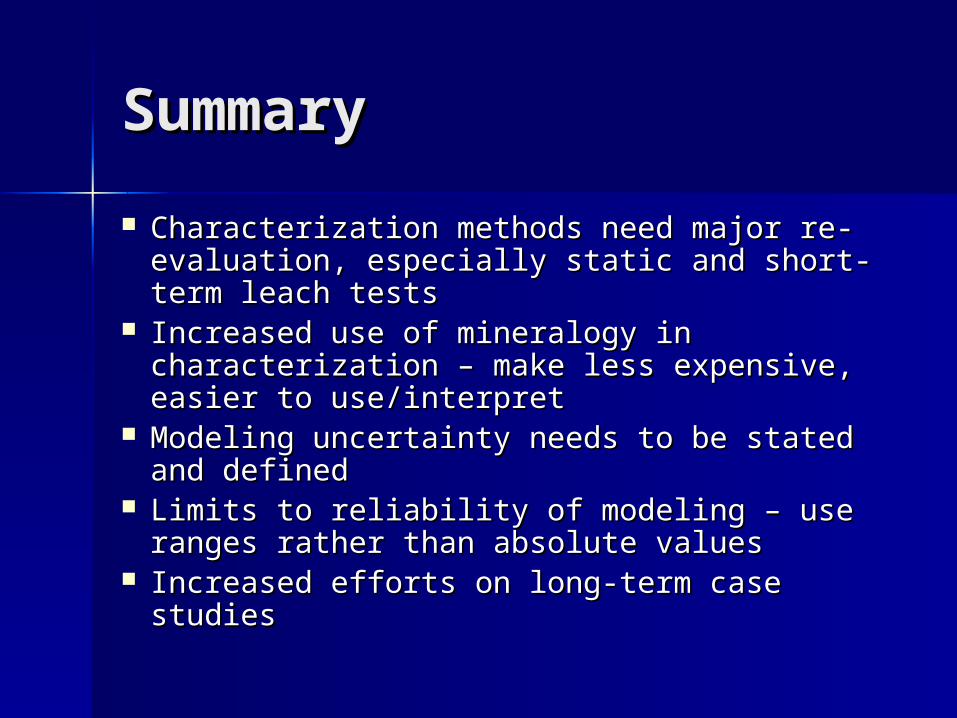
SummarySummary
Characterization methods need major re-Characterization methods need major re-evaluation, especially static and short-term evaluation, especially static and short-term leach testsleach tests
Increased use of mineralogy in Increased use of mineralogy in characterization – make less expensive, characterization – make less expensive, easier to use/interpreteasier to use/interpret
Modeling uncertainty needs to be stated Modeling uncertainty needs to be stated and definedand defined
Limits to reliability of modeling – use Limits to reliability of modeling – use ranges rather than absolute valuesranges rather than absolute values
Increased efforts on long-term case studiesIncreased efforts on long-term case studies

Comparison of Comparison of Predicted and Actual Predicted and Actual Water QualityWater Quality

EIS ReviewEIS Review
MinesMines– 183 major, 137 NEPA, 71 NEPA reviewed183 major, 137 NEPA, 71 NEPA reviewed
Similar in location, commodities, Similar in location, commodities, extraction, processing, operational extraction, processing, operational statusstatus
104 EISs reviewed for 71 mines104 EISs reviewed for 71 mines– 16 months to obtain all documents16 months to obtain all documents
Compared EIS predictions to actual Compared EIS predictions to actual water quality for 25 case study mineswater quality for 25 case study mines

EIS YearsEIS Years
Distribution of EIS's Reviewed, by Year
0
2
4
6
8
10
12
1975 1980 1985 1990 1995 2000 2005
# E
ISs
Re
vie
we
d
All EISs Reviewed
Case Study EISs

EIS Approach to ImpactsEIS Approach to Impacts
Potential Water Quality
GeochemicalInformation
EngineeringDesign
Hydrologic/ClimaticInformation
Mitigation
Measures
Predicted Water Quality
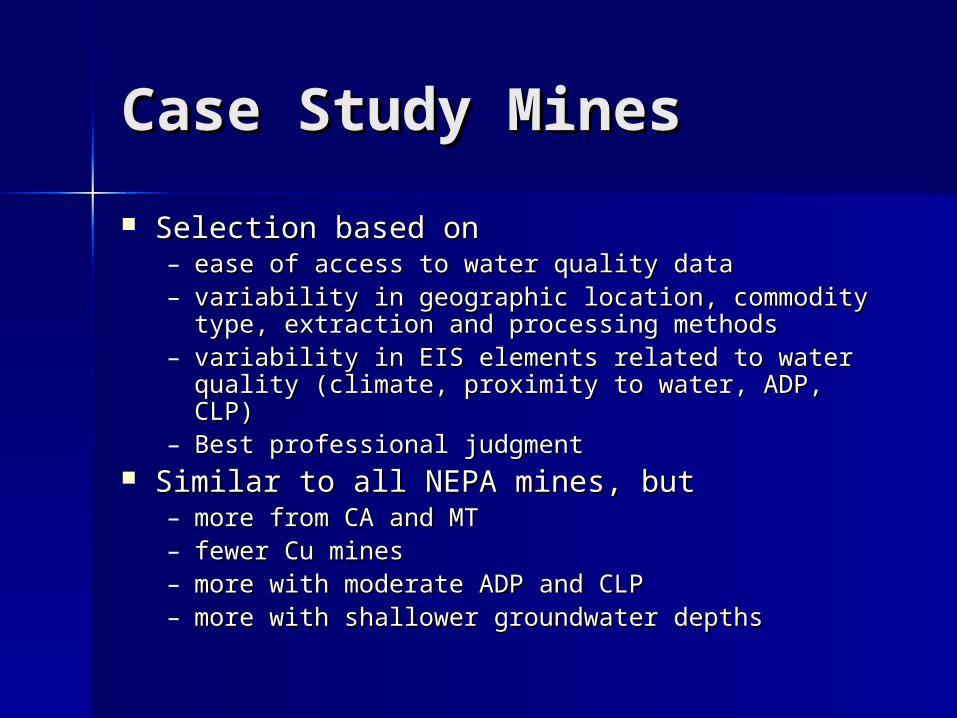
Case Study MinesCase Study Mines
Selection based onSelection based on– ease of access to water quality dataease of access to water quality data– variability in geographic location, commodity type, variability in geographic location, commodity type,
extraction and processing methodsextraction and processing methods– variability in EIS elements related to water quality variability in EIS elements related to water quality
(climate, proximity to water, ADP, CLP)(climate, proximity to water, ADP, CLP)– Best professional judgmentBest professional judgment
Similar to all NEPA mines, butSimilar to all NEPA mines, but– more from CA and MTmore from CA and MT– fewer Cu minesfewer Cu mines– more with moderate ADP and CLPmore with moderate ADP and CLP– more with shallower groundwater depthsmore with shallower groundwater depths

Case Study Mines: Case Study Mines: GeneralGeneral StatesStates
– AK: 1AK: 1 - MT: 6- MT: 6– AZ: 2AZ: 2 - NV: 7- NV: 7– CA: 6CA: 6 - WI: 1- WI: 1– ID: 2ID: 2
CommodityCommodity– Au/Ag: 20 - Pb/Zn: Au/Ag: 20 - Pb/Zn:
11– Cu/Mo: 2 - PGM: 1Cu/Mo: 2 - PGM: 1– Mo: 1Mo: 1
Extraction typeExtraction type– open pit: 19open pit: 19– underground: 4underground: 4– both: 2both: 2
Processing typeProcessing type– CN Heap: 12CN Heap: 12– Vat: 4Vat: 4– Flotation: 7Flotation: 7– Dump Leach: 2Dump Leach: 2
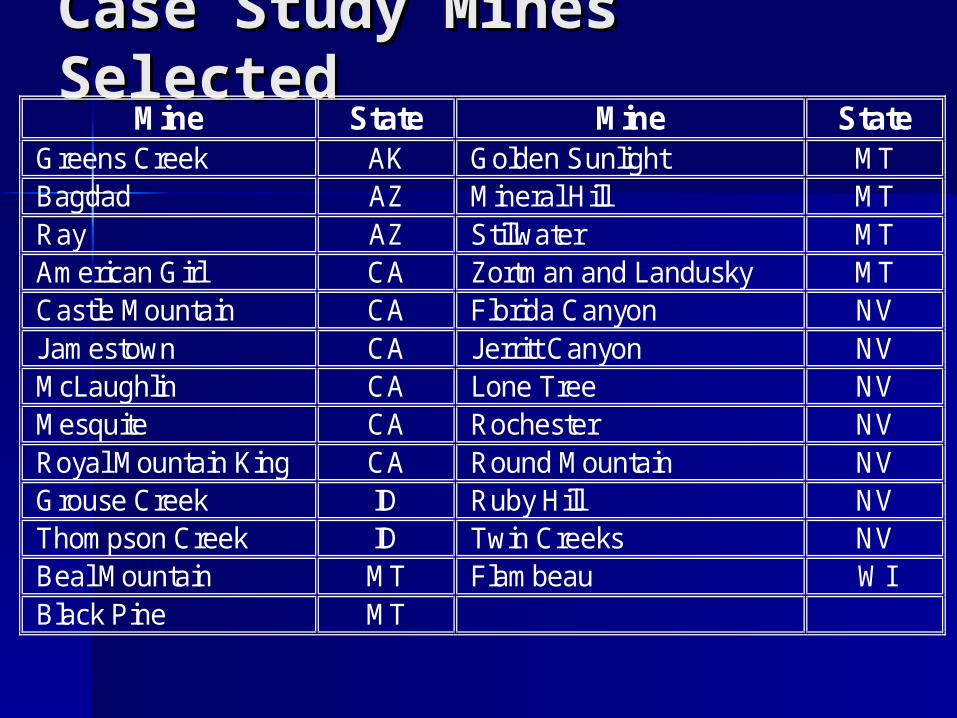
Case Study Mines Case Study Mines SelectedSelected
Mine State Mine State Greens Creek AK Golden Sunlight MT Bagdad AZ Mineral Hill MT Ray AZ Stillwater MT American Girl CA Zortman and Landusky MT Castle Mountain CA Florida Canyon NV Jamestown CA Jerritt Canyon NV McLaughlin CA Lone Tree NV Mesquite CA Rochester NV Royal Mountain King CA Round Mountain NV Grouse Creek ID Ruby Hill NV Thompson Creek ID Twin Creeks NV Beal Mountain MT Flambeau WI Black Pine MT

Comparison ResultsComparison Results
Mines with mining-related surface water Mines with mining-related surface water exceedences: 60%exceedences: 60%– % estimating low impacts pre-mitigation: 27%% estimating low impacts pre-mitigation: 27%– % estimating low impacts with mitigation: 73%% estimating low impacts with mitigation: 73%
Mines with mining-related groundwater Mines with mining-related groundwater exceedences: 52%exceedences: 52%– % estimating low impacts pre-mitigation: 15%% estimating low impacts pre-mitigation: 15%– % estimating low impacts with mitigation: 77%% estimating low impacts with mitigation: 77%
Mines with acid drainage on site: 36%Mines with acid drainage on site: 36%– % predicting low acid drainage potential: 89%% predicting low acid drainage potential: 89%

Inherent FactorsInherent Factors
ore type and associationore type and association climateclimate proximity to water resourcesproximity to water resources pre-existing water qualitypre-existing water quality constituents of concernconstituents of concern acid generation and neutralization acid generation and neutralization
potentialspotentials contaminant leaching potentialcontaminant leaching potential

Surface Water ResultsSurface Water Results
# Mines
Percent (%) with Impact to Surface Water
Percent (%) with Exceedences of Standards in Surface Water
Percent (%) with Exceedences that Predicted no Exceedences
Mines close to surface water with mod/high ADP or CLP
13 92
(12/13) 85
(11/13) 91
(10/11)
All case study mines 25 64
(16/25) 60
(15/25) 73
(11/15)

Groundwater ResultsGroundwater Results
# Mines
Percent (%) with Impact to Groundwater
Percent (%) with Exceedences of Standards in Groundwater
Percent (%) with Exceedences that Predicted no Exceedences
Mines close to groundwater with mod/high ADP or CLP
15 93
(14/15) 93
(14/15) 86
(12/14)
All case study mines 25
68 (17/25)
68 (17/25)
77 (13/17)
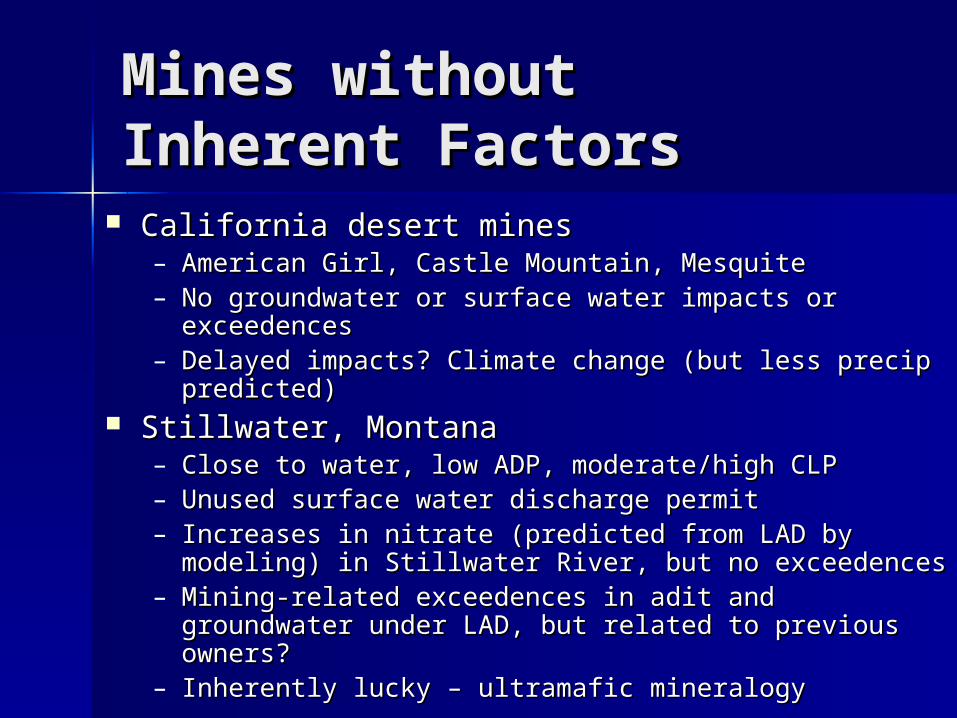
Mines without Mines without Inherent FactorsInherent Factors
California desert minesCalifornia desert mines– American Girl, Castle Mountain, MesquiteAmerican Girl, Castle Mountain, Mesquite– No groundwater or surface water impacts or No groundwater or surface water impacts or
exceedencesexceedences– Delayed impacts? Climate change (but less precip Delayed impacts? Climate change (but less precip
predicted)predicted) Stillwater, MontanaStillwater, Montana
– Close to water, low ADP, moderate/high CLPClose to water, low ADP, moderate/high CLP– Unused surface water discharge permitUnused surface water discharge permit– Increases in nitrate (predicted from LAD by modeling) in Increases in nitrate (predicted from LAD by modeling) in
Stillwater River, but no exceedencesStillwater River, but no exceedences– Mining-related exceedences in adit and groundwater Mining-related exceedences in adit and groundwater
under LAD, but related to previous owners?under LAD, but related to previous owners?– Inherently lucky – ultramafic mineralogyInherently lucky – ultramafic mineralogy
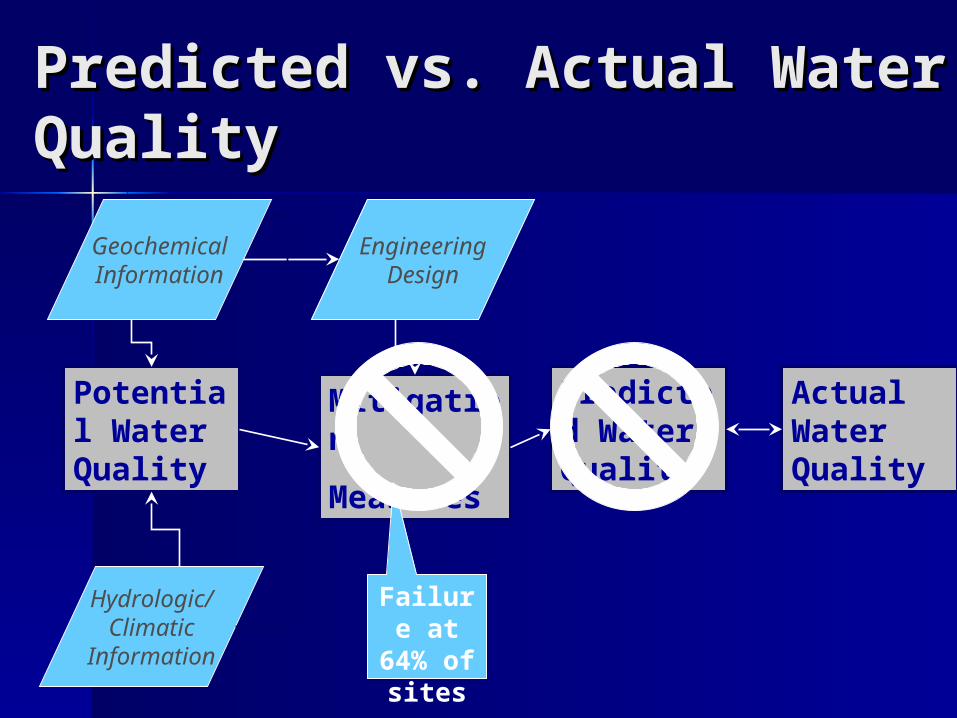
Predicted vs. Actual Water Predicted vs. Actual Water QualityQuality
Potential Water Quality
GeochemicalInformation
EngineeringDesign
Hydrologic/ClimaticInformation
Mitigation
Measures
Predicted Water Quality
Actual Water Quality
Failure at 64% of sites
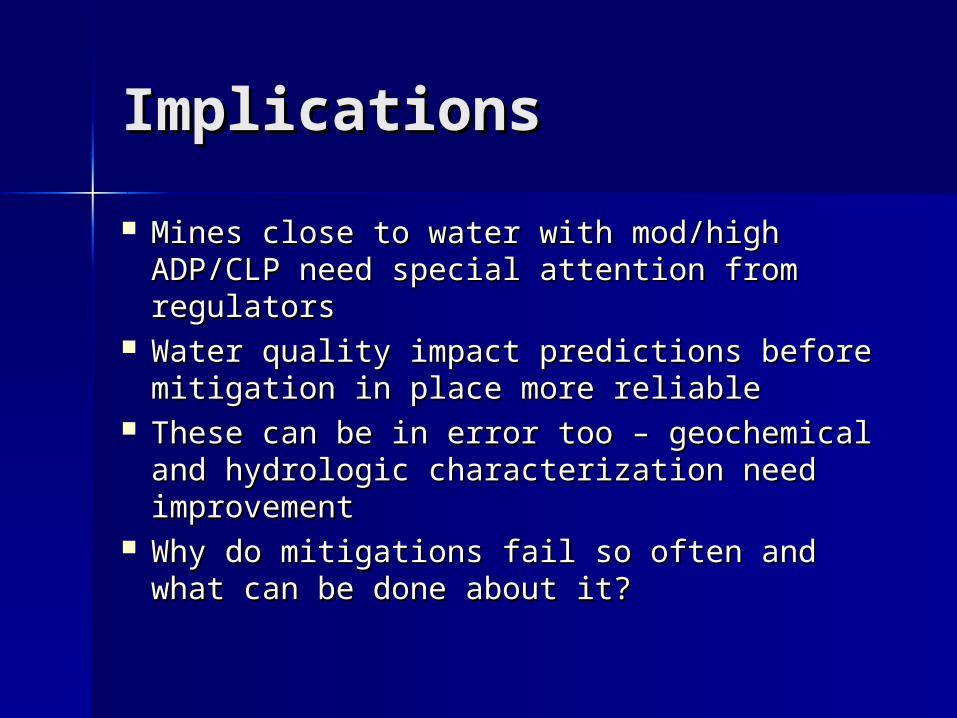
ImplicationsImplications
Mines close to water with mod/high Mines close to water with mod/high ADP/CLP need special attention from ADP/CLP need special attention from regulatorsregulators
Water quality impact predictions before Water quality impact predictions before mitigation in place more reliablemitigation in place more reliable
These can be in error too – geochemical These can be in error too – geochemical and hydrologic characterization need and hydrologic characterization need improvementimprovement
Why do mitigations fail so often and what Why do mitigations fail so often and what can be done about it?can be done about it?

Characterization Characterization MethodsMethods GeologyGeology MineralogyMineralogy Whole rock Whole rock
analysisanalysis Paste pHPaste pH Sulfur analysisSulfur analysis Total inorganic Total inorganic
carboncarbon
Static testingStatic testing Short-term leach Short-term leach
testingtesting Laboratory Laboratory
kinetic testskinetic tests Field testing of Field testing of
mined materialsmined materials

Modeling Modeling OpportunitiesOpportunities
water table(approximate)
Pit Outline
Waste Rock PileHeap/Dump Leach Pile
Precipitation
Evapotranspiration Precipitation
EvapotranspirationInfiltration
Runoff
Vadose Zone/Geochemical Models
Groundwater Flow and Geochemical Speciation/ Reaction Path Models
Limnologic ModelsGeochemical Speciation/Reaction Path Models
Stream/RiverModels
Precipitation
Evapotranspiration
Near SurfaceHydrologic Models
Sediment GenerationModels
Pyrite Oxidation andGeochemical Speciation/Reaction Path Models

Modeling ToolboxModeling Toolbox
Category/subcategory of codeCategory/subcategory of code– Hydrogeologic, geochemical, unit-specificHydrogeologic, geochemical, unit-specific
Available codesAvailable codes Special characteristics of codesSpecial characteristics of codes Inputs requiredInputs required Modeled processes/outputsModeled processes/outputs Step-by-step procedures for modeling Step-by-step procedures for modeling
water quality at mine facilitieswater quality at mine facilities

EIS Information EIS Information ReviewedReviewed
Geology/Geology/mineralogymineralogy
ClimateClimate HydrologyHydrology Field/lab testsField/lab tests Predictive models Predictive models
usedused
Water quality Water quality impact impact potentialpotential
Mitigation Mitigation measuresmeasures
Predicted water Predicted water quality impactsquality impacts
Discharge Discharge informationinformation

Surface Water Surface Water ExamplesExamples Flambeau, WI had inherent factors Flambeau, WI had inherent factors
but no impact or exceedence to datebut no impact or exceedence to date Stillwater, MT had an impact (0.7 Stillwater, MT had an impact (0.7
mg/l nitrate in Stillwater River) but no mg/l nitrate in Stillwater River) but no exceedenceexceedence
McLaughlin, CA predicted McLaughlin, CA predicted exceedences in surface water and exceedences in surface water and was correctwas correct

Groundwater ExamplesGroundwater Examples Lone Tree, NV had inherent factors Lone Tree, NV had inherent factors
but no mining-related impact or but no mining-related impact or exceedenceexceedence– baseline issuebaseline issue
McLaughlin, CA had inherent factors McLaughlin, CA had inherent factors and did have exceedencesand did have exceedences– regulatory exclusion for groundwater regulatory exclusion for groundwater
(poor quality, low K), so no violations(poor quality, low K), so no violations– 92% of rocks not acid generating92% of rocks not acid generating– Tailings leachate flunked STLC – Tailings leachate flunked STLC –
hazardous aquiferhazardous aquifer

McLaughlin Mine, CA: Waste McLaughlin Mine, CA: Waste Rock Monitoring WellRock Monitoring Well
WQMP LOCATION S-06
SULFATE VERSUS TIME
0
1000
2000
3000
4000
5000
6000
Feb-82 Nov-84 Aug-87 May-90 Jan-93 Oct-95 Jul-98 Apr-01 Jan-04
SAMPLE COLLECTION DATE
CO
NC
EN
TR
AT
ION
(m
g/l)
Total
WQMP LOCATION S-06
ZINC VERSUS TIME
0.00
0.20
0.40
0.60
0.80
1.00
1.20
1.40
1.60
1.80
Feb-82 Nov-84 Aug-87 May-90 Jan-93 Oct-95 Jul-98 Apr-01 Jan-04
SAMPLE COLLECTION DATEC
ON
CE
NT
RA
TIO
N (
mg/
l)
Total

Case Study Mines: Water Case Study Mines: Water QualityQuality ClimateClimate
– Dry/Semi-Arid: 12 Dry/Semi-Arid: 12 – Marine West Coast: 1Marine West Coast: 1– Humid subtropical: 3Humid subtropical: 3– Boreal: 8Boreal: 8– Continental: 1Continental: 1
Perennial streamsPerennial streams– No info: 1No info: 1– >1 mi: 6>1 mi: 6– <1 mi: 7<1 mi: 7– On site: 11On site: 11
Groundwater depthGroundwater depth– No info: 1No info: 1– >200’: 3>200’: 3– 50-200’: 450-200’: 4– 0-50’/springs: 170-50’/springs: 17
Acid drainage potentialAcid drainage potential– No info: 2No info: 2– Low: 12Low: 12– Moderate: 8Moderate: 8– High: 3High: 3
Contaminant leachingContaminant leaching– No info: 3No info: 3– Low: 8Low: 8– Moderate: 10Moderate: 10– High: 4High: 4

Failure Modes and Effects Failure Modes and Effects AnalysisAnalysis
Table 8.2 Failure Analysis Spreadsheet – NEPA/EIS Case Studies Water Quality at Hardrock Mine Sites
Failure Mode Effects Consequences Examples Dilution overestimated Surface water impacted in smaller upper
watershed streams M Greens Creek, Jerritt Canyon
Presence of water from springs or lateral flow not recognized
Ground and surface water impacts from contact with contaminant source
H Black Pine, Mineral Hill, Royal Mountain King
M Mineral Hill
Hydrological Characterization
Amount of water underestimated
Load of contamination exceeds surface water discharge standards H Ray, Zortman and Landusky
M Greens Creek, Jamestown, McLaughlin, Royal Mountain King, Thompson Creek, Jerritt Canyon
H Grouse Creek, Beal Mountain, Black Pine
Geochemical Characterization
Sample representation, testing methods or interpretations inadequate
potential for acid drainage and other contaminants not recognized leading to failure to identify need for or type of mitigation
S Golden Sunlight, Zortman and Landusky
M Greens Creek, Jamestown, Thompson Creek, Jerritt Canyon
Mitigation Not identified identified, inadequate or not installed
inadequate mitigation identified to prevent impacts to water resources
H Bagdad, Grouse Creek, Beal Mountain, Black Pine, Zortman and Landusky
Waste rock mixing and segregation not effective
leachate contains acid drainage and other contaminants
M Greens Creek, McLaughlin, Jerritt Canyon
L Stillwater, Florida Canyon, Lone Tree, Rochester, Twin Creeks
M Jamestown, Royal Mountain King, Jerritt Canyon, Mineral Hill
H Bagdad
Mitigation
Liner leak, embankment failure or tailings spill
greater than design (e.g. exceedances) impacts to water resources
S Golden Sunlight

Failure Modes and Effects Failure Modes and Effects AnalysisAnalysisHydrological Characterization Failures:Hydrological Characterization Failures: 7 of 22 mines exhibited inadequacies in 7 of 22 mines exhibited inadequacies in
hydrologic characterizationhydrologic characterization– At 2 mines dilution was overestimatedAt 2 mines dilution was overestimated– At 2 mines the presence of surface At 2 mines the presence of surface
water from springs or lateral flow of water from springs or lateral flow of near surface groundwater was not near surface groundwater was not detected detected
– At 3 mines the amount of water At 3 mines the amount of water generated was underestimated generated was underestimated

Failure Modes and Effects Failure Modes and Effects AnalysisAnalysis
Geochemical Characterization Failures:Geochemical Characterization Failures: 11 of 22 mines exhibited inadequacies in 11 of 22 mines exhibited inadequacies in
geochemical characterization geochemical characterization – Geochemical failures resulted from:Geochemical failures resulted from:
Assumptions made about geochemical nature of ore Assumptions made about geochemical nature of ore deposits and surrounding areas deposits and surrounding areas
Site analogs inappropriately applied to new proposal Site analogs inappropriately applied to new proposal Inadequate sampling Inadequate sampling Failure to conduct and have results for long-term Failure to conduct and have results for long-term
contaminant leaching and acid drainage testing contaminant leaching and acid drainage testing procedures before mining begins.procedures before mining begins.
Failure to conduct the proper tests, or to improperly Failure to conduct the proper tests, or to improperly interpret test results, or to apply the proper modelsinterpret test results, or to apply the proper models

Failure Modes and Effects Failure Modes and Effects AnalysisAnalysisMitigation Failures:Mitigation Failures: 18 of 22 mines exhibited failures in 18 of 22 mines exhibited failures in
mitigation measuresmitigation measures– At 9 of the mines mitigation was not At 9 of the mines mitigation was not
identified, inadequate or not installed identified, inadequate or not installed – At 3 of the mines waste rock mixing and At 3 of the mines waste rock mixing and
segregation was not effective segregation was not effective – At 11 of the mines liner leaks, At 11 of the mines liner leaks,
embankment failures or tailings spills embankment failures or tailings spills resulted in impacts to water resourcesresulted in impacts to water resources

Failure Modes Root Failure Modes Root CausesCauses Hydrologic Hydrologic Characterization Characterization Failures most often caused by:Failures most often caused by:
– Over-estimation of dilution effectsOver-estimation of dilution effects– Failure to recognize hydrological featuresFailure to recognize hydrological features– Underestimation of water production quantitiesUnderestimation of water production quantities
Prediction of storm events or deficiencies in Prediction of storm events or deficiencies in stormwater design criteria is the most stormwater design criteria is the most typical root cause of hydrologic typical root cause of hydrologic characterization failurescharacterization failures

Failure Modes Root Failure Modes Root CausesCauses Geochemical Geochemical CharacterizationCharacterization Root causes of Geochemical Prediction Root causes of Geochemical Prediction
Failures include:Failures include:– Sample representationSample representation– Testing methodsTesting methods– Modeling/InterpretationModeling/Interpretation
Geochemical Characterization Failures can Geochemical Characterization Failures can be addressed by:be addressed by:– Ensuring sample representationEnsuring sample representation– Adequate testingAdequate testing– InterpretationInterpretation

Failure Modes Root Failure Modes Root CausesCausesMitigationMitigation
Hydrologic and geochemical Hydrologic and geochemical characterization failures are the most characterization failures are the most common root cause of mitigation not common root cause of mitigation not being identified, inadequate or not being identified, inadequate or not installedinstalled– Most common assumption is that “oxide” will Most common assumption is that “oxide” will
not result in acid generationnot result in acid generation– Mitigations are often based on what is common Mitigations are often based on what is common
rather than on site specific characterizationrather than on site specific characterization

Failure Modes Root Failure Modes Root CausesCausesMitigationMitigation Waste rock mixing and segregation Waste rock mixing and segregation
not effectivenot effective– In most cases, no real data is available In most cases, no real data is available
(e.g. tons of NAG versus tons of PAG (e.g. tons of NAG versus tons of PAG and overall ABA accounting)and overall ABA accounting)
– Failures typically caused by:Failures typically caused by: Inadequate neutral materialInadequate neutral material Inability to effectively isolate acid Inability to effectively isolate acid
generating material from nearby water generating material from nearby water resourcesresources

Failure Modes Root Failure Modes Root CausesCausesMitigationMitigation Liner leak, embankment failure or Liner leak, embankment failure or
tailings spilltailings spill– Mitigation frequently fails to perform Mitigation frequently fails to perform
and can lead to groundwater and and can lead to groundwater and surface water quality impactssurface water quality impacts
– Failures are typically caused by:Failures are typically caused by: Design mistakesDesign mistakes Construction mistakesConstruction mistakes Operational mistakesOperational mistakes

Failure Modes Root Failure Modes Root CausesCausesRecommendationsRecommendations A more systematic and complete effort A more systematic and complete effort
should be undertaken when collecting datashould be undertaken when collecting data Recognize the importance of thorough Recognize the importance of thorough
hydrological and geochemical hydrological and geochemical characterizationcharacterization
Utilize information in a conservative Utilize information in a conservative manner to identify and utilize mitigation manner to identify and utilize mitigation measuresmeasures
Consider the likelihood and consequences Consider the likelihood and consequences of mitigation failuresof mitigation failures
Top Related