Mine Dewatering and Water Management at Barrick Goldstrike Mine in the Carlin Trend, Nevada Johnny...
29
Mine Dewatering and Water Management at Barrick Goldstrike Mine in the Carlin Trend, Nevada Johnny Zhan, Ph.D. Presented at U.S. EPA Hardrock Mining Conference 2012 Denver, CO, USA, April 3-5, 2012
-
Upload
calista-kayton -
Category
Documents
-
view
242 -
download
1
Transcript of Mine Dewatering and Water Management at Barrick Goldstrike Mine in the Carlin Trend, Nevada Johnny...
Mine Dewatering and Water Management at Barrick Goldstrike Mine in the Carlin Trend, Nevada
Johnny Zhan, Ph.D.
Presented at U.S. EPA Hardrock Mining Conference 2012
Denver, CO, USA, April 3-5, 2012
1. Introduction to Barrick and Goldstrike
2. Goldstrike Dewatering System
3. Goldstrike Monitoring System
4. Impact Evaluation
5. Conclusions
April 3-5, 2012 U.S. EPA Hardrock Mining Conference 2012
Presentation ContentsPresentation Contents
2
Distance:
1 meter = 3.3 feet
Flow rate:
1 liters/second = 16 gallons/minute (gpm)
Weight (Gold):
1 tonne = 32,000 troy ounces
April 3-5, 2012
Unit ConversionUnit Conversion
U.S. EPA Hardrock Mining Conference 2012 3
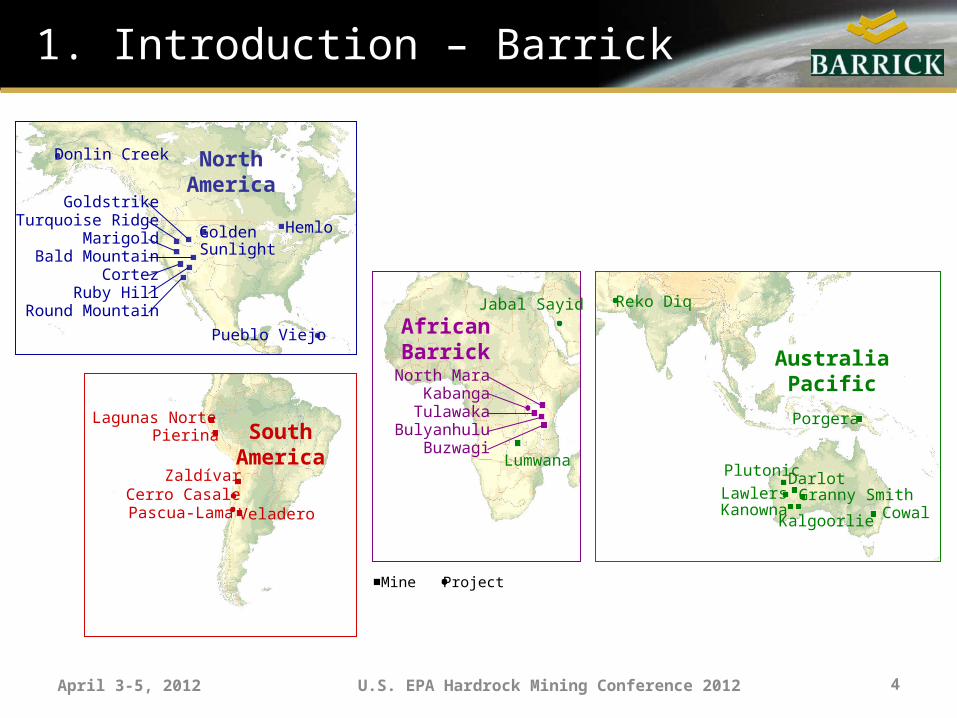
1. Introduction – Barrick
April 3-5, 2012 U.S. EPA Hardrock Mining Conference 2012 4
SouthAmerica
Lagunas NortePierina
ZaldívarCerro Casale
Pascua-Lama Veladero
NorthAmerica
Donlin Creek
GoldenSunlight
Hemlo
GoldstrikeTurquoise Ridge
MarigoldBald Mountain
CortezRuby Hill
Round Mountain
Pueblo Viejo
ProjectMine
AfricanBarrick
North MaraKabangaTulawaka
BulyanhuluBuzwagi
AustraliaPacific
Porgera
CowalGranny Smith
KalgoorlieKanowna
Plutonic DarlotLawlers
Reko DiqJabal Sayid
Lumwana
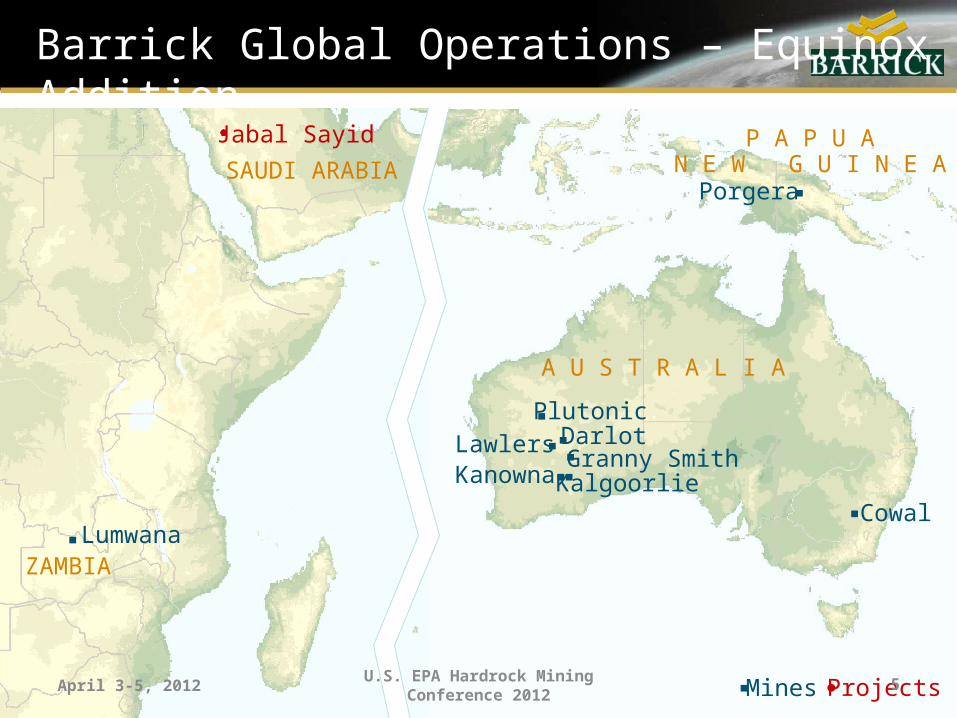
Barrick Global Operations – Equinox Addition
PlutonicDarlot
Kalgoorlie
Lawlers
Cowal
KanownaGranny Smith
Porgera
A U S T R A L I A
P A P U AN E W G U I N E A
Mines Projects
Lumwana
Jabal Sayid
ZAMBIA
SAUDI ARABIA
April 3-5, 2012 5U.S. EPA Hardrock Mining
Conference 2012
April 3-5, 2012 U.S. EPA Hardrock Mining Conference 2012
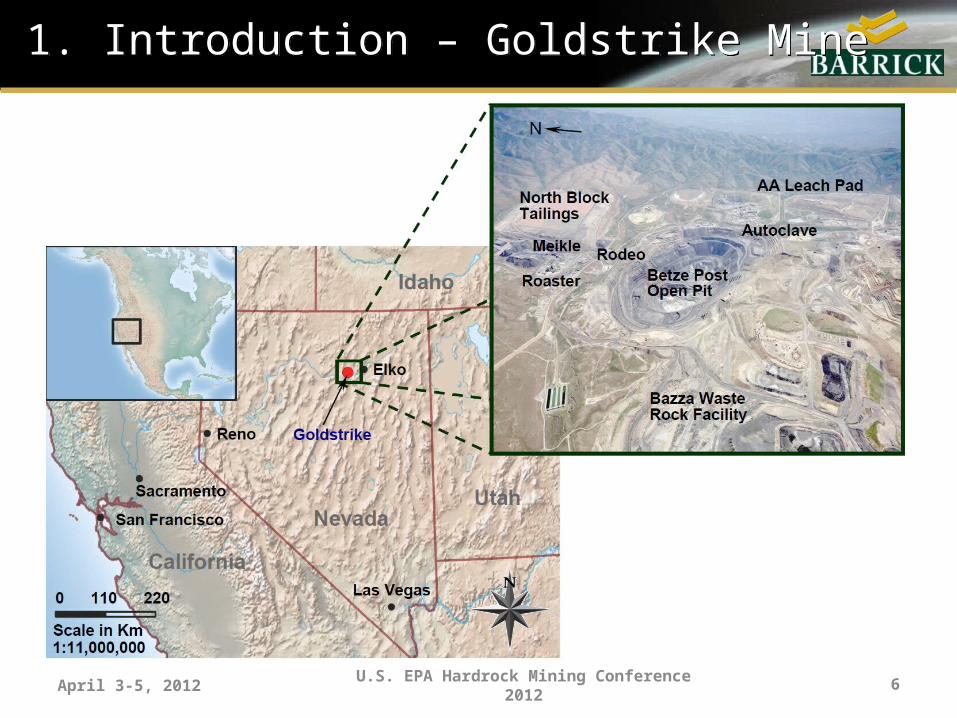
1. Introduction – Goldstrike Mine1. Introduction – Goldstrike Mine
6
April 3-5, 2012 U.S. EPA Hardrock Mining Conference 2012
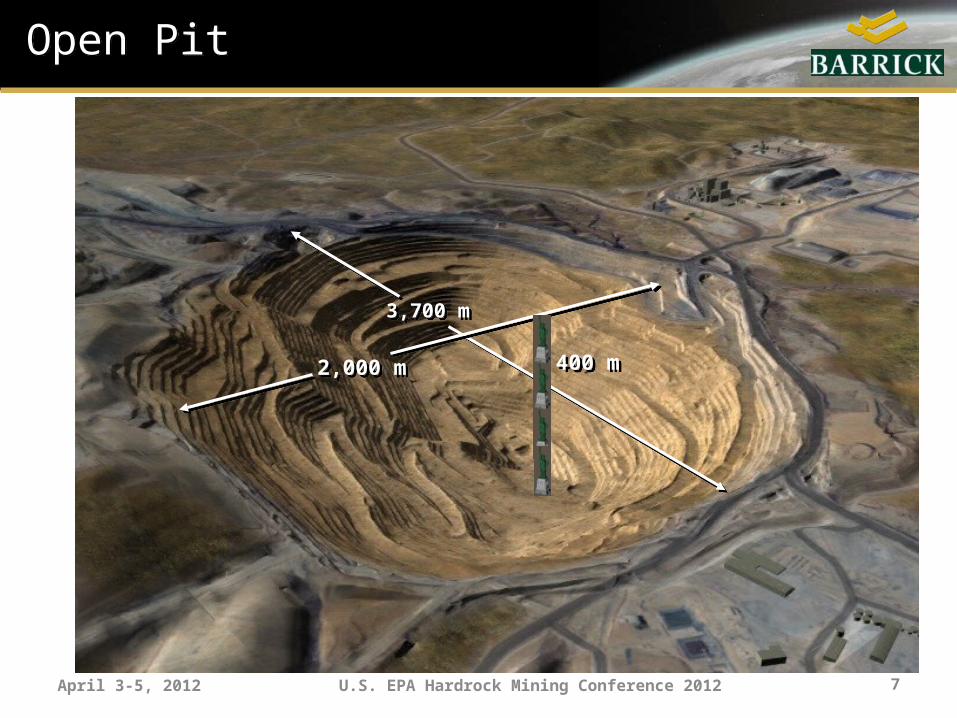
Open PitOpen Pit
400 m400 m
3,700 m3,700 m
2,000 m2,000 m
7
April 3-5, 2012 U.S. EPA Hardrock Mining Conference 2012
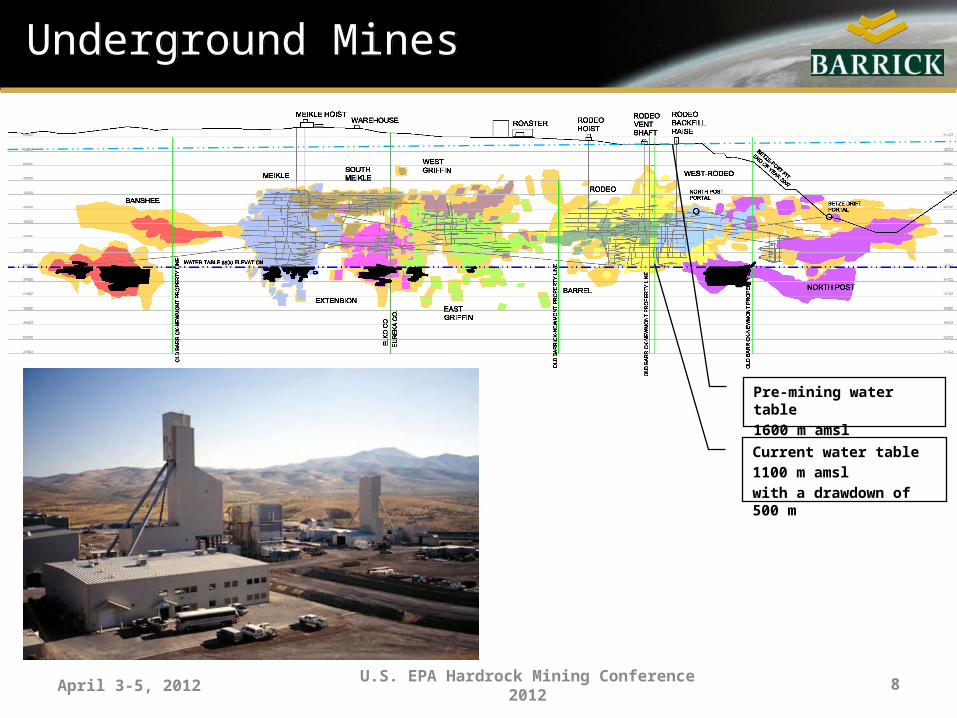
Underground MinesUnderground Mines
Pre-mining water table
1600 m amsl
Current water table
1100 m amsl
with a drawdown of 500 m
8
April 3-5, 2012 U.S. EPA Hardrock Mining Conference 2012
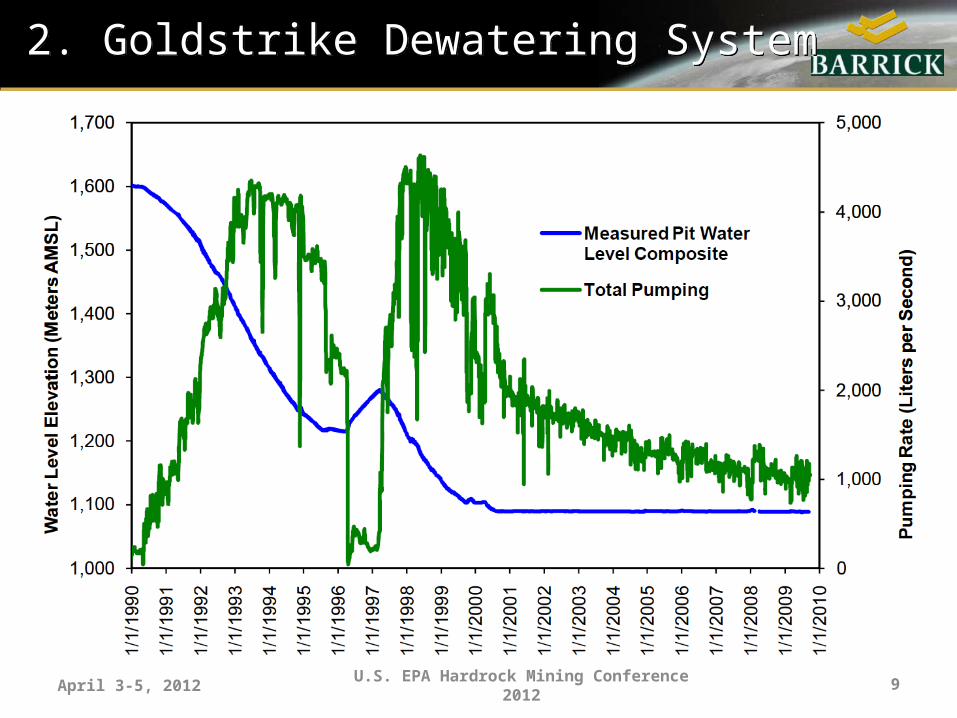
2. Goldstrike Dewatering System2. Goldstrike Dewatering System
9
April 3-5, 2012 U.S. EPA Hardrock Mining Conference 2012
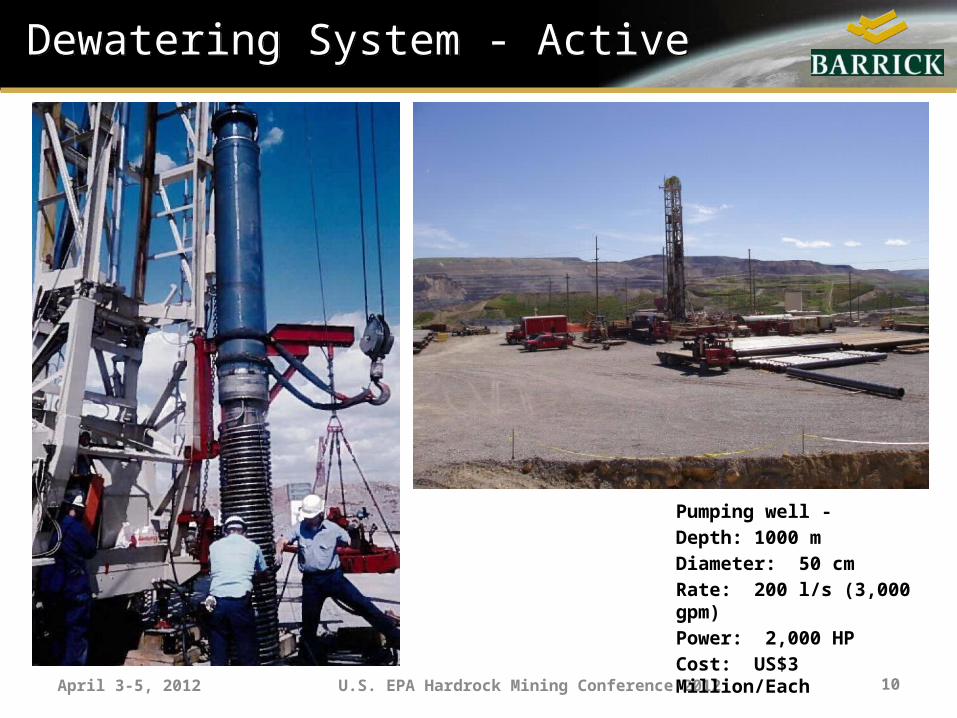
Dewatering System - ActiveDewatering System - Active
Pumping well -
Depth: 1000 m
Diameter: 50 cm
Rate: 200 l/s (3,000 gpm)
Power: 2,000 HP
Cost: US$3 Million/Each
10
April 3-5, 2012 U.S. EPA Hardrock Mining Conference 2012
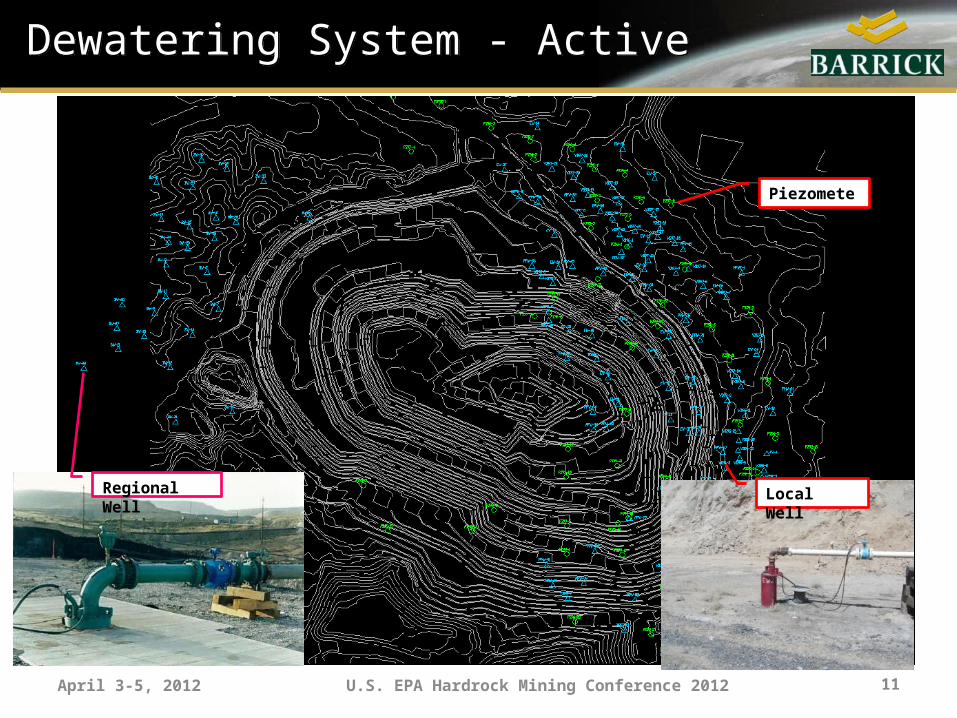
Dewatering System - ActiveDewatering System - Active
Piezometer
Local WellRegional Well
11
April 3-5, 2012 U.S. EPA Hardrock Mining Conference 2012
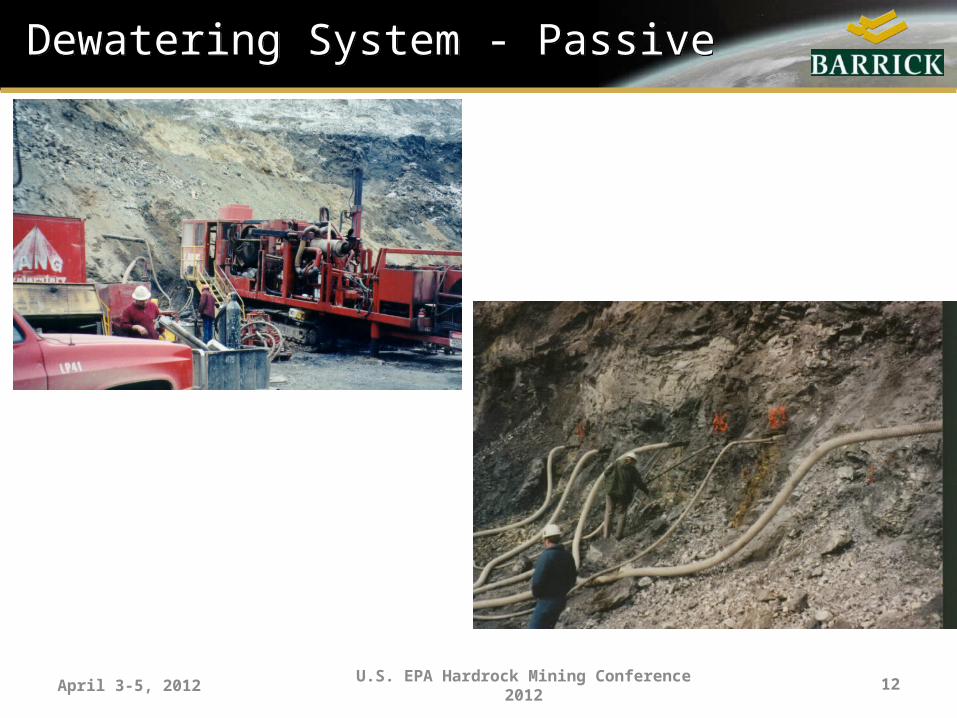
Dewatering System - PassiveDewatering System - Passive
12
April 3-5, 2012 U.S. EPA Hardrock Mining Conference 2012
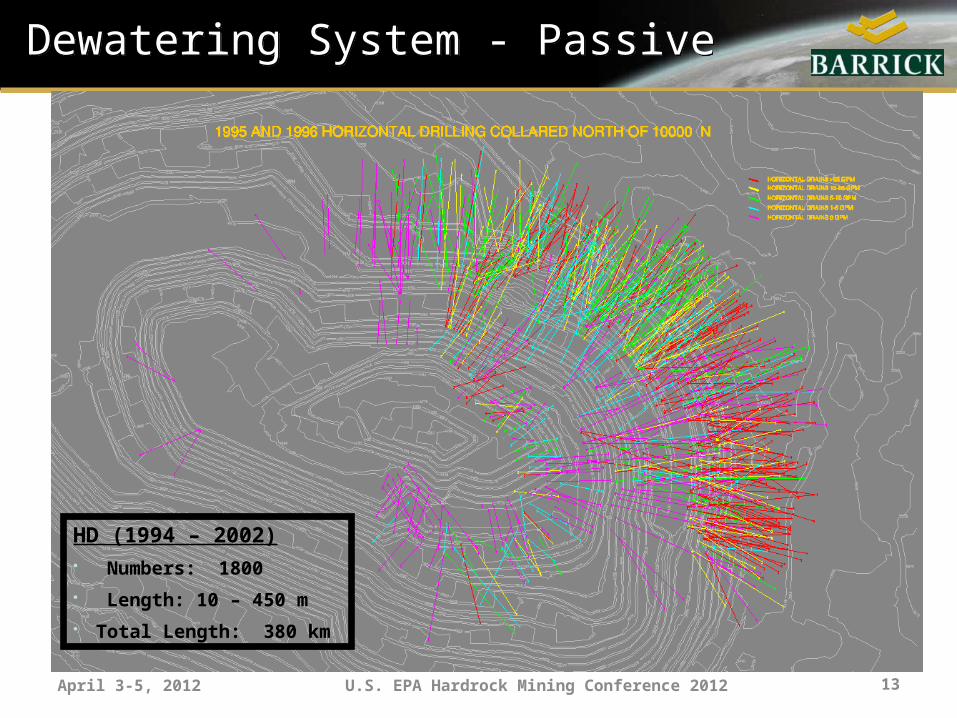
Dewatering System - PassiveDewatering System - Passive
HD (1994 – 2002)• Numbers: 1800
• Length: 10 – 450 m
• Total Length: 380 km
13
April 3-5, 2012 U.S. EPA Hardrock Mining Conference 2012
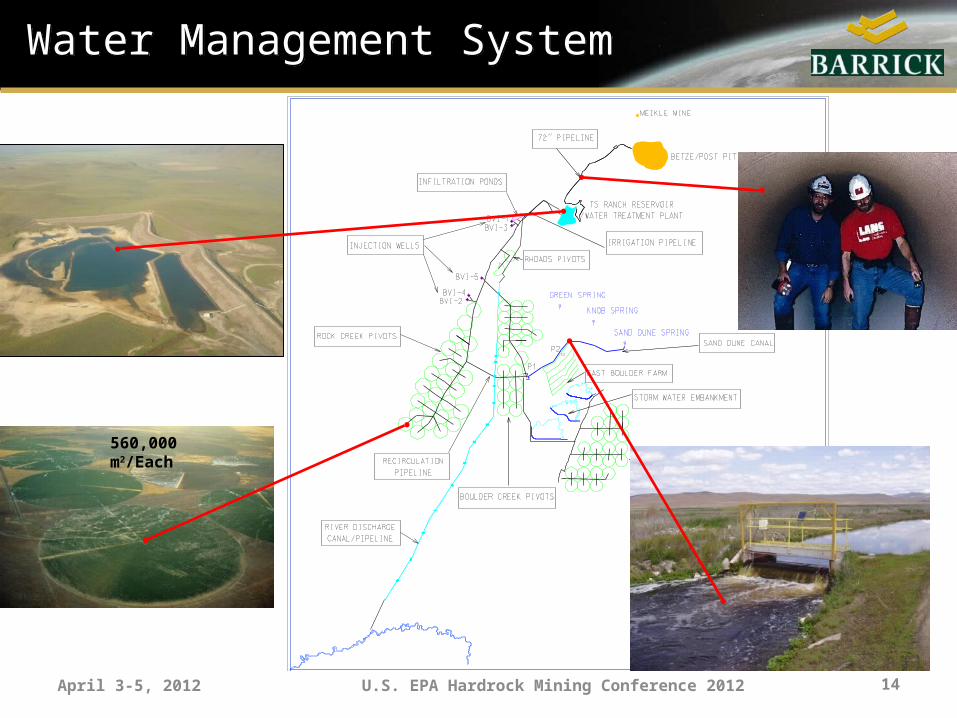
Water Management System Water Management System
560,000 m2/Each
14
April 3-5, 2012 U.S. EPA Hardrock Mining Conference 2012
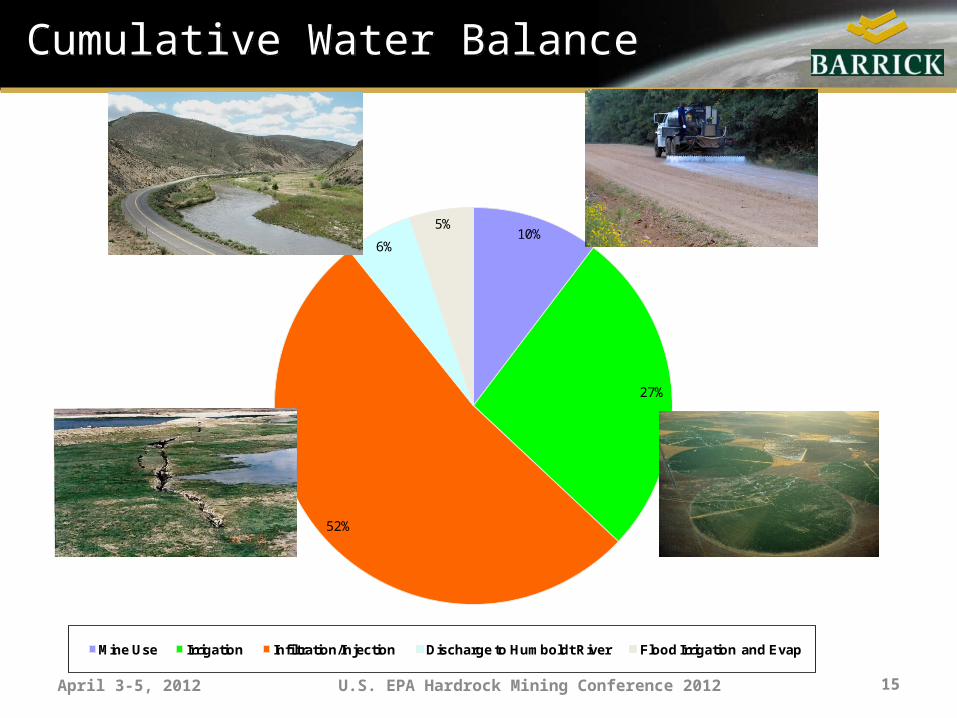
Cumulative Water BalanceCumulative Water Balance
10%
27%
52%
6%
5%
Mine Use Irrigation Infiltration/Injection Discharge to Humboldt River Flood Irrigation and Evap
15
April 3-5, 2012 U.S. EPA Hardrock Mining Conference 2012
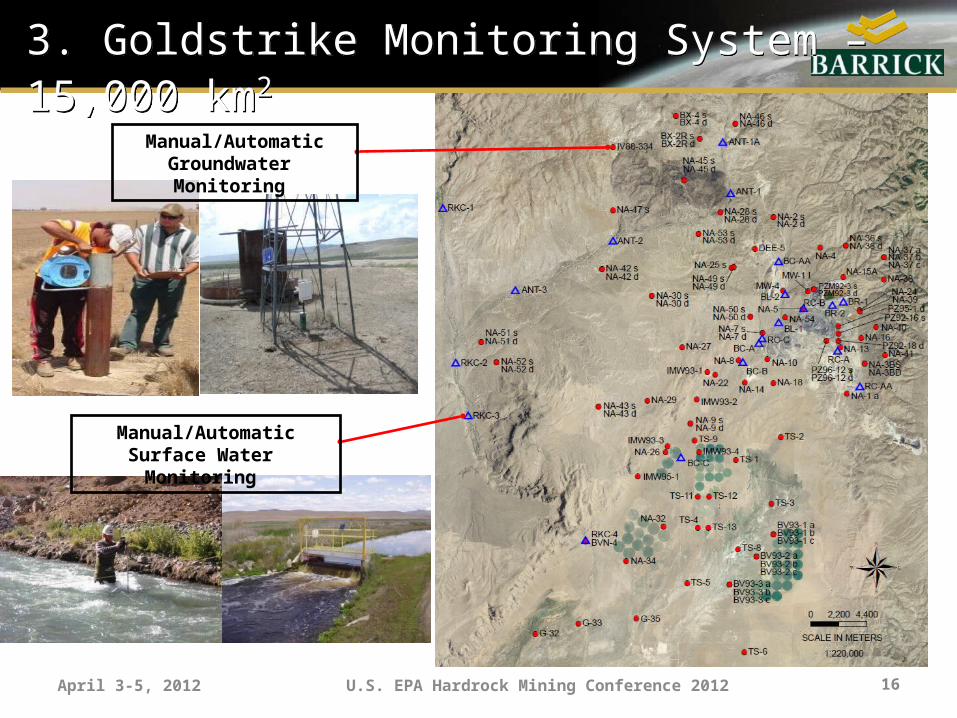
3. Goldstrike Monitoring System – 15,000 km2
3. Goldstrike Monitoring System – 15,000 km2
Manual/Automatic Surface Water Monitoring
Manual/Automatic Groundwater Monitoring
16
April 3-5, 2012 U.S. EPA Hardrock Mining Conference 2012
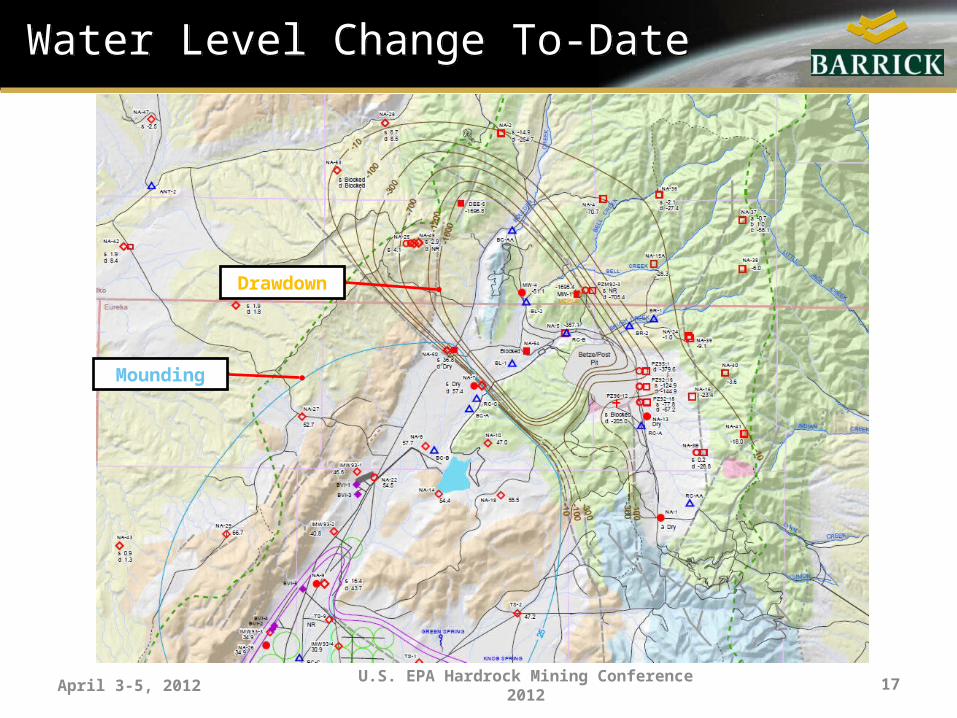
Water Level Change To-DateWater Level Change To-Date
Drawdown
Mounding
17
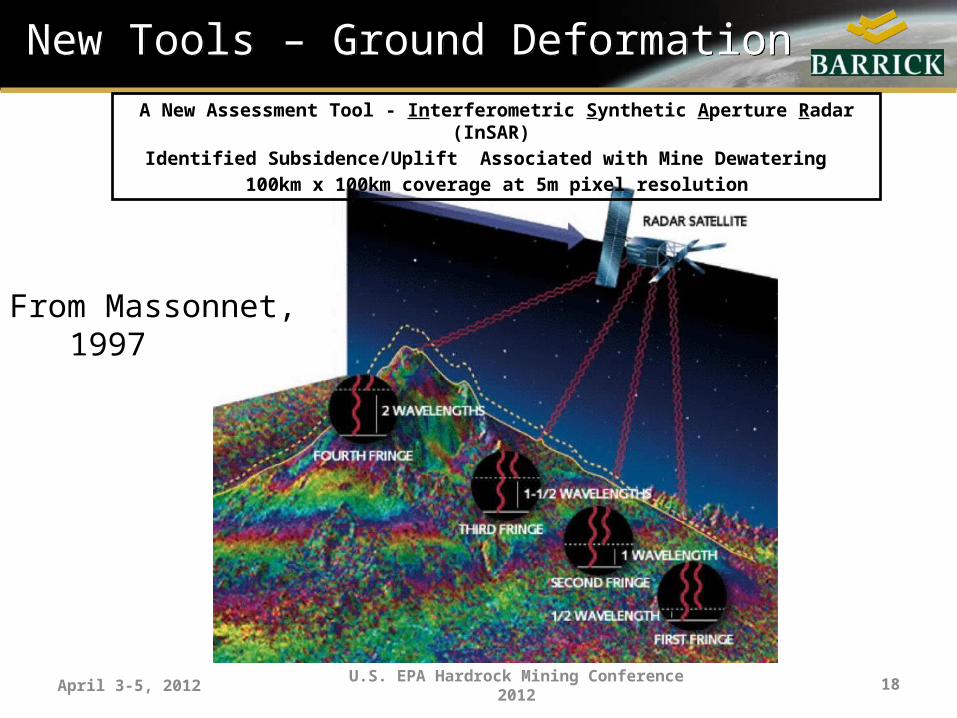
New Tools – Ground DeformationNew Tools – Ground Deformation
A New Assessment Tool - Interferometric Synthetic Aperture Radar (InSAR)
Identified Subsidence/Uplift Associated with Mine Dewatering
100km x 100km coverage at 5m pixel resolution
April 3-5, 2012 18U.S. EPA Hardrock Mining Conference 2012
From Massonnet, 1997
April 3-5, 2012 U.S. EPA Hardrock Mining Conference 2012
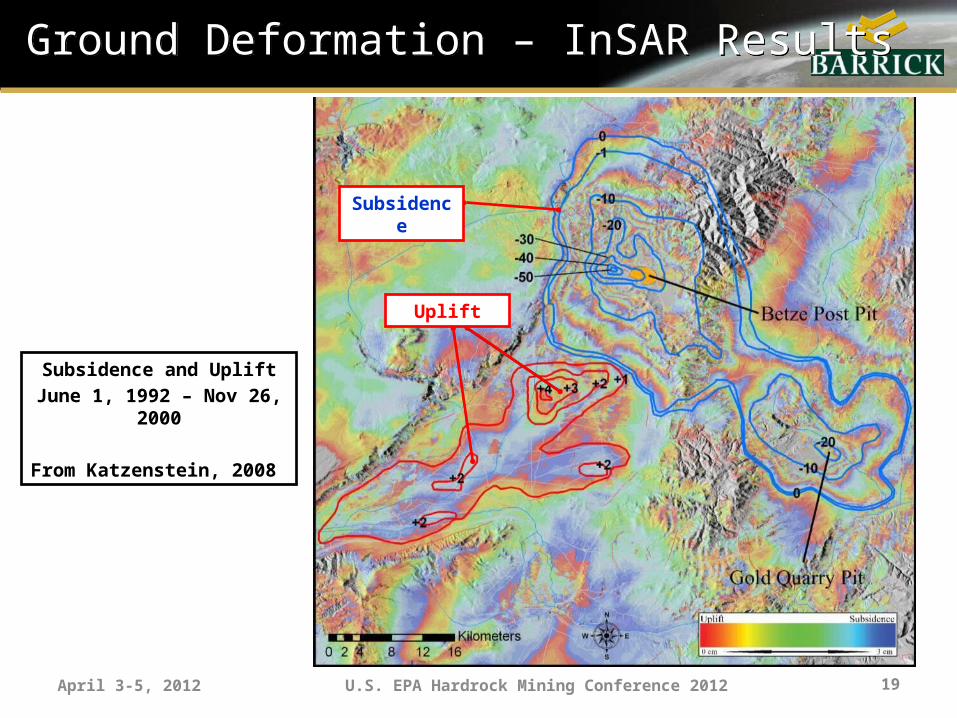
Ground Deformation – InSAR ResultsGround Deformation – InSAR Results
Subsidence
Uplift
Subsidence and Uplift
June 1, 1992 – Nov 26, 2000
From Katzenstein, 2008
19
April 3-5, 2012 U.S. EPA Hardrock Mining Conference 2012
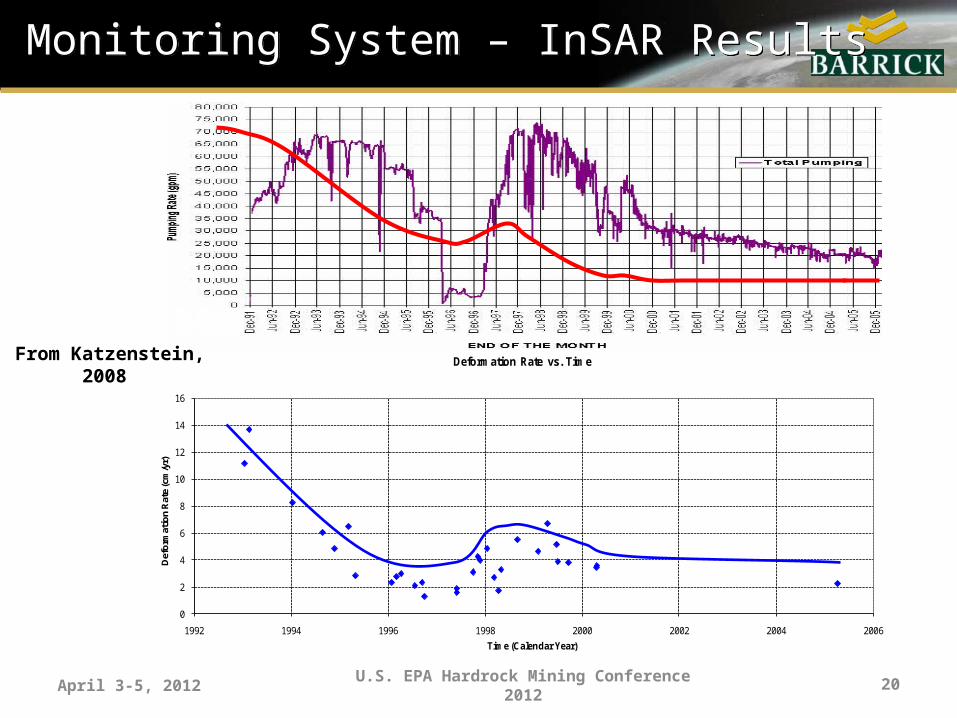
Monitoring System – InSAR ResultsMonitoring System – InSAR Results
0
2
4
6
8
10
12
14
16
1992 1994 1996 1998 2000 2002 2004 2006
Def
orm
atio
n R
ate
(cm
/yr)
Time (Calendar Year)
Deformation Rate vs. TimeFrom Katzenstein, 2008
20
April 3-5, 2012 U.S. EPA Hardrock Mining Conference 2012
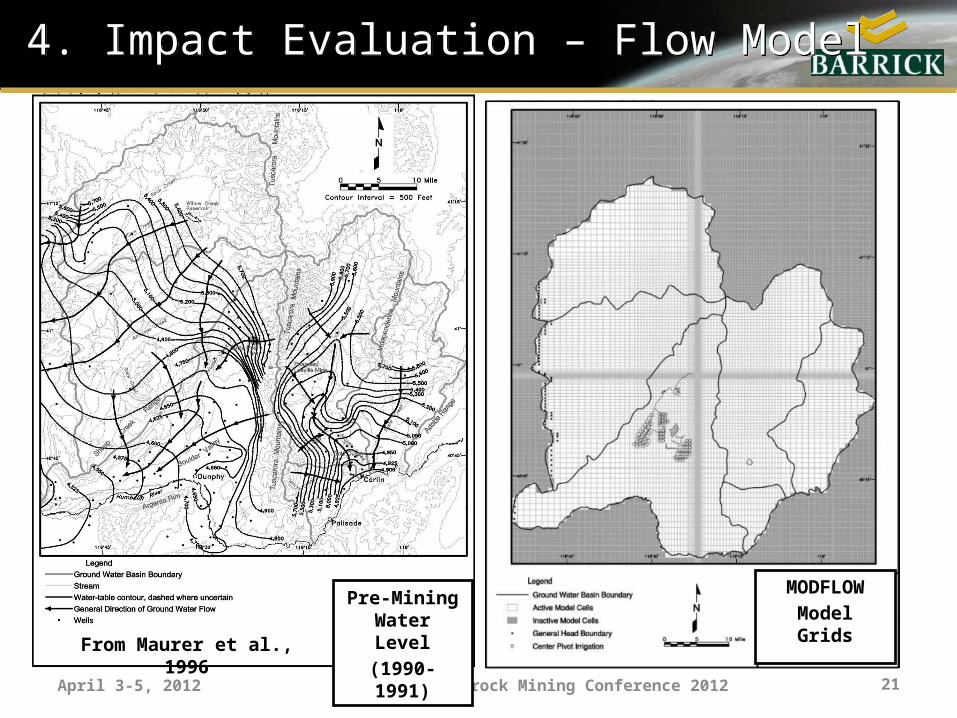
4. Impact Evaluation – Flow Model4. Impact Evaluation – Flow Model
Pre-Mining Water Level
(1990-1991)
MODFLOW
Model Grids
From Maurer et al., 1996
21
April 3-5, 2012 U.S. EPA Hardrock Mining Conference 2012
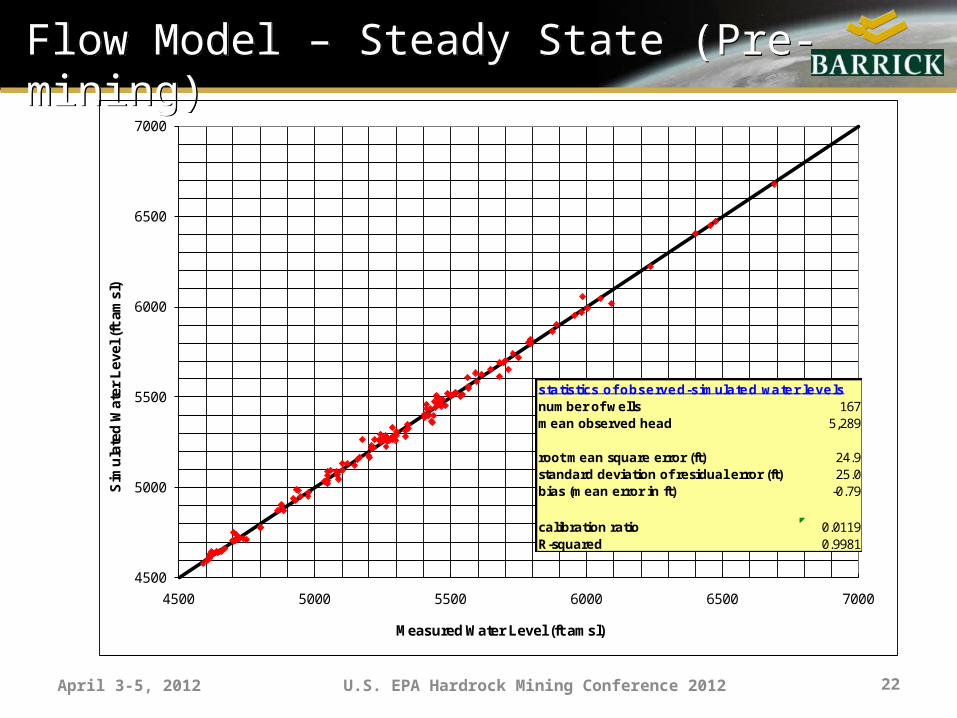
Flow Model – Steady State (Pre-mining)Flow Model – Steady State (Pre-mining)
4500
5000
5500
6000
6500
7000
4500 5000 5500 6000 6500 7000
Sim
ula
ted
Wat
er L
evel
(ft
am
sl)
Measured Water Level (ft amsl)
statistics of observed-simulated water levelsnumber of wells 167mean observed head 5,289
root mean square error (ft) 24.9standard deviation of residual error (ft) 25.0bias (mean error in ft) -0.79
calibration ratio 0.0119R-squared 0.9981
22
April 3-5, 2012 U.S. EPA Hardrock Mining Conference 2012
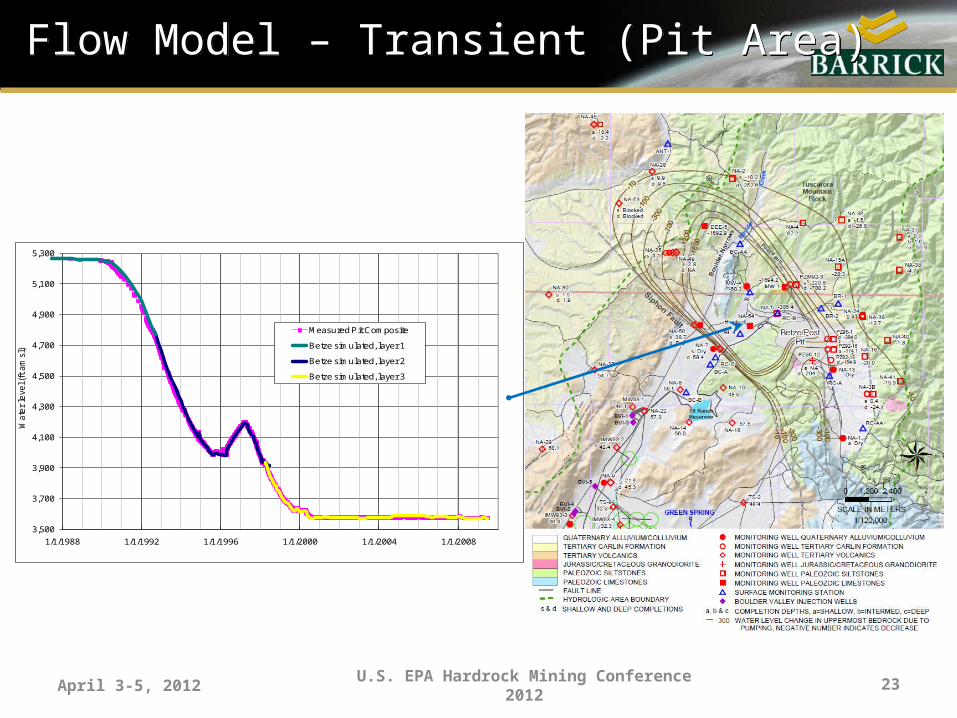
Flow Model – Transient (Pit Area) Flow Model – Transient (Pit Area)
3,500
3,700
3,900
4,100
4,300
4,500
4,700
4,900
5,100
5,300
1/1/1988 1/1/1992 1/1/1996 1/1/2000 1/1/2004 1/1/2008
Wa
ter
leve
l (ft
am
sl)
Measured Pit Composite
Betze simulated, layer 1
Betze simulated, layer 2
Betze simulated, layer 3
23
April 3-5, 2012 U.S. EPA Hardrock Mining Conference 2012
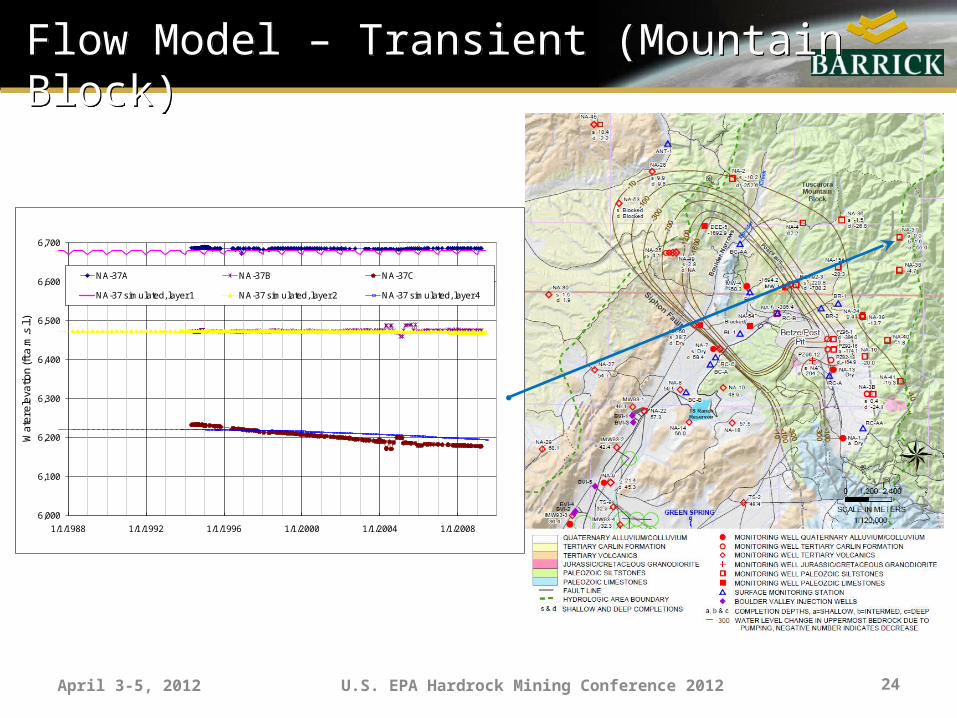
Flow Model – Transient (Mountain Block) Flow Model – Transient (Mountain Block)
6,000
6,100
6,200
6,300
6,400
6,500
6,600
6,700
1/1/1988 1/1/1992 1/1/1996 1/1/2000 1/1/2004 1/1/2008
Wa
ter e
leva
tion
(ft a
.m.s
.l.)
NA-37A NA-37B NA-37C
NA-37 simulated, layer 1 NA-37 simulated, layer 2 NA-37 simulated, layer 4
24
April 3-5, 2012 U.S. EPA Hardrock Mining Conference 2012
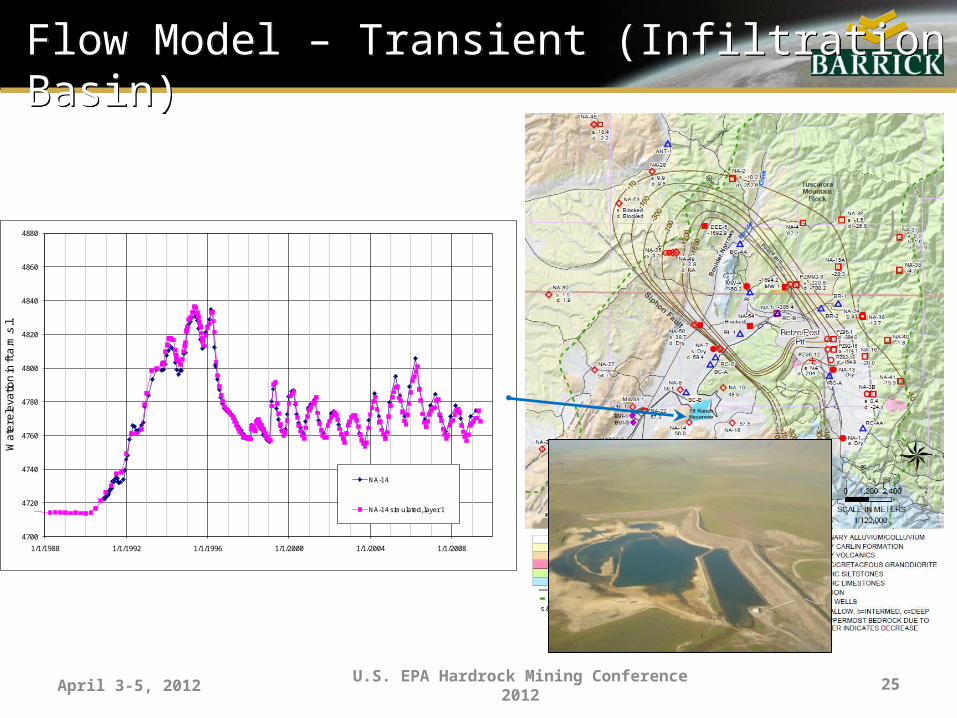
Flow Model – Transient (Infiltration Basin) Flow Model – Transient (Infiltration Basin)
4700
4720
4740
4760
4780
4800
4820
4840
4860
4880
1/1/1988 1/1/1992 1/1/1996 1/1/2000 1/1/2004 1/1/2008
Wa
ter e
leva
tion
in ft
a.m
.s.l.
NA-14
NA-14 simulated, layer 1
25
April 3-5, 2012 U.S. EPA Hardrock Mining Conference 2012
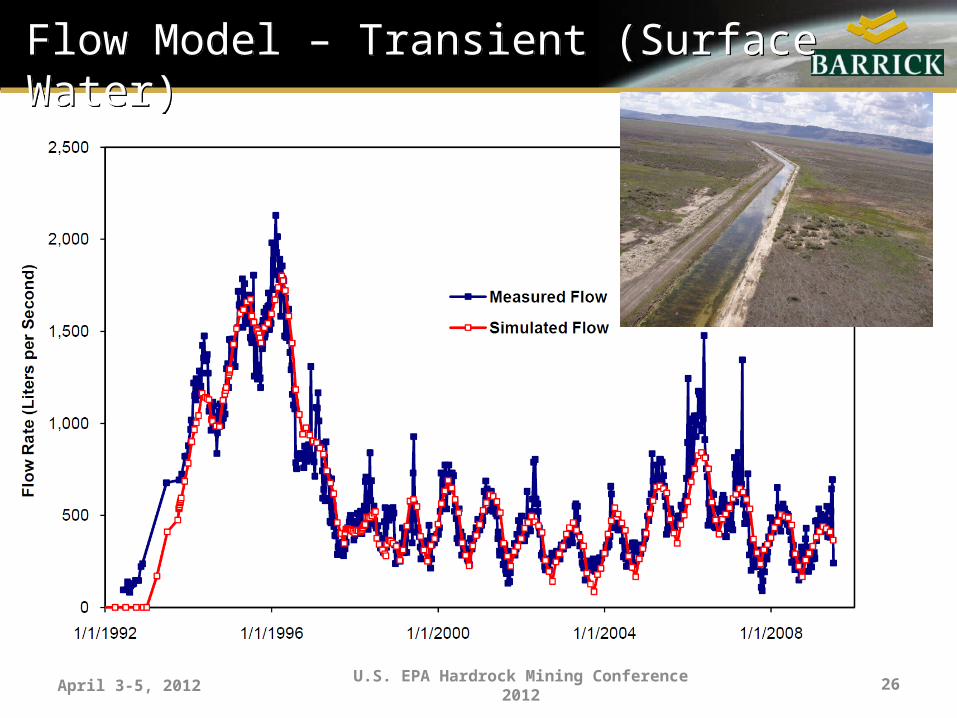
Flow Model – Transient (Surface Water) Flow Model – Transient (Surface Water)
26
April 3-5, 2012 U.S. EPA Hardrock Mining Conference 2012
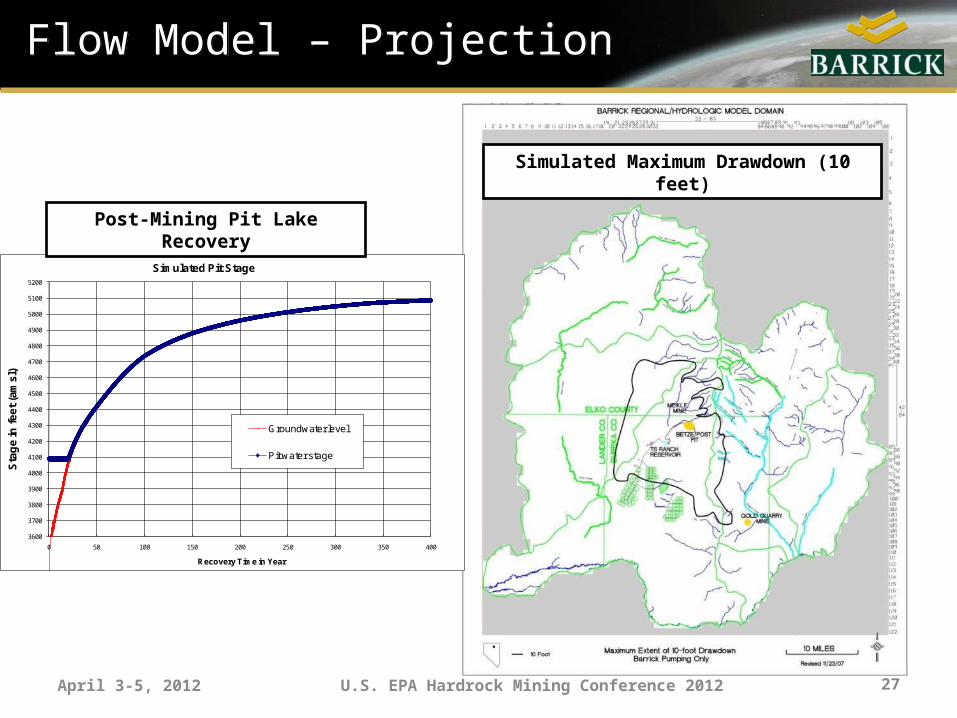
Flow Model – ProjectionFlow Model – Projection
3600
3700
3800
3900
4000
4100
4200
4300
4400
4500
4600
4700
4800
4900
5000
5100
5200
0 50 100 150 200 250 300 350 400
Sta
ge
in f
ee
t (a
ms
l)
Recovery Time in Year
Simulated Pit Stage
Groundwater level
Pit water stage
Post-Mining Pit Lake Recovery
Simulated Maximum Drawdown (10 feet)
27
April 3-5, 2012 U.S. EPA Hardrock Mining Conference 2012
5. Conclusions5. Conclusions
• Groundwater pumping at Goldstrike has resulted in 520 m of drawdown around the mine site.
• Most of the water pumped at the mine has been returned to the same hydrologic basin.
• Extensive monitoring program, assisted by modern satellite technology and by robust modeling, has identified aquifer responses.
• Improvement of the water-management system, the monitoring network, the modeling and analysis continue at Goldstrike.
28

April 3-5, 2012 U.S. EPA Hardrock Mining Conference 2012
Thank You for Your Attention!Thank You for Your Attention!
29