


Languages
Pages
Legal

Sanitation and Water for All (SWA) PAKISTAN Sector Status Report 2012
Investing Wisely
SANITATION AND WATER
Saving Lives
2
Contents
List of Tables and Figures.............................................................................................................. 5
Preface ............................................................................................................................................ 6
Executive Summary ........................................................................................................................ 7
Introduction ................................................................................................................................... 7
Current Situation ........................................................................................................................... 7
Urgent Need for Action .................................................................................................................. 7
Enablers ........................................................................................................................................ 7
Bottlenecks ................................................................................................................................... 8
Taking Action ................................................................................................................................ 8
Current Situation .......................................................................................................................... 11
Population ................................................................................................................................... 11
Health ......................................................................................................................................... 11
Education .................................................................................................................................... 11
Poverty ........................................................................................................................................ 12
Urbanization ................................................................................................................................ 12
Economic Growth ........................................................................................................................ 14
Drinking Water ............................................................................................................................ 14
Sanitation .................................................................................................................................... 14
Sector Financing ......................................................................................................................... 16
Sector Financing - Provincial Situation ..................................................................................... 19
Provincial Finance Commission ............................................................................................... 22
External ................................................................................................................................... 23
Donor Coordination and Sector Wide Approach .......................................................................... 24
Estimating Cost for Water Supply and Sanitation ........................................................................ 25
Urgent Need for Action ................................................................................................................. 30
Health Impacts ............................................................................................................................ 30
Economic Impacts ....................................................................................................................... 31
Enablers ........................................................................................................................................ 35
Policies........................................................................................................................................ 35
National Sanitation Policy (2006)................................................................................................. 35
National Drinking Water Policy (2009) ......................................................................................... 35
Overview of Financial Planning and Budgeting ............................................................................ 39
Examples of Best Practice ........................................................................................................... 41
Changa Pani Programme (CPP) - Government ........................................................................... 41
Orangi Pilot Project ..................................................................................................................... 41
3
Lodhran Pilot Project (LPP) ......................................................................................................... 41
Community Led Total Sanitation (CLTS) ..................................................................................... 42
Pakistan Approach to Total Sanitation (PATS) ............................................................................ 42
North Sindh Urban Services Corporation (NSUSC) ..................................................................... 43
Water and Sanitation Extension Programme (WASEP) ............................................................... 43
Citizen Report Card ..................................................................................................................... 44
Formalizing Rural Water Supply Billing Systems ......................................................................... 45
Converting Waste into Resource - Waste Management Industry ................................................. 45
Intersectoral Collaboration Opportunities .................................................................................. 47
Education .................................................................................................................................... 47
Health ......................................................................................................................................... 47
Bottlenecks ................................................................................................................................... 49
Institutional Arrangements ........................................................................................................... 49
Water and Sanitation Agencies ................................................................................................... 50
Operation and Maintenance ........................................................................................................ 52
Urban Water Supply and Sewerage Schemes ......................................................................... 52
Rural Water Supply and Sewerage Schemes .......................................................................... 52
Equity and Inclusion .................................................................................................................... 54
Quality ......................................................................................................................................... 55
Waste .......................................................................................................................................... 58
Waste Water ............................................................................................................................ 58
Solid Waste ............................................................................................................................. 59
Monitoring ..................................................................................................................................... 61
Definitions and Information Management .................................................................................... 61
Institutional Mechanisms for Monitoring....................................................................................... 62
Climate Change ............................................................................................................................. 63
Disaster Risk Reduction .............................................................................................................. 64
Vulnerability to Climate Change .................................................................................................. 65
Taking Action ................................................................................................................................ 68
Catalyzing Actions ....................................................................................................................... 68
Institutional Arrangements ........................................................................................................... 68
Operation and Maintenance - Urban ........................................................................................... 69
Operation and Maintenance - Rural ............................................................................................. 69
Monitoring ................................................................................................................................... 69
Sectoral Financing ...................................................................................................................... 70
Human Resource Development .................................................................................................. 70
Partnerships ................................................................................................................................ 71

4
Climate Change .......................................................................................................................... 71
Research ..................................................................................................................................... 71
Bibliography .................................................................................................................................. 73
Acronyms ...................................................................................................................................... 78
Annexure 1 - Methodology ........................................................................................................... 81
Background ................................................................................................................................. 81
Scope and Purpose ..................................................................................................................... 81
Process ....................................................................................................................................... 81
Stakeholders Consulted .............................................................................................................. 82
Annexure 2 – Costing ................................................................................................................... 84
5
List of Tables and Figures Table 1: Growing Population in Cities ............................................................................................. 13
Table 2: Current Access Rates for Drinking Water and Sanitation .................................................. 15
Table 3: PRSP Budgetary Expenditures of FY 2010-11, FY 2009-10 and FY 2008-09 ................... 18
Table 4: External Assistance to the Sector ...................................................................................... 23
Table 5: Estimating Resource Needs for MDG Targets for Drinking Water ..................................... 26
Table 6: Estimating Resource Needs for MDG Targets for Sanitation ............................................. 27
Table 7: Estimating Resource Gap for MDG Targets for Water (100%) and Sanitation (67% both urban and rural) Coverage .............................................................................................................. 28
Table 8: Institutional Framework for Drinking Water and Sanitation ................................................ 38
Table 9: Summary of WASAs ......................................................................................................... 51
Table 10: Bacterial Contamination Levels of Water Sources of 23 Cities of Pakistan ...................... 57
Table 11: Per Capita Availability of Water ....................................................................................... 57
Table 12: Status of Waste Water and Treatment in Major Cities of Pakistan ................................... 59
Table 13: Water Supply Costing Balochistan .................................................................................. 84
Table 14: Water Supply Costing Khyber Pakhtunkhwa ................................................................... 85
Table 15: Water Supply Costing Punjab ......................................................................................... 86
Table 16: Water Supply Costing Sindh ........................................................................................... 87
Table 17: Water Supply Costing Summary ..................................................................................... 88
Table 18: Sanitation Costing Balochistan ........................................................................................ 89
Table 19: Sanitation Costing Khyber Pakhtunkhwa ......................................................................... 91
Table 20: Sanitation Costing Punjab ............................................................................................... 93
Table 21: Sanitation Costing Sindh ................................................................................................. 95
Table 22: Sanitation Costing Summary ........................................................................................... 97
Figure 1: Trends in Access to Sanitation ......................................................................................... 16
Figure 2: Drinking Water and Sanitation Sectoral Expenditure Decadal Trend ................................ 17
Figure 3: Sectoral Expenditure to GDP ratio ................................................................................... 18
Figure 4: Access to Sanitation and Sectoral Public Expenditure ..................................................... 19
Figure 5: Drinking Water and Sanitation Allocations as Proportion of Provincial ADP 2011-12 ....... 20
Figure 6: Provincial Allocations for Drinking Water and Sanitation in ADPs 2011-12 ...................... 20
Figure 7: Drinking Water and Sanitation 3 Years Trend of Total Sectoral Budget as Proportion (%) of Total Provincial PRSP Allocation .................................................................................................... 21
Figure 8: Drinking Water and Sanitation 3 Years Trend of Sectoral Development Budget as Proportion (%) of Total Provincial PRSP Development Allocation ................................................... 21
Figure 9: Schematic Diagram Illustrating Major Institutional Gaps .................................................. 36
6
Preface Improving the quality of life of all people, especially those that are underprivileged and under-served, those that are vulnerable, is the fundamental principle upon which modern day development is based. It is not only about poverty reduction, but rather about improving human security, empowering people and enhancing opportunities so that they can make choices in life.
There is probably no greater basic human need and fundamental right than access to safe drinking water and adequate sanitation.
Today, Pakistan stands among many other nations looking ahead at the 2015 horizon by which time it should have achieved its Millennium Development Goals targets. Recent national statistics indicate that Pakistan is well on track to meet its drinking water targets, but still considerably short of the sanitation targets.
As Pakistan grapples with several development priorities in a resource constrained environment, allocating adequate resources for each priority becomes a daunting task for any government. This report provides the discerning reader with an overview of the situation of drinking water and sanitation in Pakistan. It highlights some of the many achievements and successes contributed to by both government and other development actors, tries to bring home some of the key bottlenecks from a myriad of sector challenges that Pakistan faces and is likely to encounter, and suggests a plausible way forward while keeping in mind social, economic and demographic realities.
This report is not meant as a detailed sector review and analysis, or a comprehensive critical appraisal of the sector, as each chapter and section is a volume of study in itself. Indeed, several detailed treatises and excellent works have been written on various topics, some of which are noted in the bibliography. It has been developed as a background study to provide an overview of the sector in preparation for the high level meeting of Sanitation and Water for All (SWA) planned for April 2012. SWA is an international alliance which seeks for prioritization of sanitation and water in development plans of country’s especially those that are off-track to meet their MDG targets.
It is hoped that the report will also serve a greater purpose of raising awareness amongst policy and decision makers, sector professionals and frontline practitioners, development organizations, corporate sector and academia, and facilitate Pakistan on its development trajectory.
7
Executive Summary
Introduction
Pakistan is a signatory to the Millennium Development Goals and has a commitment and obligations to the MDG targets relating to Sanitation and Water.
This report has been developed as a background study to provide an overview of the sector in preparation for the high level meeting of Sanitation and Water For All planned for April 2012. Sanitation and Water for All is an international alliance, which seeks for prioritization of sanitation and water in development plans of country’s especially those that are off-track to meet their MDG targets.
Current Situation
Pakistan has formulated its National Environment Policy (2005), National Sanitation Policy (2006), National Drinking Water Policy (2009) and National Climate Change Policy (2012). These provide the necessary legal support for the implementation of different government initiatives coupled with interventions in the sector. There is a country commitment to implement the Pakistan Approach to Total Sanitation as committed at SACOSAN IV. Recent survey data indicates that the proportion of population using improved sanitation increased from 37% in 2000 to 48% in 2009-2010 and flush latrines increased from 45% in 2001 to 66% in 2010-2011.
Despite the strains on economy imposed by the massive earthquake in 2005, the internal displacement of 3 million people in 2009 and the deluge of floods in 2010 and 2011, Pakistan not only sustained its commitment but also increased its public spending for sanitation and drinking water five fold in terms of public expenditure and about 300% in real terms since 2005.
Urgent Need for Action
100-150 children die every day because of diarrhoeal related illnesses – many of these deaths can be prevented by adequate sanitation, safe drinking water and improved hygiene. 60-75 million people are affected by diarrhoeal related illnesses annually. Half of the rural population is without adequate sanitation and Pakistan is off-track to meet the projected MDG target of 67%.
The economic impact of poor sanitation and hygiene results in an annual loss of 3.94% or more of the GDP.
Demographic transitions over the last 30 years have led to a marked increase in urban and peri-urban populations, compounded by on-going conflicts and humanitarian crises, which has an enormous impact on planning for sanitation and drinking water services.
Pakistan falls within the highly vulnerable zones of climate change and its inextricable link and need to develop its adaptive capacity, resilient water and sanitation systems and disaster risk reduction.
Enablers
Some of the key enablers for water and sanitation include national environmental policy, national sanitation policy, national drinking policy, supported by Pakistan Environmental Protection Act 1997, national standards for drinking water and a national behavioral change communication strategy.
There are several examples of best practices for drinking water and sanitation services both in urban and rural settings in the country. These exemplify various sustainable demonstration approaches ranging from government led programmes to revenue generating public-private

8
partnerships. The Lady Health Workers programme in health and School Health Programme in education provides scope for intersectoral collaboration.
Bottlenecks
The main bottlenecks identified include institutional arrangements with overlapping of roles and responsibilities and weak coordination mechanisms; high non-revenue water; dysfunctional water supply schemes; ageing infrastructure; water and sanitation driven by political interests which may not match equity and inclusion priorities; poor water quality from polluted and contaminated sources; inadequate waste water treatment; high dependency on ground water which is depleting; and inadequate solid waste management.
Institutional platforms for monitoring of sanitation and drinking water exist like management information system, multiple indicator cluster surveys and Pakistan social and living standards measurement surveys. However, there is an urgent need to align information needs of water and sanitation with and strengthen existing structures and systems of data collection at the provincial level.
Climate change poses one of the most significant and impending threats to water and sanitation in Pakistan. Resilience of water and sanitation systems and disaster risk reduction is critical to build adaptive capacity.
Taking Action
1. Develop a National Sector Action Plan comprised of Provincial Action Plans to effectively implement national policies on sanitation and drinking water as well as behavioral change by December 2013;
2. Prioritize Sanitation and Drinking Water within a Sector Wide Approach in Poverty Reduction Strategy Paper III, Medium Term Development Framework and Medium Term Expenditure Framework;
3. Enhance by 2015, the sectoral allocation for water supply and sanitation by 1% of overall PRSP allocation to partially meet the resource gap of US$ 600 million for global MDGs target of sanitation and drinking water;
4. Conduct a sector capacity development needs assessment and develop a human resource and leadership development plan for sanitation and drinking water sector by December 2012;
5. Establish a national monitoring framework for sanitation and drinking water based on provincial monitoring frameworks, and strengthen national and provincial information management systems, including those for health and education for improved and coordinated monitoring of sanitation and water by 2013;
6. Constitute a special Task Force on up–scaling rural sanitation based on the Pakistan Approach to Total Sanitation by December 2012;

9
8. Constitute a special Task Force on Peri-urban/Urban challenges and Climate Change in relation to sanitation and drinking water to document and formulate guidelines for best practice for incorporating into the national and provincial action plans by December 2012;
9. Constitute a WASH specific Task Force on Disaster Preparedness and Response as well as Disaster Risk Reduction by December 2012
10. Set up a research working group to identify research priorities in the sector

10
CURRENT SITUATION

11
Current Situation
Population
Pakistan’s population growth rate has shown a steady decline from 2.7% in 1998 to the rate of 2%
in 2011 (Social Indicators of Pakistan 2011). It has an estimated population close to 177 million and
it is projected to reach over 350 million by 2050 (D Nayab: Demographic dividend or demographic
threat in Pakistan. PIDE, 2006). Nearly 50% of Pakistan’s population is under 20 years, and about
68% is under 30 years - this constitutes a youth bulge, which is expected to dominate the population
for another 30-35 years. The size, growth and age distribution demands a high and sustained GDP
growth as soon as possible.
Health
Health indicators in Pakistan have witnessed relative improvements in the context of South Asia, but
remain far from satisfactory. Pakistan ranks 125th in the Human Development Index with a maternal
mortality of 276, infant mortality of 63, Under 5 mortality rate of 89 and skilled birth attendance at
39% (Economic Survey of Pakistan 2010-11).
There has been a significant reduction in public spending on health nutrition from 0.72% of GDP in
2000-2001 to 0.23% in 2010-2011 (Economic Survey of Pakistan 2010-11).
Education
Pakistan ranks 119 out of 127 countries on the Education For All development index (Education For
All Global Monitoring Report 2011). Pakistan has a Net Enrolment Rate of 56% for both genders
(aged 5-9 years), while rural net enrolment rates for girls aged 5-9 years are 48% compared to boys
at 57%. Urban net enrolment rates are 67% and 65% for boys and girls respectively. 68% of all
primary level enrolments are government schools, with 46% for urban and 79% for rural (Pakistan
Social and Living Standards Measurement Survey 2010-11).
The transition from primary to secondary education is low. About 15% of children in the 10-18 years
age group drop out before completing primary school.
The private sector has come to play a significant role in the delivery of education services. The
sector has expanded rapidly from 3,300 institutions in 1998 to over 90,000 in 2009. It now caters for
about 40% of total enrolment.
According to Pakistan Education Statistics (2010-11) of missing facilities in government primary and
middle schools in 2010-2011, 33% were without drinking water, while 36% had no latrines. 35% of
government primary schools did not have safe drinking water and 38% did not have adequate
latrine facilities (Pakistan Social and Living Standards Measurement Survey 2010-11).
12
Poverty
In the last decade between 2001-2009, unemployment has risen from 3 million to 5.5 million, while
per capita income growth has fallen from 7% to under 0.5% (Pakistan: Framework for Economic
Growth, 2011).
Although Pakistan has made significant progress in human development and poverty reduction over
the past three decades, it is considered relatively slow over a long horizon. Social and economic
exclusion has resulted in multiple deprivations for more than 50% of Pakistan’s population. This
situation has only been worsened by the recent deluge of floods in 2010 and 2011.
In the period of July-April 2010-2011, the inflation rate was reported at 14.1%. The highest rate of
inflation was observed in the food group at 18.4% (Economic Survey of Pakistan 2010-11).
Urbanization
With an increasing population, Pakistan is the fifth most populous country in the world and second
largest in South Asia. Pakistan’s urbanization is expected to reach over 50% by 2025 (Pakistan:
Framework for Economic Growth, 2011). However, actual urbanization is probably much higher
since the definitions used in Pakistan are administrative rather than density based. By employing an
amended definition, estimates of actual urbanization at present place 50% in cities.
While increasing urbanization is considered useful for economic growth in Pakistan, where cities
produce up to 80% of GDP, rising urban poverty, quantitative shortage, inequitable coverage and
poor quality of service delivery lead to further degradation of the urban environment.

13
Table 1: Growing Population in Cities
City with more than 1 million population
Population 2030 (‘000)
Karachi 27993
Lahore 14626
Faisalabad 6192
Rawalpindi 4149
Multan 3025
Hyderabad 3005
Gujranwala 3143
Peshawar 2778
Islamabad 3175
Quetta 2038
Sargodha 1074
Bahawalpur 1903
Sialkot 1087
Larkana 1174
Sheikhupura 1019
(Source: Pakistan: Framework for Economic Growth, 2011)
14
Economic Growth
The new Pakistan Framework for Economic Growth 2011 has identified six critical changes:
• Strengthen the Medium-Term Development Framework (MTDF) and the Medium-Term
Expenditure Framework (MTEF) for setting medium-term priorities in line with growth strategy
and reforms agenda
• Support a unified results-based budget preparation process
• Decentralise responsibility for projects to line ministries
• Redefine the Planning Commission’s role and processes in respect of major capital projects
• Establish a results-based monitoring and evaluation system.
• Planning Commission should lead the reform and change process through identification and
advocacy of critically required changes in policies.
An important constraint on GDP growth is the deterioration in the physical environment. The World
Bank has estimated that the mean annual cost of environmental degradation is approximately 6% of
GDP. The highest cost is from inadequate water supply, sanitation and hygiene, followed by
agricultural soil degradation, indoor air pollution, and urban air pollution (Pakistan Strategic Country
Environmental Assessment – World Bank 2006).
Drinking Water
The Pakistan Social and Living Standards Measurement survey 2010-2011 revealed that about
91% of the population had access to improved drinking water, with 94% for urban and 90% for rural
(PSLM 2010-11).
The Joint Monitoring Programme (JMP) recently launched its 2012 report in which it reported a
national figure of 92% with 96% for urban and 89% for rural. The report also noted that this
indicated that 28% of the 2010 population gained access to improved drinking water since 1995. 5%
of rural populations were still using surface water.
Both surveys do not address the issue of quality of drinking water which is an area of critical
concern. This is discussed further in the report.
Sanitation
In the same survey of Pakistan Social and Living Standards Measurement of 2010-2011, 66% of the
population was found to be using flush toilets, with 15% using non-flush toilets. Urban rates for flush
toilets were 96%, while rural rates were 51%. The population with no toilets accounted for 18%.
However, according to the JMP 2012 report, 48% were using improved sanitation (72% urban and
34% rural), while 23% were still practicing open defecation.
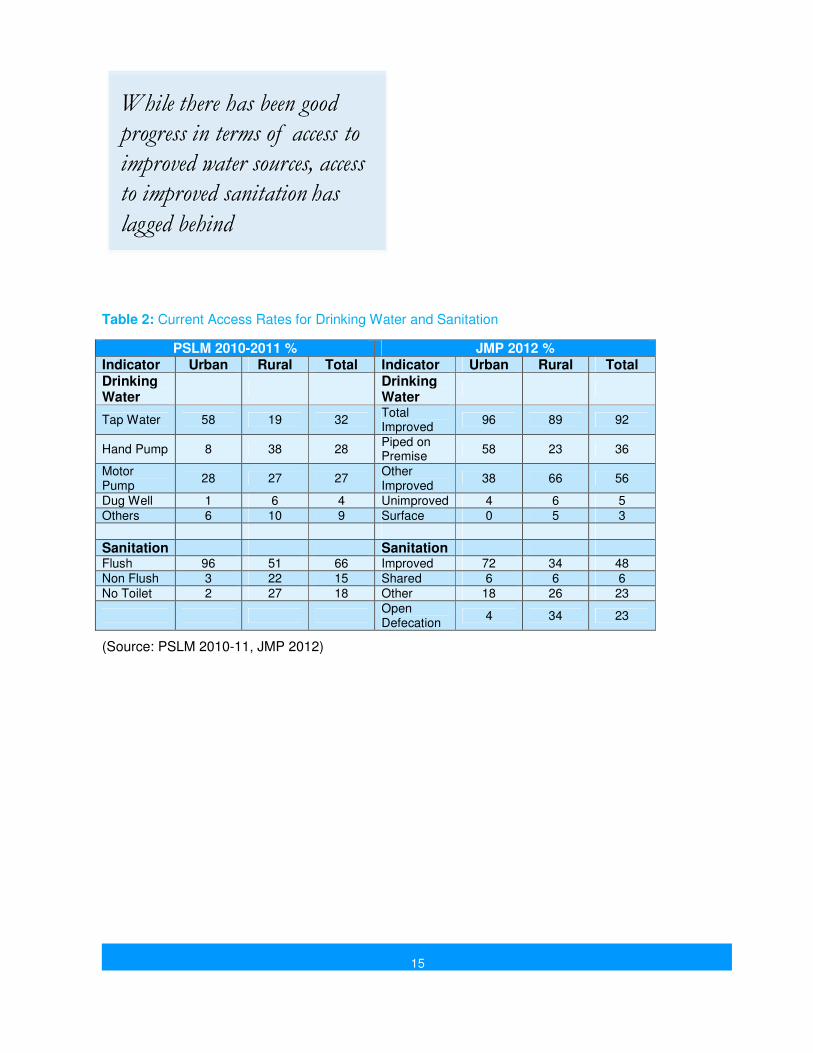
The variations are due to the different definitions used in the surveys. Further, the JMP 2012 report
used regression analysis based on PSLM 2009-10 data. The surveys shown in Table 2 provide
information about access but not about utilization.
15
Table 2: Current Access Rates for Drinking Water and Sanitation
PSLM 2010-2011 % JMP 2012 % Indicator Urban Rural Total Indicator Urban Rural Total Drinking Water
Drinking Water
Tap Water 58 19 32 Total Improved
96 89 92
Hand Pump 8 38 28 Piped on Premise
58 23 36
Motor Pump
28 27 27 Other Improved
38 66 56
Dug Well 1 6 4 Unimproved 4 6 5 Others 6 10 9 Surface 0 5 3
Sanitation Sanitation Flush 96 51 66 Improved 72 34 48 Non Flush 3 22 15 Shared 6 6 6 No Toilet 2 27 18 Other 18 26 23
Open Defecation
4 34 23
(Source: PSLM 2010-11, JMP 2012)
16
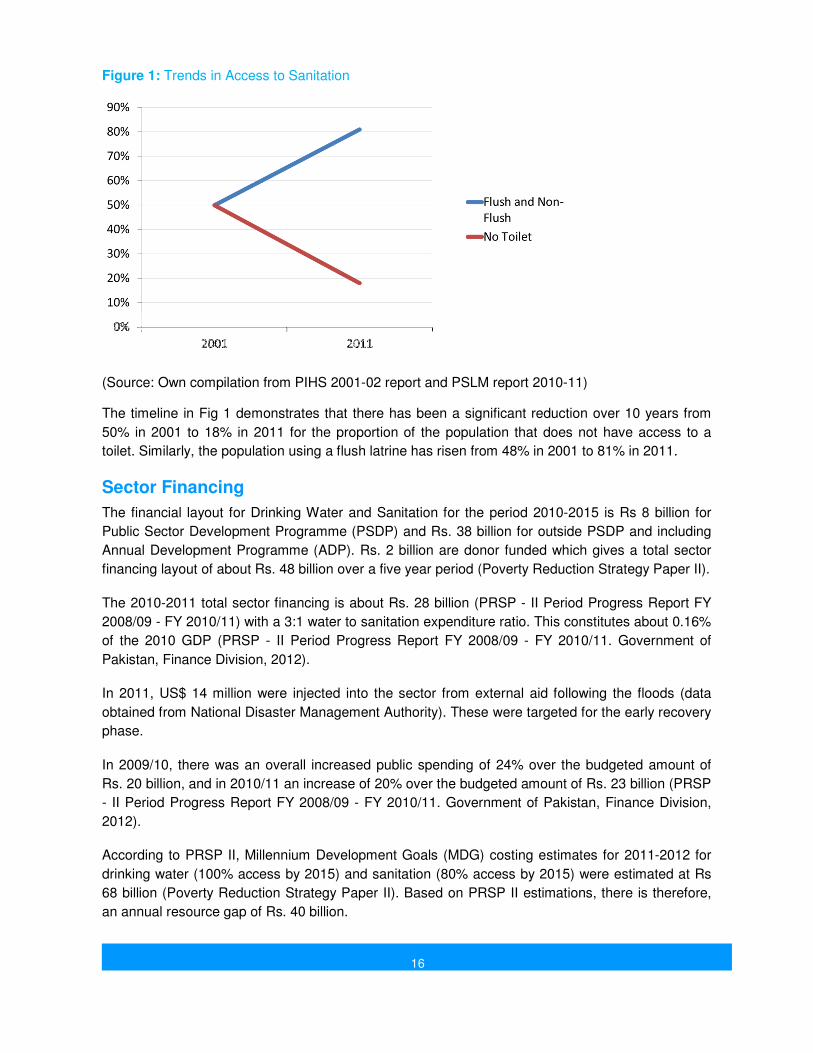
Figure 1: Trends in Access to Sanitation
(Source: Own compilation from PIHS 2001-02 report and PSLM report 2010-11)
The timeline in Fig 1 demonstrates that there has been a significant reduction over 10 years from
50% in 2001 to 18% in 2011 for the proportion of the population that does not have access to a
toilet. Similarly, the population using a flush latrine has risen from 48% in 2001 to 81% in 2011.
Sector Financing
The financial layout for Drinking Water and Sanitation for the period 2010-2015 is Rs 8 billion for
Public Sector Development Programme (PSDP) and Rs. 38 billion for outside PSDP and including
Annual Development Programme (ADP). Rs. 2 billion are donor funded which gives a total sector
financing layout of about Rs. 48 billion over a five year period (Poverty Reduction Strategy Paper II).
The 2010-2011 total sector financing is about Rs. 28 billion (PRSP - II Period Progress Report FY
2008/09 - FY 2010/11) with a 3:1 water to sanitation expenditure ratio. This constitutes about 0.16%
of the 2010 GDP (PRSP - II Period Progress Report FY 2008/09 - FY 2010/11. Government of
Pakistan, Finance Division, 2012).
In 2011, US$ 14 million were injected into the sector from external aid following the floods (data
obtained from National Disaster Management Authority). These were targeted for the early recovery
phase.
In 2009/10, there was an overall increased public spending of 24% over the budgeted amount of
Rs. 20 billion, and in 2010/11 an increase of 20% over the budgeted amount of Rs. 23 billion (PRSP
- II Period Progress Report FY 2008/09 - FY 2010/11. Government of Pakistan, Finance Division,
2012).
According to PRSP II, Millennium Development Goals (MDG) costing estimates for 2011-2012 for
drinking water (100% access by 2015) and sanitation (80% access by 2015) were estimated at Rs
68 billion (Poverty Reduction Strategy Paper II). Based on PRSP II estimations, there is therefore,
an annual resource gap of Rs. 40 billion.

17
Figure 2: Drinking Water and Sanitation Sectoral Expenditure Decadal Trend
(Source: Authors compilation, PRSP - II Period Progress Report FY 2008/09 - FY 2010/11)
Error! Reference source not found. illustrates a five-fold increase in overall sectoral expenditure
and about four fold increase in development expenditure. Using the GDP deflator values for 2004
and 2011, the overall increase in real terms is about three fold (State Bank’s Annual Report, The
State of Pakistan’s Economy 2010-11).
Development expenditure meand any expenditure on development projects or any expenditure on
new construction, whether of entirely new works or additions and alterations to existing works. It
also includes all repairs to newly purchased or previously abandoned buildings or works required for
bringing them into use and means expenditure on operations undertaken to maintain in proper
condition buildings and works in ordinary use.
Current expenditure means any expenditure that is not development.
There was a 15% increase in PRSP budgetary expenditures for the sector in 2009-10 over 2008-09,
and a 12% increase in 2010-11 over 2009-10 (PRSP - II Period Progress Report FY 2008/09 - FY
2010/11. Government of Pakistan, Finance Division, 2012). Balochistan achieved a 39% and 64%
increase respectively in the same reporting periods.
18
The sectoral contribution of water supply and sanitation in PRSP expenditures for FY 2008-09, FY
2009-10 and FY 2010-11 was 2.27%, 2.29% and 2.29% respectively. All sectoral expenditure was
under pro-poor allocation. Furthermore, there was a positive deviation of 215.5% in FY 2009-10 and
152.9% in FY 2010-11 for development expenditure in the sector (PRSP - II Period Progress Report
FY 2008/09 - FY 2010/11. Government of Pakistan, Finance Division, 2012).
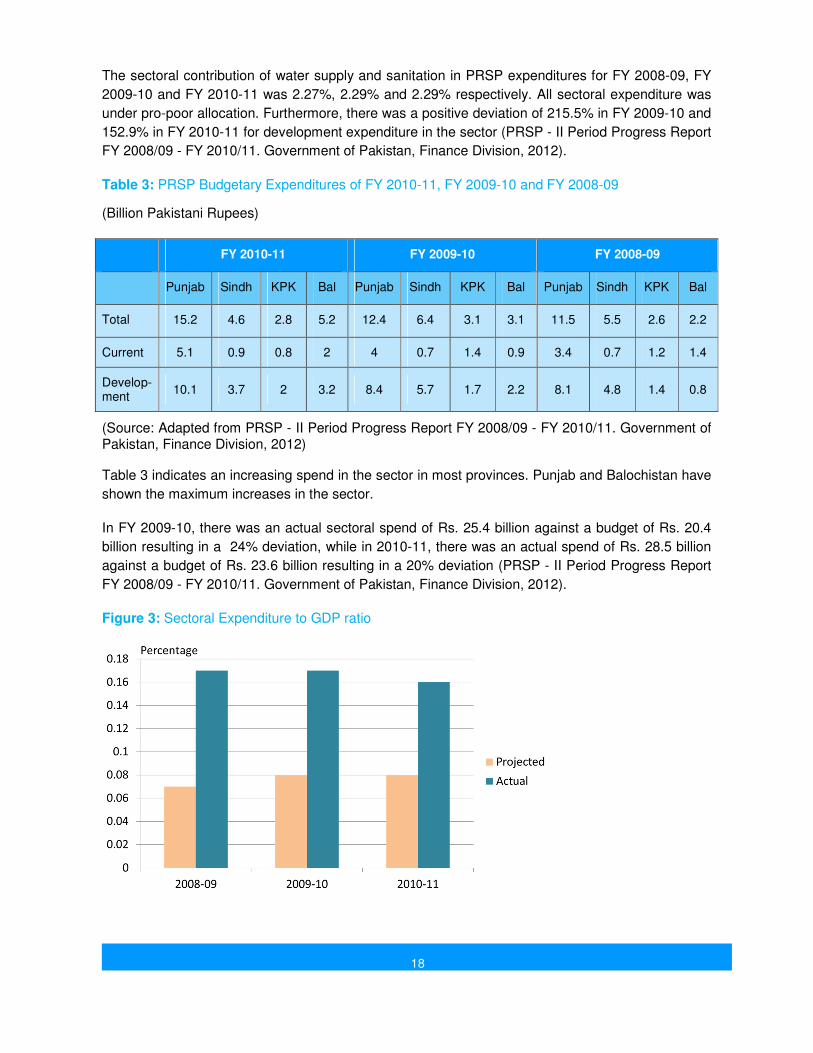
Table 3: PRSP Budgetary Expenditures of FY 2010-11, FY 2009-10 and FY 2008-09
(Billion Pakistani Rupees)
FY 2010-11 FY 2009-10 FY 2008-09
Punjab Sindh KPK Bal Punjab Sindh KPK Bal Punjab Sindh KPK Bal
Total 15.2 4.6 2.8 5.2 12.4 6.4 3.1 3.1 11.5 5.5 2.6 2.2
Current 5.1 0.9 0.8 2 4 0.7 1.4 0.9 3.4 0.7 1.2 1.4
Develop-ment
10.1 3.7 2 3.2 8.4 5.7 1.7 2.2 8.1 4.8 1.4 0.8
(Source: Adapted from PRSP - II Period Progress Report FY 2008/09 - FY 2010/11. Government of Pakistan, Finance Division, 2012)
Table 3 indicates an increasing spend in the sector in most provinces. Punjab and Balochistan have
shown the maximum increases in the sector.
In FY 2009-10, there was an actual sectoral spend of Rs. 25.4 billion against a budget of Rs. 20.4
billion resulting in a 24% deviation, while in 2010-11, there was an actual spend of Rs. 28.5 billion
against a budget of Rs. 23.6 billion resulting in a 20% deviation (PRSP - II Period Progress Report
FY 2008/09 - FY 2010/11. Government of Pakistan, Finance Division, 2012).
Figure 3: Sectoral Expenditure to GDP ratio

19
(Source: PRSP - II Period Progress Report FY 2008/09 - FY 2010/11. Government of Pakistan, Finance Division, 2012)
Error! Reference source not found. illustrates a trend whereby public expenditure to GDP ratios
effectively doubled from its projected ratios in each of the three financial years.
Figure 4: Access to Sanitation and Sectoral Public Expenditure
(Source: Authors compilation, based on PRSP reports, PSLM and JMP surveys and Sacosan IV country report)
Error! Reference source not found. clearly demonstrates a marked improvement in access to
ssanitation rates with increased public expenditure in the sector.
Sector Financing - Provincial Situation
Internal
In the provincial Annual Development Programmes for 2011-12, the highest proportion of the total
provincial ADP budget is seen in FATA (about 7.7% allocated to water and sanitation). The average
provincial proportionate allocation to drinking water and sanitation is about 5%.

20
Figure 5: Drinking Water and Sanitation Allocations as Proportion of Provincial ADP 2011-12
(Source: Authors compilation, based on provincial ADPs of 2011-12)
Error! Reference source not found. illustrates that provinces have allocated an average of 5% of
their annual development programme budget to drinking water and sanitation. FATA tops the list at
7.7% while AJK and Sindh are below 3%. However, there is indication that the Chief Minister of
Sindh is planning to launch a major waer and sanitation programme for the province and this
provisional allocation may change.
Figure 6: Provincial Allocations for Drinking Water and Sanitation in ADPs 2011-12
(Source – own computation from provincial ADPs of 2011-12)
Error! Reference source not found. shows the amount of budget allocated by the various
provinces for drinking water and sanitation in their annual development programme. Punjab has the
maxium allocation of Rs 10 billion, while KPK and Sindh are just under Rs. 4 billion. FATA and
Balochistan have allocated about Rs. 1 billion each.

21
Figure 7: Drinking Water and Sanitation 3 Years Trend of Total Sectoral Budget as Proportion (%) of Total Provincial PRSP Allocation
(Source – own computation from PRSP - II Period Progress Report FY 2008/09 - FY 2010/11)
Error! Reference source not found. illustrates provincial trends of proportion of PRSP budgets allocated to drinking water and sanitation. Balochistan demonstrates the highest allocation as a proportion of total provincial PRSP allocation (about 6%-7%).
Figure 8: Drinking Water and Sanitation 3 Years Trend of Sectoral Development Budget as Proportion (%) of Total Provincial PRSP Development Allocation
(Source: Authors compilation, based on PRSP - II Period Progress Report FY 2008/09 - FY 2010/11)
Error! Reference source not found. illustrates provincial trends of proportion of PRSP development budgets allocated to drinking water and sanitation. Punjab demonstrates the highest sustained trend of increasing sectoral development expenditure in its PRSP development allocations from 9% to 12% between 2009 and 2011.

22
Provincial Finance Commission
In wake of the Devolution Of Powers Plan and its subsequent implementation through Local
Government Ordinance 2001 vide section 120-B, the Provincial Finance Commission (PFC) was
established to allocate financial resources to the Districts from Provincial Allocable Amount on the
basis of:
1) Population
2) Backwardness
3) Lag in infrastructure
Equity being the spirit behind the institution of PFC, the weightage usually given to the above three
parameters is 60%, 20% and 20% respectively under the PFC Awards. The need analysis for
development and non-development requirements of the Districts is evaluated periodically.
The management of financial resources placed at the disposal of the District Government and their
further allocation and re-allocation is the jurisdiction of the Finance and Planning Office at the district
level. There is an officially conformed system of reconciliation of all receipts and expenditure
updated through various performa under Fiscal Transfer Rules.
23
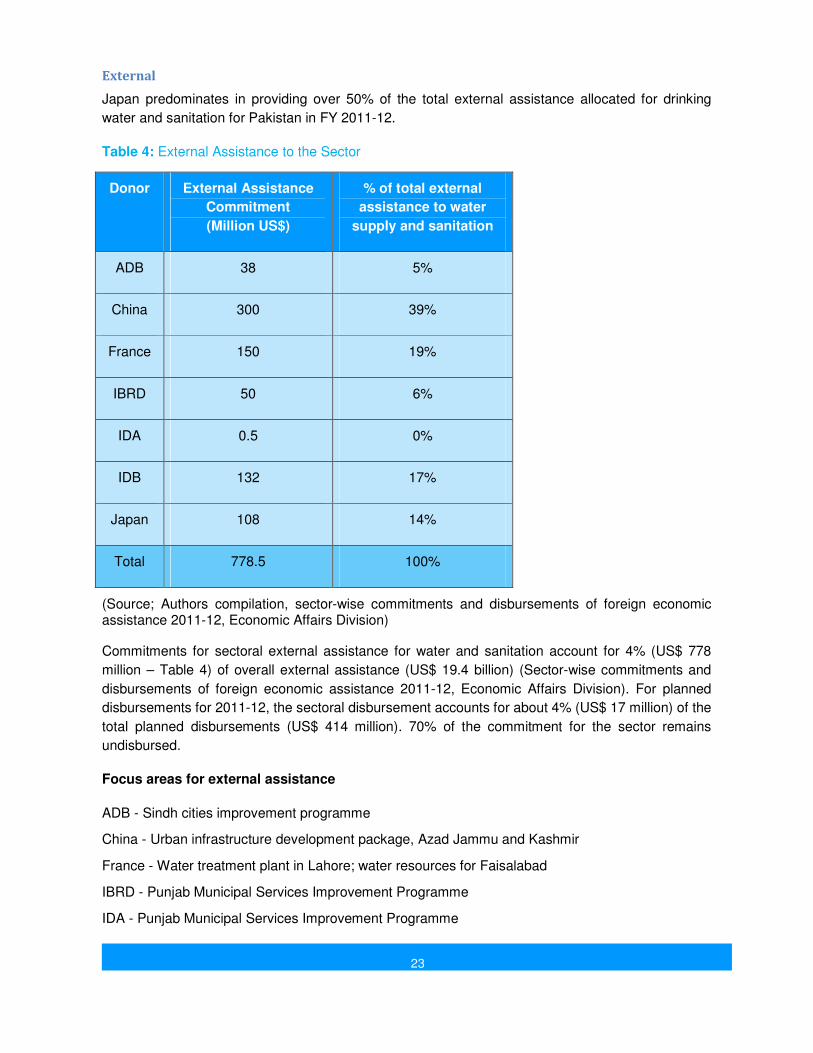
External
Japan predominates in providing over 50% of the total external assistance allocated for drinking
water and sanitation for Pakistan in FY 2011-12.
Table 4: External Assistance to the Sector
Donor External Assistance
Commitment
(Million US$)
% of total external
assistance to water
supply and sanitation
ADB 38 5%
China 300 39%
France 150 19%
IBRD 50 6%
IDA 0.5 0%
IDB 132 17%
Japan 108 14%
Total 778.5 100%
(Source; Authors compilation, sector-wise commitments and disbursements of foreign economic assistance 2011-12, Economic Affairs Division)
Commitments for sectoral external assistance for water and sanitation account for 4% (US$ 778
million – Table 4) of overall external assistance (US$ 19.4 billion) (Sector-wise commitments and
disbursements of foreign economic assistance 2011-12, Economic Affairs Division). For planned
disbursements for 2011-12, the sectoral disbursement accounts for about 4% (US$ 17 million) of the
total planned disbursements (US$ 414 million). 70% of the commitment for the sector remains
undisbursed.
Focus areas for external assistance
ADB - Sindh cities improvement programme
China - Urban infrastructure development package, Azad Jammu and Kashmir
France - Water treatment plant in Lahore; water resources for Faisalabad
IBRD - Punjab Municipal Services Improvement Programme
IDA - Punjab Municipal Services Improvement Programme
24
IDB - Reconstruction of rural housing
Japan - water system in Faisalabad, water supply Abbottabad, sewerage and drainage system Lahore, and water supply system Faisalabad
Donor Coordination and Sector Wide Approach
Sector Wide Approach (SWAp) is an approach to international development that "brings together
governments, donors and other stakeholders within any sector. It is characterized by a set of
operating principles rather than a specific package of policies or activities. The approach involves
movement over time under government leadership towards: broadening policy dialogue; developing
a single sector policy (that addresses private and public sector issues) and a common realistic
expenditure programme; common monitoring arrangements; and more coordinated procedures for
funding and procurement" (World Health Organization, World Health Report 2000).
Pakistan has national sanitation and drinking water policies, and the provinces are in transition
phases of finalizing their provincial policies and action plans. Pakistan Approach to Total Sanitation
(PATS) provides an overall framework for addressing the needs of Sanitation in the country.
However, there is still need to develop a broader framework outlining the needs of the Water and
Sanitation Sector, investment needs, monitoring processes and coordinated efforts.
There is a range of donors and partners working for Water and Sanitation in Pakistan who share
information with each other on need basis. National and Provincial Steering Committees for Drinking
Water and Sanitation were established but they are not very active. In the absence of an
overarching sectoral programme framework, it becomes challenging to determine performance and
contribution of the sector especially in terms of priorities and plans. There is therefore a need to
strengthen the component of information sharing on periodic basis and development of joint
programmes as done in case of the education sector in Pakistan. This will initiate the process of
developing SWAp for Water and Sanitation..
Key characteristics of the SWAp should include: i) the partner government clearly leads and owns
the programme; and ii) a common effort by external partners to support that programme, including
provision of all or a major share of funding for the sector, in support of the government's unified
policy and expenditure programme.
Over time, some SWAps progress towards using government procedures for implementation and
the disbursement of funds. In practice, most programmes are in the process of drawing in diverse
channels of funding, making the coverage of the sector more comprehensive, bringing ongoing
projects into line with sector priorities, developing common procedures and placing increased
reliance on government for management. Where SWAps are appropriate, they can help to promote
greater local involvement, accountability and capacity in partner countries.
25
Estimating Cost for Water Supply and Sanitation
The estimated costing for urban and rural water supply and sanitation was done using the following assumptions:
● Population growth rate 2%
● Using provincial per capita estimations for water supply schemes and rural sanitation after discussion with PHED departments
● Per capita cost of water supply scheme (average urban and rural) – Rs 4000
● Per capita cost of rural sanitation scheme with treatment (average urban and rural) – Rs 4000
● Developing back-end provincial estimations using PSLM 2010-11 data for % households with flush toilets and improved water. Estimating resource requirements for external infrastructure costs to meet access gap separately for urban and rural
● Apportioning resource requirements for 100% improved water coverage and 67%, 80% and 100% sanitation scenarios over 3 years
● Back-end provincial estimations were done for Balochistan, Khyber Pakhtunkhwa Punjab and Sindh, from which consolidated tables were developed
● The costing is an underestimate as cost estimates are an average figure which may vary dpending on population served, actual costs of hardware etc. Furthermore, the overall resource gap does not include FATA, AJK and Gilgit Baltistan as PSLM data for these was not available
● GDP estimations based on current nominal GDP of Rs 18 billion (US$ 200 billion at 1US$ = Rs 90) for 2010/11 (PRSP II Progress Report FY 2008-09 to FY 2010-11)
26
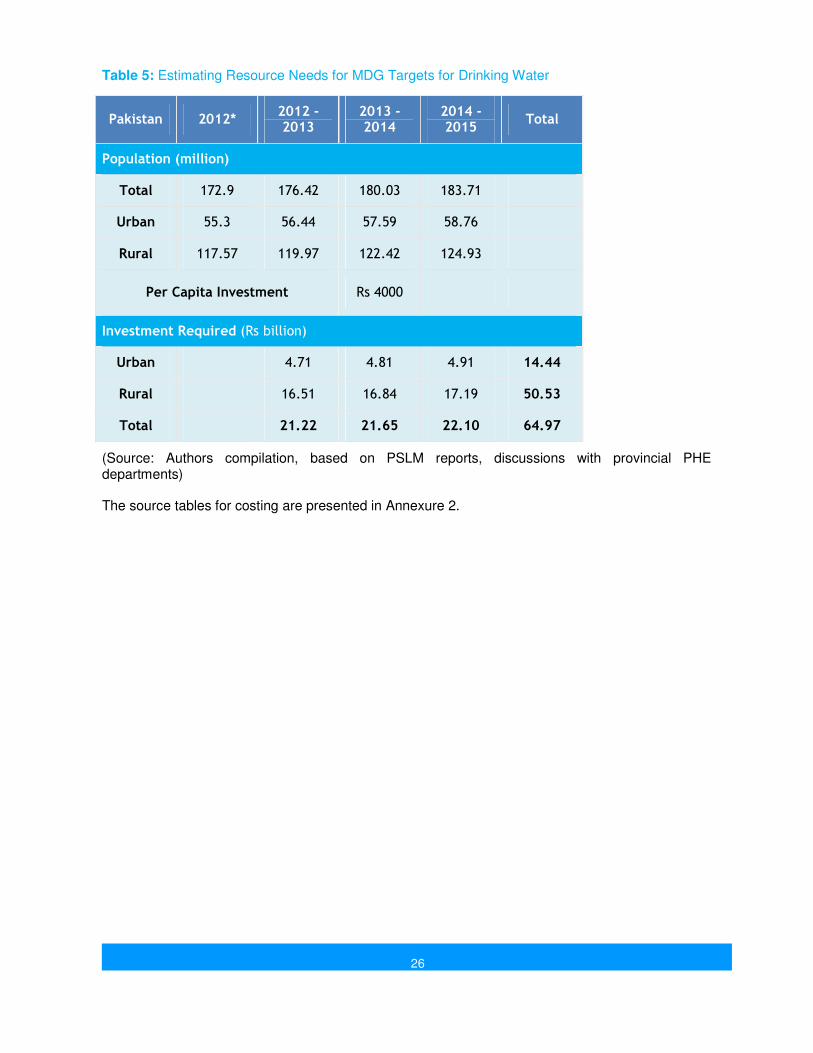
Table 5: Estimating Resource Needs for MDG Targets for Drinking Water
Pakistan 2012* 2012 -2013
2013 -2014
2014 -2015
Total
Population (million)
Total 172.9 176.42 180.03 183.71
Urban 55.3 56.44 57.59 58.76
Rural 117.57 119.97 122.42 124.93
Per Capita Investment Rs 4000
Investment Required (Rs billion)
Urban 4.71 4.81 4.91 14.44
Rural 16.51 16.84 17.19 50.53
Total 21.22 21.65 22.10 64.97
(Source: Authors compilation, based on PSLM reports, discussions with provincial PHE departments)
The source tables for costing are presented in Annexure 2.
27
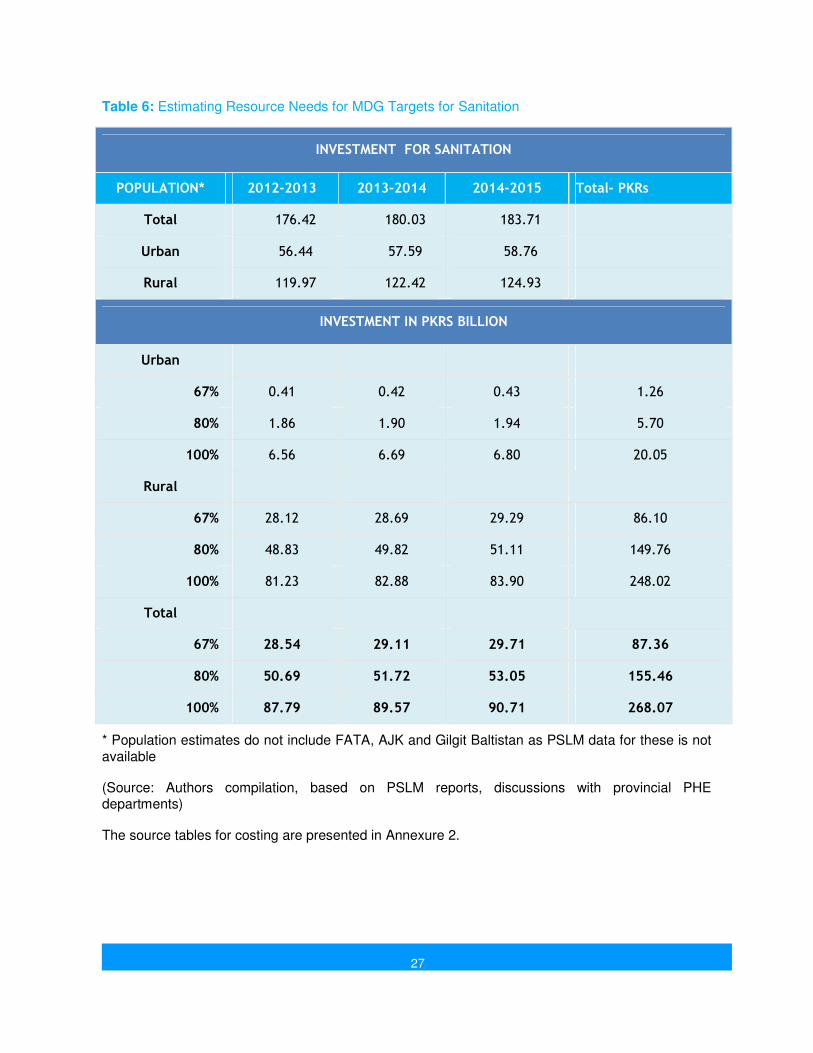
Table 6: Estimating Resource Needs for MDG Targets for Sanitation
INVESTMENT FOR SANITATION
POPULATION* 2012-2013 2013-2014 2014-2015 Total- PKRs
Total 176.42 180.03 183.71
Urban 56.44 57.59 58.76
Rural 119.97 122.42 124.93
INVESTMENT IN PKRS BILLION
Urban
67% 0.41 0.42 0.43 1.26
80% 1.86 1.90 1.94 5.70
100% 6.56 6.69 6.80 20.05
Rural
67% 28.12 28.69 29.29 86.10
80% 48.83 49.82 51.11 149.76
100% 81.23 82.88 83.90 248.02
Total
67% 28.54 29.11 29.71 87.36
80% 50.69 51.72 53.05 155.46
100% 87.79 89.57 90.71 268.07
* Population estimates do not include FATA, AJK and Gilgit Baltistan as PSLM data for these is not available
(Source: Authors compilation, based on PSLM reports, discussions with provincial PHE departments)
The source tables for costing are presented in Annexure 2.
28
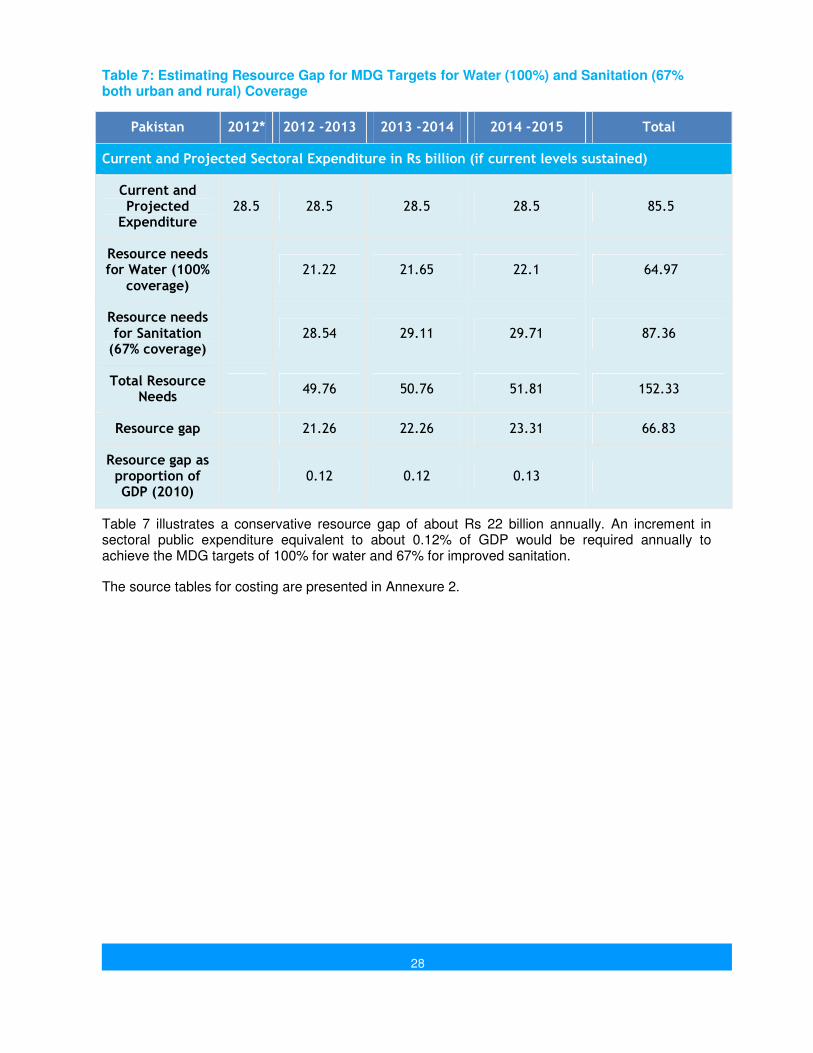
Table 7: Estimating Resource Gap for MDG Targets for Water (100%) and Sanitation (67% both urban and rural) Coverage
Pakistan 2012* 2012 -2013 2013 -2014 2014 -2015 Total
Current and Projected Sectoral Expenditure in Rs billion (if current levels sustained)
Current and Projected
Expenditure 28.5 28.5 28.5 28.5 85.5
Resource needs for Water (100%
coverage) 21.22 21.65 22.1 64.97
Resource needs for Sanitation (67% coverage)
28.54 29.11 29.71 87.36
Total Resource Needs
49.76 50.76 51.81 152.33
Resource gap 21.26 22.26 23.31 66.83
Resource gap as proportion of GDP (2010)
0.12 0.12 0.13
Table 7 illustrates a conservative resource gap of about Rs 22 billion annually. An increment in sectoral public expenditure equivalent to about 0.12% of GDP would be required annually to achieve the MDG targets of 100% for water and 67% for improved sanitation.
The source tables for costing are presented in Annexure 2.

29
URGENT NEED FOR ACTION
30
Urgent Need for Action
Health Impacts
Pakistan has a high Under 5 mortality rate of 86.5 per 1000. The Pakistan Demographic and Health
Survey 2006 found that 22% of children under five years of age had an episode of diarrhoea during
the two-week period preceding the survey, and 3% had diarrhoea with bloody stool.
The survey also found that children aged 6-11 months were the most vulnerable and were three
times more likely to have had diarrhoea than children aged 48-59 months. 11% of all deaths in
children under 5 years of age and 18% of all child deaths were due to diarrhoea.
Acoording to the Pakistan Social and Living Standards Measurement survey 2010-11, 11% of
children under 5 years had diarrhea within 30 days preceding the survey.
Based on data available, an estimated 35,000 to 55,000 children die annually in Pakistan due to
diarrhea (Pakistan Strategic Country Environmental Assessment – World Bank 2006; Pakistan
Demographoc and Health Survey 2006-07). This means that 100-150 children die every day
because of diarrhoea.
An estimated 25 million children and 50 million adults suffer from diarrhoeal morbidity annually in
Pakistan. A further 27,000 people die from Typhoid/paratyphoid related diarrhoea, while 1.35 million
have Typhoid/paratyphoid morbidity. Diarrhoea results in an estimated 2.5 million Disability Adjusted
Life Years (DALYs) in Pakistan (Pakistan Strategic Country Environmental Assessment – World
Bank 2006).
Pakistan is also one of the priority countries for control of Neglected Tropical Diseases (WHO
Report on Neglected Tropical Diseases 2010), especially Trachoma, which is an avoidable blinding
condition that is perpetuated in poor communities with inadequate water, poor sanitation especially
open defecation, overcrowding and dry and dusty environments. A district based prevalence of
Trachoma survey is currently underway to identify priority districts with high prevalence of active and
blinding trachoma.
The outbreaks of Dengue in Punjab and other provinces are a wake up call. Dengue flourishes in
small water collections in and around the house, in particular in drinking water vessels. Piped
drinking water can prevent the exacerbations from Dengue. In Punjab, over 12,000 people were
infected and close to 300 people died from Dengue. Hospital beds were full of infected patients.
The recent resurgence of polio in Pakistan, especially following the floods suggests pollution of
water reservoirs as one causative factor. Pakistan may be left as the last global outpost in the

31
control of polio. Hepatitis A and E are now endemic due to contamination of drinking water by faecal
matter (Malik IA et al, 1996).
Economic Impacts
The cost of diarrhoeal health impacts is determined using the human capital approach since both
diarrhoeal and typhoid mortality predominantly affects children. The cost of morbidity includes the
cost of illness (medical treatment, medicines, and value of lost time). About 50% of these costs are
associated with the value of time lost to illness (including care giving), and another 50% are from
cost of treatment and medicines (Pakistan Strategic Country Environmental Assessment – World
Bank 2006).
2.5 million DALYs are lost annually from diarrhoeal mortality and morbidity associated with
inadequate water, sanitation and hygiene. The annual economic loss was estimated at Rs. 114
billion by the World Bank in 2006 (Pakistan Strategic Country Environmental Assessment – World
Bank 2006).
Cost and impact analysis of water supply and environmental sanitation in Pakistan done by the
Pakistan Institute of Development Economics in 2002 revealed that if water supply facilities are
available to 90% of households and latrine facilities available to at least 60% of households in
villages, the Benefit to Costs ratio is 2.7 at 6% discount rate and 1.75 at 12% discount rate.
Recent data from the Economics of Sanitation Initiative supported by WSP suggests that the
economic impact of poor sanitation and water in Pakistan may be as high as 3.94% of GDP
(Pakistan Briefing: Economic impact of water and sanitation. Sanitation and Water for All, 2012).
A report from the World Bank on water and sanitation to reduce child mortality (Water and sanitation
to reduce child mortality, World Bank 2011) found that 25 deaths or more per 1000 children born
could be prevented by investing in water and sanitation infrastructure. This difference accounts for
about 40 percent of the gap between current child mortality rates and the 2015 target set in the
Millennium Development Goals. For Pakistan, the cost per Life Year Saved relative to GDP per
capita (in 2007) is about 20% which is highly cost-effective.
The report also found that the average cost per life-year saved ranges between 65 and 80 percent
of developing countries’ annual gross domestic product per capita. The results suggest that
32
investment in water and sanitation is a highly cost-effective policy option, even when only the
mortality benefits are taken into consideration. Taking into account the additional expected benefits,
such as reduced morbidity, time spending, and environmental hazards, would further increase the
benefit-cost ratio.
The WHO estimates that the return on US$1 investment is in the range US$5 to US$36, with a
global average of US$8 (Economic and health effects of increasing coverage of low cost household
drinking water supply and sanitation interventions to countries off-track to meet MDG target 10.
World Health Organization, 2007). Using meta-analysis, a reduction in diarrhoea frequency include:
• Improved hygiene - 37% reduction
• Improved sanitation - 32% reduction
• Improved water supply - 25% reduction
• Improved water quality - 31% reduction
• Multiple - 33% reduction
Economic benefits that arise from water and sanitation improvements include:
● Direct economic benefits of avoiding diarrhoeal disease - less expenditure on treatment of diarrhoeal disease and related health seeking costs
● Indirect economic benefits related to health improvement - value of avoided days lost at work or school, impact on school attendance of girls, avoided time lost of caretaker of sick children, and economic contribution of a saved life due to diarrhoeal disease
● Non-health benefits related to water and sanitation improvement - time savings related to water collection or accessing sanitary facilities; benefits to agriculture and industry of improved water supply; more efficient management of water resources
A per capita annual economic benefit of at least US$15 is achieved, if universal coverage for
combined water and sanitation interventions is done (Economic and health effects of increasing
coverage of low cost household drinking water supply and sanitation interventions to countries off-
track to meet MDG target 10. World Health Organization, 2007).
33

34
ENABLERS

35
Enablers
Policies
One of the key enablers for drinking water and sanitation is the presence of policies and strategies.
These include the national environment policy (2005), national sanitation policy (2006) and more
recently the national drinking water policy (2009).
The National Environment Policy provides a broad framework for addressing environment related
issues such as pollution of fresh water bodies and coastal waters, air pollution, lack of proper waste
management, etc, and to ensure effective management of environmental resources. The main goal
of the policy is to protect, conserve and restore the environment in order to improve the quality of life
through sustainable development.
This policy has acted as a precursor for the development the national sanitation policy and national
drinking water policy. In 2012, a new national climate change policy has been developed. The
combination of these three later policies will probably supercede the national environment policy.
National Sanitation Policy (2006)
The policy provides broad framework and guidelines to all governments to enhance and support
sanitation coverage in the country through the formulation of sanitation strategies, plans and
programmes for improving the quality of life of people and providing a healthy work environment.
The policy aims at safe disposal of excreta, liquid and solid waste.
In cities and towns, the policy places responsibility on city governments, development authorities,
Tehsil Municipal Authorities, private land developers and cantonment boards.
In rural areas, for settlements above 1000 persons, a component sharing model is proposed, while
for those less than 1000 persons, a Total Sanitation Model is prescribed.
Joint sanitation planning by stakeholders is advised, and guidelines indicated for quality and
monitoring.
National Drinking Water Policy (2009)
The goal of the policy is to provide adequate quantity of safe drinking water to improve the quality of
life by reducing incidence of death and illness caused by water borne diseases at an affordable cost
and in an equitable, efficient and sustainable manner by 2025.
The policy guidelines include increasing access particularly for unserved and under-served areas,
protecting and conserving water resources, water treatment and safety so that it complies to quality
standards, use of appropriate technologies, community participation and empowerment, raising
public awareness especially water safety, conservation and hygiene, building institutional and
community capacities, promoting public-private partnerships, and operational research to promote
best practice.
The policy makes special reference to emergency preparedness, coordinated planning and
implementation, guidelines for monitoring, and alludes to enactment of a water act.
At least two of the provinces have taken the national policies as guidelines and developed their own
policies and strategies. The Government of Punjab has framed an Urban Water and Sanitation

36
Policy (2007), while the Government of Balochistan framed a draft Provincial Sanitation Strategy
and Action Plan.
In 2010, the government released the national drinking water quality standards, which supplements
the national drinking water policy.
Figure 9: Schematic Diagram Illustrating Major Institutional Gaps
Fig 9 illustrates that while there is a preponderance of policies, strategies and standards, there are
institutional gaps in terms of action plans, regulations and legislations to enforce implementation of
policies and standards.
It is clear that various policy frameworks, guidelines and standards exist and provide an enabling
platform, at least in theory. In practice, however, several inconsistencies are noted which render the
enabling potential ineffectual. These factors are summarised in the diagram below.
There is lack of any exclusive legislation that covers water supply and sanitation. Furthermore, the
coverage of effluent quality and its disposal under the Environmental Protection Act (1997) is patchy
and fragmented. There is no legislation that adequately covers policy formulation, water regulation,

37
water quality, water and sanitation tariffs, coordination mechanisms between key stakeholders, and
development of water supply schemes.
The functions, administration and financial management of the offices of Local Government and
Rural Development Department, Urban Development, Public Health Engineering Department and
Housing and Physical Planning Department at the regional, zonal, circle, divisional, district, Tehsil
and lower levels are entrusted to the Tehsil/Taluka Municipal Administration, along with the
employees working in these offices.
The Water and Sanitation Agencies coming under the control of the District Government functioning
in a Tehsil/Taluka are decentralized to the concerned Tehsil/Taluka Municipal Administration.
The Water and Sanitation Authority or similar authorities functioning in a City District and coming
under the control of a City District are decentralized to the City District Administration or to towns in
a City District.
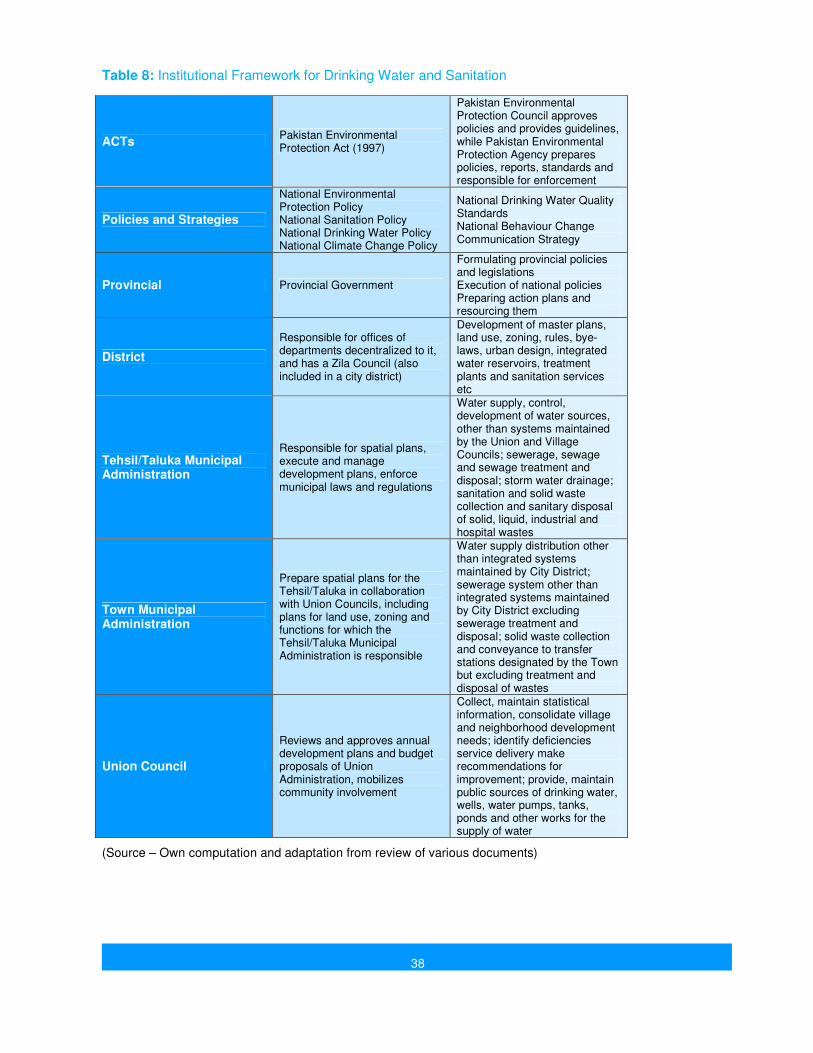
Table 8 below summarizes the institutional framework for drinking water and sanitation. It provides an overview of roles and responsibilities of various institutional levels of administration.
38
Table 8: Institutional Framework for Drinking Water and Sanitation
ACTs Pakistan Environmental Protection Act (1997)
Pakistan Environmental Protection Council approves policies and provides guidelines, while Pakistan Environmental Protection Agency prepares policies, reports, standards and responsible for enforcement
Policies and Strategies
National Environmental Protection Policy National Sanitation Policy National Drinking Water Policy National Climate Change Policy
National Drinking Water Quality Standards National Behaviour Change Communication Strategy
Provincial Provincial Government
Formulating provincial policies and legislations Execution of national policies Preparing action plans and resourcing them
District
Responsible for offices of departments decentralized to it, and has a Zila Council (also included in a city district)
Development of master plans, land use, zoning, rules, bye-laws, urban design, integrated water reservoirs, treatment plants and sanitation services etc
Tehsil/Taluka Municipal Administration
Responsible for spatial plans, execute and manage development plans, enforce municipal laws and regulations
Water supply, control, development of water sources, other than systems maintained by the Union and Village Councils; sewerage, sewage and sewage treatment and disposal; storm water drainage; sanitation and solid waste collection and sanitary disposal of solid, liquid, industrial and hospital wastes
Town Municipal Administration
Prepare spatial plans for the Tehsil/Taluka in collaboration with Union Councils, including plans for land use, zoning and functions for which the Tehsil/Taluka Municipal Administration is responsible
Water supply distribution other than integrated systems maintained by City District; sewerage system other than integrated systems maintained by City District excluding sewerage treatment and disposal; solid waste collection and conveyance to transfer stations designated by the Town but excluding treatment and disposal of wastes
Union Council
Reviews and approves annual development plans and budget proposals of Union Administration, mobilizes community involvement
Collect, maintain statistical information, consolidate village and neighborhood development needs; identify deficiencies service delivery make recommendations for improvement; provide, maintain public sources of drinking water, wells, water pumps, tanks, ponds and other works for the supply of water
(Source – Own computation and adaptation from review of various documents)
39
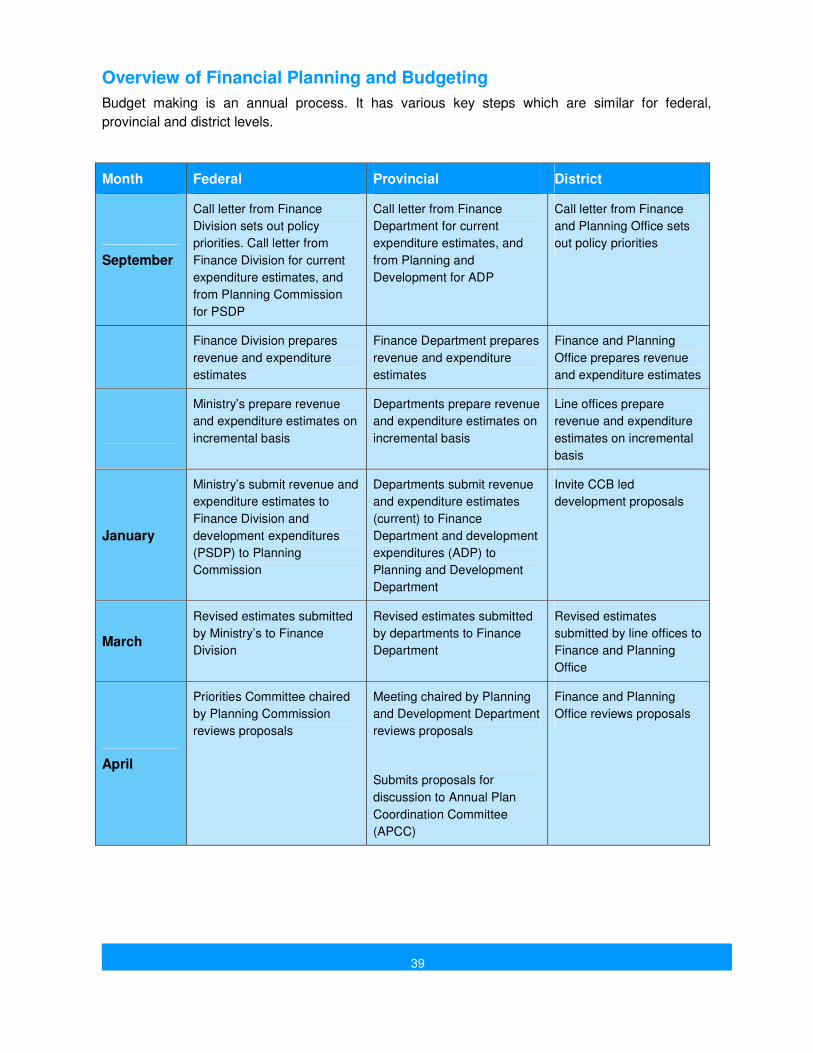
Overview of Financial Planning and Budgeting
Budget making is an annual process. It has various key steps which are similar for federal,
provincial and district levels.
Month Federal Provincial District
September
Call letter from Finance
Division sets out policy
priorities. Call letter from
Finance Division for current
expenditure estimates, and
from Planning Commission
for PSDP
Call letter from Finance
Department for current
expenditure estimates, and
from Planning and
Development for ADP
Call letter from Finance
and Planning Office sets
out policy priorities
Finance Division prepares
revenue and expenditure
estimates
Finance Department prepares
revenue and expenditure
estimates
Finance and Planning
Office prepares revenue
and expenditure estimates
Ministry’s prepare revenue
and expenditure estimates on
incremental basis
Departments prepare revenue
and expenditure estimates on
incremental basis
Line offices prepare
revenue and expenditure
estimates on incremental
basis
January
Ministry’s submit revenue and
expenditure estimates to
Finance Division and
development expenditures
(PSDP) to Planning
Commission
Departments submit revenue
and expenditure estimates
(current) to Finance
Department and development
expenditures (ADP) to
Planning and Development
Department
Invite CCB led
development proposals
March
Revised estimates submitted
by Ministry’s to Finance
Division
Revised estimates submitted
by departments to Finance
Department
Revised estimates
submitted by line offices to
Finance and Planning
Office
April
Priorities Committee chaired
by Planning Commission
reviews proposals
Meeting chaired by Planning
and Development Department
reviews proposals
Submits proposals for
discussion to Annual Plan
Coordination Committee
(APCC)
Finance and Planning
Office reviews proposals

40
Month Federal Provincial District
May
Appropriations Committee
chaired by Finance Division
discusses and finalizes sector
allocations
Meeting chaired by Finance
Department discusses and
finalizes sector allocations
Meeting chaired by
Finance and Planning
Office prepares draft
budget including proposed
budget and CCB schemes
June
Executive Committee of NEC
(ECNEC) chaired by Finance
Minister, approves large
federal and provincial projects
on recommendation of
Central Development
Working Party (CDWP)
National Economic Council
(NEC) chaired by Prime
Minister. Sets economic and
budgetary priorities for the
country. Federal budget
proposals presented,
provincial budgets also
discussed
Provincial Cabinet meets to
consider and approve budget
proposals
Debate and assent to the
finance bill as per Article 120
to 124 of the Constitution and
the rules of procedure of the
provincial assembly
Submits budget to District
Council
June
Annual Budget Statement
submitted to National
Assembly in accordance with
Article 120 of Constitution.
Laid before Assembly in the
form of a Finance Bill.
Once debated and approved
by Assembly, signed by Head
of Government, after which it
becomes the Finance Act for
the fiscal year
Similar process but with
provincial assembly
Authentication of the
Schedule of Authorized
Expenditure by the Chief
Minister
(Source: Adapted from Ahmad D, Asif A: A guide to underataking the budget in Pakistan, PIPS 2007; Briefing paper for Pakistan Provincial Legislators: Provincial Budget Process, PILDAT 2004 ; Report on provincial budget analysis and budget conferences in Pakistan. Participatory Development Initiatives and Actionaid International, 2009)
41
Examples of Best Practice
Changa Pani Programme (CPP) - Government
The Government of Punjab has taken an integrated approach for the provision of water supply and
sanitation through community participation on the basis of Internal and External Component Sharing
Model, which is articulated in the community participation dimension of the Punjab Urban Water and
Sanitation Policy. The CPP aims to design and implement a water supply and sanitation
programme, initially for providing an efficient, reliable, affordable and environmentally sustainable
system in a poor peri urban area of Lahore, Badar Colony UC 60 Lahore for 2800 households with
21,000 population.
This model is based on the developmental philosophy of the Orangi Pilot Poject (OPP), which was
translated in Punjab by the Urban Unit Planning and Development Department in collaboration with
Anjuman Samaji Behbood Faisalabad. The intervention focusses on environmental education,
health promotion programme and a community mobilization component. The government is taking a
lead in rolling out the CPP.
The internal and external institutional design and enabling policy context on which this programme
is based provides some key learning for the government, water utilities (WASAs) and international
development actors working in developing countries, especially the public sector water utilities in
Pakistan and in the region. The purpose of this initiative is to bring about a cumulative impact on
low-income communities and develop a replicable model in Punjab in light of the National Sanitation
Policy. This approach is now being further replicated in Faisalabad and Sahiwal.
Orangi Pilot Project
The Orangi Pilot Project (OPP) started in 1981 under the leadership of Dr Akhtar Hameed Khan. It
has demonstrated how community empowerment and active collaboration among different groups
and service providers including government agencies can facilitate low cost improved water and
sanitation services. The OPP has helped bring low-cost sanitation solutions to households in the
densely populated Orangi squatter settlement of Karachi, Pakistan.
By building up local NGOs that can plan and finance community latrines and house drains, the OPP
has been able to create sufficient demand to oblige the municipal authorities of Karachi to contribute
funding for more sewers. The OPP has now supplied quality sewerage to over 90% of the
households in Orangi.
The OPP is proof that we must not underestimate the effectiveness of collaboration between local
community groups and governmental authorities. The example from Orangi shows that cost sharing
is an important component of any development initiative.
Lodhran Pilot Project (LPP)
Low Cost Sanitation Model of LPP is based upon a component sharing approach. It is primarily a
replica of OPP's model but LPP has extended it in rural areas of Punjab with some enhancements.
There are two major components in this model - Internal Component and External Component. The
internal component comprises of household latrine, household connection through T-Hodi and lane
sewer and this component is the responsibility of the community. The external Component consists
42
of main sewer; disposal works and treatment plant and this component is constructed by the
relevant government department or donor agency.
LPP supported the Community-Led Total Sanitation approach in Bahawalpur, Rahim Yar Khan,
Lodhran and Kasur districts. LPP raised awareness among rural communities to cease open
defecation, adopt primary health and hygiene practices and promote a healthy and pleasant
environment.
A Water and Environmental Sanitation (WES) Committee is formed in each village which comprises
of 25 community members. This committee plays a vital role to impart awareness education to the
community. LPP builds capacity of the WES Committee as well as concerned departments like
TMAs, Union Councils, CBOs/NGOs etc. LPP uses some motivational tools for mobilizing the
community members to stop defecating in the open environment.
Community Led Total Sanitation (CLTS)
CLTS approach was first introduced in Pakistan at a national level workshop held in Bhurban in
2004 with the support of WSP - South Asia. Dr Kamal Kar, presented the approach and shared the
experiences from other countries in Asia.
The literature on CLTS was distributed to the interested people. A Mardan based local NGO, the
Integrated Regional Support Programme (IRSP), supported by UNICEF, took on the approach with
interest and enthusiasm. Later on, this approach was taken up further and Takht Bhai Municipal
Administration was involved as a partner. RSPN has played an important role in scaling up CLTS in
more than 20 districts with assistance from UNICEF and WSP.
CLTS is an effective approach for triggering action to change defecation behaviors at the community
level and to create demand for improved sanitation facilities. The steps identified under CLTS
include:
● Pre-triggering: selecting a community and developing a better-defined sense of the community
● Triggering: educating the community regarding the consequences of living in a fecally contaminated environment. Some of the triggering activities include defecation area transect, mapping of defecation areas, calculations of faeces and medical expenses, triggering disgust and indignation.
● Post-triggering: once the communities typically pledge to improve their sanitation by either becoming open-defecation free or by adopting improved sanitation technologies, there is a danger that these pledges do not come to fruition without follow-up work.
Pakistan Approach to Total Sanitation (PATS)
Under the policy instruments provided in the National Sanitation Policy of 2006, it is mentioned that
a Total Sanitation model for the provision of sanitation will be formalized and the procedures and
regulations for its implementation will be developed.
The Ministry of Environment set up a Core Group in August 2008 to propose a Pakistan-specific
model to achieve total sanitation in the country. This Core Group proposed PATS in 2010. PATS
uses "triggering" as an entry point and puts a larger focus on behavioural change toward sanitation
and hygiene. It uses communication as a strategic tool to bring about change in behaviour for
sustainable sanitation improvements in communities. PATS emphasizes the need for creating a

43
market for sanitation hardware and trained masons so that changed behaviour results in improved
sanitation indicators.
Communities are at the centre of the planning process for collective action, behaviour change,
application of triggers, follow-ups, certification, and market development. PATS discourages direct
subsidies and calls for a database for results-based monitoring. PATS encourages the use of
principles rather than methodology-based approaches, thus allowing the federal and provincial
governments greater programming flexibility to engage in meaningful discourse and exchange of
experience adapting context specific solutions as well as the across provinces.
North Sindh Urban Services Corporation (NSUSC)
The Sindh Cities Improvement Investment Programme (the Investment Programme or SCIP) aims
to improve water supply, wastewater management, and solid waste management (SWM) services in
clusters of secondary cities in Sindh Province, thus enhancing the urban environment, public health,
and economic opportunities for an estimated 4 million urban residents of participating secondary
cities.
This will be achieved through an integrated program of physical and nonphysical investments in
institutional reforms and priority infrastructure rehabilitation and improvements.
North Sindh Urban Services Corporation (NSUSC) has been established under the Companies
Ordinance 1984 for the secondary cities of Northern Cluster of Sindh Province initially focusing on
six districts. This Urban Services Corporation aggregates participating TMA's water supply, waste
water and solid waste management operation in a single institution to leverage economies of scale,
introduce new skills and management, and increase focus on operations, maintenance and financial
management.
Water and Sanitation Extension Programme (WASEP)
The Water and Sanitation Extension Programme (WASEP), initiated in 1997 by the Aga Khan
Planning and Building Services, Pakistan (AKPBSP), aims at providing infrastructure services.
Specific programme objectives focus on improving environmental health of local communities
through provision of safe water and sanitation facilities to local communities in Northern Pakistan
and Sindh.
WASEP's integrated intervention package includes:
1. Community mobilization and participation
2. Potable water supply infrastructure
3. Water quality management
4. Gray water drainage infrastructure
5. Household sanitation infrastructure; and
6. Health and hygiene education
As part of the Terms of Partnership, the community takes the responsibility for operation and
maintenance of the scheme once the infrastructure is installed, and contributes towards a cash
fund.

44
WASEP's approach therefore, not only provides physical infrastructure, but also promotes sanitation
and environmental health practices, while ensuring long-term sustainability of the infrastructure.
This integrated intervention model has been transferred successfully to several remote, unserved,
rural areas of Pakistan, facilitating participation of women in conservative settings. WASEP has
successfully managed to build a culture of "payment for water use" using innovative techniques to
ensure stability.
Citizen Report Card
The Karachi Water and Sewerage Board (KW&SB) has evolved over time from the Karachi Joint
Water Board Ordinance 1949, the Karachi Joint Water Board constituted in 1953, after which the
project execution was entrusted to the Karachi Development Authority (established in 1957), while
distribution and retailing of treated water remained with the Karachi Municipal Corporation (KMC),
some 22 other independent agencies and bulk users.
A Karachi Water Management Board was created in 1981 and given water distribution responsibility
for the metropolitan area and enhanced powers of cost recovery. In 1983, KW&SB was created
within KMC, and was assigned responsibilities for water supply and sanitation services within
Karachi. In 1996, KW&SB Act was enforced which separated KW&SB from KMC. In 2001, after the
Sindh Local Government Ordinance, KW&SB was now merged into the new setup of the city district
government. However, KW&SB still continues to function under the 1996 Act.
A project designed to test the feasibility of using a Citizens Report Card was undertaken in
collaboration with KW&SB and supported by WSP to gain insights about perceptions and attitudes
of citizens towards services, and identify local issues pertaining to water and sanitation in Karachi.
A quantitative survey of 4500 households was conducted in 9 towns of Karachi covering the north,
south, central, north east, and south west areas of the city representing low, middle and high
income groups. Eight themes were analyzed:
● Availability, access and use of services
● Reliability of services
● Perceptions on water quality
● Costs incurred by customers
● Interactions with KW&SB
● Transparency in service provision
● Satisfaction with services
● Priority areas for improvement
Key findings revealed that KW&Sbs services were found satisfactory and above average by 6.5% of
users, and that both users and utility staff want improvement in systems and services.
The project has built in a strong demand side advocacy component and a supply side willingness to
reform.
45
Formalizing Rural Water Supply Billing Systems
Rural communities have generally considered the provision of safe drinking water the responsibility
of the public sector rather than their own. This poses several challenges, not the least of which is
the cost-effectiveness and sustainability of water supply schemes.
The Punjab Community Water Supply & Sanitation Project, supported by Asian Development Bank,
has tested an innovative approach of making communities pay for the water they drink by
introducing a formal mechanism for water metering in rural water supply schemes in some
marginalized rural communities in Punjab.
The model was piloted in a small village of Varo in the district of Chakwal. Communities were
mobilized and introduced to the advantages of water metering, particularly as they concern water
conservation and reduction of household expenditures. The project assisted the community in
procuring dry water meters from the nearby city of Lahore and trained a person among the villagers
as a plumber. This person was made responsible for proper installation of the water meters. The
total cost of installation per household ranged between PRs.1,200-1,600, inclusive of the meter
cost.
Once the water meters were installed, the community designated office bearers who became
responsible for bill collection and the operation and maintenance of the scheme. The bill was
collected from each household based on the units consumed, with the price per unit determined by
dividing total monthly operating expenses by total number of water units used. The project proved to
be a great success.
The approach was replicated in two more villages in Chakwal. Majority of communities followed
what villagers in Varo did; however the residents of village Balkasar proved to be more innovative
when it came to collection methods.
The Balkasar community reached an arrangement with the local bank to deposit their bills directly to
the bank. The bank charges Rs. 5 per bill as a service charge and the community has also imposed
a fine of Rs. 20 per month on late submission of bills. For chronic defaulters, the penalty was
disconnection.
The concept that was initially applied in three villages of district Chakwal proved to be a winner. It is
now being replicated in fifteen more villages of district Chakwal on community demand.
Converting Waste into Resource - Waste Management Industry
Private sector firms have initiated projects based on organic and in-organic waste management.
Organic waste is used to produce organic fertilizer. Inorganic waste is first sorted into paper, plastic,
tin, etc, and it is then sold to respective industries where it is recycled to make products such as;
Plastic Wood and Tetra Sheets.
In Pakistan there is immense potential to convert waste into resource for the economy. In this
regard, some NGOs (e.g. Gul Bahao and Pakistan Environment Welfare and Waste Recycling Trust
- PEWWRPT) and private firms (e.g. Farooq Compost Fertilizer Corporation and Shanghai Shun
Gong Environmental Protection Limited) have already stepped into the industry. These
organizations collect waste and reprocess it to produce fertilizer, plastic bottles, and tetra packs.
A private firm has established a recycling facility in Lahore where it is engaged to produce a refuse-
derived fuel (RDF) based on the concept of waste-to-energy. Similarly an NGO in Karachi
46
encourages people to sell their waste to them and prepares soil-conditioning fertilizer. Another NGO
is engaged in collecting urban waste in major cities of the country. It squeezes waste in order to dry
it and finally produces waste pellets from it. The extracted liquid from organic waste is sold in market
as liquid plant nutrient.
In Lahore, the city district government has formed the Lahore Waste Management Company that is
collaborating with Turkey on a waste disposal system for the city.

47
Intersectoral Collaboration Opportunities
Education
The National Sanitation Policy 2006 of Pakistan recommends a sanitation training/awareness
raising programme at all educational and teachers training institutes. The National Education Policy
2009 lays emphasis on a school health programme along with health education.
With the support of United Nations Programme for Pakistan, the school health initiative has been
piloted in selected districts of four provinces, and school health education materials have been
developed. The materials include the importance of hand washing and clean drinking water.
However, these training materials have not been institutionalized in pre-service and in-service
teachers training curriculum as envisaged in both national policies.
Similar kinds of successful experiences and demonstrations have been made by other INGOs and
National NGOs of Pakistan but these have rarely been scaled up. The Ministry of Environment
initiated work with Ministry of Education to develop standards for water and sanitation to be included
in the curriculum and training programme but progress was halted after the devolution of both
ministries to the provinces. In Punjab, the provincial government launched a school health
programme with deployment of 2500 health and nutrition supervisors (HNS) responsible for initial
health screening of students in schools along with health education. Each HNS is responsible for
primary and elementary schools located in a union council. In Balochistan province, the health
education material has been produced in collaboration with the provincial Curriculum Wing of
Education.
Health
Clean drinking water and sanitation is one of the eight basic components of Primary Health Care
(PHC). The Government of Pakistan has been supporting the National Programme for Family
Planning and Primary Health Care with deployment of 100,000 Lady Health Workers (LHWs) across
the country with a key focus on the rural population.
A LHW is responsible for 1000-1200 population or nearly 125-150 households. She visits 5-6
households each day to provide necessary health education in the areas of family planning,
reproductive health, infectious diseases and child health issues. She generates a monthly progress
report of her work, which feeds into the National Health Management Information System (NHMIS).
The knowledge about hand washing and sanitation is provided in the training conducted for LHWs
at the time of induction and later on during the refresher courses.
The experiences of many of the early recovery programmes demonstrated that LHWs could play a
significant role in creating demand for the construction of latrines. Recent experience from
Faisalabad has shown that awareness raising campaigns run by LHWs have helped to improve
sanitation and health for both farmers and consumers (Mobilizing Lady Health Workers for safer
food in Faisalabad, Pakistan — International Water Management Institute 2011). There is need to
review the current training material and techniques for improved sanitation imparted to the LHWs.
An alignment will not only help institutionalize sanitation in the primary health care programme but
also strengthen the surveillance for diarrhoea.

48
BOTTLENECKS

49
Bottlenecks
Institutional Arrangements
Two key events have influenced the development, management, fragmentation and overlap of roles
and responsibilities in the water and sanitation sector in the last twelve years.
‘Water’ and ‘Sanitation’ as sectoral subjects are not specified in the Federal or Concurrent Lists of
the Constitution of Pakistan. This implies that they are provincial subjects and the responsibility of
provincial governments. Following the Local Government Ordinance of 2001, provincial
governments devolved authority for water supply and sanitation service provision to the district and
tehsil local governments, but retained responsibility for policy making.
The current state of affairs reveals a mix of service providers with unclear roles and responsibilities.
At the urban level, water supply and sanitation services are simultaneously handled by the
respective development authority, water and sanitation authority (WASA), tehsil municipal
administration, cantonment board, and private land developer. This results in ad-hoc sanitation
planning, loss of revenues from non-revenue water, blurred zones of responsibility, overlapping of
roles and responsibilities, and complicates monitoring and reporting. Responsibilities for operation
and maintenance and water quality are ill-defined.
Furthermore, on the one hand there is an increase in urban and peri-urban populations , while on
the other the administrative definition of rural area is still applied to some settlements which by all
standards and definitions are now clearly urban, for example Sialkot and Bahawalpur. This results in
even more blurred roles and responsibilities of duty bearers.
The second event was the 18th constitutional amendment in which the Ministry of Environment,
among other ministries at Federal level, which was the lead ministry for water and sanitation was
devolved to the provinces, but the responsibility for the national drinking water and national
sanitation policies handed over to the Ministry of Disaster Management.
At the federal level, the planning commission is the vanguard for national development planning
through their poverty reduction strategy papers and medium term development frameworks. The
provinces have planning and development departments that undertake macro planning for water
and sanitation in the province.
The coordination and representational role that had been the responsibility of the former Ministry of
Environment ceased to exist with the result that there is ambiguity about a national motif upon which
national policy and action planning can take place. The Ministry of Disaster Management has been
given the role of facilitation, coordination and representation.

50
Water and Sanitation Agencies
(Adapted from Ahmad ZS: Sector survey on water supply planning in Pakistan. JICA, 2009)
Gujranwala WASA (GWASA)
GWASA is currently working with a total staff of 448 against the approved strength of 638. As such,
about 30% different slots are vacant.
GWASA is seriously constrained for qualified staff. There are only five graduate engineers to look
after the technical affairs of utility. The low quality of human resource and allied inefficiencies
apparently mar quality of service delivery.
GWASA has reported a very high percentage of non-revenue water of about 58 %. This is mainly
due to illegal connections, insufficient recovery (only 40 % of the billed amount) and inadequacy of
recording water generation, consumptions and system losses.
The operating ratio for GWASA is also high (1.61) due to low recovery and high operational cost. As
an average utility is suffers a short fall of Rs. 62 million per annum in operating expenses only.
GWASA does not have development plans based on current trends and future land use patterns.
GWASA has identified 5 water supply projects which are proposed to be implemented in short term
during next 2 to 3 years. The total estimated cost of identified projects is Rs. 467 million.
Multan WASA (MWASA)
The approved staff strength of MWASA is 1,547 of varying cadres. Currently, MWASA is working
with a total staff of 1,037; including regular employees (504), staff on contract (517) and also some
on deputation (16). About 37% slots are still vacant.
There is an independent water supply directorate headed by one Director and assisted by 3 senior
engineers of deputy director ranks.
MWASA has reported the figure of 30 % as non-revenue water. The operating ratio for MWASA is
very high (1.5) due to low recovery and high operational cost.
Faisalabad WASA (FWASA)
FWASA is currently working with a total staff of 2,091. These include 1,405 regular, 293 on contract
while 393 are employed on work charge basis. It has been reported that around 250 sanctioned /
budgeted seats of varying cadres are lying vacant due to multiple reasons including budgetary
constraints.
FWASA has reported non revenue water of about 24% on account of system losses through
leakages and pilferage of water through illegal connections.
FWASA is maintaining a relatively good operating ratio (0.99).

51
Rawalpindi WASA (RWASA)
RWASA is currently working with 1,020 staff of varying cadres. Of these, more than 750 staff are
responsible for the development, operation and maintenance of water supply system.
RWASA has reported 37 % unaccounted for water and 39% non-revenue water. RWASA shares
similar reasons of high value of non revenue water that includes illegal connections, insufficient
water recovery and inadequacy of recording water consumptions and system losses.
Hyderabad WASA (HWASA)
HWASA is currently working with a total staff of 2,463. These include 366 regular, 648 on contract /
work charge basis and 1,449 workers on work charge basis.
In addition to this strength, 67 officials including 17 officers are also working for water supply and
sanitation related works in "Directorate of Water Supply and Sewerage Project" under Hyderabad
Development Authority.
HWASA has reported non-revenue water as 60% and unaccounted for water as 30%.
Table 9: Summary of WASAs
GWASA MWASA FWASA RWASA HWASA CDA
Population in service area (millions)
1.6 1.9 2.8 2.1 1.7 1.5
Water supply coverage %
28% 65% 53% 70% 95% 95%
Average hours water availability per day
14-16 6-8 6 6-8 2-3 2-3
Current water demand (MGD)
64 170 130 44 60 80
Actual water production capacity (MGD)
29 104 45 42 60 68
Number water connections
30125 36396 107805 88710 115918 57930
Non revenue water %
58% 30% 24% 39% 60% 40%
(Source: Ahmad ZS: Sector survey on water supply planning in Pakistan. JICA, 2009)
Table 9 summarizes the current situation of different WASAs and highlights the deficit in production
capacity versus demand, and the significant proportion of non-revenue water.
52
Operation and Maintenance
Urban Water Supply and Sewerage Schemes
Operation and maintenance water supply and sewerage (WSS) schemes is one of the main
bottlenecks impeding progress in the sector.
Given the demographic transition towards urbanization, the urban water supply and sanitation
sector is a critical component of the broader sector. Rapid urbanization has given birth to several
small towns with 50,000-100,000 inhabitants.
Urban WSS can be viewed in the context of large cities with populations ranging from 1.9 to 9
million, intermediate cities with populations between 250,000 to 800,000, and smaller urban
settlements between 25,000 and 250,000 populations.
In Punjab, for instance, 5 large cities have Water and Sanitation Authorities (WASAs). These
include Lahore, Faisalabad, Multan, Gujranwala and Rawalpindi. All other areas have Tehsil
Municipal Administrations including cities like Sialkot and Bahawalpur which have populations of
more than half a million.
Under the Local Government Ordinance 2001, PHED was responsible for development of new
urban WSS schemes, which on completion are to be handed over to TMAs for operation and
maintenance.
The urban WSS schemes face several problems. These range from frequent blockage of sewers
due to inadequate maintenance, to uncontrolled raw sewage generated by the households of low
income areas that flows either directly into residential lanes, or into small open or covered drains, or
into sewers along these lanes, or accumulates to form ponds, or percolates into shallow
groundwater contaminating the aquifer often used by households for their water supply.
Before devolution, Town Municipalities / Committees were responsible for WSS functions of their
respective towns. However, after devolution, TMAs were made responsible for water and sanitation
functions of urban as well rural areas falling under the whole tehsil without building appropriate
management structures, human resource development, and strengthening technical, managerial
and financial capacities.
Since the TMAs are not involved in the planning of WSS schemes, there is a reluctance to take
these up from PHED once completed, some of which according to TMAs have technical flaws. The
inability of the TMAs to maintain and operate WSS schemes due to financial and capacity issues
compounded by the challenge of coordination between TMAs and PHED remains a major
bottleneck.
Rural Water Supply and Sewerage Schemes
Rural water supply schemes have traditionally funded by provincial governments through their
Annual Development Programmes. PHED has been responsible for planning, designing and
execution of these schemes. Up to the early 1990s, the operation and maintenance was also the
responsibility of PHED on completion and the costs were provided by the provincial governments.
However, after 1991, the responsibility for operation and maintenance of new schemes was wholly
and solely handed over to the communities. The provincial governments continued to bear the cost
53
of major repairs up to early 2000. Presently, rural water supply schemes are being maintained by
User Committees / Community Based Organizations on self-help basis.
Various studies and situation analysis reports have shown that about a third or more of rural water
supply schemes are dysfunctional or non-functional (National Water Quality Monitoring Programme,
Water Quality Status in Pakistan, Phase I-V, 2001-2006, Pakistan Council of Research in Water
Resources). Some of the main reasons for this e.g. in Punjab are:
● Source failure - 25%
● Major defects in machinery / rising main / distribution network - 24%
● No payment of WAPDA dues or disconnection - 17%
● Theft of major components like electric motor, transformer - 9%
● Community conflict, poor service delivery, poverty - 25%
(Source: Adapted from National Water Quality Monitoring Programme, Water Quality Status in
Pakistan, Phase I-V, 2001-2006, Pakistan Council of Research in Water Resources)
The causes of dysfunction or non-function may be classified as technical reasons (half the cases)
and financial and management or social in a quarter of cases each. The TMAs do not have
sufficient capacity to operate and maintain rural water supply schemes.
Presently, the PHED Technical and Community Development staff provide technical and
management support to Community Based Organizations (CBOs) who are operating & maintaining
functional rural water supply schemes on self-help and self-financing basis.
While the provincial governments are investing substantial amounts in development of new rural
water supply schemes, there is a pressing need to rehabilitate dysfunctional schemes where
feasible, and ensure that there is adequate administrative, financial and technical support to
communities for completed schemes.
54
Equity and Inclusion
There is insufficient information available on inequity mapping which serves as a major impediment
in planning water supply and sanitation schemes in areas that are most in need.
A national workshop on gender mainstreaming in WASH, held in recognition of the National Year of
Environment in 2009 in collaboration with Ministry of Environment, UNICEF, UN Habitat, UNIFEM
and PIEDAR, found that current programming and budgeting practices in the public sector are not
gender sensitive. Access and utilization data is not disaggregated by gender. The forum
recommended gender mainstreaming in water and sanitation policies, programmes and projects
(Proceedings of National Workshop on Gender Mainstreaming in WASH, 2009).
Equity is recognizing that people are different and need different support and resources to ensure
their rights are realized. The measures must often be taken to compensate for specific
discrimination and disadvantages to ensure fairness. At a local level this means looking at relative
disparities or disadvantages within families and communities, understanding exactly what barriers
are faced by disadvantaged people in accessing services, and developing ways to overcome these
barriers. At national level it means understanding the dynamics that result in certain advantages
over others or certain sections of the population enjoying greater political influence, etc (Framework
for equity and inclusion. WaterAid 2010).
Inclusion is about a holistic way of working for development interventions. The process of inclusion
is not just about improving access to services, but also supporting people – including those who are
discriminated against and marginalized – to engage in wider processes to ensure that their rights
and needs are recognized (Framework for equity and inclusion. Wateraid 2010). Groups that are
likely to be marginalized and therefore need a special focus in WASH programmes:
55
• Women
• Children
• Older people
• People with disabilities
• People living in chronic poverty
• Minorities and indigenous people
• People with chronic illness, HIV AIDS
Equity and Inclusion are interrelated and interlinked. The discussions with stakeholders revealed
that decisions about WASH are guided and influenced by political priorities prevailing at the time.
The wish list of WASH prepared on the basis of information shared by the districts or local bodies of
government institutes is not followed in many instances and even the master plans are not adhered
to. The information about the coverage and access of WASH is available at the provincial level but it
is rarely linked with equity indicators. This process can be strengthened by:
• Conducting an equity based district-wise mapping of Pakistan for WASH would be desirable
to identify the pockets and places in need of WASH but are currently disadvantaged
• Improving the understanding of the political leadership and government institutions about
equity and inclusion issues
Quality
While survey statistics present an optimistic picture about access to improved water sources in line
with MDG targets, both in urban and rural areas, the safety and quality of drinking water paints a
contrasting and highly worrisome scenario.
Studies done by the Pakistan Council of research in Water Resources (PCRWR) on drinking water
quality monitoring in the country revealed that the water resources of Pakistan are facing four major
water quality tribulations: bacteriological contamination (68%); arsenic (24%); nitrate (13%); and
fluoride (5%) (National Water Quality Monitoring Programme, Water Quality Status in Pakistan,
Phase I-V, 2001-2006, Pakistan Council of Research in Water Resources).
Examination of 357 diverse water sources revealed that only 13% were found ‘safe’, while the
remaining 87% were ‘unsafe’ for drinking purposes. The water samples collected from 23 surface
water bodies were all bacteriologically contaminated (National Water Quality Monitoring
Programme, Water Quality Status in Pakistan, Phase I-V, 2001-2006, Pakistan Council of Research
in Water Resources).
Results from the above surveys of the rural water quality monitoring of 48 tehsils out of 64 to be
monitored showed, that 80-85 % water samples are bacteriologically unsafe for drinking.
The situation is further compounded by ageing infrastructure, especially those where GI pipes have
been used which have useful life of less than 20 years.

56
73% of 74 brands of commercially available bottled drinking water were found to be safe (Bottled
Water Quality, Quarterly Report Oct-Dec 2011, Pakistan Council of Research in Water Resources).
The principal source of drinking water for the majority of people in Pakistan is groundwater.
According to the Pakistan Strategic Country Environmental Assessment Report 2006, the ‘per
capita’ water availability in Pakistan decreased from 5,000 in 1951 to 1100 cubic meter per annum
by 2006. These estimates suggest that there is a high likelihood that the country will slip below the
limit of 1000 cubic meters of water per capita per year from 2010 onwards.
The situation could get worse in areas situated outside the Indus basin where the annual average is
already below 1000 cubic meters of water per head (State of Environment Report, 2005).
About 80% of Punjab has fresh groundwater, but in Sindh, less than 30% of groundwater is fresh. In
Khyber Pakhtunkhwa (KPK), increasing abstraction has resulted in wells now reaching into the
saline layers. Balochistan has saline groundwater.
The proportion of the rural population that depends on a dug well or a river, canal or stream ranges
from 7% in Punjab, 18% in Sindh, 35% in KPK and 67% in Balochistan (Pakistan Social and Living
Standards Measurement Survey 2010-11).
Uncontrolled extraction of groundwater and extended dry periods has also caused its depletion and
drying up of some of the sources. In Islamabad, the water table has dropped some 50 feet between
1986 and 2001, while in Lahore the drop has been about 20 feet between 1993 and 2001.
Estimates show that without an artificial recharging, groundwater in the sub basin of Quetta would
be exhausted by 2016 (State of Environment Report, 2005).
The Planning Commission in its Ten Year Perspective Development Plan 2001-11, estimates that
the water demand (including drinking water) by 2025 will be 135 million acre feet (MAF) against a
water availability of 104 MAF, leaving the country with a shortfall of 31 MAF.

57
Table 10: Bacterial Contamination Levels of Water Sources of 23 Cities of Pakistan
City Bacterial
Contamination Level %
City Bacterial
Contamination Level %
Islamabad 40-74% Sargodha 75-92%
Faisalabad 38-79% Khuzdar 62-100%
Bahawalpur 52-76% Loralai 73-100%
Gujranwala 29-71% Quetta 48-68%
Gujrat 56-100% Ziarat 100%
Kasur 40-50% Mingora 40-70%
Lahore 37-63% Mardan 75-83%
Multan 31-87% Peshawar 31-77%
Rawalpindi 53-87% Abbottabad 55-73%
Sheikhupura 27-55% Hyderabad 73-100%
Sialkot 40-70% Karachi 61-100%
Sukkur 67-83%
(Source : National Water Quality Monitoring Programme, Water Quality Status in Pakistan, Phase I-V, 2001-2006, Pakistan Council of Research in Water Resources)
Table 10 illustrates the very high level of bcterial contamination found in water sources of 23 major
citiesin the country. It highlights the issue of inadequate waste water treatment and contamination of
water reservoirs.
Table 11: Per Capita Availability of Water
Year Population in millions
Per Capita Availability
in cubic meters
1951 34 5300 1971 65 2700 1981 84 2100 1991 115 1600 2000 148 1200 2013 207 850 2025 221 659
(Source: Vision 2030. Planning Commission, 2007, Government of Pakistan)
Table 11 summarizes the rapidly declining per capita availability of water. If urgent measures are
not taken, Pakistan will move from the water stressed country to a water scarce one within the next
two decades.

58
Waste
Waste Water
(Adapted from State of Environment Report 2005)
It is estimated that only 8% of urban wastewater is treated in municipal treatment plants.
In Pakistan, only 1% of wastewater is treated by industries before being discharged directly into
rivers and drains. There is very little separation of municipal wastewater from industrial effluent in
Pakistan. Both flow directly into open drains, which then flow into nearby natural water bodies.
There is no regular monitoring programme to assess the water quality of the surface and
groundwater bodies.
By 2003, about 5.6 million tonnes of fertilizer and 70 thousand tonnes of pesticides were being
consumed in the country every year. Pesticide use is increasing annually at a rate of about 6%.
Pesticides, mostly insecticides, sprayed on the crops mix with the irrigation water, which leaches
through the soil and enters groundwater aquifers.
In 107 samples of groundwater collected from various locations in the country between 1988 and
2000, 31 samples were found to have contamination of pesticides beyond FAO/WHO safety limits.
As there has been a four-fold or more increase in the use of pesticide use in the country since 1990,
the contamination levels are likely to have increased significantly.
It is estimated that 40 million residents depend on irrigation water for their domestic use, especially
in areas where the groundwater is brackish. The associated health risks are grave, as
bacteriological contamination of irrigation water often exceeds WHO limits even for irrigation.
Reuse of irrigation water is minimal in Pakistan, as the return flows are negligible. The Indus River
system carries around 33 million tons of salt, which flows through its waters, but only about 8 million
tons of slat flows into the sea. The balance remains on land, which contributes to increases in areas
affected by soil salinization (Water demand—supply gaps in South Asia, and approaches to closing
the gaps. Water and Security in South Asia, 2004).
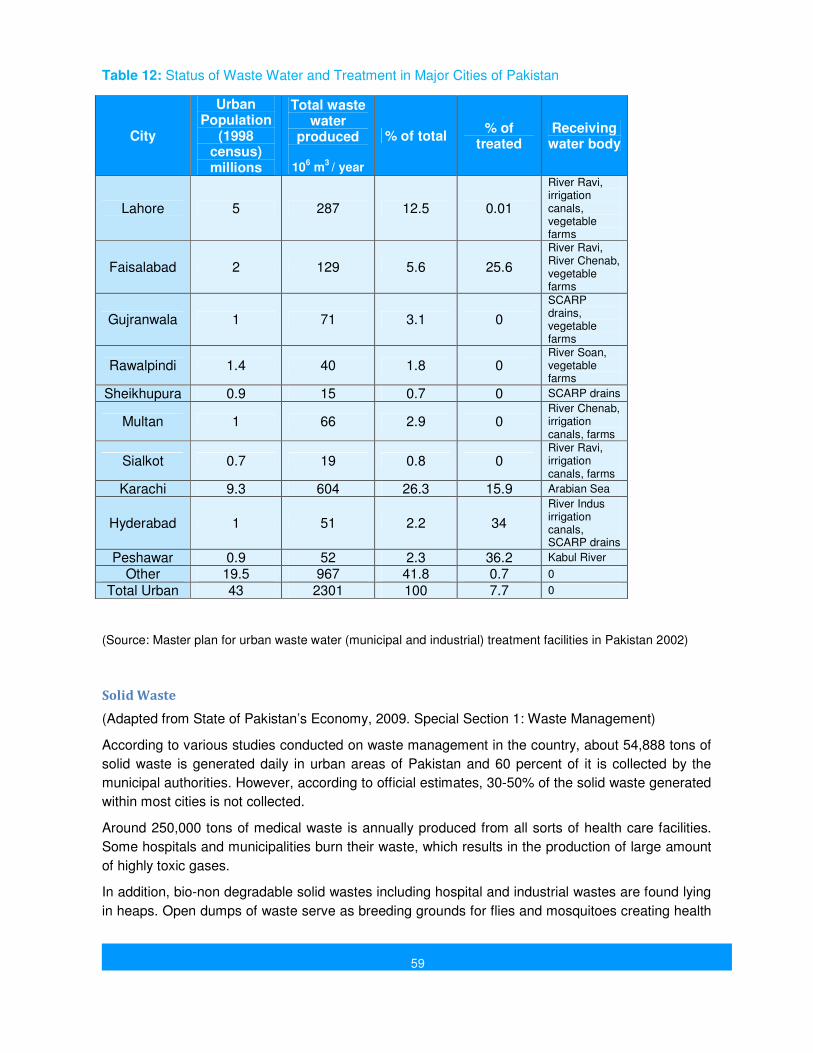
59
Table 12: Status of Waste Water and Treatment in Major Cities of Pakistan
City
Urban Population
(1998 census) millions
Total waste water
produced
106 m
3 / year
% of total % of
treated Receiving water body
Lahore 5 287 12.5 0.01
River Ravi, irrigation canals, vegetable farms
Faisalabad 2 129 5.6 25.6
River Ravi, River Chenab, vegetable farms
Gujranwala 1 71 3.1 0
SCARP drains, vegetable farms
Rawalpindi 1.4 40 1.8 0 River Soan, vegetable farms
Sheikhupura 0.9 15 0.7 0 SCARP drains
Multan 1 66 2.9 0 River Chenab, irrigation canals, farms
Sialkot 0.7 19 0.8 0 River Ravi, irrigation canals, farms
Karachi 9.3 604 26.3 15.9 Arabian Sea
Hyderabad 1 51 2.2 34
River Indus irrigation canals, SCARP drains
Peshawar 0.9 52 2.3 36.2 Kabul River
Other 19.5 967 41.8 0.7 0
Total Urban 43 2301 100 7.7 0
(Source: Master plan for urban waste water (municipal and industrial) treatment facilities in Pakistan 2002)
Solid Waste
(Adapted from State of Pakistan’s Economy, 2009. Special Section 1: Waste Management)
According to various studies conducted on waste management in the country, about 54,888 tons of
solid waste is generated daily in urban areas of Pakistan and 60 percent of it is collected by the
municipal authorities. However, according to official estimates, 30-50% of the solid waste generated
within most cities is not collected.
Around 250,000 tons of medical waste is annually produced from all sorts of health care facilities.
Some hospitals and municipalities burn their waste, which results in the production of large amount
of highly toxic gases.
In addition, bio-non degradable solid wastes including hospital and industrial wastes are found lying
in heaps. Open dumps of waste serve as breeding grounds for flies and mosquitoes creating health
60
hazards. In Pakistan currently there are three primary ways of disposing waste - landfill, size
reduction and screening.
The Ministry of Environment undertook a study during 1996 on "Data Collection for Preparation of
National Study on Privatization of Solid Waste Management in Eight Selected Cities of Pakistan"
according to which, the rate of waste generation on average from all type of municipal controlled
areas varied from 0.283 kg/capita/day to 0.613 kg/capita/day or from 1.896 kg/house/day to 4.29
kg/house/day in all selected cities (Draft Guideline for solid waste management. Pakistan
Environmental Protection Agency, 2005).
According to the Pakistan Environment Protection Agency (Guidelines for Solid Waste
Management, 2005), solid waste generation from 8 cities (Gujranwala, Faisalabad, Karachi,
Hyderabad, Peshawar, Bannu, Quetta and Sibi) amounted to 10,413 tons per day or over 3.6 million
tons per year. Waste collection estimates for the same cities ranged from 51-69% - in other words,
almost half the solid waste generated remained lying in heaps.
The study projected that by 2014, there would be an estimated solid waste production of 71,018
tons per day or 25.921 million tons per year.
In urban areas, 39% of household garbage is collected by the municipality services, 17% by private,
while in 44% there is no system. 97% of rural areas have no garbage collection system (Social
Indicators of Pakistan, 2011)
Several legal rules and institutional framework deal with solid waste management in the country.
These include Pakistan Environmental Protection Act (PEPA) 1997, the National Environmental
Quality Standards (NEQS), Hazardous Substances Rules of 1999, Guidelines for Hospital Waste
Management 1998, Hospital Waste Management Rules 2005, Hazardous Substances Rules 2003,
and several other regulations, rules and standards.
Before promulgation of the local government in 2001, the provincial Public Health Engineering
Department (PHED) was responsible for the development and maintenance of water and sanitation
services including solid waste management. Under the recently prevailing system of local
government, it is the responsibility of Town/Tehsil Municipal Administration (TMAs); however the
siting of disposal facilities is primarily the function of the Zila Council. Paid sanitary workers are
employed by TMAs to sweep the streets and collect the trash at a specified place from where it is
taken to the dumping site by the municipal carrier.
In addition, the private sector is also involved in waste management activities in the country. They
may be divided into formal and informal categories. The formal sector consists of organizations and
non-government organizations (NGOs). The informal sector is significant in size as it consists of
thousands of itinerant traders (called kabarias or kabari-wallas) spread throughout the cities who are
engaged in collection of waste material of different kinds.
Unplanned urbanization, poor sanitation and drainage system, inadequate human and capital
resources for collecting waste, unavailability of official dumping sites, absence of weigh bridges for
exact measurement of waste coming at sites, and almost negligible presence of recycling processes
have negatively impacted waste management in the country
61
Monitoring
Definitions and Information Management
Pakistan as a signatory to Millennium Development Goals is responsible for providing information
about MDG 7 " Environmental Sustainability" that relates to access to drinking water and improved
sanitation services. In absence of any regulatory body or recognition of Drinking Water and
Sanitation as a sector, there is no structured approach for monitoring and evaluation (M&E) of
WASH sector. It is driven either by the coverage and access of WASH or investment and
disbursements made in the sector.
Presently, there are three reports/sources that provide information about access to water and
improved sanitation. These are Pakistan Social and Living Standards Measurement Survey (PSLM),
Multiple Indicator Cluster Survey (MICS) and Joint Monitoring Programme (JMP) of WHO and
UNICEF.
At the national level in Pakistan, the Pakistan Bureau of Statistics conducts PSLM on periodic basis.
The latest PSLM 2010-2011 is available on the website but the whole report has not yet been
released. MICS is done by provincial bureau of statistics with the support of Planning and
Development Department in respective provinces. The MICS results have not been revealed for last
few years, although it is planned for 2012 in some provinces. The Development Statistics Report of
the provinces also provides information about water schemes.
The JMP for Drinking Water and Sanitation is the official United Nations mechanism tasked with
monitoring progress towards the MDG targets relating to drinking-water and sanitation (MDG 7,
Target 7c), which is to: "Halve, by 2015, the proportion of people without sustainable access to safe
drinking-water and basic sanitation".
Apparently, there are some differences about the data of coverage and access generated by all
these three sources, mostly because of varying definitions used by the different survey modalities.
Some efforts have been made on the part of the bureau of statistics to align its data collection
methods with defined parameters of JMP to bring consistency in the reporting, there is still
considerable need to strengthen the capacities and orientation of the bureau of statistics at the
federal and provincial levels about different definitions and data collection approaches.
62
The development of Management Information System for Drinking Water and Sanitation has started
and is in the piloting and testing stage in Punjab and AJK where data entry is under process.
Currently, it is not possible to ascertain the collective outputs of Water and Sanitation work done by
different stakeholders across the country. Thus, there is need to develop consistent Monitoring and
Reporting formats, and district, provincial and national hubs should be established for information
collection and dissemination.
GIS mapping is being used in some provinces to map zones of responsibilities, service utilization,
revenue collection etc. This option can play a significant role for improving monitoring and
evaluation systems.
Institutional Mechanisms for Monitoring
At the provincial level, planning and monitoring are not mutually reinforcing at present. The
provincial mechanisms for planning and budgeting are underpinned by the following:
• Comprehensive Development Strategy (CDS)
• Medium Term Development Framework (MTDF)
• Medium Term Budget Framework (MTBF)
• Medium Term Expenditure Framework (MTEF)
• Output Based Budgeting (OBB) or Results Based Financing (RBF)
• Annual Development Programme (ADP)
• Post Crisis Needs Assessment (PCNA) where it applies
Each province has, at varying degrees of development, a monitoring framework. This is supported by a Development Project Management System (DPMS). There is a whole directorate for monitoring and evaluation called Directorate General Monitoring and Evaluation (DGME) (Khyber Pakhtunkhwa Monitoring and Evaluation Report 2010-2011). The DGME may have offices at divisional level, but does not have enough presence at district level.
Development projects are routinely developed using standard PC-1 formats from the Planning
Commission. Once a project is approved, it has a project completion PC-IV that projects are obliged
to fill at the end of the project.

63
However, there is also a PC-V that is meant to be completed post-project completion and is an
institutional monitoring mechanism. Unfortunately, hardly any project completes a PC-V. This is a
major deficiency in the project management cycle.
Presently, there is limited or no coordination between development of an ADP with the CDS, MTDF,
MTBF, MTEF, OBB and the PCNA.
For monitoring of drinking water and sanitation indicators to be institutionalized, it is essential that
monitoring of the sector is contextualized within the broader monitoring framework of the province
and that key stakeholders like the bureau of statistics, DGME, planning, reforms and those involved
with management information systems facilitate information management for drinking water and
sanitation.
Climate Change The Maplecroft Vulnerability Index to Climate Change (2010) rates Pakistan in the top 16 countries
classified as ‘extreme risk’. The index evaluates 42 social, economic and environmental factors to
assess national vulnerabilities across three core areas. These include exposure to climate related
natural disasters and sea-level rise; human sensitivity, in terms of population patterns, development,
natural resources, agricultural dependency and conflicts; and adaptive capacity of a country’s
government and infrastructure to combat climate change.
Pakistan is located in the South Asian region that has recently been categorized as the world's most
climate-vulnerable region by Maplecroft. The projections for future increases in temperature are
predicted to be higher for Pakistan compared to global trends and this is confirmed by both national
and international studies of future climate change in Pakistan. The Indus basin, which is the major
source of water supply in Pakistan, depends heavily on glaciers in the Western Himalayas and the
Karakoram. These glaciers are melting rapidly.
The melting of these glaciers has been projected to increase the flow of water in the rivers. This,
combined with an increase in precipitation and flash storms, are predicted to result in increased
incidents of flooding. According to the International Panel on Climate Change, glacier melt in the
Himalayas is projected to increase flooding within the next two to three decades. The recent
flooding in Pakistan - resulting in an inundation of more than a quarter of the total land area in
Pakistan and affecting close to a twenty million people and causing 1700 deaths - is the most recent
as well as the most shocking manifestation of the dire consequences of climate change in the
region.
Apart from flooding, droughts are also predicted for Pakistan in future years. Once the Himalayan
glaciers retreat due to melting in a couple of decades, water shortages are likely to take place
having dire consequences for the agricultural sector and food production. Agriculture is the mainstay
of Pakistan and the country has one of the highest ratios of irrigated croplands in the South Asian
region with four-fifths of its total crop land being currently irrigated.
Overall, according to the WHO categorization of regions vulnerable to climate change, Pakistan falls
in the region with one of the highest number of deaths attributed to climate change (40-80 per
million) after Sub-Saharan Africa.
Increase in temperature and heat waves are likely to increase the risk of heat related morbidity and
mortality particularly amongst the older population groups and the urban poor. In South Asia, heat
64
waves are most likely to occur in the rural areas affecting mostly the elderly population and outdoor
workers. Rising temperatures and humidity levels are also likely to increase the transmission of
vector-borne diseases such as Malaria, Dengue Fever, Yellow Fever and Encephalitis.
Increase in temperature along with a decline in precipitation is likely to put a strain on the availability
of water supply in Pakistan. Pakistan's agriculture is heavily dependent on water. Constraints in the
availability of water in the future are very likely to prevent the intensive use of land leading to a
reduction in crop production. Already, Pakistan's agriculture remains far below its potential. The
increase in temperature is predicted to reduce the supply of water thereby constraining crop
production and shortening the growing season of crops. This is predicted to have significant
repercussions on food insecurity in the region which is reported to have increased in the past
number of years in Pakistan. Malnutrition, particularly among children under five years of age is a
serious health issue, with nearly one half of them estimated to be below their weight for age.
Disaster Risk Reduction
As disasters cannot be eliminated, coping with the consequences is reality for a large part of the
world population (Reference Note Water Supply and Sanitation Collaborative Council 2009). In the
last decade of the 20th century almost two billion people – one-third of humanity – were affected by
natural disasters, 86% of them by floods and droughts (Celebrating Water for Life – the International
Decade for Action 2005-2015. An Advocacy Guide. WHO 2005).
Each disaster can pose its unique set of threats. Flooding for example, increases the ever-present
health threat from inadequate drinking water and sanitation systems, and water supplies can
become contaminated by lack of sanitary facilities as well as household or industrial waste. These
factors all aggravate the situation for vulnerable people, and the largest sufferings originate from
common illnesses, such as diarrhoea, made life threatening by crisis conditions. Thus, three top
priorities in emergency response, and even during the development interventions, are provision of
clean drinking water or purification mechanisms, construction of sanitation infrastructure and
conduction of hygiene training.
The inclusion and adaption of disaster risk reduction in planning of infrastructure and institutional
elements of drinking water supply, and sanitation system is not important from mainstreaming
perspective but also from strengthening the sustainability and reducing the vulnerability especially to
the place prone to disasters (Reference Note Water Supply and Sanitation Collaborative Council
2009). UN-Water has compiled a summary of water hazards, many of which are potentially
threatening sustainable functioning of water supply and sanitation systems (Water hazard risks. UN-
Water series Vol.1, 2005). The Hyogo Framework for Action developed by the United Nations
International Strategy for Disaster Reduction (ISDR) for 2005-2015 aims to build the resilience of
nations and communities to disasters. In the report Words into Action, the example of Colombia
highlights the positive impact of inter-institutional cooperation on WASH issues (Words into action: a
guide for implementing the Hyogo Framework, ISDR 2007).
The WASH cluster working with National and Provincial Disaster Management Authorities of
Pakistan reviewed existing knowledge and explored gaps related to disaster risk reduction. This
created awareness and increased political commitment to integrate these issues into the water and
sanitation sector but these are mainly driven from emergency perspectives. There is a dire need of
developing resilience capacities both in the public and private sectors to ensure effective disaster
risk reduction strategies and processes as part of a government-led long-term development agenda.
65
Establishment of of a taskforce or working group in Pakistan would be desirable for identification of
strategic entry points for disaster risk reduction and management in WASH programmes.
Vulnerability to Climate Change
Analysis of the recent evidence emerging from flood affected areas regarding the health, water and
sanitation repercussions are of serious concern:
• Health facilities and sanitation infrastructure was severely damaged
• Access to safe water and sanitation was severely curtailed thereby increasing the
vulnerability of people to infectious and water borne diseases such as diarrhoea, typhoid,
intestinal worms and hepatitis. In many cases water pipes were contaminated with sewage
water and the use of toilets in most flood affected districts dropped by 50 percent
• The incidence of cholera, malaria and polio increased over the past one year in Pakistan
A ranking of agro-ecological zones in Pakistan according to their vulnerability to climate change
shows the following (Malik SM et al: A study of the effects of climate change on human health in
Pakistan. 2010):
• Balochistan is the most vulnerable region with high sensitivity and low adaptive capacity.
The major threats posed by climate change in Balochistan include droughts and increase in
mean temperature
• Low-intensity Punjab (mostly consisting of South Punjab) is the next most vulnerable region.
The region is prone to floods as well as rise in temperature. The region has a high degree of
sensitivity and low adaptive capacity
• Cotton/Wheat Sindh is the third most vulnerable region. It is vulnerable to both floods and
droughts. The degree of sensitivity is high. However the coping capacity falls in the 'medium'
rank. The rain-fed (Barani) Punjab has a high degree of exposure to climate change due to
its greater variability in precipitation, but relatively better adaptive capacity
In a situation where Pakistan is ploughing through a state of development deficiency, building its
adaptive capacity to climate change is challenging to say the least. However, the formulation of the

66
new national climate change policy 2012 is an encouraging step. Decadal forecasts of increasing
floods and droughts suggest that mitigation planning for 2030 and 2050 needs to begin now. Data
from the Intergovernmental Panel on Climate Change (The cost to developing countries of adapting
to climate change. World Bank 2010) suggests that in South Asia, regional countries need to invest
at least 0.2% of their GDP on building their adaptive capacity. It is vital that water and sanitation
programmes incorporate adaptation measures to climate change.

67
TAKING ACTION
68
Taking Action
Catalyzing Actions
• Sector Wide Approach – prioritize sanitation and drinking water within a sector wide
approach in Poverty Reduction Strategy Paper III, Medium Term Development Framework
and Medium Term Budget Framework; the SWAp will enable incorporation of the principles
of sector policies into sector development plans of different agencies responsible for water
management and solid waste
• Sector Plan – develop a National Sector Action Plan comprised of Provincial Action Plans to
effectively implement national policies on sanitation and drinking water as well as behavioral
change by December 2013
• Task Forces –
1. Constitute a special Task Force on up–scaling rural sanitation based on the Pakistan
Approach to Total Sanitation by December 2012;
2. Constitute a special Task Force on Peri-urban/Urban challenges and Climate Change in
relation to sanitation and drinking water to document and formulate guidelines for best
practice for incorporating into the national and provincial action plans by December 2012
3. Constitute a WASH specific Task Force on Disaster Preparedness and Response as
well as Disaster Risk Reduction by December 2012
Institutional Arrangements
Institutional roles and responsibilities following the 18th Amendment need to be clarified and well
defined. Suggested roles include:
• Federal - facilitate information sharing and cross-provincial learning of best practice; develop
a country plan comprised of provincial action plans; develop guidelines and standards;
representational responsibility and promote research
• Provincial - develop provincial legislations, policies, regulatory frameworks, strategies and
action plans; streamline master planning and coordination mechanisms and information
pathways; mobilize resources; plan for human resource development
• District - become the planning and implementation platform (district boards) for drinking
water and sanitation programmes through district based participatory planning, monitoring
and execution; conduct equity mapping to prioritize areas most in need; revenue generation;
ensure quality; waste disposal
• Tehsil - operate the service delivery arm of the sector; manage operation and maintenance;
human resource management; coordinate monitoring
• Union Councils - collect information; specific focus on social mobilization
69
Operation and Maintenance - Urban
• Formalize agreements between Local Government, District Government and TMA
concerned before the start of each urban water supply or sewerage/drainage scheme, for
handing over to and subsequent maintenance by the TMA on its completion
• Ensure a thorough costing for operation and maintenance including staff requirements and
handing over transition costs at the time of preparation of PC-I to minimize post-transfer
issues
• Develop a transition and handover plan (as part of the PC-1) of about six months for each
completed scheme in which PHED should operationalize the scheme for at least six months
with the active participation of TMA staff who will be responsible for it subsequently
• TMA and PHED should formulate a joint monitoring and review mechanism for on-going and
new schemes
Operation and Maintenance - Rural
Suggested options for sustainability of Rural Water Supply Schemes:
Revolving Fund
Plan and incorporate a seed fund at the time of developing the proposal. The seed fund shall be
managed by the community based organization who shall be responsible for generating revenue
from the community members and recycling it for maintenance, repairs, replacement of hardware,
utility costs etc. Modalities to manage the revolving fund can be developed in collaboration with
Executive Engineers and Community Development Officers. Community contribution for a backup
fund is also suggested
Municipal responsibility
Capacities of the TMA or respective Union Council can be strengthened in operation and
maintenance to provide support to rural water supply schemes, but will incur additional ongoing cost
Public private partnership
Outsourcing options e.g. to contractors may be considered in consultation with Local Government
and Planning and Development departments
Monitoring
The following strategic actions are suggested to improve monitoring:
Definitions
Hold “standardization of terminologies and indicators used to monitor drinking water and sanitation
interventions” technical meetings between Pakistan Bureau of Statistics, Provincial Bureau of
Statistics, organizations responsible for social and living standards measurement, multiple indicators
cluster, demographic health surveys, and technical experts to develop a minimum set of drinking
water and sanitation indicators that shall be incorporated in population surveys, statistical data, and
international communications. Organizations may add other indicators as appropriate to their
respective needs
70
Monitoring Mechanism
Establish a national monitoring framework for sanitation and drinking water based on provincial
monitoring frameworks, and strengthen national and provincial information management systems,
including those for health and education for improved and coordinated monitoring of sanitation and
water by 2013. This may require alignment with provincial monitoring frameworks, establishing a
provincial coordination cell, strengthening of data collection and information pathways, building
capacities of monitoring structures e.g. DGME
Promote completion of PC-V for post-completion performance of schemes
Sectoral Financing
Presently, the public spending for drinking water and sanitation averages at below 0.2% of GDP,
and about 5% of provincial Annual Development Programmes. The following actions are suggested:
• Allocation - Enhance by 2015, the sectoral allocation for water supply and sanitation by 1%
of overall PRSP allocation to partially meet the resource gap of US$ 600 million for global
MDGs target of sanitation and drinking water
• External assistance - mobilize an additional US$ 200 million annually over and above
current and projected commitments to achieve national MDGs targets of sanitation and
water supply
Costing analyses suggest that provincial allocations need to be doubled to at least 10% of the ADP,
and overall sector investment to at least 0.3% of GDP. The investment may need to be increased
incrementally to raise it from its current 0.16% to 0.3%.
The public spending ratio for drinking water and sanitation is 3:1. It is suggested that this be
changed to a 50%:50% spend ratio to intensify and accelerate efforts to promote access to
improved sanitation.
Human Resource Development
• Conduct a sector capacity development needs assessment and develop a human resource
and leadership development plan for sanitation and drinking water sector by December 2012
• Conduct a situation analysis of existing training centres for drinking water and sanitation to
assess facilities, availability of faculty, and curricula
• Define a package of training needs for various cadres in the sector, for both public and
private sector, including short term and long term courses
• Modernize training curricula and develop provincial human resource development and
deployment plans and also align with vocational training and enterprise development
• Establish/strengthen provincial training institutes for human resource development, develop
training manuals and task oriented training
71
Partnerships
• Undertake a mapping of government, international non-government, national non-
government, district based civil society, international development partners working in the
sector and develop district based activity maps to determine overlaps and opportunities for
synergy
• Develop partnership protocols that are aligned with and support provincial action plans to
implement sector policies
• Foster an engagement policy with the private sector to enhance private investment, improve
quality of services, revenue collection and enhance access
Climate Change
• Ensure that drinking water and sanitation is adequately reflected and incorporated in national
and provincial strategies and action plans for climate change
• Assess the current adaptive capacity of water and sanitation systems to the effects of
climate change and develop a phased plan for climate proofing plan of infrastructure
• Forecast and allocate resources to build the adaptive capacities on a district-wise basis
Research
• Set up a Research Working Group to identify research priorities and develop a research
master plan
• Establish a research and advocacy fund for drinking water and sanitation and invite research
proposals on priority themes
• Promote research and development for innovative technology

72
BIBLIOGRAPHY
73
Bibliography
Ahmad D, Asif A: A guide to understanding the budget in Pakistan, PIPS 2007
Ahmed A, Iftikhar H, Chaudhry GM: Water resources and conservation strategy of Pakistan, 2008
Analytical review of the PSDP portfolio. Planning Commission, Government of Pakistan, 2011
Annual Development Programme 2011-12 Azad Jammu and Kashmir
Annual Development Programme 2011-12 FATA
Annual Development Programme 2011-12 Gilgit Baltistan
Annual Development Programme 2011-12 Khyber Pakhtunkhwa
Annual Development Programme 2011-12 Punjab
Annual Development Programme 2011-12 Sindh
Balochistan Public Sector Development Programme 2011-12
Bottled Water Quality, Quarterly Report Oct-Dec 2011, Pakistan Council of Research in Water Resources
Briefing paper for Pakistan Provincial Legislators: Provincial Budget Process, PILDAT 2004
Celebrating Water for Life – the International Decade for Action 2005-2015. An Advocacy Guide. WHO 2005
Compendium on Environment Statistics of Pakistan 2010. Federal Bureau of Statistics, Government of Pakistan
Cost and impact analysis of water supply and environmental sanitation in Pakistan. Pakistan Institute of Development Economics. 2002
Country Report – Progress of Pakistan towards the MDGs (Sanitation) for SACOSAC IV, 2011
D Nayab. Demographic dividend or demographic threat in Pakistan. Pakistan Institute of Development Economics, Working Papers, No 10, 2006
Delivering access to safe drinking water and adequate sanitation in Pakistan. Pakistan Institute of Development Economics, 2007
Disaster Risk Reduction Emergency Response for WASH, WSSCC Reference Note February 2009
Drinking water - equity, safety and sustainability. UNICEF and WHO, 2011
Early recovery water, sanitation and hygiene (WASH) strategy. National Disaster Management Authority, Government of Pakistan, 2010
Economic and health effects of increasing coverage of low cost household drinking water supply and sanitation interventions to countries off-track to meet MDG target 10. World Health Organization, 2007

74
Economic Survey of Pakistan 2010-11. Economic Advisor’s Wing, Finance Division, Government of Pakistan
Education For All Global Monitoring Report 2011
Establishment of water supply and sanitation coordination cell. Concept Paper. Ministry of Environment, 2010
Framework for equity and inclusion. Wateraid 2010
Guideline for solid waste management (draft). Pakistan Environmental Protection Agency, 2005
Greater Karachi Sewerage Plan S III, 2007, City District Government, KW&SB
Karachi Solid Waste Management (2006) - Karachi Master Plan 2020
Khyber Pakhtunkhwa Monitoring and Evaluation Report 2010-2011
Linking poverty reduction and water management. Poverty Environment Partnership, 2006
Making water a part of economic development - the economic benefits of improved water management and services. Stockholm International Water Institute, 2005
Malik IA, Tariq WZ: Hepatitis E in Pakistan. EMHJ 2, 1:121-128, 1996
Malik SM, Awan H, Khan NU: A study of the effects of climate change on human health in Pakistan - Evidence based policy advocacy. Sightsavers 2010
Mobilizing Lady Health Workers for safer food in Faisalabad, Pakistan — International Water Management Institute 2011
Murtaza G, Zia MH: Individual's capacity development on the safe use of wastewater in agriculture in Pakistan. Institute of Soil and Environmental Sciences, University of Agriculture, Faislabad, 2011
National Drinking Water Policy, 2009
National Environmental Policy, 2005
National Sanitation Policy, 2006
National Water Quality Monitoring Programme, Water Quality Status in Pakistan, Phase I-V, 2001 -2006, Pakistan Council of Research in Water Resources
National workshop on gender mainstreaming in WASH. PIEDAR in collaboration with UNICEF, UN Habitat and UNIFEM 2009
Off-track, off-target - why investment in water, sanitation and hygiene is not reaching those who need it most. WaterAid 2011
Pakistan Briefing: Economic impact of water and sanitation. Sanitation and Water for All, 2012
Pakistan Demographic and Health Survey 2006. National Institute of Population Studies, Pakistan and Macro International Inc., USA
Pakistan Economic Survey 2009-2010

75
Pakistan Framework for Economic Growth 2011. Planning Commission, Government of Pakistan
Pakistan Household Integrated Economic Survey 2010-2011
Pakistan Social and Living Standards Measurement Survey 2010-2011. Pakistan Bureau of Statistics
Pakistan Strategic Country Environmental Assessment. Vol II: The cost of environmental degradation in Pakistan - An analysis of physical and monetary losses in environmental health and natural resources. World Bank, 2006
Pakistan’s waters at risk. Water and health related issues in Pakistan and key recommendations. WWF, 2007
Poverty Reduction Strategy Paper II - Finance Division, Government of Pakistan
Progress on drinking water and sanitation 2012 update. UNICEF and WHO, 2012
PRSP - II Period Progress Report FY 2008/09 - FY 2010/11. Government of Pakistan, Finance Division, 2012
Report on provincial budget analysis and budget conferences in Pakistan. Participatory Development Initiatives and Actionaid International, 2009
Report of Working Group on Environment - Tenth Five Years People’s Plan 2010-15. Ministry of Environment
Safe drinking water supply, sanitary latrines coverage, and waste management in Pakistan. Desk review and meta-analysis, UNICEF, 2002
Scanning the 2020 horizon. An analysis of trends and scenarios in the water, sanitation and hygiene sector. IRC International Water and Sanitation Centre, 2011
School health programme: A strategic approach for improving health and education in Pakistan. Ministry of Education and UNESCO, 2010
Sector survey on water supply planning in Pakistan. Zahid Shakeel Ahmad, JICA, 2009
Social Indicators of Pakistan 2011. Government of Pakistan, Statistics Division, Federal Bureau of Statistics
State of the Environment Report (draft) 2005. Government of Pakistan, Ministry of Environment
Statistical Supplement, State Bank’s Annual Report, The State of Pakistan’s Economy 2010-11
State of water and sanitation in Punjab - Position paper. Punjab Urban Resource Centre, 2011
Ten Year Perspective Development Plan 2001-11, Government of Pakistan, Planning Commission
The cost to developing countries of adapting to climate change. Consultation Draft. World Bank 2010
The state of Pakistan’s economy - Waste management: recent developments in Pakistan, 2009
Vision 2030. Planning Commission, 2007, Government of Pakistan

76
Vision 2030 - the resilience of water supply and sanitation in the face of climate change. WHO and DfID, 2009
Water demand—supply gaps in South Asia, and approaches to closing the gaps. Water and Security in South Asia, 2004
Water hazard risks. UN-Water series Vol.1. 2005
Water quality interventions to prevent diarrhoea: Cost and cost-effectiveness. WHO, 2008
Water and sanitation to reduce child mortality - The Impact and Cost of Water and Sanitation Infrastructure. The World Bank, Development Economics Project Group, 2011
Water and sewerage services in Karachi. Citizen Report Card: Sustainable service delivery improvements. Water and Sanitation Program, 2010
Water in a changing world: United Nations World Water Report 3, UNESCO, 2009
Water, sanitation and hygiene. UNICEF Annual Report, 2010
Words into action: a guide for implementing the Hyogo Framework. ISDR 2007
Working to overcome the global impact of Neglected Tropical Diseases. WHO, 2010

77
ACRONYMS
78
Acronyms ADP Annual Development Programme
CDS Comprehensive Development Strategy
CLTS Community Led Total Sanitation
CPP Changa Pani Programme
DALYS Disability Adjusted Life Years (DALYS)
GDP Gross Domestic Product
HDI Human Development Index
HLM High Level Meeting
HNS Health and Nutrition Supervisor
JMP Joint Monitoring Programme
KPK Khyber Pakhtunkhwa
LG Local Government
LHW Lady Health Worker
LPP Lodhran Pilot Project
MDGs Millennium Development Goals
MICS Multiple Indicators Cluster Survey
MoDM Ministry of Disaster Management
MTDF Medium-Term Development Framework
MTEF Medium - Term Expenditure Framework
NEQS National Environmental Quality Standards
NGO Non Governmental Organizations
OBB Output Based Budgeting
OPP Orangi Pilot Project
PATS Pakistan Approach to Total Sanitation
PCNA Post Crisis Needs Assessment
PCRWR Pakistan Council of Research in Water Resources
PEPA Pakistan Environmental Protection Act
PHED Public Health Engineering Department
PRSP Poverty Reduction Strategy Paper
79
PSDP Public Sector Development Programme
PSLM Pakistan Social and Living Standards Measurement Survey
RBF Result Based Financing
RDF Refuse-Derived Fuel
RSPN Rural Support Programme Network
SWA Sanitation and Water for All
UNICEF United Nations Children Fund
WASA Water and Sanitation Agency
WASH Water, Sanitation and Hygiene
WHO World Health Organization
WSP Water and Sanitation Programme

80
ANNEXURES
81
Annexure 1 - Methodology
Background
Sanitation and Water for All (SWA) is an alliance of national governments, donors, civil society
organizations and other development partners and water and sanitation agencies working together
to increase political prioritization, increase resource allocation and improve the efficiency of
resource use and strengthen the evidence base for the water supply and sanitation sector.
Its aim is to ensure that all people have access to basic sanitation and safe drinking water. It is
particularly concerned with those countries where the needs are greatest and are off-track to
achieve MDGs with current rate of progress. SWA provides a framework for action at global and
national level to ensure greater effectiveness of funding - a plus for both donors and recipients.
SWA is making the financing of water and sanitation more sustainable and more effective, yielding
greater value for money and saving lives in the process. Pakistan is a member of the SWA Steering
Committee
The second SWA High Level Meeting (HLM) will be held in Washington D.C. on 20 April 2012. The
Ministers of Finance from countries most in need of improved sanitation and hygiene are expected
to participate in the meeting. The Government of Pakistan will also participate in the HLM.
Scope and Purpose
The scope and purpose of this study are two fold:
• Undertake a brief critical review of the WASH sector
• Propose a brief strategy that will underpin a statement of commitments to be presented by
the Minister for Finance at the HLM
Process
The methodology adopted was divided into three phases:
Phase 1
• Undertake a desk review of available information on WASH in Pakistan
• Visit provinces jointly with Ministry of National Disaster Management official and meet with
key public sector officials and technical persons to understand approaches, limitations and
frontline challenges
• Meet with sector organizations and professionals to obtain their perspective

82
Phase 2
The information obtained from the desk review and individual and organizational consultations was
divided into strategic themes for further analysis and drawing out points of significance.
Phase 3
The themes that emerged from the analysis were grouped as follows:
• Those that represented a topline perspective in terms of socio-economic indicators, WASH
indicators and sector financing - describe the current situation
• Those that provide a health and economic perspective - highlight an urgent need for action
• Those that summarized policy and institutional frameworks and reflected some good practices in
the sector - considered as enablers
• Those that emerged as key sector challenges - classified as bottlenecks
• Those that constituted strategic actions - presented as taking action
• Those that were distilled into a topline strategy map
A supportive but not exhaustive bibliography is presented at the end, which may help point the
direction for further study and analysis.
Stakeholders Consulted
Amjad Hussein, Assistant Coordinator, Local Government, Khyber Pakhtunkhwa
Asad Aslam Khan, Vice Chancellor, King Edward Medical University Lahore
Bahramand Khan, Superintendent Engineer, PHED, Khyber Pakhtunkhwa
Faheem Akhtar Junejo, Director General (M&E), Local Government, Government of Sindh
Farhan Sami, Country Team Leader, WSP, World Bank Islamabad
Fawad Saeed, Senior GIS Specialist, The Urban Unit, P&D Government of Punjab
Imran Shami, Programme Manager, Plan Pakistan
Irfan Saeed Alrai, WES Specialist, UNICEF Pakistan
Jawed Ali Khan, Director General, Ministry of Disaster Management Islamabad
Javed Ahmed, Project Director, Safe Drinking Water, PHED Balochistan
Kamran Naeem, Programme Manager, UN Habitat
Khizar Hayat Gondal, Secretary, LG&CD Government of Punjab
Laeeq Ahmed, Additional Secretary, PHED, Government of Sindh
M Hafeez, Programme Manager, Wateraid Pakistan
M Irfan Tariq, Director (Environment), Ministry of Disaster Mnagement
M Rafique Tahir, Joint Secretary- Education, CAD Islamabad

83
Mian S Shafi, Unit Head, Urban, Water and Emergency, Asian Development Bank Resident Mission
Pakistan
Mohammad Nadeem, General Manager CPI, Pakistan Poverty Alleviation Fund
Mustafa Talpur, Advocacy Manager, Wateraid Pakistan
Nadeem Irshad Kayani, Programme Director, Directorate of Staff Development Lahore
Nafees Ahmed Shaikh, Superintending Engineer, PHED, Government of Sindh
Nasir Javed, Project Director, The Urban Unit, P&D Government of Punjab
Nazir Ahmed Wattoo, President, Anjuman Samaji Behbood Faisalabad
Rizwan Baig, Programme Manager, Muslimaid Pakistan
S M Kaleem Makki, Secretary, PHED, Government of Sindh
Saleem Gillani, Senior Programme Officer, JICA Pakistan
Salman Yusuf, Deputy Secretary, HUD & PHE Department, Government of Punjab
Shakeel Qadir Khan, Secretary Law and Order FATA, former Chief Economist Khyber Pakhtunkhwa
Sheikh Mehmood ul Hassan, Secretary Local Government Balochistan
Sheikh Nawaz Ahmed, Deputy Secretary Public Health Engineering Department Balochistan
Sher Hasan, WATSAN Specialist, Concern Worldwide
Simone Klawitter, Chief WASH, UNICEF Pakistan
Sohail Akhtar Shehzad, Chief Urban Development and IT, P&D Department Government of Punjab
Suhail Aamir, Secretary, HUD & PHE Department, Government of Punjab
Syed Ayub Qutub, Executive Director, PIEDAR Pakistan
Zahid Shakeel Ahmad, Water Supply Consultant
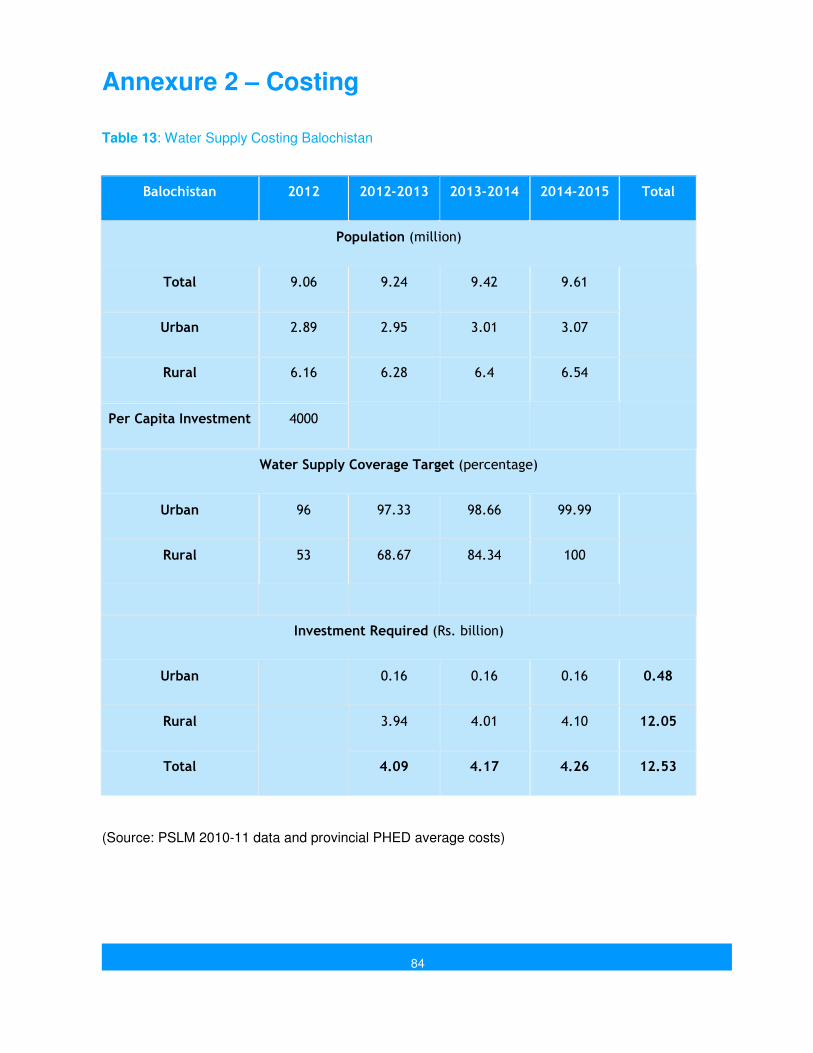
84
Annexure 2 – Costing
Table 13: Water Supply Costing Balochistan
Balochistan 2012 2012-2013 2013-2014 2014-2015 Total
Population (million)
Total 9.06 9.24 9.42 9.61
Urban 2.89 2.95 3.01 3.07
Rural 6.16 6.28 6.4 6.54
Per Capita Investment 4000
Water Supply Coverage Target (percentage)
Urban 96 97.33 98.66 99.99
Rural 53 68.67 84.34 100
Investment Required (Rs. billion)
Urban
0.16 0.16 0.16 0.48
Rural
3.94 4.01 4.10 12.05
Total
4.09 4.17 4.26 12.53
(Source: PSLM 2010-11 data and provincial PHED average costs)

85
Table 14: Water Supply Costing Khyber Pakhtunkhwa
KPK 2012 2012-2013 2013-2014 2014-2015 Total
Population (million)
Total 23.77 24.25 24.74 25.24
Urban 7.6 7.76 7.91 8.07
Rural 16.16 16.49 16.82 17.16
Per Capita
Investment 4000
Water Supply Coverage Target (percentage)
Urban 96 97.33 98.66 100
Rural 77 84.67 92.34 100
Investment Required (Rs. billion)
Urban
0.41 0.42 0.43 1.26
Rural
5.06 5.16 5.26 15.48
Total
5.47 5.58 5.69 16.75
(Source: PSLM 2010-11 data and provincial PHED average costs)
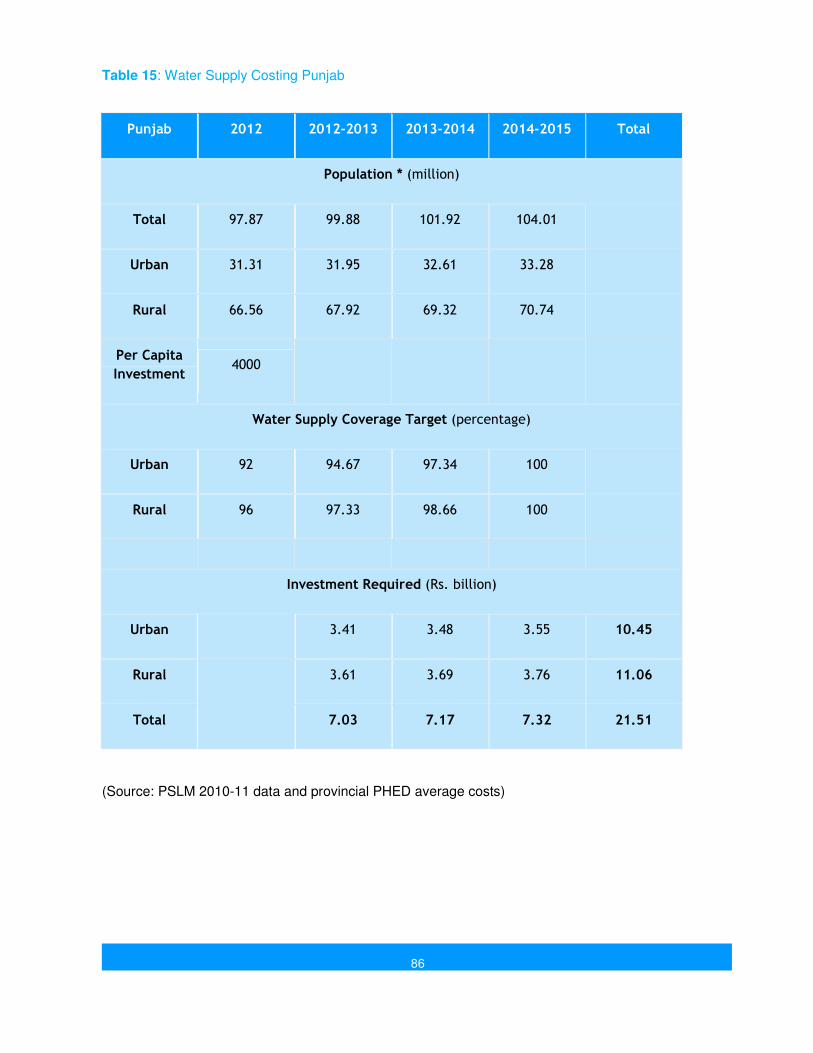
86
Table 15: Water Supply Costing Punjab
Punjab 2012 2012-2013 2013-2014 2014-2015 Total
Population * (million)
Total 97.87 99.88 101.92 104.01
Urban 31.31 31.95 32.61 33.28
Rural 66.56 67.92 69.32 70.74
Per Capita
Investment 4000
Water Supply Coverage Target (percentage)
Urban 92 94.67 97.34 100
Rural 96 97.33 98.66 100
Investment Required (Rs. billion)
Urban
3.41 3.48 3.55 10.45
Rural
3.61 3.69 3.76 11.06
Total
7.03 7.17 7.32 21.51
(Source: PSLM 2010-11 data and provincial PHED average costs)

87
Table 16: Water Supply Costing Sindh
Sindh 2012 2012-2013 2013-2014 2014-2015 Total
Population (million)
Total 42.20 43.07 43.95 44.85
Urban 13.50 13.78 14.06 14.35
Rural 28.69 29.28 29.88 30.49
Per Capita
Investment 4000
Water Supply Coverage Target (percentage)
Urban 96 97.33 98.66 100 -
Rural 90 93.33 96.66 100
Investment Required (Rs. billion)
Urban
0.73 0.75 0.76 2.24
Rural
3.90 3.98 4.06 11.94
Total
4.63 4.73 4.82 14.19
(Source: PSLM 2010-11 data and provincial PHED average costs)

88
Table 17: Water Supply Costing Summary
Investment Summary for Water Supply for 100% coverage
Pakistan 2012 2012-2013 2013-2014 2014-2015 Total
Population (million)
Total 172.9 176.43 180.03 183.71
Urban 55.3 56.44 57.59 58.76
Rural 117.57 119.97 122.42 124.93
Per Capita Investment 4000
Investment Required (Rs. billion)
Urban
4.72 4.81 4.91 14.44
Rural
16.51 16.84 17.19 50.54
Total
21.22 21.65 22.10 64.97
This does not include population or cost estimates for AJK, FATA and Gilgit Baltistan as PSLM data
was not available for these.

89
Table 18: Sanitation Costing Balochistan
Sanitation Sector Investment Requirements For Balochistan Province
Balochistan 2011-2012 2012-2013 2013-2014 2014-2015 Total
Population (million)
Total 9.06 9.25 9.42 9.61
Urban 2.89 2.95 3.01 3.07
Rural 6.16 6.28 6.4 6.54
Per Capita 4000
67% Sanitation Coverage Target (percentage)
Urban
0 0 0
Rural 16 33 50 67
Investment Required (Rs. billion)
Urban
0.0 0.0 0.0 0.0
Rural
4.27 4.35 4.45 13.1
Total
4.27 4.35 4.45 13.1
80% Sanitation Coverage Target (percentage)
Urban

90
Rural 16 37 58 80
Investment Required (Rs. billion)
Urban
Rural
5.28 5.38 5.76 16.4
Total
5.28 5.38 5.76 16.4
100% Sanitation Coverage Target (percentage)
Urban 84 89 94 100
Rural 16 44 72 100
Investment Required (Rs. billion)
Urban
0.59 0.60 0.74 1.9
Rural
7.03 7.17 7.32 21.5
Total
7.62 7.77 8.06 23.5
Source: PSLM 2010-11 data and provincial PHED average costs)

91
Table 19: Sanitation Costing Khyber Pakhtunkhwa
Sanitation Sector Investment Requirements For KPK Province
KPK 2011-2012 2012-2013 2013-2014 2014-2014 Total
Population (million)
Total 23.77 24.26 24.74 25.24
Urban 7.6 7.76 7.91 8.07
Rural 16.16 16.49 16.82 17.16
Per Capita 4000
67% Sanitation Coverage Target (percentage)
Urban 63 64.3 65.6 66.9
Rural 56 59.67 63.34 67.01
Investment Required (Rs. billion)
Urban
0.41 0.42 0.43 1.26
Rural
2.42 2.47 2.52 7.41
Total
2.83 2.89 2.95 8.67
80% Sanitation Coverage Target (percentage)
Urban 63.00 69.00 75.00 80.00

92
Rural 56.00 64.00 72.00 80.00
Investment Required (Rs. billion)
Urban
1.86 1.90 1.94 5.70
Rural
5.28 5.38 5.49 16.15
Total
7.14 7.28 7.43 21.85
100% Sanitation Coverage Target (percentage)
Urban 63.00 75.00 87.00 100.00
Rural 56.00 71.00 86.00 100.00
Investment Required (Rs. billion)
Urban
3.72 3.80 3.87 11.40
Rural
9.89 10.09 9.61 29.60
Total
13.62 13.89 13.48 40.99
Source: PSLM 2010-11 data and provincial PHED average costs)

93
Table 20: Sanitation Costing Punjab
Sanitation Sector Investment Requirements For Punjab Province
Punjab 2011-2012 2012-2013 2013-2014 2014-2015 Total
Population (million)
Total 97.87 99.88 101.92 104.01
Urban 31.31 31.95 32.61 33.28
Rural 66.56 67.92 69.32 70.74
Per Capita 4000
67% Sanitation Coverage Target (percentage)
Urban Achieved 0 0 0
Rural 61 63 65 67
Investment Required (Rs. billion)
Urban
0 0 0 0.00
Rural
5.43 5.55 5.66 16.64
Total
5.43 5.55 5.66 16.64
80% Sanitation Coverage Target (percentage)
Urban Achieved - - -
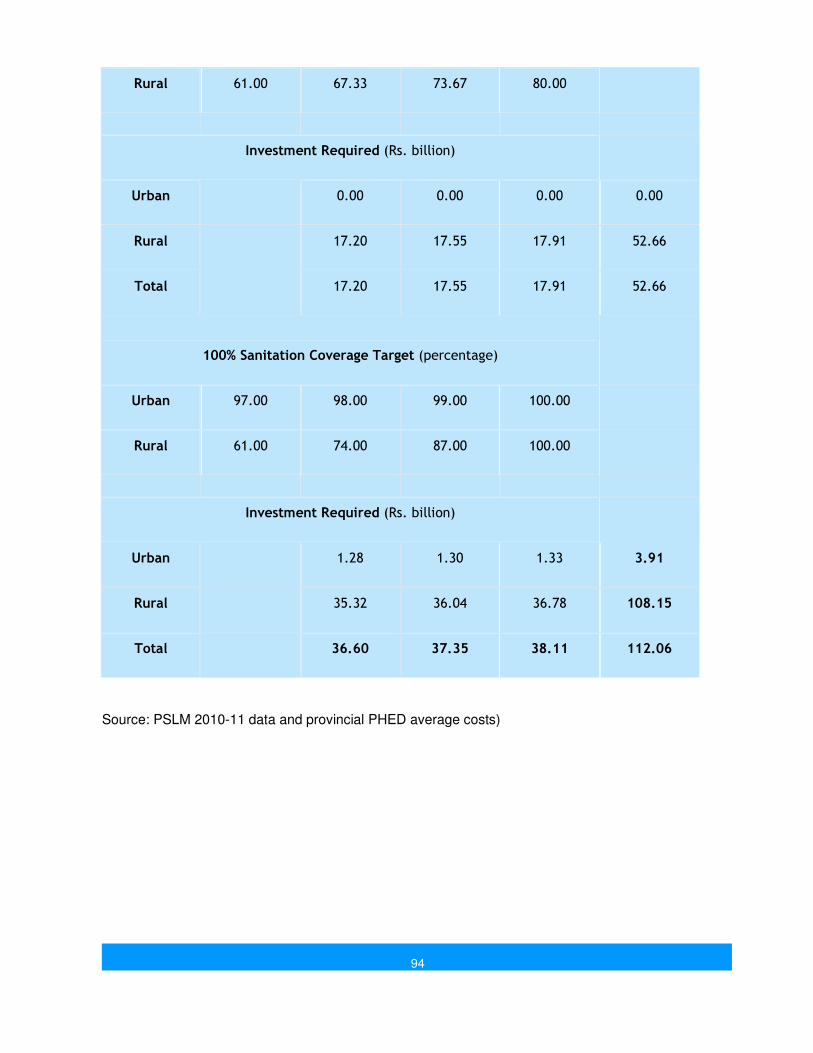
94
Rural 61.00 67.33 73.67 80.00
Investment Required (Rs. billion)
Urban
0.00 0.00 0.00 0.00
Rural
17.20 17.55 17.91 52.66
Total
17.20 17.55 17.91 52.66
100% Sanitation Coverage Target (percentage)
Urban 97.00 98.00 99.00 100.00
Rural 61.00 74.00 87.00 100.00
Investment Required (Rs. billion)
Urban
1.28 1.30 1.33 3.91
Rural
35.32 36.04 36.78 108.15
Total
36.60 37.35 38.11 112.06
Source: PSLM 2010-11 data and provincial PHED average costs)
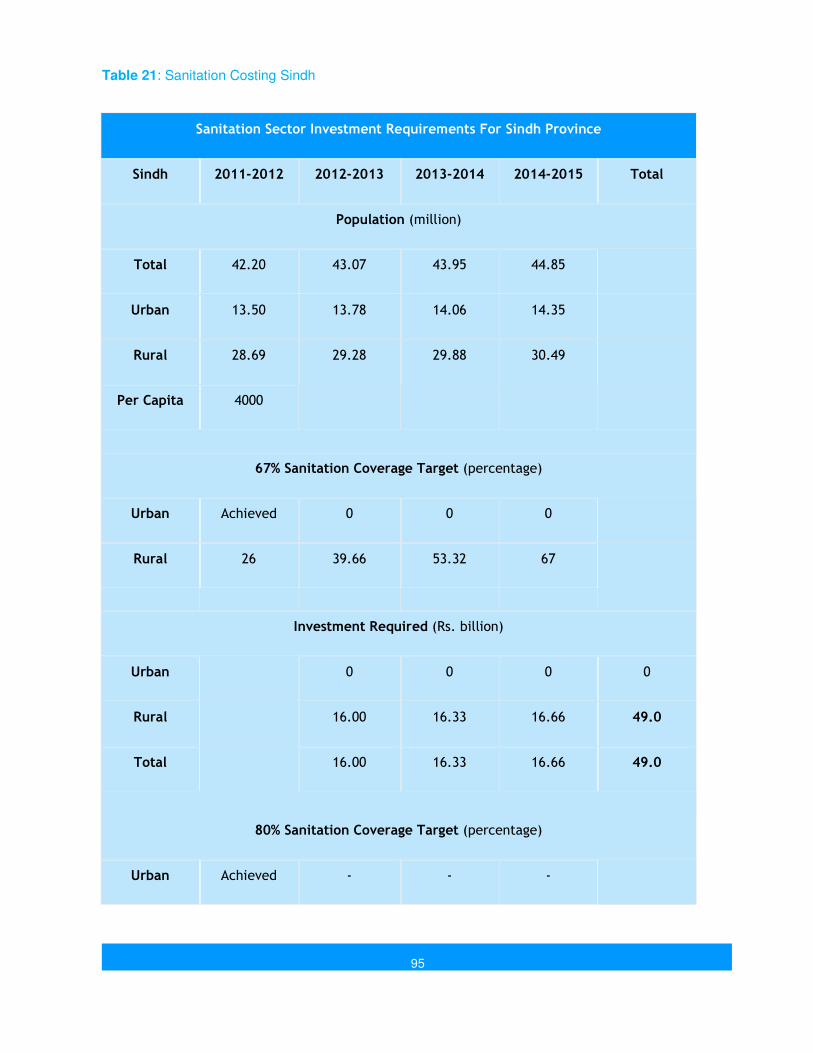
95
Table 21: Sanitation Costing Sindh
Sanitation Sector Investment Requirements For Sindh Province
Sindh 2011-2012 2012-2013 2013-2014 2014-2015 Total
Population (million)
Total 42.20 43.07 43.95 44.85
Urban 13.50 13.78 14.06 14.35
Rural 28.69 29.28 29.88 30.49
Per Capita 4000
67% Sanitation Coverage Target (percentage)
Urban Achieved 0 0 0
Rural 26 39.66 53.32 67
Investment Required (Rs. billion)
Urban
0 0 0 0
Rural
16.00 16.33 16.66 49.0
Total
16.00 16.33 16.66 49.0
80% Sanitation Coverage Target (percentage)
Urban Achieved - - -
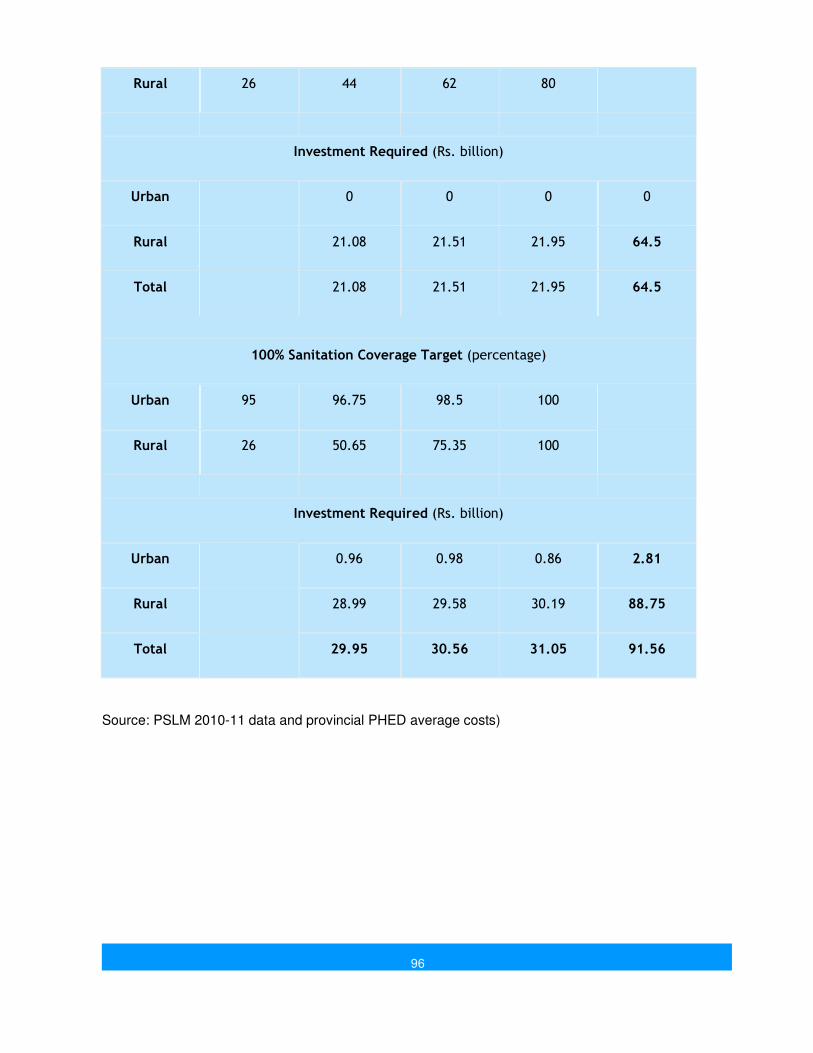
96
Rural 26 44 62 80
Investment Required (Rs. billion)
Urban
0 0 0 0
Rural
21.08 21.51 21.95 64.5
Total
21.08 21.51 21.95 64.5
100% Sanitation Coverage Target (percentage)
Urban 95 96.75 98.5 100
Rural 26 50.65 75.35 100
Investment Required (Rs. billion)
Urban
0.96 0.98 0.86 2.81
Rural
28.99 29.58 30.19 88.75
Total
29.95 30.56 31.05 91.56
Source: PSLM 2010-11 data and provincial PHED average costs)

97
Table 22: Sanitation Costing Summary
INVESTMENT FOR SANITATION
POPULATION 2012-2013 2013-2014 2014-2015 Total - PKRs
Total 172.90 176.44 180.03
Urban 55.30 56.44 57.59
Rural 117.57 119.97 122.42
INVESTMENT IN PKRS BILLION
Urban
67% 0.41 0.42 0.43 1.26
80% 1.86 1.90 1.94 5.70
100% 6.56 6.69 6.80 20.05
Rural
0.00
67% 28.12 28.69 29.29 86.10
80% 48.83 49.82 51.11 149.76
100% 81.23 82.88 83.90 248.02
Total
67% 28.54 29.11 29.71 87.36
80% 50.69 51.72 53.05 155.46
100% 87.79 89.57 90.71 268.07
This does not include population or cost estimates for AJK, FATA and Gilgit Baltistan as PSLM data
was not available for these.

98
United Nations Children’s Fund
Pakistan Country Office/WASH
90 Margala Road, F-8/2
Tel: 051-209-7848
www.unicef.org
Avicenna Consulting Pvt Ltd
18-B Kaghan Road, F-8/4
Islamabad
Tel: +92 51 8432882
www.avicennaconsulting.biz
Top Related