


Languages
Pages
Legal


by Talitha Bennett and David De Bellis
Flinders University

• Introduction
• Administration
• Survey Volume
• Take Up Rates
• Response Rates
• Level of Response
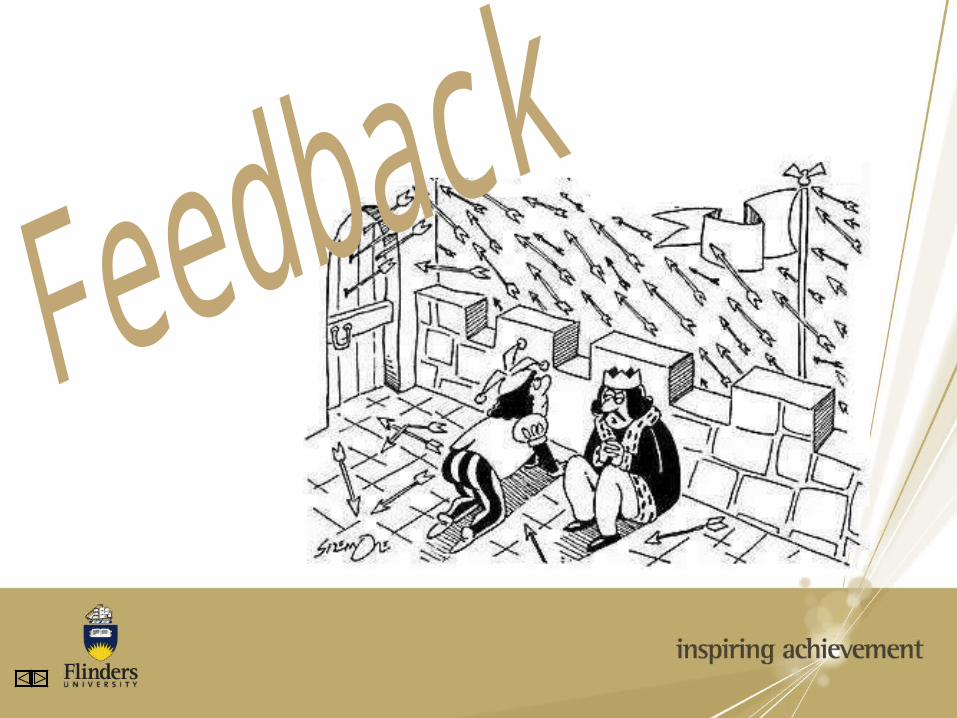
• Feedback

• Overview of Flinders
• Paper system SETs 1991-2008
• New system from 2009 (UNSW)
• Choice of paper or on-line
• Got through it :)
• Review of first half of 2009

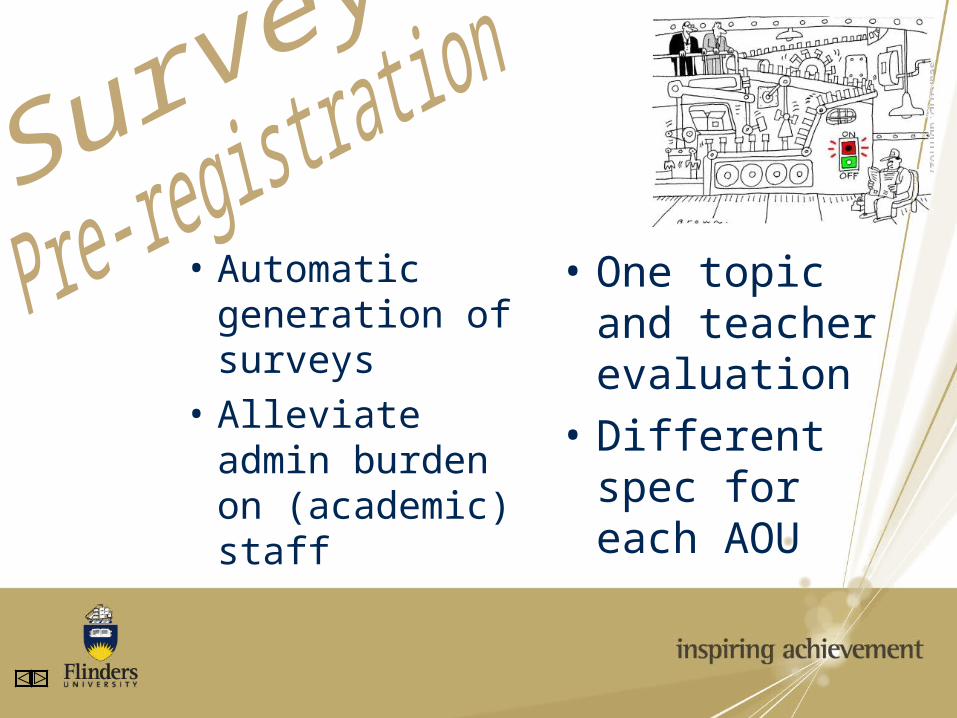
• One topic and teacher evaluation
• Different spec for each AOU
• Automatic generation of surveys
• Alleviate admin burden on (academic) staff

• Power users in each AOU with the ability to set up surveys for Academic Staff
• Centralised support from Planning Services Unit
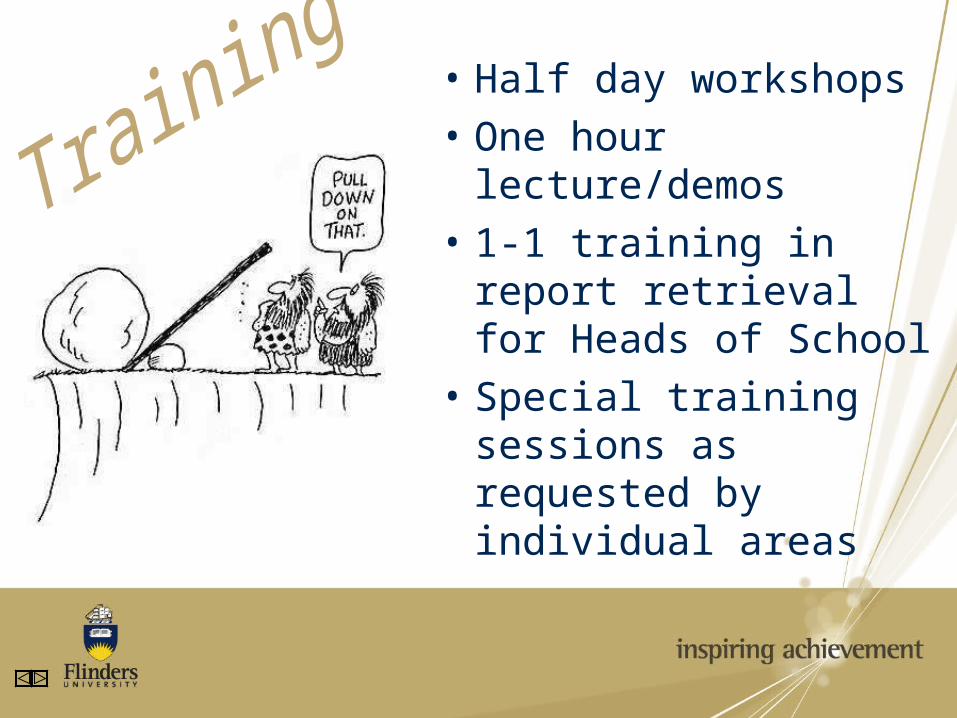
• Half day workshops
• One hour lecture/demos
• 1-1 training in report retrieval for Heads of School
• Special training sessions as requested by individual areas


0
50
100
150
200
250
300
350
400
450
EHLT HS SE SS
Teaching Faculty
Num
ber
of S
urve
ys
0%
50%
100%
150%
200%
250%
300%
Gro
wth
2008
2009Growth
TOPICEVALUATIONS450 to 1,150 (156%)

TEACHEREVALUATIONS868 to 1780 (105%)
0
100
200
300
400
500
600
700
EHLT HS SE SS
Teaching Faculty
Num
ber
of S
urve
ys
0%
50%
100%
150%
200%
250%
Gro
wth
2008
2009Growth
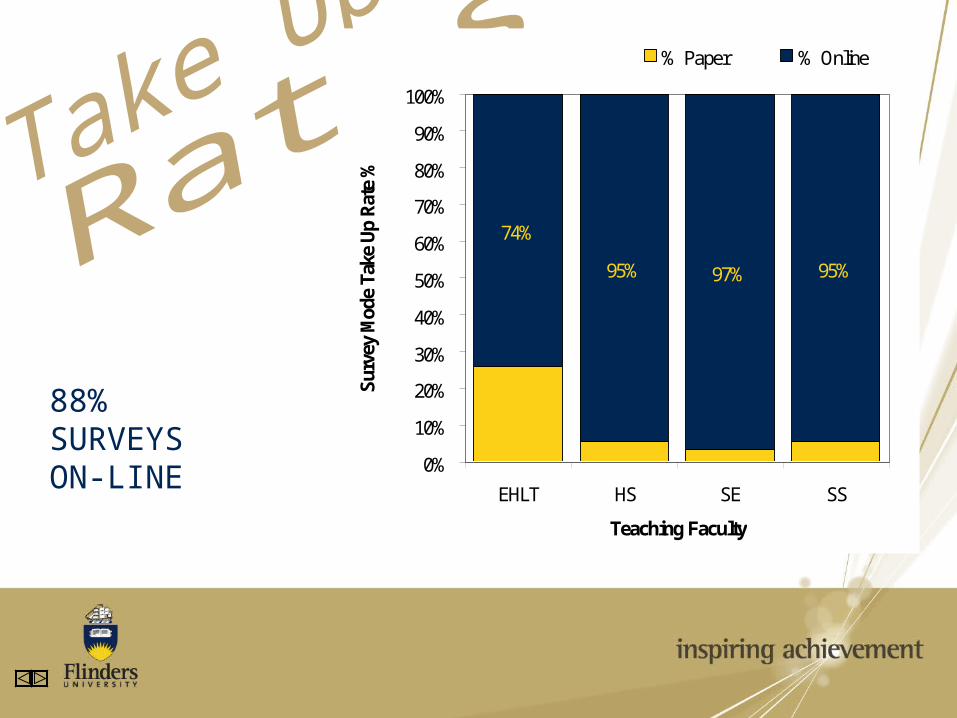
88% SURVEYS ON-LINE
74%
95% 97% 95%
0%
10%
20%
30%
40%
50%
60%
70%
80%
90%
100%
EHLT HS SE SS
Teaching Faculty
Sur
vey
Mod
e Ta
ke U
p R
ate
%
% Paper % Online
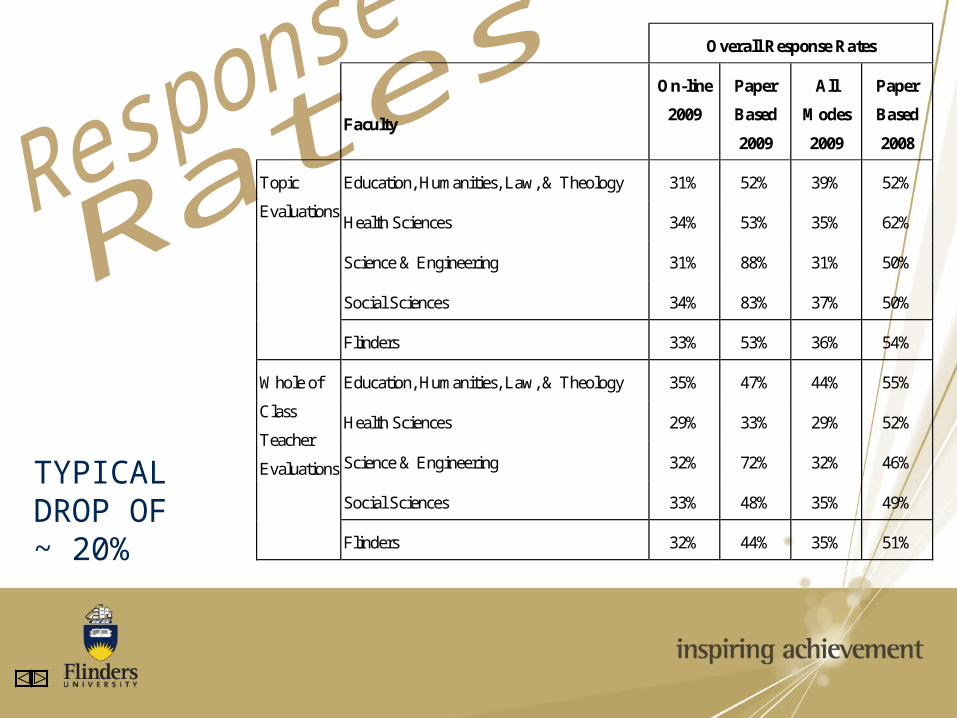
TYPICAL DROP OF~ 20%
Overall Response Rates
Faculty
On-line
2009
Paper
Based
2009
All
Modes
2009
Paper
Based
2008
Education, Humanities, Law, & Theology 31% 52% 39% 52%
Health Sciences 34% 53% 35% 62%
Science & Engineering 31% 88% 31% 50%
Social Sciences 34% 83% 37% 50%
Topic
Evaluations
Flinders 33% 53% 36% 54%
Education, Humanities, Law, & Theology 35% 47% 44% 55%
Health Sciences 29% 33% 29% 52%
Science & Engineering 32% 72% 32% 46%
Social Sciences 33% 48% 35% 49%
Whole of
Class
Teacher
Evaluations
Flinders 32% 44% 35% 51%

3.1%
2.3%
4.4%
7.5%
19.2%
31.9%
31.6%
1.9%
2.6%
4.3%
8.3%
20.7%
35.0%
27.3%
0% 20% 40% 60% 80% 100%
1
2
3
4
5
6
7
% Respondents
2008 (n = 7,710)
2009 (n = 4,135)
p = 0.000
• TOPIC EVALUATION• SAME 156 TOPICS• P 2008 v OL 2009• MORE POLARISED
BUT OVERALL IMPROVED?
Overall I was satisfied with the
quality of this topic

1.5%
0.9%
1.2%
3.7%
11.2%
22.7%
58.8%
0.8%
0.9%
1.1%
3.7%
10.8%
30.6%
52.0%
0% 20% 40% 60% 80% 100%
1
2
3
4
5
6
7
% Respondents
2008 (n = 2,882)
2009 (n = 1,479)
p = 0.000
• TEACHER EVALUATION
• SAME 57 TEACHERS• P 2008 v OL 2009• AGAIN MORE
POLARISED BUT OVERALL IMPROVED?
Overall, this person is effective as a
university teacher

• EHLT TOPIC EVALUATION ATYPICAL
• SIGNIFICANTLY LOWER RATINGS
• NEED TO LOOK AT TOPICS
3.1%
2.4%
4.1%
6.0%
17.3%
31.4%
35.8%
1.0%
1.4%
2.5%
6.0%
17.1%
37.1%
35.0%
0% 20% 40% 60% 80% 100%
1
2
3
4
5
6
7
% Respondents
2008 (n = 1,468)
2009 (n = 805)
p = 0.000
Education, Humanities,
Law & Theology
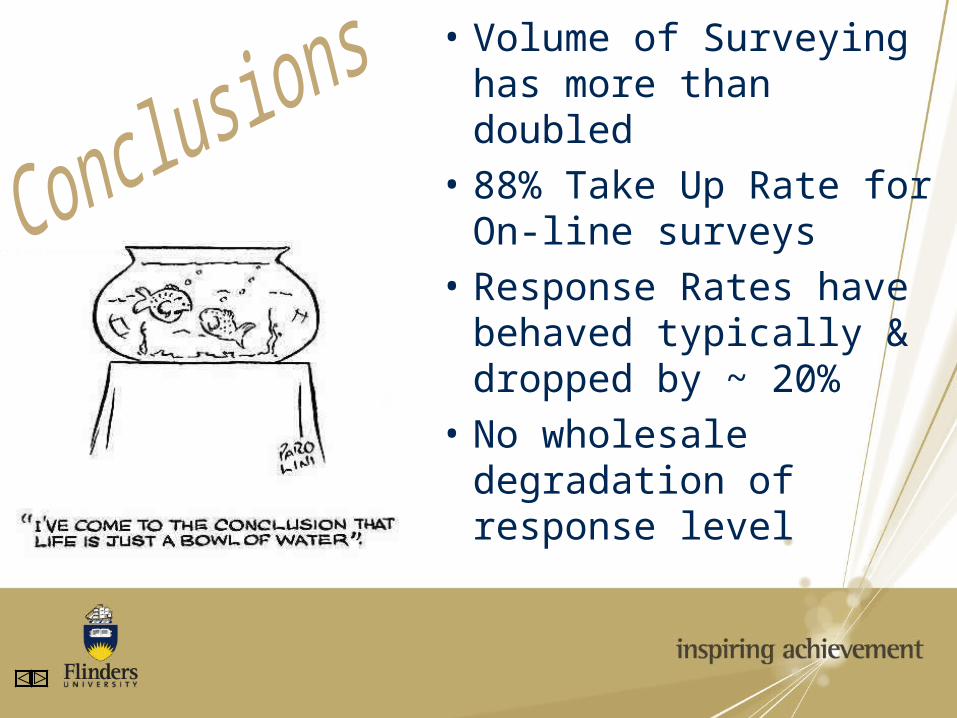
• Volume of Surveying has more than doubled
• 88% Take Up Rate for On-line surveys
• Response Rates have behaved typically & dropped by ~ 20%
• No wholesale degradation of response level

• Central support was appreciated
• User manual or on-line help
• Saving time and paper
• Response Rates

• Short student interviews video

Top Related