The move to flexible delivery mode unit of study evaluations
20
by Talitha Bennett and David De Bellis Flinders University
description
The move to flexible delivery mode unit of study evaluations. by Talitha Bennett and David De Bellis Flinders University. Overview. Introduction Administration Survey Volume Take Up Rates Response Rates Level of Response Feedback. Intro. Overview of Flinders - PowerPoint PPT Presentation
Transcript of The move to flexible delivery mode unit of study evaluations

by Talitha Bennett and David De Bellis
Flinders University

• Introduction
• Administration
• Survey Volume
• Take Up Rates
• Response Rates
• Level of Response
• Feedback

• Overview of Flinders
• Paper system SETs 1991-2008
• New system from 2009 (UNSW)
• Choice of paper or on-line
• Got through it :)
• Review of first half of 2009

• One topic and teacher evaluation
• Different spec for each AOU
• Automatic generation of surveys
• Alleviate admin burden on (academic) staff

• Power users in each AOU with the ability to set up surveys for Academic Staff
• Centralised support from Planning Services Unit
• Half day workshops
• One hour lecture/demos
• 1-1 training in report retrieval for Heads of School
• Special training sessions as requested by individual areas


0
50
100
150
200
250
300
350
400
450
EHLT HS SE SS
Teaching Faculty
Num
ber
of S
urve
ys
0%
50%
100%
150%
200%
250%
300%
Gro
wth
2008
2009Growth
TOPICEVALUATIONS450 to 1,150 (156%)

TEACHEREVALUATIONS868 to 1780 (105%)
0
100
200
300
400
500
600
700
EHLT HS SE SS
Teaching Faculty
Num
ber
of S
urve
ys
0%
50%
100%
150%
200%
250%
Gro
wth
2008
2009Growth
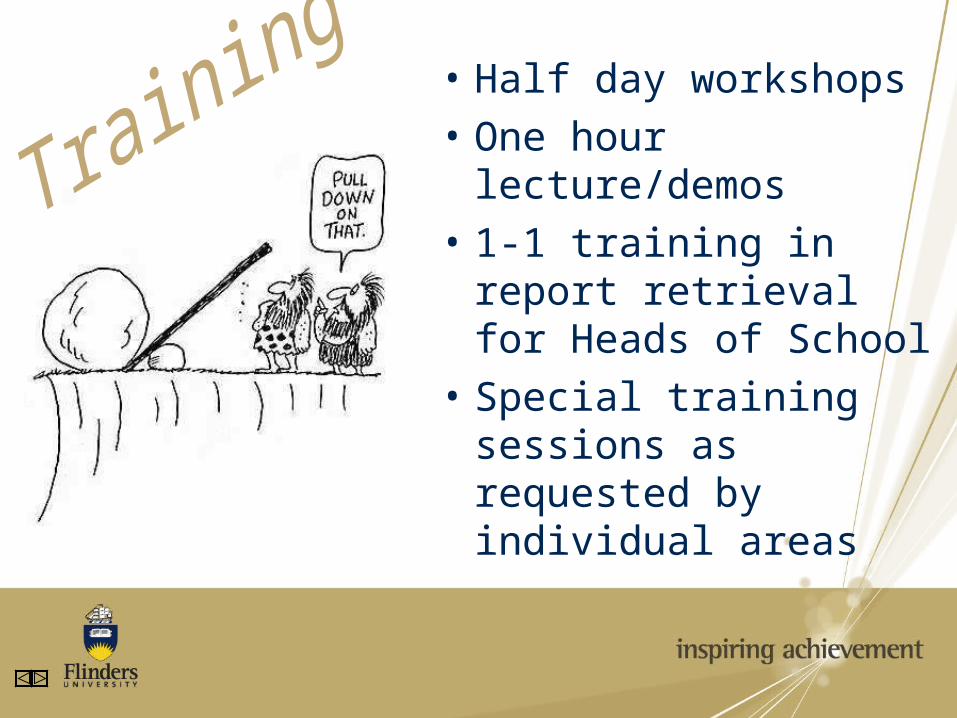
88% SURVEYS ON-LINE
74%
95% 97% 95%
0%
10%
20%
30%
40%
50%
60%
70%
80%
90%
100%
EHLT HS SE SS
Teaching Faculty
Sur
vey
Mod
e Ta
ke U
p R
ate
%
% Paper % Online
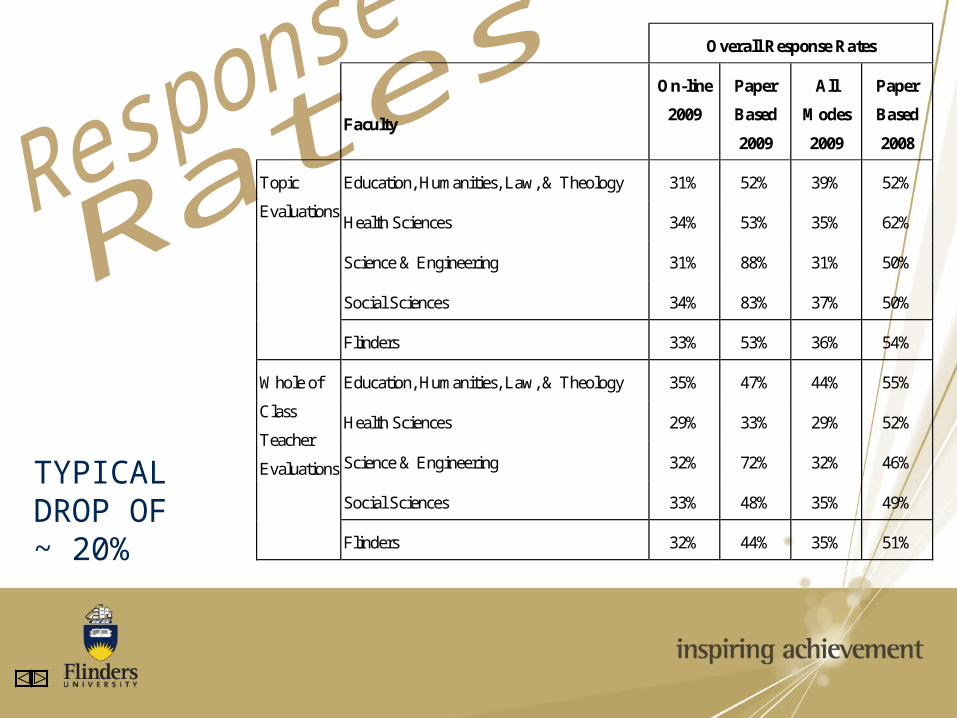
TYPICAL DROP OF~ 20%
Overall Response Rates
Faculty
On-line
2009
Paper
Based
2009
All
Modes
2009
Paper
Based
2008
Education, Humanities, Law, & Theology 31% 52% 39% 52%
Health Sciences 34% 53% 35% 62%
Science & Engineering 31% 88% 31% 50%
Social Sciences 34% 83% 37% 50%
Topic
Evaluations
Flinders 33% 53% 36% 54%
Education, Humanities, Law, & Theology 35% 47% 44% 55%
Health Sciences 29% 33% 29% 52%
Science & Engineering 32% 72% 32% 46%
Social Sciences 33% 48% 35% 49%
Whole of
Class
Teacher
Evaluations
Flinders 32% 44% 35% 51%

3.1%
2.3%
4.4%
7.5%
19.2%
31.9%
31.6%
1.9%
2.6%
4.3%
8.3%
20.7%
35.0%
27.3%
0% 20% 40% 60% 80% 100%
1
2
3
4
5
6
7
% Respondents
2008 (n = 7,710)
2009 (n = 4,135)
p = 0.000
• TOPIC EVALUATION• SAME 156 TOPICS• P 2008 v OL 2009• MORE POLARISED
BUT OVERALL IMPROVED?
Overall I was satisfied with the
quality of this topic

1.5%
0.9%
1.2%
3.7%
11.2%
22.7%
58.8%
0.8%
0.9%
1.1%
3.7%
10.8%
30.6%
52.0%
0% 20% 40% 60% 80% 100%
1
2
3
4
5
6
7
% Respondents
2008 (n = 2,882)
2009 (n = 1,479)
p = 0.000
• TEACHER EVALUATION
• SAME 57 TEACHERS• P 2008 v OL 2009• AGAIN MORE
POLARISED BUT OVERALL IMPROVED?
Overall, this person is effective as a
university teacher

• EHLT TOPIC EVALUATION ATYPICAL
• SIGNIFICANTLY LOWER RATINGS
• NEED TO LOOK AT TOPICS
3.1%
2.4%
4.1%
6.0%
17.3%
31.4%
35.8%
1.0%
1.4%
2.5%
6.0%
17.1%
37.1%
35.0%
0% 20% 40% 60% 80% 100%
1
2
3
4
5
6
7
% Respondents
2008 (n = 1,468)
2009 (n = 805)
p = 0.000
Education, Humanities,
Law & Theology
• Volume of Surveying has more than doubled
• 88% Take Up Rate for On-line surveys
• Response Rates have behaved typically & dropped by ~ 20%
• No wholesale degradation of response level

• Central support was appreciated
• User manual or on-line help
• Saving time and paper
• Response Rates

• Short student interviews video