


Languages
Pages
Legal

The ADAC Advanced Emergency Brake System test – a real life based approach for a better primary safety
T. Unger* V. Sandner*
* ADAC Technical Centre
Abstract:
Rear-end collisions are the most frequent same and opposite-direction crashes. Common causes include momentary inattention, inadequate speed or inadequate distance. While most rear-end collisions in urban traffic only result in vehicle damage or slight injuries, rear-end collisions outside built-up areas or on motorways usually cause fatal or serious injuries.
Driver assistance systems that detect dangerous situations in the longitudinal vehicle direction are therefore an essential safety plus. In view of this, for ADAC, systems that alert drivers to dangerous situations and initiate autonomous braking complement ESC as one of the most important active safety features in modern vehicles.
The aim of ADAC is to provide consumers with technical advice and competent information about the systems available on the market. Reliable comparative tests that are based on standardised test criteria may provide motorists with important information and help them make a buying decision. In addition, they raise consumer awareness of the systems and speed up their market penetration.
The assessment must focus on as many aspects of effectiveness as possible and include not only autonomous braking but also collision warning and autonomous brake assist.
The work of the ADAC accident research is the development of the testing scenarios with direct link to accident situations and the identification of useful test criteria for testing.
Introduction
With the development of passive safety features, vehicle safety has increased steadily over
the past decades. The introduction of the safety belt and airbag were milestones in passive
vehicle safety. In addition to the systems which mitigate the consequences of an accident,
active systems for the prevention of accidents and the mitigation of their consequences have
become increasingly important.
With the launch of ABS, the first driver assistance system was successfully introduced some
30 years ago. The mandatory introduction of ESC from 2012 will be another milestone in
driver safety. While ESC is a highly effective technology to prevent cars from skidding or
running off the road or to mitigate the consequences of an accident, it is more or less
ineffective in accidents which occur in the same and opposite direction of traffic.
Rear-end collisions are the most frequent same and opposite-direction crashes. Common
causes include momentary inattention, inadequate speed or inadequate distance. While most
rear-end collisions in urban traffic only result in vehicle damage or slight injuries, rear-end
collisions outside built-up areas or on motorways usually cause fatal or serious injuries.
Rear-end impacts are among the most common types of road accidents involving injury.
Driver assistance systems that detect dangerous situations in the longitudinal vehicle
direction are therefore an essential safety plus. In view of this, for ADAC, systems that alert
drivers to dangerous situations and initiate autonomous braking complement ESC as one of
the most important active safety features in modern vehicles.
The aim of ADAC is to provide consumers with technical advice and competent information
about the systems available on the market. Reliable comparative tests that are based on
standardised test criteria may provide motorists with important information and help them
make a buying decision. In addition, they raise consumer awareness of the systems and
speed up their market penetration.
Also, comparative product testing and the subsequent consumers’ buying decisions cause the
automotive manufacturers and suppliers to further develop their safety systems.
The test scenarios and criteria selected must be defined such that they represent real-life
accidents and allow drawing differentiated conclusions on the state of the art. Test standards
that are either too high or too low would cause the test results to be less diversified (e.g. all
systems tested are rated either “very good” or “poor”).
The assessment must focus on as many aspects of effectiveness as possible and include not
only autonomous braking but also collision warning and autonomous brake assist. Additional
maloperation tests must be introduced to minimise false alarms and increase the consumers’
acceptance of the systems.

Effectiveness analysis
The initial step in developing a new ADAC test is a catalogue of criteria established in
cooperation with an expert group. This ensures a useful, efficient and reliable testing
procedure that takes aspects of consumer protection, accident research and the state of the
art into account. The developments presented in this report aim at establishing a test for
active safety systems in passenger cars. The following aspects with regard to the significance
of these systems for integrated safety were taken into account with a special view to AEBS
development.
Longitudinal driver assistance systems and where they can be effective
Since the incidents documented by the accident researchers are based on accidents where
the ADAC rescue helicopters were deployed, high-severity injuries are typical. For instance,
95% of the incidents result in serious to fatal injuries. These characteristics differentiate the
findings of this project from the totality of road accidents, as the following analyses will
demonstrate. Since it is vital to prevent incidents resulting in serious injuries – or at least to
mitigate their consequences – the trends revealed in the surveys point strongly to the need for
further research into aspects of active and passive safety as well as traffic routing.
The severity of injuries as documented by
ADAC accident researchers (n= 4,804)
Light injuries
5% Life-threatening
injuries
27%
Serious injuries
65%
Fatal injuries
3%
Types of accidents as documented by ADAC accident researchers
(n=4,735)
Collisions with vehicle
turning into lane or
crossing vehicles 25%
Run-off accidents 27%
Pedestrian collisions 2%
Collisions with vehicle
driving ahead or
waiting 24%
Collisions with
parked or stationary vehicle
3%
Collisions with parallel
vehicles going in the same direction
3%
Collisions with
oncoming vehicle
8%
Obstacle collisions 0%
Other
8%
Figure 1: The severity and types of accidents as documented by ADAC accident researchers
The analysis of accidents by type shows percentages that correspond to the relevant data as
in [1], [2] and [3]. With 24% of all accidents in the ADAC accident research database, rear-
end collisions are the third most frequent accident type. The number one and number two
accident types are run-off accidents (27%) and accidents caused by turn-on or intersection
errors (25%).
The analysis also shows that the majority of accidents is caused by passenger cars (over
58%). Of the 1,117 rear-end accidents documented, 655 accidents were caused by
passenger cars. This means that in 13.8% of all accidents documented by ADAC accident
researchers a system that assists the driver in a rear-end impact could make a difference.
Since for the data recorded by ADAC accident researchers a special filter is used
(deployment of rescue helicopter), standardised literature research is conducted for problem

classification. The analyses of official statistics, accident research institutions and research
centres show that results are comparable.
Types of accidents in Germany (in and outside built-up areas)
[2009, Federal Statistical Office Wiesbaden, as per 2010]
Collision with vehicle
turning into lane
or crossing vehicle 28.20%
Collisions with
oncoming vehicle 7.73%
Collisions with
parallel vehicle going in the same direction
4.43%
Collisions with
vehicle
driving ahead
or waiting 15.64%
Collisions with
parked
or stationary
vehicles 6.38%
Other 11,98%
Run-off accidents
left 6.18%
Run-off accidents
right 9.26%
Obstacle
collisions 0.71%
Pedestrian
collisions 9.48%
Road accidents involving injury in European countries by accident type (incl. Switzerland)
(UNECE accident statistics, 2003, as per 2011)
Rear-end collisions 14.57%
Head-on collisions
9.18%
Collisions at intersections and while turning off
28.69%Other collisions,
incl. with parked
vehicles
10.31%
Pedestrian
collisions
13.01%
Single-vehicle
accidents 24.25%
Figure 2: Types of accidents in the Federal Republic of Germany [2] and the EC [3]
According to the official statics for Germany and some European countries, rear-end impacts
are the third most common accident type with an approx. 15% share in the total number of
accidents involving injuries. The share varies greatly in some countries. For instance, the US
2006 share of rear-end collisions with stationary or moving vehicles was approx. 28% [10].
Figure 3: Accidents involving injuries by type of accident constellation [9], [10], [11]
An analysis of available effectiveness studies confirms the importance of focusing on rear-end
collisions. In its GIDAS analysis of accidents that occurred before or in 2005, Bosch [1]
identifies an AEBS effectiveness potential in 12% of accidents involving injury.
The German Insurance Association (GDV) conducted a study in 2009 to assess the potential
of AEBS (incl. warning systems). The study showed that AEBS could prevent 17.8% of all car
accidents involving injury. [12]

Official rear-end collision statistics: road accidents/persons injured in Germany
The following section is based on data obtained from the 2010 official statistics of the Federal
Statistical Office, Wiesbaden. Relative to the totality of the accidents, rear-end collisions are
very significant, accounting for 16% of the 310,806 accidents involving injury.
Totality of road accidents in Germany
2009 (official accident statistics)
Collisions with parallel
vehicle going in the
same direction
4%
Collisions with
oncoming vehicle
8%
Collisions with vehicle turning into lane or
crossing vehicle 29%
Pedestrian collisions
9%
Obstacle collisions
1%
Run-off accidents
15%
Other
12%
Collisions with parked
or stationary vehicle 6%
Collisions with vehicle
driving ahead or
waiting
16
%
Figure 4: Accident types in Germany [2]
In these 48,625 rear-end collisions, a total of 71,106 persons sustained injuries [2], i.e. an
average of 1.46 persons is injured in each rear-end collision. Assuming the validity of the
same proportionalities as in the Bosch GIDAS analysis [1], AEBS would have prevented
approx. 37,000 accidents involving injury and 54,000 casualties on German roads in 2009
(effectiveness = 12% of accidents).
Road accidents/persons injured in Europe
To provide an overview of accidents across Europe, we analysed existing international
accident statistics. The 2003 UNECE [3] accident data for 21 European countries (incl.
Switzerland) enables a good comparison.
Number Country Total
Rear end
collisions
Rear end
Collisions in
%
Casualties in
rear end
collisions
1. Austria 43.350 8.108 18,70% 11.299
2.
Czech
Republic 27.320 2.831 10,36% 3.677
3. Denmark 6.749 744 11,02% 1.055
4. Estonia 1.931 181 9,37% 215
5. Finland 6.907 594 8,60% 901
6. France 90.130 9.628 10,68% 12.477
7. Germany 354.534 55.991 15,79% 81.940
8. Greece 15.751 1.402 8,90% 1.977
9. Hungary 19.976 2.773 13,88% 3.787
10. Ireland 5.985 857 14,32% 857
11. Lithuania 5.965 403 6,76% 522
12. Netherlands 31.635 4.947 15,64% 6.727
13. Norway 8.248 1.375 16,67% 2.325
14. Poland 50.203 5.167 10,29% 7.027
15. Portugal 41.495 3.926 9,46% 5.371
16. Romania 6.654 103 1,55% 129
17. Slovakia 5.002 661 13,21% 922
18. Slovenia 11.676 2.266 19,41% 3.666
19. Spain 99.987 17.953 17,96% 31.276
20. Sweden 18.365 2.636 14,35% 4.522
21. Switzerland 23.840 5.033 21,11% 7.060
Gesamt 875.703 127.579 14,57% 187.732
Road accidents involving injury in European countries by accident type (incl. Switzerland)
(UNECE accident statistics, 2003, as per 2011)
Rear-end collisions 14.57%
Head-on
collisions 9.18%
Collisions at intersections
and while turning off 28.69% Other collisions,
incl. with parked vehicles
10.31%
Pedestrian
collisions 13.01%
Single-vehicle accidents
24.25%
Figure 5: Total of rear-end collisions (left) and persons injured by accident type in Europe (right) [3]

An average of 15% of accidents on European roads involving injuries are rear-end collisions.
However, this share varies greatly from country to country, ranging from 1.55% in Romania to
21.1% in Switzerland. In the 21 countries, 187,732 people got injured or killed in 127,579
rear-end collisions in 2003, i.e. 1.47 persons injured per rear-end collision.
Since thorough data on the effectiveness of driver assistance systems in Europe is limited,
our test will be based on the assumption that effectiveness in Europe is comparable to that of
Germany; the experts slightly reduced it to 10% of accidents involving injuries. This means
that in the 21 European countries, AEBS can be effective in approx. 87,570 accidents with a
total of 128,700 persons injured (2003).
Based on the official accident statistics [2] and a 10% effectiveness, in 2008, AEBS would
have prevented the road injuries and deaths in the EU27 as set out below:
EU27, 2008 official statistics [2] AEBS effectiveness
Accidents involving injury 1,234,345 123,435
Road casualties 1,670,293 181,449
Prevention and mitigation potential
The assessment of rear-end collision prevention through AEBS aims at showing the potential
of safety enhancements expressed in the number of casualties. To demonstrate the
maximum benefit of AEBS, our considerations are based on a 100% AEBS penetration. We
will use the accident data available and not make any forecasts on the European accident
trends of the next few years.
ADAC cannot make any assumptions with regard to the system’s limits in rain, snow, built-up
areas etc. since there is no relevant data available. Reduced functionality will lower the
prevention and mitigation potential further. We will also consider our experiences with the
future tests of different systems as well as different interpretations.
Since AEBS come with a warning system, the results will depend on how the driver responds
to the warning signals and vehicle functions.
To make reliable assumptions on the prevention potential, we reviewed relevant studies. In
addition to ADAC accident research analyses, we found basically two different sources of
prevention potential data.
For the accidents documented by the ADAC accident researchers, AEBS has a potential to
prevent 75% of the accidents where it can be effective. [4] identified a 7% road death
prevention potential in the EU25. Georgi et. al. [1] show in their analysis that 72% of rear-end
collisions could be prevented; this is a reduction in the totality of road accidents by 8.6%.

ADAC eImpact [4] Georgi et.al. [1]
Effectiveness 13.8% 12%
Prevention potential 75% 72%
Prevention related
to the totality of
road accidents
10.4% 7% 8.6%
Dimension
Serious accidents
w. rescue helicopter
deployment
Europe Germany
Figure 6: AEBS prevention potential: ADAC data, Europe [4] and GIDAS [1]
According to [4], the maximum benefit for Europe is a 7% reduction in road injuries and
fatalities. In [1], the reduction rate is 8.6%. Based on the 2008 EU27 accident statistics and
depending on the prevention model selected, this translates into a reduction by 12,000 to
15,000 persons injured or killed in the EU25. The methodology as described in [4] considers
both a general reduction in road injuries and deaths in Europe and the AEBS penetration rate
of the vehicle population. In 2020, the number of road injuries and deaths in the EU25 is
expected to have decreased by 11,000.
In addition to preventing a collision altogether, AEBS reduce impact speed in rear-end
collisions. According to [1], average reduction in collision speed is 50%. This reduction in
speed causes a significant shift in injury risks and thus in the severity of the consequences of
an accident.
Accident scenarios and circumstances
The analysis of accident types is required to better understand conflict situations that cause
rear-end collisions. Rear-end collisions resulting in serious injuries chiefly occur on motorways
and extra-urban highways.
Where rear-end collisions happen
(n=139)
Built-up areas 1%
Extra-urban 42%
Motorway 57%
Figure 7: Where rear-end collisions happen as documented by ADAC accident researchers
Very many rear-end collisions in built-up areas result in light injuries and are consequently
under-represented in the ADAC accident researchers’ data. This is confirmed in [2] which
shows that the 2009 number of people killed in Germany in rear-end collisions outside built-up
areas was ten times as high as their number in built-up areas. This allows making indirect
assumptions on the speed constellations. Average speed ranges between 70 and 100kph on
extra-urban highways and between 100 and 130kph on motorways. To ensure that such
accidents, where injury risk is high, are prevented, AEBS must work reliably also at speeds of
around 100kph.
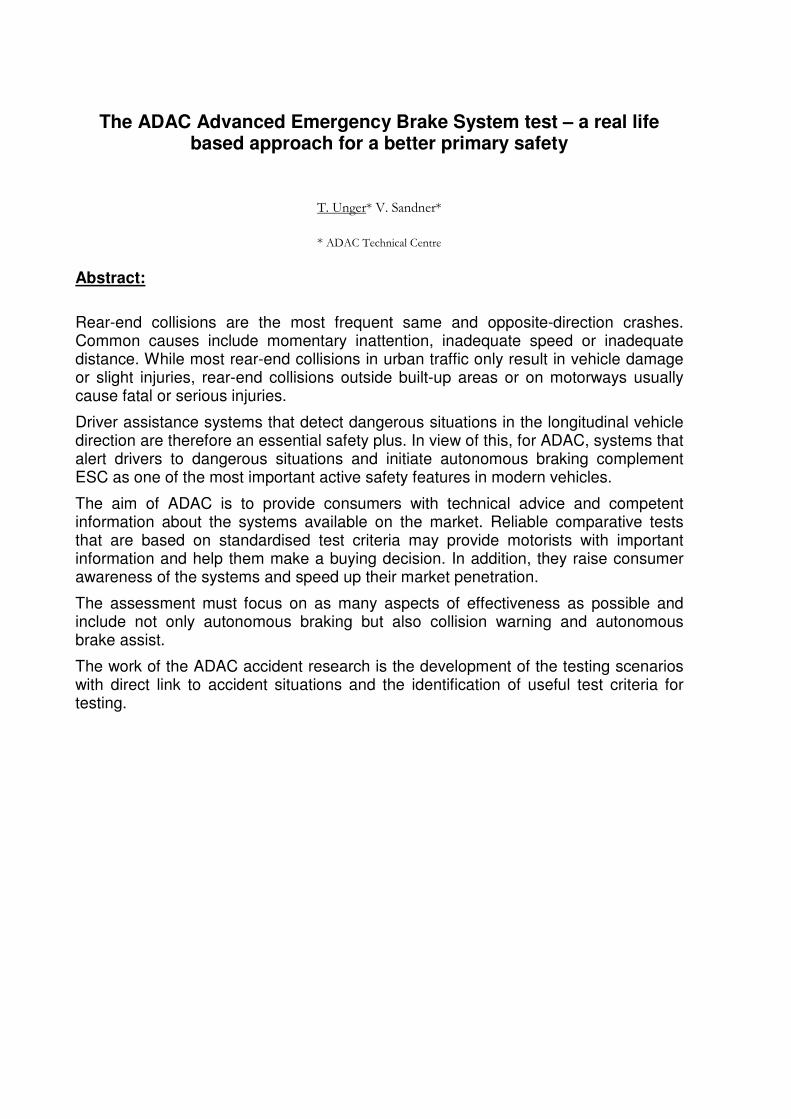
According to the German official accident statistics [2], almost two thirds of rear-end collisions
involving injury (48,625) occur in built-up areas.
Where rear-end collisions happen in Germany, 2009 [2]
In built-up areas
63%
Outside
built-up areas,
excl. motorway
23%
Motorway 14%
Figure 8: Where rear-end collisions happen in Germany, 2009 [2]
This is also what the analysis of European accident research data concludes. In several
sources (e.g. [7]), it is concluded that average speed in rear-end collisions (initial speed)
ranges between 40 and 60kph, meaning that in 55% of rear-end collisions, maximum speed is
50kph (speed limit in built-up areas).
In this speed range, rear-end collisions only rarely result in serious or fatal injuries.
Nevertheless, rear-end collisions are statistically very significant. Up to 70kph, approx. 75% of
rear-end collisions are AEBS-relevant. Where the vehicle behind travels at 110kph, this value
increases to approx. 90%.
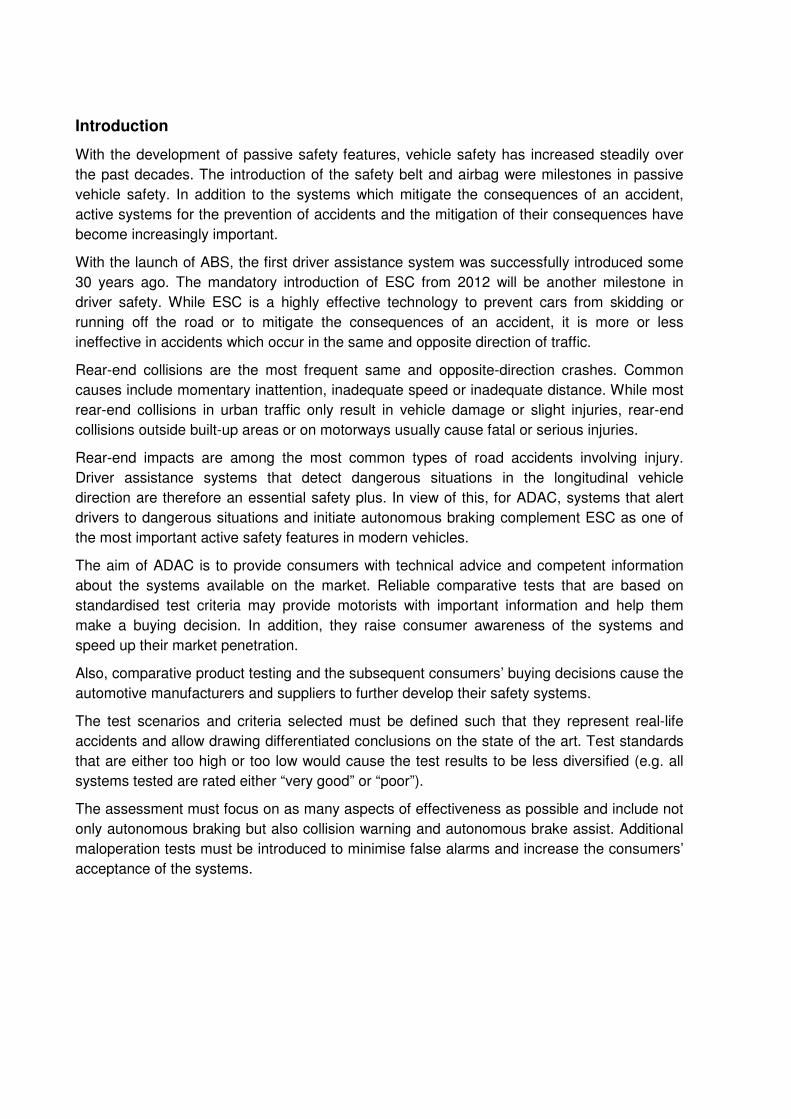
In addition to speed, overlap and the direction of impact are important factors for the
development of test scenarios. ADAC accident researchers found out that in 65% of accidents
overlap is over two thirds of the vehicle width. The PENDANT [7] project, where deformation
width was quantified indirectly based on the Collision Deformation Classification (CDC),
equally showed that in the majority of accidents (54%) overlap is at least two thirds of the
vehicle width.
Overlap in car-to-car rear-end collisions
(ADAC accident research)
0-25%
5%
26-66%
30
67-100%
65
%

Figure 9: Overlap in rear-end collisions; left: ADAC accident research, right: PENDANT [7]
Another factor used to describe an impact is the direction of force upon impact. Based on
CDC, it is defined as the Principal Direction of Force (PDOF). If the direction of force is
longitudinal (value 06 corresponding to the 6 o’clock direction), this would indicate that the
vehicle is impacted from the rear either directly at the centre or with a very large overlap.
PDOF in car-to-car rear-end collisions (ADAC accident research)
11.94
59.70
26.87
1.49 0% 10% 20% 30% 40% 50% 60% 70%
05060708
Figure 10: PDOF in rear-end collisions; left: ADAC accident research, right: PENDANT [7]
Both the ADAC accident researchers (60%) and the European PENDANT project (90%) show
that vehicles are mainly impacted at 6 o’clock of the vehicle coordinate system. This means
that in most rear-end collisions, the vehicle is hit directly at the centre or with a large overlap.
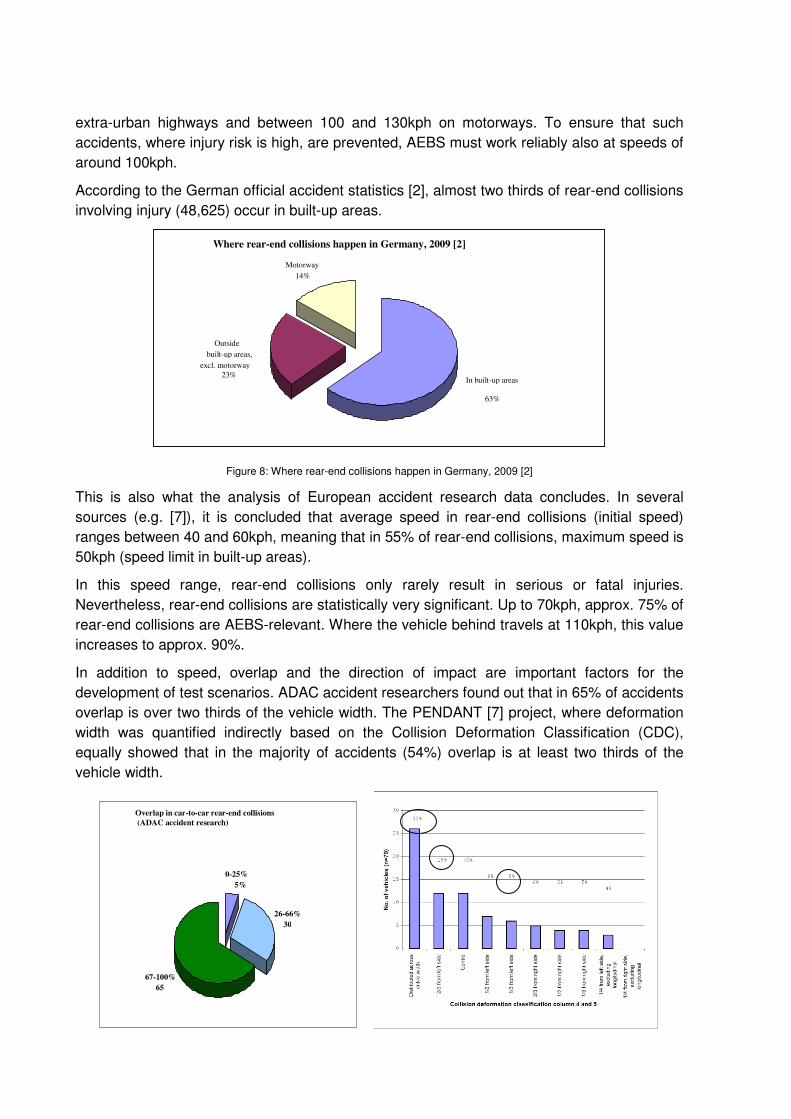
Injury mechanisms
In severe rear-end collisions, the occupants’ injury patterns are typical of the type of vehicle
used. Where the rear-ending vehicle is a passenger car, their occupants very frequently
sustain injuries to the chest, head and pelvis/legs.
Injury patterns: occupants in rear-ending car
(ADAC accident research) (n=138)
28 25
16 34
17 15
7
25 16
13 5
16
17
4 7
2
9
12
12
3 6
10
4 2
4
1
4
1
0 1
0
0
0
00
0
0
10
20
30
40
50
60
70
TBI Face Cervical spine
Thorax Abdomen Thoracic/
lumbar
spine Pelvis Upper
extremity Lower extremity
Fatal
Heavy to critical -life-threatening
Serious - not life-threatening
Light to medium No information
Severity of injuries
Figure 11: Injury patterns (occupants of rear-ending cars) in rear-end collisions (ADAC accident research)
Overlap is often large, subjecting the occupants to high deceleration forces which frequently
result in chest and brain injuries.
The occupants of the rear-ended passenger car very frequently sustain injuries to the spine,
chest and head.
Spinal injury is due to whiplash that occurs in rear-end collisions. Whiplash causes injuries to
the spinal ligaments, the spinal cord and the vertebral bodies as a result of the occupant’s
motion and the interaction between the occupant and the seat and headrest.
In addition to the severe injuries mostly caused in accidents that occur in extra-urban traffic,
accidents in built-up areas are statistically significant. Notably for the occupants of the rear-
ended vehicles, cervical spine (whiplash) injuries are typical in low-speed rear-end collisions
(impact speed of 10-30kph). The high-speed relative movement (nod) of the head causes a
sprain or injury in the ligaments of the cervical spine a.k.a. whiplash. This type of injury is
rarely life-threatening, but often causes considerable handicaps for the injured. The economic
loss accountable to such injuries is considerable.
To sum things up, the injury mechanisms can be presented on risk charts in dependence of
impact speed (cf. Figure 9).
A system that prevents accidents or absorbs a significant amount of vehicle energy (by
reducing speed) tremendously lowers the occupants’ risk of sustaining serious or fatal
injuries.
Driver behaviour
An analysis of the driver responses documented by the ADAC accident researchers shows
that the drivers most frequently initiated a braking manoeuvre. Swerving occurred in only 5%
of cases.

Driver response in rear-end collisions (ADAC accident research)
No reaction
22%
Braking
66%
Swerving
5%
Braking &
swerving
7%
Driver response in rear-end collisions (ADAC accident research)
No braking
25%
Partial braking (>0-75%)
26%
Full braking
(>75%) 49%
Figure 12: Driver response in rear-end collisions (ADAC accident research)
In almost 50% of braking manoeuvres, the drivers applied full braking pressure (>75%) even if
they initiated the manoeuvres too late. In the remaining 50%, the drivers initiated partial
braking or did not brake at all.
A GIDAS data analysis by Bosch [8] shows that driver response in rear-end collisions is very
similar.
Driver response in rear-end collisions1
.
31%
2% 4% 11%
32%
20%
0%
10%
20%
30%
40%
0% < 25% 26 - 50% 51 - 75% > 75% ~100%
No braking Partial braking
1 Auswertung in GIDAS von 1103 Auffahrunf ä llen mit Verletzten. 2 Maximal m ö gliche Bremsverz ö gerung
basiert auf Wetter - und Stra ß enbedingungen
Ratio real-life braking response compared to maximum possible braking deceleration²
1 GIDAS analysis of 1,103 rear-end collisions involving injury 2 Maximum possible braking deceleration based on weather and road conditions
Sh
are
in
accid
en
ts
Full braking
Figure 13: Driver response in rear-end collisions, GIDAS [8]
AEBS deliver a phased response. After an initial warning, there is a short jolt of the brakes to
increase awareness. Finally, at the “point of no return”, when collision is unavoidable, full
braking power is applied automatically (emergency braking).
General accident scenarios
The development of general accident scenarios includes:
- conflict situation
- speed range
- overlap
Based on the accident data, the most frequent conflict situations are set out below:
- Approaching a slow-moving vehicle
- Approaching a braking, strongly decelerated or stationary vehicle (traffic jam
tail end, waiting traffic)
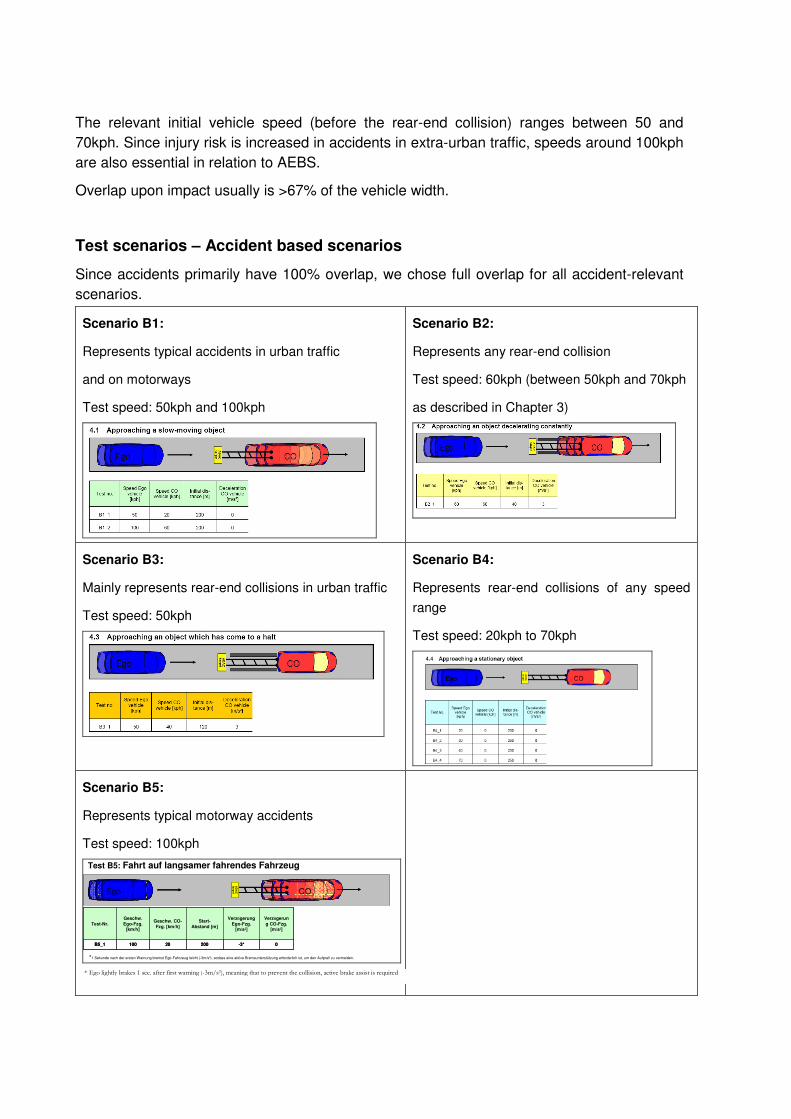
The relevant initial vehicle speed (before the rear-end collision) ranges between 50 and
70kph. Since injury risk is increased in accidents in extra-urban traffic, speeds around 100kph
are also essential in relation to AEBS.
Overlap upon impact usually is >67% of the vehicle width.
Test scenarios – Accident based scenarios
Since accidents primarily have 100% overlap, we chose full overlap for all accident-relevant
scenarios.
Scenario B1:
Represents typical accidents in urban traffic
and on motorways
Test speed: 50kph and 100kph
Scenario B2:
Represents any rear-end collision
Test speed: 60kph (between 50kph and 70kph
as described in Chapter 3)
Scenario B3:
Mainly represents rear-end collisions in urban traffic
Test speed: 50kph
Scenario B4:
Represents rear-end collisions of any speed
range
Test speed: 20kph to 70kph
Scenario B5:
Represents typical motorway accidents
Test speed: 100kph
EgoEgo COCO
AD
AC
targ
et
AD
AC
targ
et
*1 Sekunde nach der ersten Warnung bremst Ego-Fahrzeug leicht (-3m/s²), sodass eine aktive Bremsunterstützung erforderlich ist, um den Aufprall zu vermeiden.
Test B5: Fahrt auf langsamer fahrendes Fahrzeug
-3*
Verzögerung
Ego-Fzg. [m/s²]
200
Start-
Abstand [m]
20
Geschw. CO-
Fzg. [km/h]
0100B5_1
Verzögerun
g CO-Fzg. [m/s²]
Geschw.
Ego-Fzg. [km/h]
Test-Nr.
-3*
Verzögerung
Ego-Fzg. [m/s²]
200
Start-
Abstand [m]
20
Geschw. CO-
Fzg. [km/h]
0100B5_1
Verzögerun
g CO-Fzg. [m/s²]
Geschw.
Ego-Fzg. [km/h]
Test-Nr.
* Ego lightly brakes 1 sec. after first warning (-3m/s²), meaning that to prevent the collision, active brake assist is required
Recommendations and limitations
The above scenarios are a first step in the assessment of active safety systems. We focused
on the most important scenarios while neglecting any real-life disturbance. Any future
assessment will require expanded testing procedures that take complex traffic situations and
driver tasks into account.
References
[1] Georgi, A. et al.; NEW APPROACH OF ACCIDENT BENEFIT ANALYSIS FOR REAR
END COLLISION AVOIDANCE AND MITIGATION SYSTEMS, ESV 2009, paper number 09-
0281
[2] Verkehrsunfallstatistik 2009, Bundesamt für Statistik, Wiesbaden, as per 2010
[3] www.unece.org, accident statistics as per 2011
[4] Socio-economic Impact Assessment of Stand-alone and Co-operative Intelligent Vehicle
Safety Systems (IVSS) in Europe, Deliverable D4, V2.0, 11 August 2008
[5] Socio-economic Impact Assessment of Stand-alone and Co-operative Intelligent Vehicle
Safety Systems (IVSS) in Europe, Deliverable D3, V1.0, 14 December 2006
[7] PENDANT, Appendix 4 Rear End Collisions Analysis as part of Deliverable D11, 17
November 2006
[8] BOSCH, GIDAS – Unfallanalyse zu Auffahrunfällen, 2010 presentation
[9] DeStatis, Road Accident statistic Germany 2006
[10] NHTSA, Traffic Safety Facts, USA 2006
[11] IATSS, Road Accidents Statistics, Japan 2006
[12] GDV (Kühn, Hummel et.al.): Benefit estimation of advanced driver assistance systems for
cars derived from real-life accidents; 21st ESV conference in Stuttgart 2009
Top Related