


Languages
Pages
Legal


Systemic Size, Bank Risk and Systemic Crises
Jens Hagendor¤a;�, Kevin Keaseya; Francesco VallascasbaUniversity of Edinburgh, 29 Buccleuch Place, Edinburgh EH8 9AL, UKbUniversity of Leeds, Maurice Keyworth Building, Leeds LS2 9JT, UK
June 18, 2012
Abstract
This paper analyzes the relationship between systemic size, measured as the ratioof bank assets to GDP, and bank risk. Based on an international sample of banks,we demonstrate that systemic size does not a¤ect bank risk-taking. However, andconsistent with explanations that systemically large banks maximize the value of the�nancial safety net, we show that systemically larger banks engaged in more aggressiverisk-taking during the recent crisis. The risk e¤ect of systemic size during the re-cent crisis is higher for more leveraged banks, relatively undiversi�ed banks and bankswhich have issued little or no subordinated debt. Crucially, the risk e¤ect of systemicsize during the recent crisis does not extend to other crisis periods. The recent cri-sis, therefore, appears to have been unique in terms of its behavioral implications forsystemically large banks. Our results caution that regulatory attempts to restrict therisk-taking of systemically large banks should take the form of contingent regulationsthat come into e¤ect under rare events such as the recent crisis.
JEL Classi�cation: G21, G33, G01.Keywords: Banks; Size; Risk-taking; Systemic Crises; Default Risk.
�Corresponding author. Tel: +44 (0)131 6502796, e-mail addresses: jens.hagendor¤@ed.ac.uk (Hagen-dor¤), [email protected] (Keasey), [email protected] (Vallascas).

1 Introduction
It is well known that bailout expectations in the banking industry create moral hazard and
cause banks to engage in more aggressive risk-taking behavior (Cordella and Yeyati, 2003;
Gorton and Huang, 2004; Dam and Koetter, 2012). Relatedly, this moral hazard behavior
may be particularly acute for large banks, because large banks are most likely to be bailed
out (Boyd and Runkle, 1993; Penas and Unal, 2004; Acharya and Yorulmazer, 2007; Brown
and Dinç, 2011). Concerns that large banks exploit their implicit claim on the safety net by
taking on more risk have been heightened by the performance of several of the world�s most
systemically large banks during the �nancial crisis (Financial Stability Board, 2010; Basel
Committee, 2011). By means of illustration, seven out of the ten systemically largest banks
were subject to a taxpayer-funded bailout during the crisis.1
The issue of excessive risk-taking by systemically large banks has also gained attention
from the fact that the banking industry has seen increasing scale and concentration over the
last two decades. Partly in response to deregulation, many banks engaged in mergers and
acquisitions, thus, causing a rapid growth in bank asset size. This fast-paced consolidation of
bank assets has meant that banks have grown rapidly relative to the economies in which they
are chartered. This is clearly illustrated by Figure 1 which plots the evolution of the ratio
of bank assets to GDP for the 50 systemically largest banks since 1998. While the average
systemic size of these banks was 40% of GDP in 1998, it reached more than 70% in 2007,
and exceeded 200% for a number of individual banks (among them Credit Suisse, Dankse,
Fortis, and UBS).
1In order of magnitude, the ten systemically most important banks (in terms of bank assets to GDP) in
our sample during 2007 are (whether they were bailed out during the crisis is indicated in parentheses): UBS
(yes), Ageas (yes), Credit Suisse Group (no), Danske Bank (yes), Dexia (yes), Arab Bank (no), Royal Bank
of Scotland Group (yes), Nordea Bank (no), Depfa Bank (yes; via parent company), Bank of Ireland (yes).
1

Partly in response to concerns over bank risk-taking, policymakers are currently con-
sidering various initiatives aimed at imposing restrictions on the size, capital structure and
income mix of banks. For instance, some policymakers have recently proposed caps on the
size of domestic banks.2 Also, the Basel Committee (2011) advises to raise the capital require-
ments pertaining to Global Systemically Important Banks (G-SIBs) which include numerous
systemically large banking �rms under the proposed Basel III capital adequacy framework.3
Also, the Dodd-Frank Act bars U.S. bank holding companies from proprietary trading and
certain types of other investments. Similarly, the Independent Commission on Banking has
recently proposed that UK banks will need to separate and independently capitalize their
retail and investment banking activities (ICB, 2011).
This paper has two purposes: �rst, to examine if the risk of banks changes as they
grow in systemic size during both normal and crisis periods; second, to identify some of the
drivers which shape the relationship between systemic size and risk-taking of systemically
2In the U.S., the Obama Administration has previously suggested limiting any bank�s share of national
bank liabilities to 10% (previously, the size limit was de�ned in terms of deposits; see �Glass-Steagall lite�,
The Economist, 22 January 2010). In the UK, Sir Mervyn King, Governor of the Bank of England, is quoted
as saying �if a bank is "too big to fail", then it is too big�(�King calls for banks to be �cut down to size�.
The Guardian. 17 June 2009), and the Vice Chairman of the Swiss central bank announced in 2009 that
�Zurich and other centres would consider capping the size of institutions to avoid risks posed by �too-big-
to-fail� banks�(�In Death Do We Part�, Financial Times, 9 July 2009). Equally, there have been calls by
policymakers in Belgium and the Netherlands to limit the systemic size of banks operated in these countries.
See also, �Banks Reject Call for Size Cap�, Australian Financial Review, 19 August 2010.
3G-SIBs are banks that are deemed systemically relevant because of their size, complexity and intercon-
nectedness with the rest of the �nancial system. For these institutions, the Basel Committee (2011) proposes
to increase the minimum regulatory capital ratio, de�ned as regulatory capital over risk-weighted assets, by
up to 3.5% above the minimum applied to non-systemically important banks. The additional capital is to be
held in equity and equity-like �nancial instruments.
2
large banks (such as a bank�s capital structure and income diversi�cation). Empirical research
has only recently begun to consider the risk implications linked to systemic size in banking
(Demirgüç-Kunt and Huizinga, 2010; 2011). Rather than examine systemic size, previous
work on size and risk has focused on stand-alone (or absolute) bank size and found some
evidence that larger banks take more risks (e.g., Boyd and Runkle, 1993; Benston, Hunter
and Wall, 1995; Penas and Unal, 2004; Gropp at al., 2011; DeJonghe, 2010; Brunnermeier et
al., 2012).
[Figure 1]
The distinction between stand-alone and systemic size is important, because growth in
systemic size a¤ects the risk and return pro�le of banks di¤erently from growth in stand-alone
size. Demirgüç-Kunt and Huizinga (2011) show that, while growth in stand-alone size o¤ers
banks a trade-o¤ between pro�tability and risk, growth in systemic size is undesirable as it
reduces return without a clear impact on risk. Moreover, the distinction between stand-alone
size and systemic size is important, because banks that are small in absolute terms, may be
systemically large when chartered in a small economy. Bailing out systemically large banks
can create substantial �scal costs (e.g. via asset guarantees, capital or liquidity support)
which, as demonstrated by the recent cases of Ireland and Iceland, can bring countries per-
ilously close to a sovereign debt crisis (IMF, 2009). Risk shifting behavior could, therefore, be
particularly accute (and, by extension, particularly important for policymakers) when banks
are large in systemic terms, but not necessarily when banks are large in absolute terms.
Additionally, existing empirical work does not consider the risk-taking behavior of sys-
temically large banks during banking crises. This is unfortunate, because the risk-taking
behavior of systemically large banks maybe excessive when the prospect of bank failures is
widespread and regulators are reluctant to take over or close failing banks (Acharya and
Yorulmazer, 2007; Brown and Dinç, 2011). Therefore, the main question we address in this
3
paper� whether systemic size a¤ects bank risk-taking during normal and crisis times� is
highly relevant and cannot be addressed using previous evidence on size and risk-taking in
banking.
We start the analysis by showing that, for a large panel of international banks, systemic
size does not a¤ect bank risk (based on the Merton [1974] distance to default model) under
non-crisis conditions. However, systemically larger banks have increased their risk-taking
during the recent crisis. This �nding holds after changes to the model speci�cation and the
way we measure bank risk-taking. Next, we demonstrate that the risk-increasing e¤ect linked
to systemic size does not extend to other systemic banking crises that occurred during our
sampling period.
We then extend the analysis to investigate some of the driving forces behind the in-
creased risk-taking of systemically large banks during the recent crisis. First, we examine
explanations that risk-taking during the crisis results from banks attempting to maximize
shareholder value before the crisis. In e¤ect, we seek to ascertain whether the systemic size-
risk relationship during the crisis is driven by �bad luck�(rather than bad behavior on the
part of banks). The results reported here do not o¤er evidence consistent with the bad luck
explanation and we interpret this as consistent with systemically large banks capitalizing on
an increased prospect of regulatory forbearance during a severe crisis. Second, the results
show that, for a given level of systemic size, more leverage, less income diversi�cation and less
subordinated debt on a bank�s balance sheet each exacerbate risk-taking during the recent
crisis.
This paper makes a number of contributions to the debate on size and risk in bank-
ing. First, we extend the to date limited literature which focuses on systemic rather than
on stand-alone size in banking. In particular, we complement Demirgüç-Kunt and Huizinga
(DH) (2011), who analyze the relationship between systemic size and bank z-scores for an
international sample of banks, by providing the �rst analysis of the risk e¤ect of systemic
4

size during periods of �nancial distress. Overall, our results con�rm DH�s �nding that sys-
temically large banks do not take on more risk during non-crisis conditions, but, crucially,
we also show that systemically large banks took on more risk during the recent crisis and
identify some of the drivers of this risk-taking behavior.
Second, the paper contributes to work on bank diversi�cation and risk (DeYoung and
Roland, 2001; Stiroh, 2004; Stiroh and Rumble, 2006; Baele et al., 2007; DeJonghe, 2010;
Brunnermeier et al., 2012) by examining the interaction between systemic size and diver-
si�cation on bank risk-taking. Our results show that as banks grow in systemic size, they
are more likely to engage in risk shifting if they are relatively less diversi�ed. Critically,
this result does not support recent regulatory calls to restrict the scope of bank activities.
Instead, our results suggest that bank activity restrictions would only be e¤ective if jointy
implemented with restrictions on the systemic size of banks.
Relatedly, this paper contributes to ongoing policy discussions over the capital structure
of banks, in particular the issuance of contingent capital (Flannery, 2005; Kashyap et al.,
2008) and subordinated debt instruments (Flannery and Sorescu, 1996; Evano¤ and Wall,
2002; Sironi, 2003). Speci�cally, our result that leverage increased bank risk-taking only
during the recent crisis questions whether it is justi�ed to subject large banks to higher
equity holdings on a permanent basis and points to the use of contingent capital instead.
Furthermore, our result that even modest amounts of subordinated debt curtailed risk-taking
during the crisis shows that subordinated debt investors are e¤ective in imposing enhanced
market discipline at times of distress when the prospect of regulatory forbearance is high and
other outside investors in banks may not monitor risk-taking e¤ectively (Kwast et al. 1999;
Chen and Hasan, 2011). Consequently, our results support the notion that systemically large
banks should be obliged to issue some of form subordinated debt instruments.
Finally, our work also contributes to previous studies (which hitherto have been based
on stand-alone bank size) that try to explain why large banks appear disproportionately
5
a¤ected by systemic crises (e.g., DeJonghe, 2010; Brunnermeier et al., 2012; Beltratti and
Stulz, 2012). Speci�cally, we rule out that risk-taking by systemically large banks during
the recent crisis is the result of these banks having positioned themselves in ways that was
value-maximizing before the crisis, but which, for reasons unknown at the time, made them
more exposed to the crisis. Instead, our �ndings are consistent with explanations that bank
risk-taking during the crisis is the result of banks capitalizing on the prospect of regulatory
forbearance during a crisis (Acharya and Yorulmazer, 2007; Brown and Dinç, 2011).
The paper proceeds as follows. The next section surveys the related literature of the
study. Sections 3 to 5 explain the sampling, measurement of risk and the overall method-
ological approach, respectively. Section 6 discusses the results on the relationship between
systemic size and default risk in normal and distress systemic conditions. Section 7 analyzes
which factors might moderate the importance of systemic size during the recent crisis. The
�nal section concludes.
2 Related Literature:
Systemic Size and Risk in Banking
Empirical evidence on how risk-taking changes as banks grow in systemic size has remained
scant to date and has not considered how the relationship between systemic size and risk
changes during crisis periods. As a result, the e¤ect of systemic size on bank risk-taking
during crisis and non-crisis conditions remains uncertain ex ante.
One view holds that banks take on more risk as they grow in systemic size. This is
because the failure of a systemically large bank creates considerable negative externalities
often beyond a country�s �nancial system and its real economy. Since the prospect of large
externalities raises the expectation that a bank will be subject to a bailout (Financial Stability
Board, 2010; Basel Committee, 2011), systemically large banks may increase their implicit
6
claim on the �nancial safety net through higher risk-taking. Consistent with this view,
Demirgüç-Kunt and Huizinga (2011) show that systemically large banks bene�t from taking
on more risk. The authors �nd that when systemically large banks increase their share price
volatility, this will increase their market valuations and decrease their CDS spreads relative
to systemically smaller banks.4
In contrast to the risk-shifting argument, the opposite view holds that increases in
systemic size cause banks to engage in less risk-taking. The �scal costs of bailing out a
systemically large bank can be prohibitive for countries and raise questions over their long-
term solvency. This raises doubts over the ability of countries to bail out their systemically
largest banks and raises the prospect of creditor losses should a systemically important bank
default. In the absence of credible bank bailout guarantees, systemically larger banks may be
subject to more rather than less market discipline and may display lower rather than higher
risk as a result. Consistent with this, Demirgüç-Kunt and Huizinga (2010) �nd evidence of
systemically larger banks being �too-big-to save�by showing that systemically large banks
are subject to greater levels of market discipline (as indicated by higher funding costs).
An important question we are trying to address in this paper is if the risk-taking of
systemically large banks is di¤erent during crisis periods. The relationship between systemic
size and risk (be it positive or negative) could be time-contingent and more pronounced during
4The current study can also be linked to a broader body of literature that examines the risk implications
of bank growth in stand-alone size. Overall, the empirical evidence reported in this line of work is supportive
of the notion that large banks tend to follow riskier strategies than smaller banks (Boyd and Runkle, 1993;
Gropp et al., 2010). Another separate but also related stream of the literature looks into the e¤ect of
asset growth via mergers and acquisitions and �nds some evidence consistent with the notion that bank
growth leads to additional risk-taking. Benston, Hunter and Wall (1995) show that U.S. bank mergers and
acquisitions are partly motivated by acquiring banks exploiting the �nancial safety net. Similarly, Penas and
Unal (2004) �nd that a bank merger causes return increases for bondholders if the resulting bank becomes
�too big to fail�.
7

a crisis period. For instance, systemically large banks may take less risk during a crisis if
systemic risk considerations motivate regulators to engage in more aggressive interventions
in failing banks (Allen and Gale, 2000) and, likewise, if �too big to save�banks are subject to
greater levels of market discipline (Demirgüç-Kunt and Huizinga, 2010).
By the same token, if there is a risk-increasing e¤ect linked to systemic size, this e¤ect
may equally be larger during a crisis. During a systemic crisis, supervisors typically face fewer
options of how to deal with bank failures (Barth et al., 2004). As a result, regulators may be
reluctant to take over or close a failing bank if the banking sector is weak and the prospect
of bank failures widespread (Acharya and Yorulmazer, 2007). Brown and Dinç (2011) show
evidence of this �too many to fail e¤ect�by demonstrating that the government decision to
intervene in problem banks depends on the �nancial health of other banks in that country.
Critically for the present paper, Brown and Dinç (2011) also show the prospect of regulatory
forbearance during a systemic crisis is stronger for systemically larger banks.
While the �too many to fail�explanation relies on systemically large banks maximizing
the value of the safety net via more aggressive risk-taking during a crisis, recent studies also
emphasize that banks�performance during a crisis may result from bad luck (rather than bad
behavior). For instance, Fahlenbrach and Stulz (2011) and Beltratti and Stulz (2012) both
show that the type of bank portfolio decisions which were value-creating before the crisis but
caused banks to underform during the crisis were unlikely to have been anticipated at the
the time they were made.
Based on this previous evidence, we hold no a-priori expectation on the relationship
between systemic size and bank risk under crisis and non-crisis conditions.
8

3 Sample
To build an international sample of banks, we �rst extract accounting and income statement
data for all commercial banks and bank holding companies listed on Bureau van Dijk/IFCA�s
Bankscope database between 1998 and 2010. We then match the resulting list of banks with
Datastream to obtain equity valuation data. We use ISIN identi�ers to match the databases
and, where banks have previously been delisted and the ISIN identi�ers are missing on
Bankscope, we hand match banks across the two datasets. The yields an initial sample of
2,169 banks.
To increase the comparability of sample banks, we next exclude banking �rms traded
on an over-the-counter (OTC) market. This criterion removes 516 �rms from the sample,
mostly very small U.S. banks. We also exclude banks where the government (in)directly owns
in excess of 50% of the shares. We exclude government-owned banks, because the risk choices
of government-owned banks are less likely to be driven by shareholder value considerations
and, thus, di¤er in important ways.
Next, we exclude banks with fewer than �ve years of �nancial data and banks based in
countries with fewer than three sample banks. This is to ensure our methodological approach
can reliably distinguish between country- and bank-speci�c factors behind bank risk-taking.
Furthermore, we stipulate a liquidity criterion on stock returns. Since illiquid stocks will not
accurately re�ect information on the expected performance of a bank, they are unlikely to
produce reliable default risk estimates. Therefore, we exclude bank stocks from our sample
where more than 40% of daily stock returns per year are zero or which have been listed for
less than 100 trading days in a given year.
[Table 1]
The �nal sample, see Table 1, contains 823 unique banking �rms which are chartered
in 45 di¤erent countries. As reported in Panel A of Table 1, the systemic size of banks varies
9

widely across sample countries. Some small and developed economies host banks which are
large compared to GDP. For instance, the systemic size of the average bank in countries
such as Belgium, Ireland and Switzerland is 143%, 70% and 113%, respectively. Conversely,
average systemic size is lower in Japan (2%), China (3%) and the U.S. (0.2%). U.S. banks
make up around half the sample. To ensure that our results are not driven by U.S. banks,
each table reported in our analysis also includes regressions without U.S. banks. Finally,
Panel B of Table 1 shows a steady increase in systemic bank size during the sample period
(as also depicted in Figure 1 for the subset of systemically largest banks).
4 Measuring Bank Default Risk
Bank risk is measured via the Merton distance to default (DD) model. This model boasts a
wide range of empirical (e.g., Vassalou and Xing, 2004; Sundaram and Yermack, 2007) and
commercial applications (including as a risk management tool in the banking industry; see
Gropp et al., 2006). Default frequencies estimated using the DD model correlate approxi-
mately at the 80% level with default frequencies estimated using the commercially applied
and in many ways similar Moody�s KMV proprietary model (Bharath and Shumway, 2008).
The DD model has been demonstrated to provide a suitable indicator of bank fragility which
outperforms other market-based indicators such as subordinated debt spreads in predicting
bank default (Gropp et al., 2006). An additional advantage of using DD is that it may be
calculated for all listed banks (while other market-based risk indicators such as CDS spreads
are only available for a relatively small number of banks, especially outside the U.S.). Fur-
thermore, recent analyses have also con�rmed that risk metrics constructed in the spirit of
the DD model are suitable indicators of bank distress during the recent crisis (Altunbas et
al., 2011).
The Merton model measures default risk as the number of standard deviations that the
10

market value of bank assets are above the default point (the point where the market value
of assets is less than the book value of total liabilities). Formally, DD at the end of year t is
expressed as:
DDt =ln (VA;t/Lt) +
�rf � 0:5�2A;t
�T
�A;tpT
; (1)
where VA;t is the market value of assets at the end of the �scal year t, Lt is the book value of
total liabilities, rf is the risk-free rate (obtained for each country from the IMF International
Financial Statistics [IFS] database), �A;t is the annualized asset volatility at t (based on
volatility of equity returns in a given year), and T is the time to maturity (conventionally
set to one year).
The computation of DDt requires estimates of VA;t and �A;t neither of which are directly
observable. Following Vassalou and Xing (2004), the values for VA;t and �A;t are inferred
through an iterative process based on the Black-Scholes-Merton pricing model. Speci�cally,
the market value of a �rm�s equity (VE;t) is expressed as a function of the asset value by
solving the following system of nonlinear equations:
VE;t = VA;tN(d1;t)�Xte�rfTN(d2;t) (2)
�E;t =
�VA;tVE;t
�N (d1;t)�A;t (3)
Equation (2) de�nes VE;t as a call option on the market value of the bidder�s total assets,
with d1;t =ln(VA;t=Lt)+(rft+0:5�2A;t)T
�A;tpT
and d2;t = d1;t � �A;tpT . Equation (3) is the optimal
hedge equation that relates the standard deviation of a bank�s equity value to the standard
deviation of a bank�s total assets value (both on an annualized basis).
This system of equations is solved employing as starting values for �A;t the historical
volatility of equity (computed on a yearly basis using daily data) multiplied by the ratio of
the market value of equity to the sum of the market value of equity and the book value of
total liabilities, i.e. �A;t = �E;tVE;t/(VE;t + Lt). A Newton search algorithm then identi�es
11

the daily values for VA;t and �A;t in an iterative process which we then employ to compute
DDt as in Equation (1).
5 Methods and Control Variables
The purpose of this section is to describe the econometric approach we employ to investigate
the impact of systemic size on bank default risk. This is followed by a discussion of the
control variables and their expected impact on distance to default (DD).
5.1 The Econometric Model
The impact of bank systemic size on bank default risk is modeled by estimating the following
linear regression model:
DDi;t = �i + �iSY STEMICSIZEt�1 + BCt�1 +'CCt +YEARDUMMIES (4)
SYSTEMICSIZE is the book value of total bank assets scaled by the GDP of the country
in which a bank is chartered.5 BC is a vector a bank-speci�c characteristics and CC is a
vector of country-speci�c control variables. We employ the Within Estimator to control for
5The measure of systemic size used in this study is the same as in Brown and Dinç (2011). However,
the asset-to-GDP ratio is not the only way of capturing systemic size. For instance, Demirgüç-Kunt and
Huizinga (2010; 2011) use total liabilities divided by GDP as a measure of systemic size. In our sample,
liabilities/GDP and assets/GDP are correlated in excess of 99%. The results reported in this paper are,
therefore, not sensitive to us employing bank assets or liabilities to express the systemic importance of a
bank. Furthermore, like other measures of bank size, our measure is skewed owing to the presence of some
very large banks in the sample. However, in contrast to previous studies, we address this issue in two ways. We
�rst re-estimate the baseline speci�cation after replacing systemic size with its log transformation. Second,
we exclude sample banks which are larger than 100% (50%) of GDP. The main �ndings remain unchanged
after these modi�cations.
12

unobserved bank heterogeneity caused by factors that remain constant across the sample
period. This estimator, by computing a separate intercept for each bank, strips out cross-
sectional variation before estimating the slope coe¢ cients. This approach is, therefore, well-
suited to capture variations in risk-taking at the level of individual banks over time.
[Table 2]
All variables, except for the country controls, are lagged by one year to reduce simul-
taneity and endogeneity bias, and are summarized in Table 2. Standard errors have been
corrected for heteroscedasticity and are clustered at the bank-level to remove any estimation
bias resulting from within-group correlation in the sample.
5.2 Control Variables
The vector of bank controls contains the following variables. First our models control for
stand-alone size (SIZE) measured using the logarithmic transformation of bank total assets.
Demirgüc-Kunt and Huizinga (2011), show that the risk-return implications of a growth in
abolsute size are clearly di¤erent from those produced by an increase in systemic size. Similar
to SYSTEMICSIZE, we hold no a priori expectations on the sign of the e¤ect of SIZE on
default risk.
Bank asset structure is captured via the loan-to-asset ratio (LOANS). Baele at al.
(2007) show that European banks with larger loan-to-asset ratios are less exposed to market-
wide volatility and we, thus, expect a positive sign on LOANS. DIVERSIFICATION
controls for the degree of income diversi�cation measured as 1 minus a Her�ndhal index
of bank income concentration based on (i) net interest income, (ii) fees and commissions;
(iii) trading, and (iv) other operating income. Previous work has shown that diversi�cation
away from traditional interest-based activities will result in banks relying on more volatile
income streams (DeYoung and Roland, 2001; Stiroh and Rumble, 2006) and that income
13

diversi�cation exposes banks to more systemic risk (DeJonghe, 2010; Brunnermeier et al.
2012).
However, theoretical and empirical work has also demonstrated that it will become in-
creasingly di¢ cult for shareholders to monitor managers as the complexity of a �rm increases
(see Scharftein and Stein, 2000; Goetz et al., 2011). Since Laeven and Levine (2009) have
shown that bank risk-taking increases with the power of shareholders within the corporate
governance structure of a bank, diversi�ed may take on less risk than less diversi�ed banks.
We hold no expectation regarding the impact of DIVERSIFICATION on bank risk-taking.
The payo¤ structure of bank equity, which combines unlimited upside with limited
downside potential, is akin to that of a call option. When the share of loss-absorbing equity
to total assets is low, shareholders will optimize the option value by taking on risk at the
expense of debt holders and regulators (Bhattacharya and Thakor, 1993). We expect that
the higher the amount of equity on a bank�s balance sheet, the lower the incentives for banks
to engage in risk-shifting behavior in the interest of shareholders. EQUITY is measured via
the equity-to-asset ratio and we expect EQUITY to enter with a positive coe¢ cient in the
regression models.
Bank performance is controlled for using the ratio of net income to total assets (ROA).
Bank pro�tability and default risk may be linked in two ways. On the one hand, higher
pro�tability enables banks to retain earnings, build up capital and lower risk (i.e. increase
DD). On the other hand, higher pro�tability may be achieved on the basis of higher bank
risk-taking (and, thus, be linked to lower DD).
TOBINQ, which is measured as the quasi market value of assets (the sum of the book
value of liabilities and the market value of equity divided by the book value of assets), controls
for the future growth prospects of a bank. Growth prospects may act as a deterrent against
risk-taking when banks seek to preserve their charter values through lower risk-taking (Keeley,
1990; Park and Peristiani, 2007). TOBINQ is expected to exercise a positive in�uence on
14

DD.
Finally and following Laeven and Levine (2009), the model also controls for the level
of economic development (ECONDEVELOP; de�ned as the logarithmic transformation of
GDP per capita) and the volatility of economic growth (GDPVOL; de�ned as the standard
deviation of the logarithm of real yearly GDP growth computed over a 5-year rolling interval).
Banks operating in high-income countries are likely to operate under a stronger institutional
and regulatory framework and such a framework may be more e¤ective in monitoring, and
potentially limiting, the risk-taking strategies of banks (Laeven and Levine, 2009). On the
other hand, high-income countries, because they tend to be in a stronger position to �nance
bank bailouts, o¤er more credible bailout guarantees than low-income countries and this
could spur bank risk-taking. As far as GDPVOL is concerned, economic volatility may either
increase banks�exposure to macro shocks or, alternatively, cause banks to implement more
prudent risk-taking strategies in anticipation of macroeconomic risks. We, therefore, hold no
a priori expectations on the sign of the e¤ect of ECONDEVELOP and GDPVOL on distance
to default.
6 Systemic Size and Bank Default Risk
This section analyzes the impact of systemic size on bank default risk. Initially, we focus
on the full sample period (1998 to 2010), before we evaluate the risk-taking behavior of
systemically large banks during systemic crises. This section ends with a discussion of some
additional tests which assess the robustness of the main �ndings.
6.1 Systemic Size and Bank Default Risk during 1998 - 2010
We start the analysis by testing whether a bank-level increase in systemic size is associated
with a change in bank default risk during the full sample period. The analysis is initially
15

conducted using a parsimonious within-speci�cation based on few control variables. The
model is then extended by progressively adding more controls.
[Table 3]
Table 3 shows that, as banks grow in systemic size, they lower their distance to default
(that is, they increase their default risk). In all speci�cations in Table 3, systemic size enters
with a negative and statistically signi�cant coe¢ cient. This result also holds when we take
the log of systemic size (to control for skewness in the distribution of systemic size), when the
model includes stand-alone bank size, excludes U.S. banks, or includes country �xed e¤ects
(instead of bank �xed e¤ects) in an OLS speci�cation.6
In terms of control variables, the results are generally in line with our expectations.
For instance, distance to default is higher in banks with lower leverage, higher pro�tability
and greater growth prospects (as measured by Tobin�s Q). Overall, the models we estimate
in Table 3 perform well in explaining the determinants of bank risk-taking (with adjusted
R-squared values of around 50%).
Prima facie, the results discussed here show that banks become riskier as they grow in
systemic importance. However, as demonstrated in the next section, this result is driven by
the recent �nancial crisis.
6.2 Systemic Size, Bank Default Risk and Systemic Crises
This section presents tests on whether systemic size causes banks to be more risky during
systemic banking crises. Based on stand-alone bank size, previous studies have established
that larger banks are more exposed to systemic crises (DeJonghe, 2010; Beltratti and Stulz,
6The OLS speci�cation has been also estimated without the inclusion of country controls. This modi�ca-
tion leaves the major conclusions una¤ected.
16

2012; Brunnermeier et al., 2012).7
We put forward two, not mutually exclusive, conjectures as to why systemically larger
banks may be more exposed to a systemic crisis. First, systemically larger banks may be
more exposed to a systemic crisis because of more aggressive risk-taking during the crisis.
This could be the case if systemically large banks �nd it optimal to maximize the value of the
safety net during periods of banking sector distress. The prospect of regulatory forbearance
during a systemic crisis (see Acharya and Yorulmazer, 2007) permits banks to increase the
value of their implicit claim on the �nancial safety net via more aggressive risk-taking. Since
systemically larger banks will be the largest bene�ciaries from regulatory forbearance (Brown
and Dinç, 2011), systemically larger banks will be particularly prone to risk shifting behavior
during the crisis. For this conjecture to hold in the context of our study, we expect to �nd
that systemically larger banks pursue more aggressive risk-taking during a crisis.
[Table 4]
Second, additional risk-taking during a crisis may result from risk-taking behavior be-
fore a crisis. Systemically large banks may have positioned themselves in ways that was value-
maximizing before a crisis, but which, for reasons unknown at the time, made them more
exposed to a crisis event. Beltratti and Stulz (2012) pro¤er results consistent with this ex-
planation. For an international sample of banks, the authors show that shareholder-oriented
banks, possibly by enhancing the value of the safety net through more aggressive risk-taking,
outperformed before the crisis, but underperformed during the recent crisis. Since Beltratti
and Stulz (2012) control for various indicators of shareholder-oriented corporate governance,
the authors argue that the risk of investments could not have been anticipated at the time
7For instance, DeJonghe (2010) estimates the tail betas for European banks and shows shareholders in
large banks are more likely to experience losses above those experienced by a European banking index during
periods of adverse shocks to bank valuations.
17

the investments were made (since it does not seem plausible that shareholder-oriented boards
were intent on diminishing shareholder value during the crisis). Therefore, for this second
conjecture to hold, the analysis would indicate that, for a given level of systemic size, banks
with higher stock performance before the crisis display higher default risk during the crisis.
The �rst conjecture (systemically larger banks maximize the value of the safety net
during crisis periods) is tested by introducing interaction terms between a banking crisis
indicator and the dependent variables in Tables 4 and 5. In Table 4, we estimate our models
after adding a crisis indicator (GL_CRISIS) which equals one for all banks in 2008-2009.
Table 4, therefore, examines the risk implications of the recent crisis and the results show
that systemically larger banks increased their risk-taking during 2008-2009 (signi�cant at
1%).
Interestingly, the coe¢ cient on systemic size is no longer signi�cant at customary levels
once the interaction with GL_CRISIS is included in the analysis. This result is robust to
the addition of bank speci�c control variables in Column (2), the exclusion of US banks in
Column (3), and the inclusion of absolute bank size in Columns (4) and (5). In sum, the
results reported in Table 4 show that the risk-increasing e¤ect of systemic size reported in
the previous subsection is driven by the recent crisis.
In a next step, we adopt a fairly conservative empirical strategy to rule out that crises
other than the recent crisis have caused systemically large banks to engage in additional risk-
taking. Table 5 �rst examines the risk-taking implications linked to other domestic and then
to other regional �nancial crises. To examine the e¤ects of a domestic crisis, Columns (1) and
(2) are based on banks which are listed in countries that have experienced a �nancial crisis
prior to 2008 (as identi�ed in Laeven and Valencia, 2008). The binary variable D_CRISIS
equals one for any country-year combination which Laeven and Valencia (2008) identify as
18
coinciding with a systemic crisis.8 This approach is akin to focusing on domestic �nancial
crises, since it involves computing the risk implications of a �nancial crisis only when banks
are based in a country which has been a¤ected by that crisis.
Columns (3) and (4) of Table 5 examine the risk implications of a regionally-de�ned
�nancial crisis (R_CRISIS). The results reported in these columns focus on South-East
Asian economies which Laeven and Valencia (2008) identify as having experienced six �nan-
cial crises between 1998 and 2001.9 This empirical approach is akin to analyzing the e¤ect
of a regional crisis on bank risk-taking, since the analysis is conducted without stipulating
that each of the countries contained in the subsample of Asian countries experienced a crisis
during the sample period.
[Tables 5 and 6]
Table 5 shows that systemically larger banks did not take on additional risk during
either domestic or regional banking crises. Jointly, the results in Tables 4 and 5 show that
systemic size is associated with increased bank risk-taking during the recent crisis, but not
during other �nancial crises. This is an important result. Evidently, the �ndings based on
the recent crisis cannot be applied to �nancial crises more generally.
We test our second conjecture (returns before the crisis explain risk-taking during the
crisis) in Table 6. Similar to Beltratti and Stulz (2012), the models include the lag value of
a market-adjusted measure of bank returns (RETURN) which we interact with the crisis
dummy to capture pre-crisis shareholder value maximization. RETURN is de�ned as the
8The countries a¤ected include Argentina (2001-2003), Colombia (1998-2000), Czech Republic (1998-
2000), Indonesia (1998-2001), Japan (1998-2001), Malaysia (1998-1999), Philippines (1998-2001), Slovakia
(1998-2002), Thailand (1998-2000) and Turkey (2000-2001).
9The sample of Asian countries includes China, Hong Kong, Korea, Indonesia, Japan, Malaysia, Philip-
pines, Singapore, Taiwan, and Thailand.
19

calendar-year bank return minus the average return of all sample banks listed in the same
country. Table 6 focuses on the recent crisis because our previous analysis has demonstrated
that only the recent crisis has risk-taking implications for systemically large banks. The
interactions between RETURN, the crisis indicator variable and systemic size do not enter
Panel A with statistically signi�cant coe¢ cients. Consistent with this, Panel B of Table
6, where we compare the marginal e¤ects of systemic size by di¤erent values of RETURN
(equal to 10%, 50%, and 90% of the sampling distribution), shows that the marginal risk-
taking e¤ect of systemic size during the crisis does not di¤er by bank performance before the
crisis. Accordingly, the risk-taking of systemically large banks during the crisis cannot be
explained with reference to pre-crisis bank behavior.
Overall, the results discussed in this section show that systemically larger banks in-
creased their default risk during the recent crisis but not during earlier systemic crises.
Further, there is no evidence that this additional risk-taking can be explained with reference
to pre-crisis performance (for instance, because highly-performing banks took on unknown
risks before the crisis which materialized during the crisis). Instead, the results suggest that
the increase in default risk during the recent crisis is the result of systemically large banks
increasing their implicit claim on the �nancial safety net during a particularly severe systemic
crisis.
6.3 Additional Tests
Several additional tests are employed to assess the robustness of the �nding that systemic
size exerts a risk-increasing e¤ect during the recent crisis.10 A �rst test aims to evaluate
whether this result is driven by the systemically largest banks in our sample. Therefore,
10To conserve space, the results of these tests are not tabulated but are available from the authors upon
request.
20

the models are re-estimated after excluding banks where the average systemic size across the
sample period exceeds 50% or 100%. These additional tests con�rm the main conclusion that
an increase in systemic size is associated with an increase in default risk during the recent
crisis.
While the bank �xed e¤ects in the model control for unobservable bank heterogeneity
and reduce omitted variable problems, the risk-increasing e¤ect of systemic size may still be
driven by bank characteristics which are not controlled for in the regression analysis. For
instance, the funding structure of banks may a¤ect bank behaviour during the crisis (see
Beltratti and Stulz, 2012). Since the ratio of customer deposits to total liabilities is highly
correlated with systemic size (-0.48) in our sample, this raises the possibility that our main
�nding captures a funding e¤ect. When we control for the ratio of customer deposits to total
liabilities in the regression, the main �ndings remain qualitatively unchanged. Therefore, the
e¤ect which we impute to systemic size is not the result of systemically larger banks relying
on di¤erent types of funding strategies.
Next, we repeat the analysis using an alternative risk measure. Speci�cally, the models
are estimated including the log transformation of total equity volatility (computed at yearly
frequency and based on daily return data). While equity volatility is not a default risk
measure, it can be seen as a forward-looking indicator of bank total risk. When the analysis
is conducted using this alternative risk indicator, the risk-increasing e¤ect of systemic size
during the recent crisis is still present.
Finally, to add additional support to our argument that the risk-taking of systemically
larger banks during the crisis has not been brought about by the business strategies in place
at these banks before the recent crisis, we run the following test. In the spirit of Beltratti and
Stulz (2012), we estimate a simple OLS regression on the change in DD during the crisis (2008
- 2009). In this set up, we lag the explanatory variables by two years while also controlling
for pre-crisis DD to explain crisis-related changes in DD. If the risk-increasing e¤ect during
21

the crisis was entirely due to pre-crisis risk-taking behavior, we do not expect systemic size to
play a role in explaining changes in DD during the crisis (after also controlling for pre-crisis
values of DD). However, the results show that systemic size continues to enter signi�cantly,
while pre-crisis DD does not. Accordingly, the additional risk-taking of systemically large
banks during the crisis cannot be explained with reference to their pre-crisis risk-taking.
7 Which Bank Characteristics Contributed to the Risk-
taking of Systemically Large Banks during the Re-
cent Crisis?
The analysis discussed in the previous section demonstrates that, while there is a link between
systemic size and risk-taking, this link is con�ned to the recent crisis. This section aims to
identify some of the bank characteristics which moderate the e¤ect that systemic size has
on risk-taking during the crisis. We �rst focus on the impact of bank leverage and income
diversi�cation before we analyze the impact of subordinated debtholders on limiting risk-
taking incentives by systemically large banks.
7.1 Systemic Size, Bank Leverage and Diversi�cation
This subsection focuses on bank leverage and income diversi�cation in e¤ecting the relation-
ship between systemic size and risk-taking, because both leverage and income diversi�cation
are linked to current policy debates over how to prevent excessive bank risk-taking. For
instance, under the impending Basel III Capital Accord, a group of systemically large banks
will be required to hold additional capital, mainly in the form of equity or equity-like instru-
22

ments (see Basel Committee, 2011),11 and a number of countries are debating over the extent
to which the type of activities which banks may engage in are to be restricted.12
We expect to �nd that during the recent crisis, systemically larger banks will engage
in additional risk-taking if they hold less equity (i.e., are more leveraged). Generally, when
systemically larger banks are more leveraged, bank shareholders face additional incentives
to engage in risk-shifting, because shareholders will absorb less of the potential losses linked
to higher risk-taking while still bene�ting from any upside gains. Studies on bank lever-
age emphasize the possibility of asset-shifting in favor of riskier assets where moral hazard
considerations play a role (Bhattacharya and Thakor, 1993). Therefore, the risk-shifting
problem for banks which are both systemically large and more leveraged should be particu-
larly severe during the recent crisis when bank charter values were depressed and incentives
for risk-shifting particularly pronounced.
Further, we expect to �nd that the impact of systemic size on default risk is lower
when systemically large banks are more diversi�ed. However, in contrast to bank leverage,
we do not expect the e¤ect of diversi�cation to be state-contingent. Consequenly, we expect
to �nd that diversi�cation lowers risk-taking by systemically large banks during and outside
the recent crisis.
Our intuition for the risk-reducing e¤ect of diversi�cation is as follows. Scharftein and
11Under current proposals, a total of 29 banks are classi�ed as Global Systemically Important Banks
(GSIBs) by the Basel Committee. Institutions are classi�ed as GSIBs using a multiple indicator-based
approach based on if banks are �perceived as not being allowed to fail due to their size, interconnectedness,
complexity, lack of substitutability or global scope�(Basel Committee, 2011, pg 1).
12For instance, the Dodd-Frank Act bars U.S. bank holding companies from proprietary trading and certain
types of other investments. Similarly, the Independent Commission on Banking has recently proposed that
UK banks will need to separate and independently capitalize their retail and investment banking activities
(ICB, 2011).
23

Stein (2000) suggest that, as �rms engage in a more diverse set of activities, shareholders
and other outside investors will �nd it increasingly di¢ cult to monitor managers. Goetz et
al. (2011) �nd evidence consistent with this for a sample of U.S. bank holding companies.
The authors �nd that, when banks increase their geographic diversity, they experience a
valuation discount as well as a tendency of corporate insiders to extract private bene�ts
(measured in terms of bank loans to corporate insiders). Further, Laeven and Levine (2009)
show that bank risk-taking increases with the comparative power of shareholders within the
corporate governance structure of a bank. Given shareholders are risk neutral and managers
are risk averse with respect to �rm-speci�c and idiosyncratic risk (managers�human capital
is invested in their own �rm and cannot be diversi�ed), and given the increasing di¢ culties
for shareholders to e¤ecitively monitor managerial risk-taking strategies in more diversi�ed
�rms, we expect that the risk increasing e¤ect of systemic size declines as banks become more
diversi�ed.
To evaluate whether the risk-taking e¤ect linked to systemic size varies with bank lever-
age or the level of income diversi�cation, interaction terms between systemic bank size and
both EQUITY and DIVERSIFICATION are added to Table 7. The resulting variables are
then interacted with GL_CRISIS to distinguish between the impact of leverage during cri-
sis and non-crisis periods. Consistent with our expectation, the regression results in Panel
A of Table 7 show that bank leverage increases the risk-taking incentives of banks during
the recent crisis (as demonstrated by a positive and signi�cant coe¢ cient on SYSTEMIC-
SIZE*GL_CRISIS*EQUITY). Similarly, Panel B of Table 7 presents the marginal e¤ect of
systemic size on bank risk for di¤erent levels of equity holdings and income diversi�cation
(10%, 50% and 90% of the sample distribution). The results of this analysis also con�rm
that larger equity cushions o¤set the risk increasing e¤ect of bank size on bank risk.
[Table 7]
24
Further, DIVERSIFICATION exercises a risk-mitigating e¤ect that is not restricted to
the recent crisis (the coe¢ cient on the interaction term with systemic size enters Panel A of
Table 7 signi�cantly). Panel B of Table 7 con�rms that the risk increasing e¤ect of systemic
size is lower in more diversi�ed institutions. Therefore, from a risk-taking and �nancial
stability perspective, it is preferable for systemically larger banks to be diversi�ed in their
income streams than specialized.13
In summary, this subsection reports two main �ndings. First, bank leverage exacerbates
the risk-increasing e¤ect which systemic size has on bank risk-taking during the recent crisis.
Second, high-levels of income diversi�cation mitigate the risk-increasing e¤ect of systemic
size. The risk mitigating e¤ect of bank activity diversi�cation is not restricted to the �nancial
crisis and can also be observed during normal market conditions.
7.2 Systemic Size, Market Discipline and Risk-Taking
This �nal subsection examines the impact of subordinated debt on the relationship between
systemic size and bank risk-taking during the recent crisis. For some time, subordinated debt
13We also examine whether regulatory restrictions across countries as regards the type of activities that
banks can perform shape the risk e¤ects of systemic size. We use various Barth al. (2004) surveys to construct
an index of activity restrictions at the level of individual countries. The index assigns a value of 1 if the
Barth et al. (2004) data indicate that an activity as �unrestricted�, 2 (=�permitted), 3 (=�restricted�) or 4
(=�prohibited�) to each of four types of bank activity areas (securities market activities, insurance activities,
real estate activities, and the ownership of non�nancial �rms). Higher values of the resulting index indicate
that national bank regulators are more restrictive in terms of activity diversi�cation. We then split sample
countries into two groups based on whether they are located in countries below or above the median index
value of activity restrictions. The results, which are available from the authors on request, show that in
countries with fewer restrictions on bank activities, increases in systemic size are not linked to higher risk-
taking. This is in line with the �nding we report in the paper that more income diversi�cation at bank-level
lowers the risk increasing e¤ect linked to systemic size.
25

has been advocated as an e¤ective mechanism to enhance the market discipline imposed
on banks (Flannery and Sorescu, 1996; Flannery, 1998; Kwast et al, 1999; Sironi, 2003).
Like equity investors, investors in subordinated debt are exposed to loss. However, unlike
equity investors, investors in subordinated debt will not bene�t from gains that are linked
to excessive risk-taking. Subordinated debt investors should, therefore, be incentivized to
monitor and limit bank risk-taking. For instance, investors in subordinated debt may demand
higher yields or refuse to roll over existing debt when faced with risk-shifting behavior by
bank managers.
[Table 8]
Further, investors in subordinated debt may be particularly suited to impose enhanced
market discipline during periods of distress. Kwast et al. (1999) �nd that the subordinated
debt market imposes some market discipline on U.S. banks during crisis periods, but not
during non-crisis periods. Chen and Hasan (2011) demonstrate in a theory paper that, in
a setting in which the prospect of regulatory forbearance is high, subordinated debt exerts
a risk-reducing e¤ect on banks. Since the prospect of regulatory forbearance is particularly
high during a crisis (Acharya and Yorulmazer, 2007; Brown and Dinç, 2011), we expect that
subordinated debt exerts a risk-reducing e¤ect for systemically large banks during the recent
crisis.
Table 8 tests this conjecture by introducing SUBDEBT, which is the value of subor-
dinated debt scaled by total liabilities, as an additional explanatory variable. We require a
minimum of four years of subordinated debt data for banks to remain in the sample (data on
subordinated debt are not consistently available for all banks). SUBDEBT is then interacted
with both systemic size and adummy variable which is one during the recent crisis.
Panel A of Table 8 shows that the impact of systemic size on risk-taking during the
recent crisis is lower when banks have issued more subordinated debt. This �nding is further
26

highlighted in Panel B of Table 8 which reports the marginal e¤ect of systemic size on dis-
tance to default for di¤erent values of SUBDEBT. Panel B shows that when banks have not
issued subordinated debt, the impact of systemic size on risk-taking during the recent crisis
is at its highest. By contrast, when subordinated debt represents more than 1.05% of bank
liabilities, systemic bank size is not linked to increased bank risk-taking during the recent
crisis. Furthermore, during non-crisis conditions when the risk-taking behavior of systemi-
cally important banks is not di¤erent from those of smaller institutions, the importance of
monitoring by subordinated debtholders is negligible.
In summary, the results in this section show that subordinated debt plays an important
role in disciplining systemically large banks during the recent crisis while it does not play
any signi�cant role under non-crisis conditions.
8 Conclusions
Banks have rapidly grown in systemic size over recent decades. For an increasing number
of banks, the book value of their assets now exceeds the GDP of the economy in which
they are charted. The increase in systemic size raises a number of important issues with
regard to the risk-taking behavior of banks. It is a frequently raised concern that systemic
size tempts banks to maximize the value of the �nancial safety net by taking on more risk.
The performance of many of the systemically largest banks during the recent crisis has not
dispelled such concerns. Many of the systemically largest banks were forced to turn to
taxpayers to fund their recapitalization e¤orts to some extent during the crisis.
The results presented in this paper demonstrate that during the recent crisis bank
default risk has increased with systemic size. However, systemic size has not increased bank
default risk during previous crises and there is no general risk-increasing e¤ect linked to
systemic size during non-crisis periods. Our main conclusion, therefore, is that with the
27

exception of the recent crisis banks do not take on additional risk as they grow in systemic
size.
Additionally, the �ndings discussed in this study show that the risk-increasing e¤ect of
systemic size during the recent crisis is higher if banks are more leveraged, less diversi�ed, and
hold less subordinated debt. Interestingly, the risk mitigating e¤ect of income diversi�cation
for systemically large banks is not con�ned to the recent crisis. The results show that more
diversi�ed systemically large banks display a lower default risk during and outside the recent
crisis.
A number of policy implications derive from our results. Below, we focus on three main
implications. First, the results give little justi�cation for subjecting systemically large banks
to stricter and time-invariant capital requirements than less systemically large banks (as,
for instance, envisaged under Basel III via the higher capital requirements applied to Global
Systemically Important Banks [GSIBs]). While the results we present show that systemically
large banks which were highly-leveraged exploited the �nancial safety net through more
aggressive risk-taking during the recent crisis, we also show that the same is not true during
earlier �nancial crises. Thus, we do not �nd that, outside the recent crisis, less leverage has
mitigated against risk-shifting incentives for systemically large banks.
Therefore, subjecting systemically large banks to tougher leverage restrictions on a per-
manent basis, when additional equity is risk relevant only under rare crisis events, does not
appear warranted on the basis of the �ndings reported in this study. Instead, the results sup-
port the view that systemically large banks should issue hybrid securities such as contingent
convertibles (�CoCos�) which convert into equity in the event of a systemic crisis. Flannery
(2005) and Kashyap et al. (2008) outline various proposals for how contingent capital can be
employed in the banking industry to increase the resilience of banks during systemic crises.
Our results contribute to this debate by demonstrating that contingent capital will be par-
ticularly e¤ective in reducing bank risk-taking during a crisis when issued by systemically
28

large banks.
Second, and related to the �rst point on bank capital structure, our results support a
more widespread issue of subordinated debt instruments by systemically large banks. Our
results show that even modest amounts of subordinated debt reduced or eliminated risk-
shifting by systemically large banks during the recent crisis. Subordinated debt could be
e¤ective in imposing enhanced market discipline on banks, because it undermines the ability
of regulators to exercise forbearance during a crisis. For instance, the prospect of regulatory
forbearnce would be lower if spreads on subordinated debt (relative to securities of comparable
maturity) are employed by regulators to lever prompt corrective action (PCA) against banks
in periods of �nancial stress (see Evano¤ and Wall, 2002). Evidently, any requirements on
systemically large banks to issue subordinated debt will have to be jointly considered with
existing equity requirements. That is because equity and subordinated debt can be seen as
acting as complements in preventing risk-shifting (see for instance Chen and Hasan, 2011)
during a crisis.
The results discussed in this study also show that income diversi�cation lowers the
e¤ect which systemic size has on risk-taking. This means that if systemically large banks
exist (and continue to exist in the future), they will display lower default risk when their
income streams are diversi�ed. This �nding is in con�ict with ongoing policy discussions
in a number of countries which aim at restricting the scope of activities which banks are
permitted to engage in. While ongoing discussions over the scope of bank activities are
not necessarily aimed at large banks, our results demonstrate that income diversi�cation of
systemically large banks can play an important role in reducing the riskiness of systemically
large banking institutions. Put di¤erently, our �ndings suggest that restricting the type of
activities which a systemically large bank is permitted to engage in will increase risk-taking
unless activity restrictions are accompanied by restrictions on systemic size.
Finally, the analysis conducted here highlights clear di¤erences in the average systemic
29

size of banking �rms across countries. Future research should analyze and understand what
explains these di¤erences. For instance, it would be of interest to identify the institutional and
regulatory country characteristics that explain why banks chartered in certain countries have
increased their systemic size more than banks chartered in other countries. Such an analysis
would equally help understand some of the foundations of the moral hazard type behavior
that underlie the risk-taking strategies of systemically large banks which we document in this
paper.
30

References
Acharya, V. V., Yorulmazer, T., 2007. Too Many to Fail� An Analysis of Time-inconsistency
in Bank Closure Policies. Journal of Financial Intermediation 16, 1�31.
Allen, F., Gale, D., 2000. Financial Contagion. Journal of Political Economy 108, pg. 1�33.
Allen, F. and Carletti, E and Gale, D., 2009. Interbank market liquidity and central bank
intervention, Journal of Monetary Economics 56, 639� 652.
Altunbas, Y., Manganelli, S., Marquez-Ibanez, D., 2011. Bank risk taking during the �nancial
crisis. ECB Working Paper No. 1394.
Baele, L., DeJonghe, O. and R. Vander Vennet, 2007. Does The Stock Market Value Bank
Diversi�cation?, Journal of Banking & Finance 31, 1999-2023.
Barth, J.R., Caprio, G. and Levine, R., 2004. Bank regulation and supervision: what works
best? Journal of Financial Intermediation 13, 205 �248.
Bhattacharya, S., Thakor A.V., 1993, Contemporary banking theory. Journal of Financial
Intermediation 3, 2-50.
Basel Committee, 2011. Global systemically important banks: Assessment methodology and
the additional loss absorbency requirement. Consultative Document, Bank for International
Settlements, http://www.bis.org/publ/bcbs207.pdf.
Beltratti, A., Stulz., R., 2012. Why Did Some Banks Perform Better During the Credit Crisis?
A Cross-Country Study of the Impact of Governance and Regulation. Journal of Financial
Economics, forthcoming.
31

Benston, G. J., Hunter, W.C., and Wall L.D., 1995. Motivations for Bank Mergers and
Acquisitions: Enhancing the Deposit Insurance in Put Option versus Earning Diversi�cation.
Journal of Money, Credit, and Banking 27, 777-788.
Bharath, S.T., Shumway, T., 2008. Forecasting Default with the Merton Distance to Default
Model. Review of Financial Studies 21, 1339-1369.
Boyd, J.H., Runkle, D.E., 1993. Size and performance of banking �rms: Testing the predic-
tions of theory. Journal of Monetary Economics 31, 47-67.
Brown, C and Dinç, S., 2011, Too many to fail? Evidence of regulatory forbearance when
the banking sector is weak. Review of Financial Studies 24, 1378 �1405.
Brunnermeier, MK, Dong, G and Palia, D., 2012. Banks�Non-Interest Income and Systemic
Risk, unpublished working paper.
Chen, Y., Hasan, I., 2011. Subordinated Debt, Market Discipline, and Bank Risk, 43, Journal
of Money, Credit and Banking 43, 1043-1072.
Cordella, T., Yeyati, E.L., 2003. Bank Bailouts: Moral Hazard vs. Value E¤ect. Journal of
Financial Intermediation 12, 300�330.
Dam, L. and Koetter, M., 2012. Bank Bailouts and Moral Hazard: Empirical Evidence from
Germany, Review of Financial Studies, forthcoming.
DeJonghe, O., 2010. Back to the basics in banking? A micro-analysis of banking system
stability. Journal of Financial Intermediation 19, 387 �417.
Demirgüç-Kunt, A., Huizinga, H., 2011. Do We Need Big Banks? Evidence on Performance,
Strategy and Market Discipline. World Bank Policy Research Paper 5576.
32

Demirgüç-Kunt, A., Huizinga, H., 2010. Are Banks Too Big to Fail or Too Big to Save?
World Bank Policy Research Paper 5360.
DeYoung R. and K.P. Roland, 2001. Product Mix and Earnings Volatility At Commercial
Banks: Evidence From A Degree Of Total Leverage Model, Journal of Financial Intermedi-
ation 10, 54�84.
Evano¤, D.D., Wall, L.D., 2002. Measures of the riskiness of banking organizations: Subordi-
nated debt yields, risk-based capital, and examination ratings. Journal of Banking & Finance
26, 989-1009.
Financial Stability Board, 2010. Reducing the moral hazard posed by systemically important
�nancial institutions, Interim report to G20 Leaders, Basel.
Flannery, Mark J., 2005. No Pain, No Gain? E¤ecting Market Discipline via Reverse Convert-
ible Debentures, in Hal S. Scott, Ed., Capital Adequacy Beyond Basel: Banking Securities
and Insurance, Oxford: Oxford University Press.
Flannery, M., 1998. Using Market Information in Prudential Banking Supervision: A Review
of U.S. Evidence, Journal of Money, Credit and Banking 30, 273-305.
Flannery, M. J., Sorescu, S. M., 1996. Evidence of bank market discipline in subordinated
debenture yields: 1983-1991, Journal of Finance 51, 1347-1377.
Goetz, M., Laeven, L., Levine, R., 2011. The Private Bene�ts of Controlling Complex Bank
Holding Companies, unpublished working paper.
Gorton, G., and L. Huang. 2004. Liquidity, E¢ ciency, and Bank Bailouts. American Eco-
nomic Review 94, 455�83.
Gropp, R., Vesala, J., Vulpes, G., 2006. Equity and bond market signals as leading indicators
of bank fragility, Journal of Money, Credit and Banking 38, 399-428.
33
Gropp, R., Gründl, C., Güttler, A., 2010. The impact of public guarantees on bank risk
taking: Evidence from a natural experiment.EBS Working Paper No 10-10.
Gropp, R., Hakenes, H., Schnabel, I., 2011. Competition, risk-shifting, and public bail-out
policies. Review of Financial Studies 24, 2084 - 2120.
Hakenes, H., Schnabel, I., 2011. Bank size and risk-taking under Basel II. Journal of Banking
& Finance 35, 1436 - 1449.
ICB, 2011. Final Report Recommendations. Independent Commission on Banking.
http://bankingcommission.independent.gov.uk.
IMF, 2009. The State of Public Finances: A Cross-Country Fiscal Monitor, International
Monetary Fund.
Kashyap AK, Rajan, R. and Stein, R., 2008. Rethinking Capital Regulation, unpublished
working paper.
Keeley, M.C., 1990. Deposit insurance, risk, and market power in banking. American Eco-
nomic Review 80, 1183-1200.
Kwast, M., D. Covitz, D. Hancock, J. Houpt, D. Adkins, N. Barger, B. Bouchard, J. Con-
nolly, T. Brady, W. English, D. Evano¤, and L. Wall , 1999. Using Subordinated Debt as
an Instrument of Market Discipline. Report of a study group on subordinated notes and
debentures, Board of Governors of the Federal Reserve System, Sta¤ Study No. 172.
Laeven, Luc and Levine, Ross, 2009. Bank governance, regulation and risk taking, Journal
of Financial Economics 93, 259 �275.
Laeven, L., Valencia, F., 2008, Systemic Banking Crises: A New Database. IMF Working
Paper No. 08/224.
34

Park, S., Peristiani, S., 2007. Are Bank Shareholders Enemies of Regulators or a Potential
Source of Market Discipline? Journal of Banking & Finance 31, 2493-2515.
Penas, M. F. and Unal, H., 2004. Gains in bank mergers: evidence from the bond markets,
Journal of Financial Economics 74, 149�79.
Merton RC, 1974. On the Pricing of Corporate Debt: The Risk Structure of Interest Rates.
Journal of Finance 29, 449-70.
Scharfstein, D., Stein, J. 2000, The Dark Side of Internal Capital Markets: Divisional Rent-
Seeking and Ine¢ cient Investment, Journal of Finance 55, 2537 �2564.
Sironi, A. 2003. Testing for Market Discipline in the European Banking Industry: Evidence
from Subordinated Debt Issues, Journal of Money, Credit and Banking 35, 443�472.
Stiroh, K.J., 2004. Diversi�cation in banking: Is noninterest income the answer? Journal of
Money, Credit, and Banking 36, 853�882.
Stiroh, K.J. and A. Rumble, 2006. The Dark Side of Diversi�cation: The Case of U.S.
Financial Holding Companies, Journal of Banking & Finance Vol. 30, 2131-2161.
Sundaram, R.K. and Yermack, D.L., 2007. Pay Me Later: Inside Debt and Its Role in
Managerial Compensation, Journal of Finance 62, 1551-1588.
Vassalou, M. and Xing, Y., 2004. Default risk in equity returns, Journal of Finance 59,
831-868.
35

Table 1: Sample Distribution by Country and Year Banks Observations Number Percentage Number Percentage Average
Systemic Size (%GDP)
Panel A: Sample Distribution by Country
Argentina 3 0.365 34 0.414 2.767 Australia 11 1.337 118 1.438 16.539 Austria 3 0.365 24 0.292 52.454 Bangladesh 16 1.944 134 1.633 1.140 Belgium 3 0.365 36 0.439 142.744 Brazil 3 0.365 33 0.402 9.124 Canada 8 0.972 104 1.267 18.279 Chile 4 0.486 41 0.500 14.309 China 5 0.608 46 0.560 3.246 Denmark 11 1.337 102 1.243 21.495 Egypt 7 0.851 57 0.694 2.305 France 6 0.729 63 0.768 30.462 Germany 8 0.972 72 0.877 21.715 Greece 9 1.094 107 1.304 9.527 Hong Kong 9 1.094 108 1.316 11.393 India 19 2.309 164 1.998 1.264 Indonesia 3 0.365 26 0.317 2.921 Ireland 5 0.608 49 0.597 70.478 Israel 6 0.729 75 0.914 25.152 Italy 19 2.309 192 2.339 7.093 Japan 86 10.450 984 11.988 1.595 Jordan 3 0.365 15 0.183 58.139 Kenya 5 0.608 49 0.597 4.985 Korea 9 1.094 88 1.072 6.126 Malaysia 10 1.215 108 1.316 16.867 Mexico 3 0.365 29 0.353 3.068 Morocco 3 0.365 21 0.256 21.287 Pakistan 13 1.580 103 1.255 1.847 Philippines 5 0.608 45 0.548 8.314 Poland 10 1.215 107 1.304 3.803 Portugal 5 0.608 57 0.694 24.995 Qatar 4 0.486 26 0.317 17.829 Russia 3 0.365 16 0.195 0.983 Saudi Arabia 8 0.972 74 0.902 5.989 Singapore 3 0.365 39 0.475 70.317 South Africa 6 0.729 69 0.841 22.653 Spain 9 1.094 105 1.279 17.362 Sri Lanka 5 0.608 51 0.621 3.912 Sweden 3 0.365 38 0.463 74.209 Switzerland 7 0.851 67 0.816 112.810 Taiwan 20 2.430 166 2.022 6.938 Thailand 9 1.094 99 1.206 9.656 Turkey 12 1.458 99 1.206 5.534 United Kingdom 11 1.337 114 1.389 29.378 USA 413 50.182 4,054 49.391 0.199 Total 823 100.000 8,208 100.000 7.187
Panel B: Sample Distribution by Year
1998 409 4.983 6.514 1999 534 6.506 5.354 2000 583 7.103 5.770 2001 561 6.835 6.912 2002 652 7.943 6.563 2003 689 8.394 6.563 2004 695 8.467 6.810 2005 723 8.808 6.830 2006 723 8.808 7.889 2007 700 8.528 8.880 2008 672 8.187 7.843 2009 650 7.919 8.350 2010 617 7.517 8.435 Total 8,208 100.000

Table 2: Variable Definitions and Descriptive Statistics
N Mean Median St.Dev. 1 Pctile 99 Pctile
DD Distance to default 8,208 3.414 3.247 0.170 1.684 8.204 SYSTEMICSIZE Book value of bank total assets over country GDP (%) 8,208 7.161 0.290 24.864 0.003 112.419 SIZE Log transformation of bank total assets in US dollars 8,208 15.790 15.621 1.968 12.541 20.979 LOANS Net loans over total assets (%) 8,208 62.902 64.472 24.071 13.122 87.490 DIVERSIFICATION 1 minus a Herfindhal index of income concentration based
on four income categories: (i) net interest income; (ii) fees and commissions; (iii) trading income; (iv) other operating income (%).
8,208 29.194 27.089 15.380 0.000 64.525
EQUITY Total equity over total assets (%) 8,208 8.488 8.028 2.530 4.849 22.930 ROA Net income over total assets (%) 8,208 0.725 0.805 -3.896 1.273 3.397 TOBINQ (Book value of liabilities + market value of equity) / book
value of assets 8,208 1.053 1.032 0.933 0.112 1.447 ECONDEVELOP Log of GDP per capita 8,208 3.096 3.574 1.170 -0.858 4.024 GDPVOL The standard deviation of the logarithm of real yearly GDP
growth based of 5 moving years of data 8,208 2.643 2.700 2.972 -6.300 10.000

Table 3: Are Systemically Large Banks More Risky?
The table shows the regression results on distance to default using the within estimator. t-Statistics are reported in round brackets, standard errors have been corrected for heteroskedasticity and clustered at bank-level. SYSTEMICSIZE is the ratio between bank total assets and country GDP, SIZE is the log of total assets; LOANS is the ratio between net loans and total assets, DIVERSIFICATION is equal to 1 minus a Herfindhal index of income concentration, EQUITY is the ratio between total equity and total assets, ROA is the ratio between net income and total assets, TOBINQ is the ratio between (book value of liabilities + market value of equity) divided by the book value of assets, ECONDEVELOP is the log of GDP per capita, GDPVOL is the five year volatility of the real GDP growth rate. * significant at 10%; ** significant at 5%; *** significant at 1%.
(1) (2) (3) (4) (5) (6) (7) (8)
Log transf.
+TOBINQ +Diversif. +GDP volatility
+Stand-alone size
Excl. U.S. banks
OLS with country fixed
effects
SYSTEMICSIZE t-1 -1.559*** -1.320*** -1.606*** -1.355*** -1.206*** -1.330** -0.667** (3.44) (2.98) (3.49) (2.97) (2.68) (2.57) (1.98) LN(SYSTEMICSIZE t-1) -0.205*** (2.65) SIZE t-1 -0.119 -0.413*** (1.53) (2.72) LOANS t-1 -0.808** -0.684** -0.848*** -0.736** -0.719** -0.841* -0.329 (2.53) (2.17) (2.59) (2.29) (2.25) (1.95) (1.36) DIVERSIFICATION t-1 -0.301 -0.436* -0.443* 0.002 0.049 (1.23) (1.81) (1.85) (0.01) (0.26) EQUITY t-1 3.940*** 4.003*** 4.197*** 3.962*** 4.275*** 4.194*** 2.676* 4.363*** (3.62) (3.69) (3.86) (3.65) (4.08) (4.02) (1.71) (4.36) ROA t-1 26.920*** 26.731*** 24.773*** 26.600*** 22.422*** 22.389*** 7.985*** 28.130*** (11.64) (11.60) (10.61) (11.42) (9.54) (9.52) (2.99) (11.03) TOBINQ t-1 1.186*** 1.276*** 1.193*** 0.410 1.643*** (2.83) (3.25) (3.00) (0.82) (4.53) ECONDEVELOP t 1.781*** 1.705*** 1.644*** 1.783*** 1.599*** 1.716*** 1.465*** 1.482*** (10.39) (10.43) (9.97) (10.36) (9.47) (10.07) (6.85) (9.58) GDPVOL t -10.217*** -10.062*** -10.815*** -9.688*** (3.97) (3.89) (4.36) (3.99) Constant -14.293*** -14.951*** -14.734*** -14.220*** -13.663*** -12.913*** -3.644* -14.387*** (8.64) (9.26) (8.90) (8.55) (8.12) (7.06) (1.81) (8.83) Observations 7,258 7,258 7,258 7,258 7,258 7,258 3,693 7,258 Bank Fixed Effects Yes Yes Yes Yes Yes Yes Yes Yes Year Fixed Effects Yes Yes Yes Yes Yes Yes Yes Yes Number of Banks 823 823 823 823 823 823 410 823 Adjusted R-squared 0.506 0.505 0.506 0.506 0.510 0.510 0.338 0.499

Table 4: Are Systemically Larger Banks More Risky during the Recent Crisis? Panel A shows the regression results on distance to default using the within estimator. t-Statistics are reported in round brackets, standard errors have been corrected for heteroskedasticity and clustered at bank-level. SYSTEMICSIZE is the ratio between bank total assets and country GDP, SIZE is the log of total assets, LOANS is the ratio between net loans and total assets, DIVERSIFICATION is equal to 1 minus the Herfindhal index of income concentration, EQUITY is the ratio between total equity and total assets, ROA is the ratio between net income and total assets, TOBINQ is the ratio between the quasi market value of assets and the book value of assets, ECONDEVELOP is the log of GDP per capita, GDPVOL is the five year volatility of the real GDP growth rate. Panel B shows the marginal effect of systemic size on distance to default during the recent crisis. * significant at 10%; ** significant at 5%; *** significant at 1%.
(1) (2) (3) (4) (5)
Panel A: Regression Analysis
SYSTEMICSIZE t-1 -0.478 -0.394 -0.480 -0.263 0.235 (1.05) (0.82) (0.94) (0.56) (0.46) SYTEMICSIZE t-1*GL_CRISIS -1.435*** -1.248*** -1.329*** -1.063*** -1.253*** (7.85) (6.55) (6.47) (4.74) (5.18) SIZE t-1 -0.113 -0.461*** (1.56) (3.38) SIZE t-1* GL_CRISIS -0.054* -0.050 (1.90) (1.11) LOANS t-1 -0.356 -0.387 -0.965** -0.391 -0.831** (1.14) (1.23) (2.30) (1.26) (2.01) DIVERSIFICATION t-1 -0.233 0.357 -0.267 0.329 (0.89) (1.05) (1.02) (0.99) EQUITY t-1 4.099*** 5.287*** 3.594** 5.422*** 2.412 (3.85) (5.41) (2.48) (5.53) (1.61) ROA t-1 29.005*** 24.345*** 10.325*** 24.095*** 10.336*** (12.13) (9.54) (3.78) (9.41) (3.54) TOBINQ t-1 0.581 0.213 0.485 -0.058 (1.40) (0.40) (1.16) (0.11) ECONDEVELOP t 1.285*** 1.326*** 1.106*** 1.453*** 1.573*** (7.40) (7.35) (5.87) (7.93) (7.19) GDPVOL t -10.097*** -12.814*** -9.977*** -12.756*** (3.98) (5.27) (3.92) (5.18) LOANS t-1* GL_CRISIS -0.795** -0.866*** -0.522 -0.978*** -0.465 (2.39) (2.75) (1.19) (3.15) (1.11) DIVERSIFICATION t-1* GL_CRISIS -1.289*** -2.324*** -1.093*** -2.161*** (4.35) (5.62) (3.60) (5.40) EQUITY t-1* GL_CRISIS -7.857*** -8.278*** -2.110 -9.110*** -3.117* (6.52) (7.12) (1.20) (7.80) (1.84) ROA t-1* GL_CRISIS -11.685*** -8.721** -7.788* -7.810** -4.407 (3.29) (2.52) (1.65) (2.25) (0.90) TOBINQ t-1* GL_CRISIS -0.396 -0.472 -0.434 -0.461 (0.88) (0.86) (0.98) (0.86) ECONDEVELOP t* GL_CRISIS -0.468*** -0.550*** -0.356*** -0.539*** -0.333*** (14.27) (15.84) (8.66) (15.90) (7.38) GDPVOL t* GL_CRISIS 49.514*** 34.521*** 51.115*** 35.675*** (12.62) (8.78) (12.69) (9.04) Constant -9.791*** -10.667*** -6.995*** -10.088*** -3.580* (5.86) (6.01) (4.20) (5.41) (1.78) Observations 7,258 7,258 3,693 7,258 3,693 Bank Fixed Effects Yes Yes Yes Yes Yes Year Fixed Effects Yes Yes Yes Yes Yes Incl. U.S. banks? Yes Yes No Yes No Number of Banks 823 823 410 823 410 Adjusted R-squared 0.536 0.550 0.393 0.551 0.398
Panel B: Impact of Systemic Size on Distance to Default during the Recent Crisis
SYTEMICSIZE t-1+SYTEMICSIZE t-1* GL_CRISIS -1.914*** -1.642*** -1.808*** -1.326*** -1.019* (4.24) (3.44) (3.37) (2.69) (1.81)
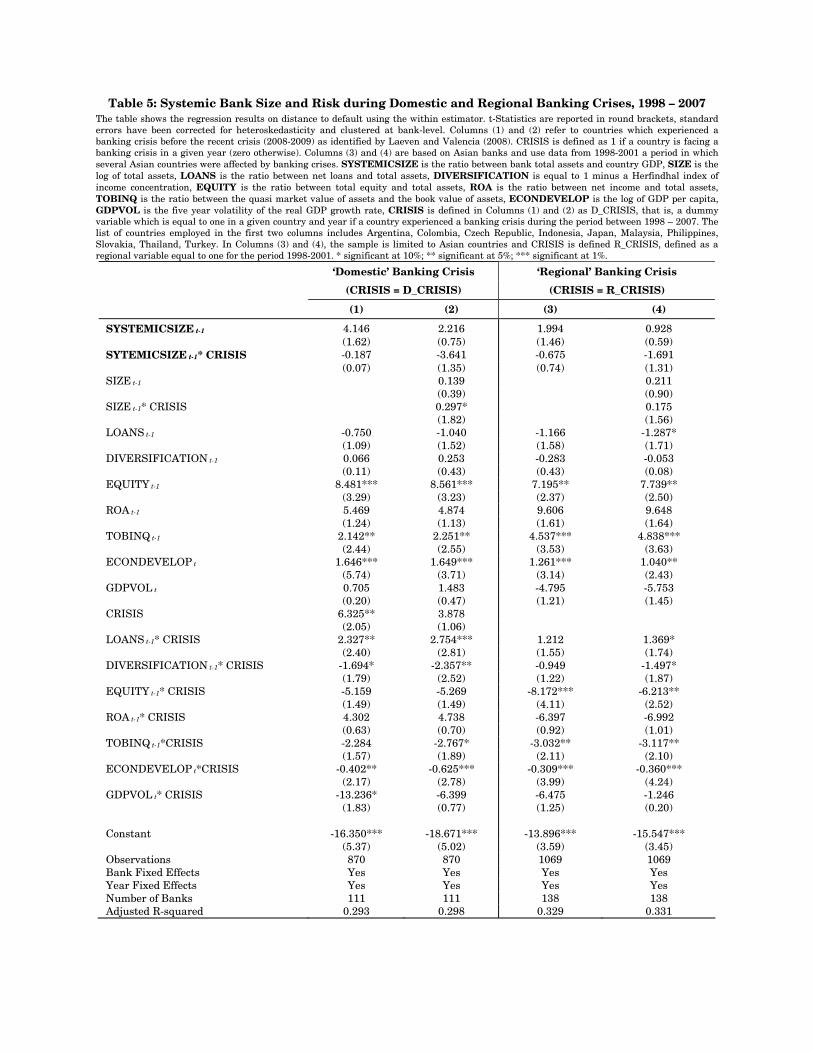
Table 5: Systemic Bank Size and Risk during Domestic and Regional Banking Crises, 1998 – 2007 The table shows the regression results on distance to default using the within estimator. t-Statistics are reported in round brackets, standard errors have been corrected for heteroskedasticity and clustered at bank-level. Columns (1) and (2) refer to countries which experienced a banking crisis before the recent crisis (2008-2009) as identified by Laeven and Valencia (2008). CRISIS is defined as 1 if a country is facing a banking crisis in a given year (zero otherwise). Columns (3) and (4) are based on Asian banks and use data from 1998-2001 a period in which several Asian countries were affected by banking crises. SYSTEMICSIZE is the ratio between bank total assets and country GDP, SIZE is the log of total assets, LOANS is the ratio between net loans and total assets, DIVERSIFICATION is equal to 1 minus a Herfindhal index of income concentration, EQUITY is the ratio between total equity and total assets, ROA is the ratio between net income and total assets, TOBINQ is the ratio between the quasi market value of assets and the book value of assets, ECONDEVELOP is the log of GDP per capita, GDPVOL is the five year volatility of the real GDP growth rate, CRISIS is defined in Columns (1) and (2) as D_CRISIS, that is, a dummy variable which is equal to one in a given country and year if a country experienced a banking crisis during the period between 1998 – 2007. The list of countries employed in the first two columns includes Argentina, Colombia, Czech Republic, Indonesia, Japan, Malaysia, Philippines, Slovakia, Thailand, Turkey. In Columns (3) and (4), the sample is limited to Asian countries and CRISIS is defined R_CRISIS, defined as a regional variable equal to one for the period 1998-2001. * significant at 10%; ** significant at 5%; *** significant at 1%.
‘Domestic’ Banking Crisis ‘Regional’ Banking Crisis
(CRISIS = D_CRISIS) (CRISIS = R_CRISIS)
(1) (2) (3) (4)
SYSTEMICSIZE t-1 4.146 2.216 1.994 0.928 (1.62) (0.75) (1.46) (0.59) SYTEMICSIZE t-1* CRISIS -0.187 -3.641 -0.675 -1.691 (0.07) (1.35) (0.74) (1.31) SIZE t-1 0.139 0.211 (0.39) (0.90) SIZE t-1* CRISIS 0.297* 0.175 (1.82) (1.56) LOANS t-1 -0.750 -1.040 -1.166 -1.287* (1.09) (1.52) (1.58) (1.71) DIVERSIFICATION t-1 0.066 0.253 -0.283 -0.053 (0.11) (0.43) (0.43) (0.08) EQUITY t-1 8.481*** 8.561*** 7.195** 7.739** (3.29) (3.23) (2.37) (2.50) ROA t-1 5.469 4.874 9.606 9.648 (1.24) (1.13) (1.61) (1.64) TOBINQ t-1 2.142** 2.251** 4.537*** 4.838*** (2.44) (2.55) (3.53) (3.63) ECONDEVELOP t 1.646*** 1.649*** 1.261*** 1.040** (5.74) (3.71) (3.14) (2.43) GDPVOL t 0.705 1.483 -4.795 -5.753 (0.20) (0.47) (1.21) (1.45) CRISIS 6.325** 3.878 (2.05) (1.06) LOANS t-1* CRISIS 2.327** 2.754*** 1.212 1.369* (2.40) (2.81) (1.55) (1.74) DIVERSIFICATION t-1* CRISIS -1.694* -2.357** -0.949 -1.497* (1.79) (2.52) (1.22) (1.87) EQUITY t-1* CRISIS -5.159 -5.269 -8.172*** -6.213** (1.49) (1.49) (4.11) (2.52) ROA t-1* CRISIS 4.302 4.738 -6.397 -6.992 (0.63) (0.70) (0.92) (1.01) TOBINQ t-1*CRISIS -2.284 -2.767* -3.032** -3.117** (1.57) (1.89) (2.11) (2.10) ECONDEVELOP t*CRISIS -0.402** -0.625*** -0.309*** -0.360*** (2.17) (2.78) (3.99) (4.24) GDPVOL t* CRISIS -13.236* -6.399 -6.475 -1.246 (1.83) (0.77) (1.25) (0.20) Constant -16.350*** -18.671*** -13.896*** -15.547*** (5.37) (5.02) (3.59) (3.45) Observations 870 870 1069 1069 Bank Fixed Effects Yes Yes Yes Yes Year Fixed Effects Yes Yes Yes Yes Number of Banks 111 111 138 138 Adjusted R-squared 0.293 0.298 0.329 0.331

Table 6: Pre-crisis Bank Returns and Risk-taking during the Recent Crisis Panel A shows the regression results on distance to default using the within estimator. t-Statistics are reported in round brackets, standard errors have been corrected for heteroskedasticity and clustered at bank-level. SYSTEMICSIZE is the ratio between bank total assets and country GDP, SIZE is the log of total assets, LOANS is the ratio between net loans and total assets, DIVERSIFICATION is equal to 1 minus the Herfindhal index of income concentration, EQUITY is the ratio between total equity and total assets, ROA is the ratio between net income and total assets, TOBINQ is the ratio between the quasi market value of assets and the book value of assets, RETURN is the annual rate of return on the bank’s equity minus the average return on sample banks listed in the same country, ECONDEVELOP is the log of GDP per capita, GDPVOL is the five year volatility of the real GDP growth rate. Panel B shows the marginal effects of systemic size on distance to default for different values of RETURN * significant at 10%; ** significant at 5%; *** significant at 1%.
(1) (2) (3) (4)
Panel A: Regression Analysis
SYSTEMICSIZE t-1 -0.775 -0.756 -0.518 0.005 (1.41) (1.37) (0.98) (0.01) SYTEMICSIZE t-1* G_CRISIS -1.203*** -1.193*** -1.043*** -1.242*** (5.89) (5.68) (4.32) (4.87) SYTEMICSIZE t-1* G_CRISIS*RETURN t-1 -0.073 -0.067 -0.086 0.830 (0.08) (0.07) (0.09) (0.82) SIZE t-1 -0.206** -0.621*** (2.26) (3.82) SIZE t-1* G_CRISIS -0.045 -0.020 (1.54) (0.44) LOANS t-1 -0.134 -0.122 -0.126 -0.561 (0.36) (0.33) (0.35) (1.19) DIVERSIFICATION t-1 -0.209 -0.212 -0.245 0.379 (0.78) (0.80) (0.92) (1.13) EQUITY t-1 4.642*** 4.707*** 4.819*** 1.260 (3.91) (3.99) (4.06) (0.73) ROA t-1 28.493*** 27.237*** 26.888*** 10.553*** (10.32) (9.31) (9.16) (3.05) TOBINQ t-1 0.354 0.207 -0.586 (0.78) (0.45) (1.04) RETURN t-1 -0.084* -0.091** -0.093** 0.010 (1.95) (2.05) (2.08) (0.16) SYTEMICSIZE t-1* RETURN t-1 -0.249 -0.247 -0.231 -0.488 (1.02) (1.01) (0.95) (1.62) ECONDEVELOP t 1.420*** 1.417*** 1.628*** 1.743*** (7.47) (7.46) (8.28) (7.33) GDPVOL t -10.467*** -10.495*** -10.375*** -13.007*** (3.88) (3.92) (3.85) (5.18) LOANS t-1* G_CRISIS -0.791** -0.788** -0.849*** -0.419 (2.40) (2.40) (2.65) (0.97) DIVERSIFICATION t-1* G_CRISIS -1.465*** -1.429*** -1.251*** -2.566*** (4.92) (4.79) (4.12) (6.59) EQUITY t-1* G_CRISIS -8.853*** -8.608*** -9.268*** -3.300* (6.88) (6.59) (7.09) (1.88) ROA t-1* G_CRISIS -14.032*** -11.502*** -10.433*** -4.114 (3.89) (3.03) (2.75) (0.81) TOBINQ t-1* G_CRISIS -0.799 -0.881* -0.446 (1.53) (1.69) (0.75) RETURN t-1* G_CRISIS 0.517*** 0.554*** 0.589*** 0.144 (4.97) (5.09) (5.36) (0.86) ECONDEVELOP t* G_CRISIS -0.565*** -0.571*** -0.566*** -0.360*** (15.60) (15.42) (15.57) (7.98) GDPVOL t* G_CRISIS 50.685*** 50.919*** 52.366*** 34.649*** (11.27) (11.44) (11.44) (7.98) Constant -11.475*** -11.823*** -10.574*** -1.953 (6.13) (6.24) (5.20) (0.88) Observations 6,094 6,094 6,094 3,126 Bank Fixed Effects Yes Yes Yes Yes Year Fixed Effects Yes Yes Yes Yes Incl. U.S. banks? Yes Yes Yes No Number of banks 736 736 736 367 Adjusted R-squared 0.583 0.583 0.584 0.437

Table 6: Continued
(1) (2) (3) (4)
Panel B: Marginal Effects of systemic size, by pre-crisis growth in market capitalization
B1. During the Recent crisis (2008-2009)
RETURN (10th percentile) = -0.349 -1.865*** -1.839*** -1.456** -1.356* (2.76) (2.72) (2.14) (1.87) RETURN (median) = -0.040 -1.964*** -1.936*** -1.548*** -1.250** (3.62) (3.57) (2.85) (2.03) RETURN (90th percentile) = +0.337 -2.086*** -2.055*** -1.668*** -1.121* (3.81) (3.73) (3.05) (1.72)
B2. Outside the Recent Crisis (2008-2009)
RETURN (10th percentile) = -0.349 -0.688 -0.670 0.438 0.175 (1.19) (1.16) (0.79) (0.29) RETURN (median) = -0.040 -0.765 -0.746 -0.509 0.025 (1.38) (1.35) (0.96) (0.04) RETURN (90th percentile) = +0.337 -0.859 -0.840 -0.596 -0.159 (1.60) (1.56) (1.16) (0.29)

Table 7: Bank Leverage, Diversification and Risk-taking during the Crisis Panel A shows the regression results on distance to default using the within estimator. t-Statistics are reported in round brackets, standard errors have been corrected for heteroskedasticity and clustered at bank-level. SYSTEMICSIZE is the ratio between bank total assets and country GDP, SIZE is the log of total assets, LOANS is the ratio between net loans and total assets, DIVERSIFICATION is equal to 1 minus the Herfindhal index of income concentration, EQUITY is the ratio between total equity and total assets, ROA is the ratio between net income and total assets, TOBINQ is the ratio between the quasi market value of assets and the book value of assets, ECONDEVELOP is the log of GDP per capita, GDPGVOL is the five year volatility of the real GDP growth rate,. Panel B shows the marginal effects of systemic size on distance to default for different values of capital adequacy and income diversification * significant at 10%; ** significant at 5%; *** significant at 1%.
(1) (2) (3) (4) (5) (6)
Bank Leverage Income Diversification
Panel A: Regression analysis
SYSTEMICSIZE t-1 -0.577 -0.492 -0.352 -2.762*** -2.655*** -1.936** (0.84) (0.74) (0.50) (3.20) (3.06) (1.99) SYTEMICSIZE t-1* GL_CRISIS -1.675*** -1.518*** -1.451*** -1.041 -0.653 -1.987*** (5.99) (5.10) (4.48) (1.28) (0.78) (2.63) SYTEMICSIZE t-1* GL_CRISIS * EQUITY t-1 8.400*** 9.206*** 5.043* (2.99) (3.36) (1.72) SYTEMICSIZE t-1* GL_CRISIS * DIVERSIFICATION t-1
-0.493 (0.29)
-0.909 (0.53)
1.663 (1.00)
SIZE t-1 -0.116 -0.484*** -0.099 -0.419*** (1.59) (3.45) (1.37) (2.97) SIZE t-1* GL_CRISIS -0.057** -0.055 -0.057** -0.057 (2.01) (1.24) (2.02) (1.26) LOANS t-1 -0.388 -0.392 -0.829** -0.329 -0.335 -0.769* (1.23) (1.26) (2.01) (1.05) (1.08) (1.86) DIVERSIFICATION t-1 -0.231 -0.266 0.324 -0.635** -0.671** -0.185 (0.88) (1.02) (0.97) (2.39) (2.54) (0.51) SYTEMICSIZE t-1* DIVERSIFICATION t-1 4.723*** 4.760*** 4.113** (2.98) (3.01) (2.39) EQUITY t-1 5.164*** 5.274*** 1.474 5.373*** 5.531*** 2.499* (5.10) (5.17) (0.86) (5.50) (5.65) (1.66) SYTEMICSIZE t-1* EQUITY t-1 4.623 5.738 13.067 (0.44) (0.55) (1.09) ROA t-1 24.349*** 24.086*** 10.420*** 24.024*** 23.783*** 10.320*** (9.56) (9.42) (3.56) (9.51) (9.39) (3.59) TOBINQ t-1 0.581 0.480 -0.050 0.595 0.508 0.018 (1.40) (1.15) (0.09) (1.45) (1.23) (0.03) ECONDEVELOP t 1.323*** 1.453*** 1.589*** 1.259*** 1.371*** 1.486*** (7.33) (7.92) (7.22) (7.08) (7.59) (6.77) GDPVOL t -0.909*** -1.033*** -0.551 -0.829*** -0.961*** -0.399 (2.85) (3.29) (1.28) (2.62) (3.10) (0.95) LOANS t-1* GL_CRISIS -1.311*** -1.108*** -2.157*** -1.227*** -1.004*** -2.278*** (4.43) (3.65) (5.41) (4.06) (3.24) (5.27) DIVERSIFICATION t-1* GL_CRISIS -8.586*** -9.492*** -3.682** -8.237*** -9.137*** -2.926* (7.14) (7.82) (2.02) (7.06) (7.80) (1.70) EQUITY t-1* GL_CRISIS -8.948** -8.015** -4.351 -9.112*** -8.202** -4.956 (2.58) (2.30) (0.90) (2.63) (2.36) (1.01) ROA t-1* GL_CRISIS -0.414 -0.455 -0.451 -0.336 -0.385 -0.373 (0.91) (1.01) (0.84) (0.74) (0.86) (0.69) TOBINQ t-1* GL_CRISIS -0.543*** -0.531*** -0.329*** -0.558*** -0.546*** -0.339*** (15.41) (15.43) (7.26) (15.82) (15.85) (7.46) ECONDEVELOP t* GL_CRISIS 48.648*** 50.254*** 35.423*** 48.807*** 50.368*** 34.896*** (12.46) (12.54) (9.10) (12.80) (12.88) (9.04) GDPVOL t* GL_CRISIS -9.758*** -9.587*** -12.392*** -9.792*** -9.681*** -12.681*** (3.82) (3.73) (5.00) (3.92) (3.86) (5.25) Constant -10.635*** -10.036*** -3.330 -9.950*** -9.447*** -3.386* (5.99) (5.38) (1.64) (5.68) (5.12) (1.67) Observations 7,258 7,258 3,693 7,258 7,258 3,693 Bank Fixed Effects Yes Yes Yes Yes Yes Yes Year Fixed Effects Yes Yes Yes Yes Yes Yes Incl. U.S. banks? Yes Yes No Yes Yes No Number of Banks 823 823 410 823 823 410 Adjusted R-squared 0.534 0.536 0.371 0.535 0.537 0.374

Table 7: Continued
(1) (2) (3) (4) (5) (6)
Capital Adequacy Income Diversification
Panel B: Marginal Effects of Systemic Size, by Leverage and Diversification
B1. During the Recent Crisis (2008-2009)
EQUITY (10th percentile) = 0.044 -1.681*** -1.356*** -1.008* (3.56) (2.79) (1.81) EQUITY (median) = 0.080 -1.207* -0.811 -0.349 (1.89) (1.24) (0.46) EQUITY (90th percentile) = 0.122 -0.661 -0.184 0.410 (0.65) (0.18) (0.35)
B2. Outside the Recent Crisis (2008-2009)
EQUITY (10th percentile) = 0.044 -0.374 -0.241 0.221 (0.78) (0.51) (0.44) EQUITY (median) = 0.080 -0.206 -0.032 0.697 (0.34) (0.05) (1.02) EQUITY (90th percentile) = 0.122 -0.021 0.209 1.244 (0.01) (0.22) (1.15)
B3. During the Recent Crisis (2008-2009)
DIVERSIFICATION (10th percentile)= 0.103 -3.369*** -2.913*** -3.330*** (3.73) (3.07) (3.44) DIVERSIFICATION (median) = 0.279 -2.624*** -2.234*** -2.312*** (4.07) (3.28) (3.23) DIVERSIFICATION (90th percentile) = 0.497 -1.700*** -1.393*** -1.052** (3.92) (3.09) (2.01)
B4. Outside the Recent Crisis (2008-2009)
DIVERSIFICATION (10th percentile)= 0.103 -2.277*** -2.167*** -1.514* (3.11) (2.95) (1.83) DIVERSIFICATION (median) = 0.279 -1.444*** -1.327*** -0.789 (2.65) (2.44) (1.28) DIVERSIFICATION (90th percentile) = 0.497 -0.414 -0.288 0.108 (0.89) (0.62) (0.21)

Table 8: Systemically Large Banks and Market Discipline during the Recent Crisis
Panel A shows the regression results on distance to default using the within estimator. t-Statistics are reported in round brackets, standard errors have been corrected for heteroskedasticity and clustered at bank-level. SYSTEMICSIZE is the ratio between bank total assets and country GDP, SIZE is the log of total assets, LOANS is the ratio between net loans and total assets, DIVERSIFICATION is equal to 1 minus the Herfindhal index of income concentration, EQUITY is the ratio between total equity and total assets, ROA is the ratio between net income and total assets, TOBINQ is the ratio between the quasi market value of assets and the book value of assets, SUBDEBT is the value of subordinated debt scaled by total liabilities, ECONDEVELOP is the log of GDP per capita, GDPGVOL is the five year volatility of the real GDP growth rate. Panel B shows the marginal effects of systemic size on distance to default for different values of capital adequacy and income diversification * significant at 10%; ** significant at 5%; *** significant at 1%.
(1) (2) (3) (4)
Panel A: Regression Analysis
SYSTEMICSIZE t-1 -0.283 -0.227 -0.553 0.144 (0.52) (0.43) (0.89) (0.25) SYTEMICSIZE t-1* G_CRISIS -1.677*** -1.505*** -1.638*** -1.730*** (5.05) (4.14) (3.91) (4.09) SYTEMICSIZE t-1* G_CRISIS*SUBDEBT 40.972*** 40.397*** 31.585** 30.062** (2.94) (2.92) (2.03) (2.06) SIZE t-1 -0.087 -0.516*** (1.02) (3.06) SIZE t-1* G_CRISIS -0.049 0.009 (1.52) (0.17) LOANS t-1 -0.475 -0.498 -1.405*** -1.311*** (1.31) (1.39) (2.82) (2.72) DIVERSIFICATION t-1 0.176 0.128 0.827** 0.758** (0.71) (0.52) (2.45) (2.33) EQUITY t-1 4.444*** 4.582*** 4.556*** 2.892 (4.04) (4.19) (2.60) (1.56) ROA t-1 29.877*** 29.648*** 14.360*** 14.037*** (9.71) (9.60) (3.68) (3.42) TOBINQ t-1 -0.081 -0.142 -0.602 -0.748 (0.19) (0.34) (1.13) (1.35) SUBDEBT t-1 10.473*** 10.261*** 5.447* 5.290 (4.94) (4.79) (1.69) (1.61) SYSTEMICSIZE t-1*SUBDEBT t-1 -19.046 -18.042 -8.246 -8.476 (1.17) (1.10) (0.46) (0.48) ECONDEVELOP t 1.517*** 1.613*** 1.556*** 2.070*** (7.92) (8.23) (7.69) (7.88) GDPVOL t -7.505** -7.199** -12.397*** -11.907*** (2.51) (2.41) (4.03) (3.88) LOANS t-1* G_CRISIS -0.481 -0.575 -0.334 -0.125 (1.30) (1.59) (0.60) (0.24) DIVERSIFICATION t-1* G_CRISIS -1.012*** -0.785** -1.503*** -1.483*** (2.97) (2.30) (2.71) (2.70) EQUITY t-1* G_CRISIS -7.588*** -8.266*** -1.374 -1.231 (5.84) (6.27) (0.57) (0.52) ROA t-1* G_CRISIS -0.460 -0.485 -0.977 -0.840 (0.84) (0.90) (1.42) (1.21) TOBINQ t-1* G_CRISIS -16.321*** -15.713*** -15.631** -13.743* (3.96) (3.84) (2.12) (1.89) SUBDEBT t-1* G_CRISIS -20.216*** -19.692*** -20.122*** -18.242*** (7.38) (7.18) (4.78) (4.32) ECONDEVELOP t* G_CRISIS -0.518*** -0.515*** -0.368*** -0.369*** (13.21) (13.26) (7.43) (7.47) GDPVOL t* G_CRISIS 40.073*** 40.722*** 33.724*** 34.032*** (7.53) (7.56) (6.43) (6.48) Constant -12.020*** -11.568*** -10.324*** -6.461*** (6.24) (5.57) (5.61) (2.83) Observations 5552 5552 2690 2690 Bank Fixed Effects Yes Yes Yes Yes Year Fixed Effects Yes Yes Yes Yes Incl. U.S. banks? Yes Yes No No Number of Banks 664 664 324 324 Adjusted R-squared 0.590 0.590 0.466 0.471

Table 8: Continued
(1) (2) (3) (4)
Panel B: Marginal Effects of Systemic Size, by Subordinated Debt Issued
B1. During the Recent Crisis (2008-2009)
NO ISSUERS -1.960*** -1.732*** -2.191*** -1.586** (3.60) (3.17) (3.20) (2.37) SUBDEBT= median (1.05%) -1.731*** -1.498*** -1.947*** -1.360** (3.53) (2.99) (3.23) (2.24) SUBDEBT= 99th percentile (6.00%) -0.646 -0.391 -0.791 -0.291 (0.74) (0.45) (0.81) (0.29) B2. Outside the Recent Crisis (2008-2009)
NO ISSUERS -0.283 -0.227 -0.553 0.144 (0.52) (0.43) (0.89) (0.25) SUBDEBT= median (1.05%) -0.482 -0.415 -0.639 0.056 (1.00) (0.89) (1.17) (0.25) SUBDEBT= 99 th percentile (6.00%) -1.425* -1.309 -1.047 -0.364 (1.67) (1.54) (1.14) (0.39)

60%
50%
40%
70%
1998 2000 2002 2004 2006 2008 2010
Average Systemic Size 3-Year Moving Average
Figure 1: Evolution of Systemic Size in the Top 50 Systemically Large Banks as of end-1998
Top Related