


Languages
Pages
Legal

Social Disparities in Oral Health in America amid the COVID-19 Pandemic
Yangxin Fan, 1 Hanjia Lyu, 2 Jin Xiao, 3 Jiebo Luo 2,*
1 Goergen Institute for Data Science, University of Rochester, Rochester, 14627, USA2 Department of Computer Science, University of Rochester, Rochester, 14627, USA3 Eastman Institute for Oral Health, University of Rochester, Rochester, 14620, USA
* Corresponding author: Jiebo Luo ([email protected])
Abstract
We conduct a large-scale social media-based study of oralhealth during the COVID-19 pandemic based on tweets from9,104 Twitter users across 26 states (with sufficient samples)in the United States for the period between November 12,2020 and June 14, 2021. To better understand how discus-sions on different topics/oral diseases vary across the users,we acquire or infer demographic information of users andother characteristics, including age, gender, income, popu-lation density, poverty rate, health insurance coverage rate,community water fluoridation rate, and relative change in thenumber of daily confirmed COVID-19 cases based on re-trieved information from user profiles. Women and youngeradults (19-29) are more likely to talk about oral health prob-lems. We use the LDA topic model to extract the majortopics/oral diseases in tweets. Overall, 26.70% of the Twit-ter users talk about wisdom tooth pain/jaw hurt, 23.86%tweet about dental service/cavity, 18.97% discuss chippedtooth/tooth break, 16.23% talk about dental pain, and the restare about tooth decay/gum bleeding. By conducting logisticregression, we find that discussions vary across user charac-teristics. More importantly, we find social disparities in oralhealth during the pandemic. Specifically, we find that healthinsurance coverage rate is the most significant predictor inlogistic regression for topic prediction. People from coun-ties with higher insurance coverage tend to tweet less aboutall topics of oral diseases. People from counties at a higherrisk of COVID-19 talk more about tooth decay/gum bleedingand chipped tooth/tooth break. Older adults (≥ 50), who arevulnerable to COVID-19, are more likely to discuss dentalpain. To our best knowledge, this is the first large-scale so-cial media-based study to analyze and understand oral healthin America amid the COVID-19 pandemic. We hope the find-ings of our study through the lens of social media can provideinsights for oral health practitioners and policy makers.
IntroductionAfter the World Health Organization declared the globalspread of COVID-19 a pandemic on March 11, 2020,1 lock-downs were enforced nationwide in the US to reduce thespread of the virus. At the early outbreak of the COVID-19 pandemic, the American Dental Association (ADA) rec-ommended that dental practices postpone elective procedure
1https://pubmed.ncbi.nlm.nih.gov/32191675/ [AccessedSeptember 8, 2021]
and provide emergency-only dental services.2 As a result,patients’ access to dental services have greatly decreased.During the week of March 23, 2020, an ADA Health PolicySurvey indicated that 19% of dental offices were completelyclosed and 76% were partly closed but seeing emergencypatients only (Association et al. 2020). More importantly,loss of dental insurance by many people has also increasedthe risk of oral diseases. According to a survey commis-sioned by the CareQuest Institute for Oral Health,3 an es-timated six million American adults have lost their dentalinsurance and 28 million American adults delayed gettingdental care. Although most dental clinics reopened in June2020, dental services have not rebounded to the full capacitydue to office infection control regulation, lack of PPEs, andreduced patient-initiated dental visits.4 Additionally, studieshave found that there is an association between oral healthand severity of COVID-19 complications that makes pre-venting bad oral health even more challenging (Sampson,Kamona, and Sampson 2020; Botros, Iyer, and Ojcius 2020).An indirect connection has also been suggested that due tothe work from home (WFH) policy, people increase con-sumption of products that are likely to be detrimental to den-tal health (e.g., alcohol, sweets) but also increase the use ofproducts which benefit oral health.5
Given the emergency of dental care caused by lack of ac-cess to dental services and loss of dental insurance, we at-tempt to identify the vulnerable groups of people by ana-lyzing factors like age, gender, population density, income,poverty rate, health insurance coverage, community waterfluoridation, as well as relative change in the number of dailyconfirmed COVID-19 cases. In addition, we intend to ex-plore what kinds of oral diseases or issues to which they are
2https://www.ada.org/en/publications/ada-news/2020-archive/march/ada-recommending-dentists-postpone-elective-procedures[Accessed September 1, 2021]
3https://www.carequest.org/system/files/CareQuest-Institute-Coming-Surge-Oral-Health-Treatment-Needs-Report-1.pdf[Accessed September 3, 2021]
4https://www.ada.org/en/science-research/health-policy-institute/covid-19-dentists-economic-impact/survey-results [Ac-cessed September 15, 2021]
5https://bridgedental.com/2020/04/26/the-impact-of-working-from-home-during-the-coronavirus-lockdown-on-dental-health/[Accessed September 15, 2021]
arX
iv:2
109.
0765
2v1
[cs
.SI]
16
Sep
2021
more likely to be exposed during the COVID-19 pandemic.To our best knowledge, this is the first large-scale socialmedia-based study to analyze and understand oral health inAmerica amid the COVID-19 pandemic. We hope our studythrough the lens of social media, especially the findings ofsocial disparities, can provide insights for oral health practi-tioners and policy makers.
Related WorkOral health services in the US face an unprecedented chal-lenge during the COVID-19 outbreak. On one hand, theCOVID-19 pandemic increased the risk for oral diseasesof whom are vulnerable to COVID-19, including those inrural areas, low socioeconomic groups, older adults, dis-advantaged and underprivileged children, and the unin-sured (Kalash 2020; Marchini and Ettinger 2020; Weintraub2020). On the other hand, complex effect from intensifiedCOVID-19 therapies and multi-drug treatment could possi-bly further exacerbate some oral conditions (Dziedzic andWojtyczka 2021). COVID-19 also has direct effects on oralhealth through its official symptom ageusia (Daly and Black2020). Despite of the fact that COVID-19 testing positivityrates were low among practicing US dentists (Estrich et al.2020), the fear of contacting the virus may still lead to resis-tance to dental treatment, which in turn will increase of thelevel of dental anxiety (González-Olmo et al. 2020).
Although the COVID-19 pandemic has greatly impactedpeople’s oral health over the last year, as an innovative wayof disease diagnosis, telemedicine has gained public atten-tion since it has the potential to provide the patients with theclinical care they need while remaining the distance (Hol-lander and Carr 2020). An example of telemedicine for oralhealth is to utilize the instant text and image messaging func-tions from social media platforms to diagnose and counselfor oral diseases in the COVID-19 era (Machado et al. 2020).Many large-scale social media-based studies have investi-gated different public health topics amid the COVID-19 pan-demic, such as acquiring insights about the US mental healthduring the COVID-19 pandemic from Twitter data (Valdezet al. 2020), studying the natural and diffusion of COVID-19 related oral health information using tweets from Chinesesocial media Weibo (Tao et al. 2020), monitoring depressiontrends on Twitter during the COVID-19 pandemic (Zhouet al. 2021; Zhang et al. 2021), tracking mental health (Gun-tuku et al. 2020; Valdez et al. 2020), and investigating publicopinions on COVID-19 vaccines (Lyu et al. 2021; Bonnevieet al. 2021; Wu, Lyu, and Luo 2021).
Study ObjectivesTwitter has been a popular social media platform for peoplein the US to express their views and share their lives witheach other. As of July 2021, there are about 73 million Twit-ter users in the US.6 In this study, we intend to understandonline discussions on oral health during the COVID-19 pan-demic. We conduct a large-scale social media-based study
6https://www.statista.com/statistics/242606/number-of-active-twitter-users-in-selected-countries/ [Accessed August 28, 2021]
of 9,104 Twitter users across 26 states (with sufficient sam-ples) in the US for the period between November 12, 2020to June 14, 2021. We collect our data using Tweepy7 and ac-quire or infer user characteristics based on the informationof Twitter users. Particularly, our study aims to answer thefollowing research questions:
• RQ1: What are the major topics/oral diseases discussedin oral health-related tweets?
• RQ2: How does discussion of each type of topic/oral dis-ease vary across user characteristics including age, gen-der, population density, income and poverty rate?
• RQ3: How does health insurance coverage rate, rela-tive change in the number of daily confirmed COVID-19cases, and community water fluoridation rate influenceusers’ probability of tweeting about different topics/oraldiseases?
To summarize, we make the following three major contri-butions:
• By applying Latent Dirichlet Allocation (LDA) topicmodeling (Blei, Ng, and Jordan 2003), our study discov-ers five major topics/oral diseases, including dental pain,dental service/cavity, tooth decay/gum bleeding, wisdomtooth pain/jaw hurt, and chipped tooth/tooth break.
• By conducting multiple logistic regression analyses, wefind that discussions of topics/diseases vary across userdemographics.
• Our analyses show social disparities in oral health thatpeople from the counties with higher health insurancecoverage rate tend to tweet less about oral diseases in gen-eral and people from counties at a higher risk of COVID-19 tend to tweet less about dental service/cavity but moreabout oral diseases like tooth decay/gum bleeding andchipped tooth/tooth break. Older people mention dentalpain more frequently.
MethodsIn this section, we introduce the data collection and themethods we use in our analyses. To address RQ1, we discusshow we extract topics using Topic Modeling. To investigateRQ2 and RQ3, we describe how we infer the user character-istics and conduct the logistic regressions.
Data Collection and PreprocessingWe collect oral health-related tweets through Tweepy usinga list of keywords including “tooth decay”, “cavity”, “blackhole”, “food stuck on teeth”, “gums bleeding”, “gums red”,“gums inflammation”, “face swelling”, “cheek swelling”,“drain in my mouth”, “tongue swelling”, “cannot swal-low”, “tooth chipped”, “tooth break”, “pain”, “throbbing”,“radiate to the ear”, “jaw hurts”, “can’t open the mouth”,and “wisdom tooth hurts”. However, simply using keywordsearch may collect many false positive tweets. In particu-lar, the tweets with only “pain”, “black hole”, “cavity”, or“throbbing” may not be related to dental health. Therefore,
7https://www.tweepy.org/ [Accessed August 26, 2021]
we remove this kind of tweets by adding one constraint. Ifthe tweet only contains one of the keywords “pain”, “blackhole”, “cavity”, or “throbbing” but does not contain anyother keywords from the aforementioned keyword list, thistweet is excluded from our dataset. To validate this method,we randomly sample 1,000 tweets, read them and examineif they are related to our study. Using our method, 1.7% arelabeled as relevant and 94.1% of them are indeed relatedto dental health discussions. Of the 98.3% tweets that arelabeled as irrelevant, none of them are actually related todental health discussions. The validation indicates a goodperformance of our excluding criteria. In addition, since ourstudy focuses on understanding the online discussions of USTwitter users, we exclude the tweets that were not posted bythe users whose profile indicates a US location. After remov-ing the irrelevant tweets, the dataset is composed of 21,677tweets for the period between November 12, 2020 to June14, 2021 tweeted by 15,133 unique users.
Feature InferenceAge and Gender Following the methods used in Lyu et al.(2020), we use the Face++ API8 to infer the age and gen-der information of Twitter users based on their profile im-ages. There may be multiple faces in one profile image. Toachieve the most robust inference of the demographic infor-mation of the Twitter users, we only include users with oneintelligible face. In addition, the invalid image URLs are re-moved. Face++ is one of the most robust image-based infer-ence method with respect to age and gender inference (Junget al. 2018).
Age is binned into five groups: ≤ 18, 19-29, 30-49, 50-64,and ≥ 65. Users who are younger than 18 years old, between19 to 29, between 30 to 49, and between 50 to 64 years oldaccount for 1.6%, 48.6%, 37.3%, and 9.3%, respectively.The rest are over or equal to 65 years old. According to areport from the Pew Research Center (Wojcik and Hughes2019), among the US adult Twitter users, 29% are between18-29 years old, 44% are between 30-49 years old, 19% arebetween 50-64 years old, and 8% are over or equal to 65years old. Compared to the age distribution of general Twit-ter users, there are proportionally more adults between 19 to29 years old in our dataset. This is consistent with the findingof a household survey9 that younger adults are most likely toreport problems regarding the condition of their mouth andteeth. With respect to gender, as of January 2021, the gen-der distribution of Twitter users in the US is biased towardsmen who account for 61.6% of total users.10 However, in ourdataset, 57.4% users are women. Women tend to tweet aboutdental health more actively which echos the previous studythat women are more dentally anxious (Doerr et al. 1998).
Population Density We apply a Python package - USZip-code search engine to extract population density of each
8https://www.faceplusplus.com/ [Accessed August 28, 2021]9https://www.ada.org/~/media/ADA/Science%20and%
20Research/HPI/OralHealthWell-Being-StateFacts/US-Oral-Health-Well-Being.pdf [Accessed September 9, 2021]
10https://www.statista.com/statistics/678794/united-states-twitter-gender-distribution/ [Accessed September 8, 2021]
Twitter user’s location based on their profile information thatwere reported by themselves. The population density is cat-egorized into three levels: urban (greater than 3,000 peopleper square mile), suburban (1,000-3,000 people per squaremile), and rural (less than 1,000 people per square mile). Inour study population, 72.0% are urban, 12.1% are suburban,and 15.9% are rural which is similar to the share reportedin a previous report of the Pew Research Center11 that mostTwitter users live in urban area.
Income and Poverty Rate Studies have shown that in-come or poverty rate is strongly associated with oral cancer,dental caries prevalence, caries experience, and traumaticdental injuries (Singh, Peres, and Watt 2019). Therefore, wepropose to include the socioeconomic status of the Twitterusers into our study. Specifically, we use the Census API12
to retrieve median per capita income and poverty rate at thecounty level from the 2019 American Community Survey(ACS).
Health Insurance Coverage Rate To our best knowledge,there is no publicly disclosed detailed information aboutdental insurance coverage rate at the county or city level.However, Pérez-Núñez et al. (2006) found that having med-ical insurance is positively correlated with better dental carecoverage. Thus, we choose to use the health insurance cover-age rate to approximately measure each user’s accessibilityto dental services. We use the Census API to retrieve healthinsurance coverage at the county level from the 2019 Amer-ican Community Survey (ACS).
Fluoridation Rate Studies have shown that drinking fluo-ridated water can keep teeth strong and reduce cavities byabout 25% in children and adults.13 To better understandhow community water fluoridation rate influence the den-tal health topics that people usually tweet about, we use thelatest state-level fluoridation statistics from the Centers ofDisease Control and Prevention to approximate the fluorida-tion rate of water that users use and drink.14
Pandemic Severity To measure the pandemic severity, wecalculate the county-level 7-day average relative change inthe number of daily COVID-19 confirmed cases. The data iscollected from the data repository maintained by the Centerfor Systems Science and Engineering (CSSE) at John Hop-kins University (Dong, Du, and Gardner 2020).
In the end, after inferring or extracting gender, age, popu-lation density, income, poverty rate, health insurance cover-age rate, community fluoridation rate, and relative change ofthe number of daily confirmed COVID-19 cases and retain-ing states having at least 100 unique users, our final dataset
11https://www.pewresearch.org/fact-tank/2019/04/10/share-of-u-s-adults-using-social-media-including-facebook-is-mostly-unchanged-since-2018/ [Accessed September 9, 2021]
12https://www.census.gov/data/developers.html [AccessedSeptember 8, 2021]
13https://www.cdc.gov/fluoridation/index.html [AccessedSeptember 6, 2021]
14https://www.cdc.gov/fluoridation/statistics/2018stats.htm/[Accessed September 11, 2021]
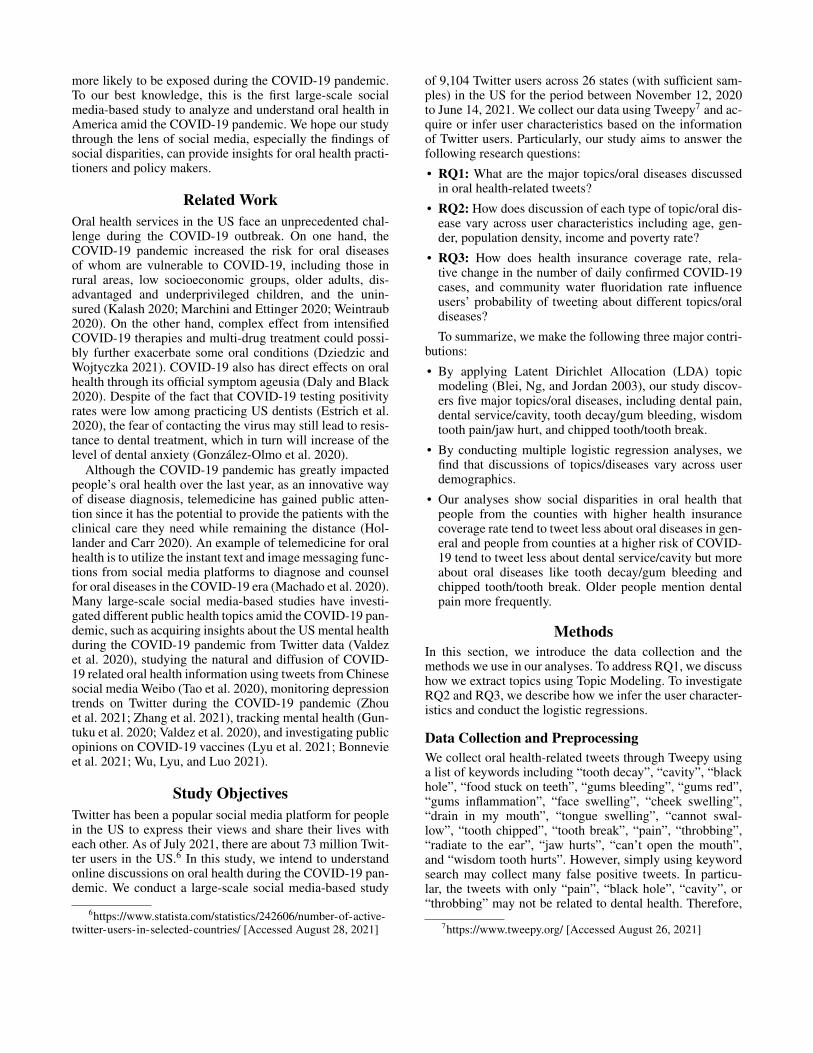
(a) Number of Twitter users by state. (b) Number of Twitter users per 10,000 of total population.
Figure 1: State-level user distributions.
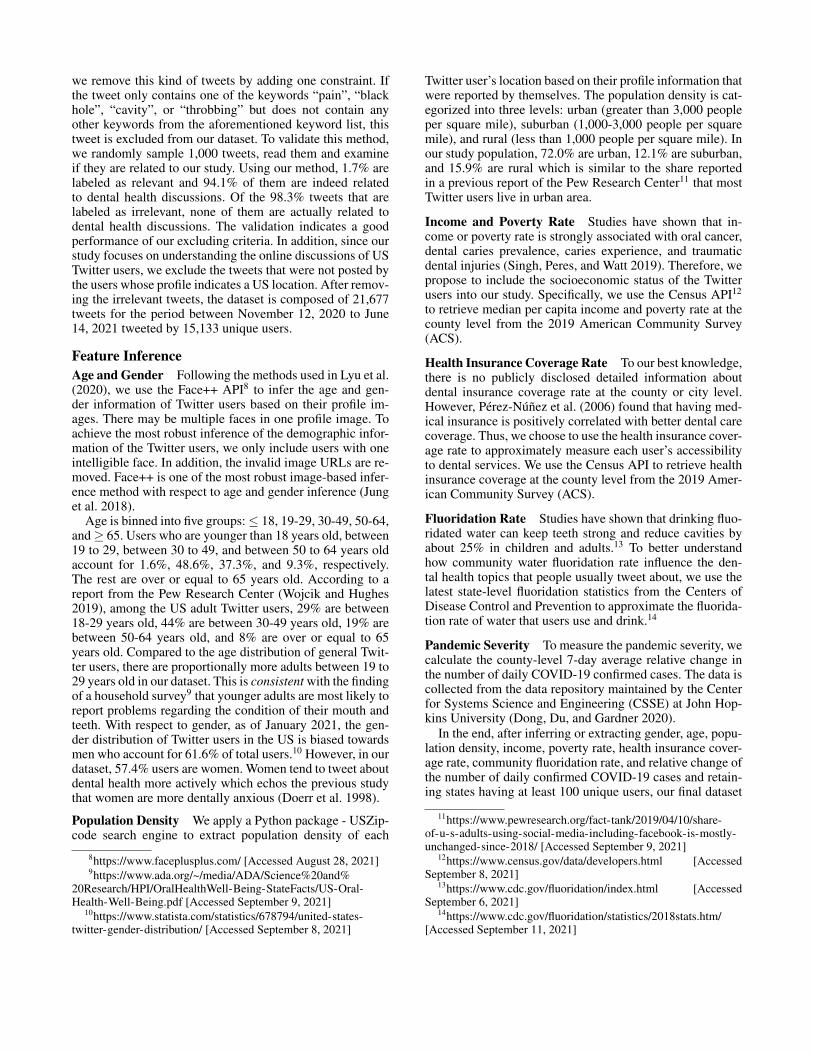
consists of 10,883 tweets posted by 9,104 Twitter userswith all inferred features included. Figure 1a shows the geo-graphic distribution of Twitter users in our study. California,Texas, and New York are the top three states with regard tothe number of users who tweet about oral health. However,this could be because that these states are most active in gen-eral.15 Figure 1b shows that New York, Nevada, and Oregontend to have higher relative frequency of users who tweetabout oral health. It is noteworthy that Oregon has the high-est dental care utilization among adults with private dentalbenefits.16 Figure 2 illustrates the trend of daily frequency ofunique tweets. Apart from the big “down” and “up” betweenearly January 2021 and mid-March 2021 which roughly cor-respond to the trend of daily COVID-19 confirmed cases inthe US (Dong, Du, and Gardner 2020), the daily tweet activ-ity stays relatively stable and varies mostly between 20 and60 tweets per day.
Figure 2: Trend of tweet activity (unique tweets).
15https://www.allbusiness.com/twitter-ranking-which-states-twitter-the-most-12329567-1.html [Accessed September 15,2021]
16http://www.ada.org/~/media/ADA/Science%20and%20Research/HPI/OralHealthCare-StateFacts/Oral-Health-Care-System-Full-Report.pdf [Accessed September 15, 2021]
Topic ModelingWe use LDA (Blei, Ng, and Jordan 2003) to extract top-ics from tweets. We remove Twitter handles, hashtags, links,punctuation, numbers, special characters, and stop words toclean the texts of our tweets. We use the spaCy packageto only keep the words whose postag is either “NOUN”,“ADJ”, “VERB”, or “ADV”. We apply grid search to find theoptimal hyperparameters setting for num_topics, alpha,and beta. The optimal setting is as follows: num_topics =5, alpha = 0.01, and beta = 0.41, with a coherence score of0.53.
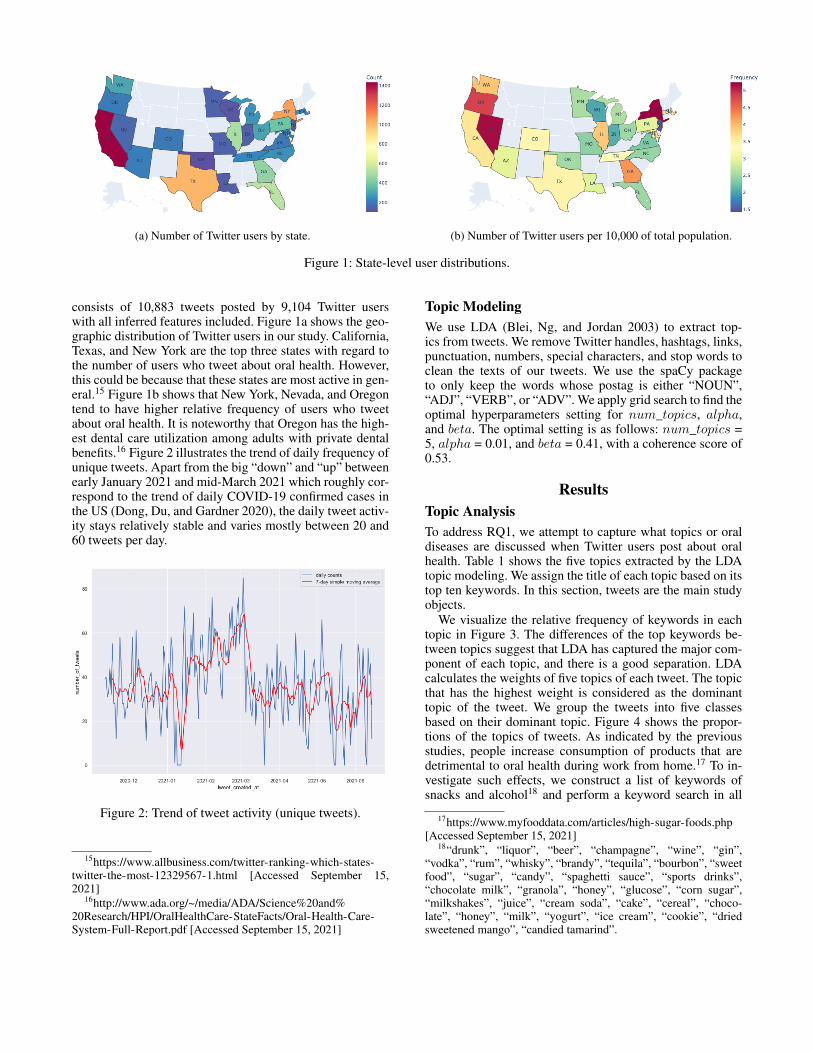
ResultsTopic AnalysisTo address RQ1, we attempt to capture what topics or oraldiseases are discussed when Twitter users post about oralhealth. Table 1 shows the five topics extracted by the LDAtopic modeling. We assign the title of each topic based on itstop ten keywords. In this section, tweets are the main studyobjects.
We visualize the relative frequency of keywords in eachtopic in Figure 3. The differences of the top keywords be-tween topics suggest that LDA has captured the major com-ponent of each topic, and there is a good separation. LDAcalculates the weights of five topics of each tweet. The topicthat has the highest weight is considered as the dominanttopic of the tweet. We group the tweets into five classesbased on their dominant topic. Figure 4 shows the propor-tions of the topics of tweets. As indicated by the previousstudies, people increase consumption of products that aredetrimental to oral health during work from home.17 To in-vestigate such effects, we construct a list of keywords ofsnacks and alcohol18 and perform a keyword search in all
17https://www.myfooddata.com/articles/high-sugar-foods.php[Accessed September 15, 2021]
18“drunk”, “liquor”, “beer”, “champagne”, “wine”, “gin”,“vodka”, “rum”, “whisky”, “brandy”, “tequila”, “bourbon”, “sweetfood”, “sugar”, “candy”, “spaghetti sauce”, “sports drinks”,“chocolate milk”, “granola”, “honey”, “glucose”, “corn sugar”,“milkshakes”, “juice”, “cream soda”, “cake”, “cereal”, “choco-late”, “honey”, “milk”, “yogurt”, “ice cream”, “cookie”, “driedsweetened mango”, “candied tamarind”.
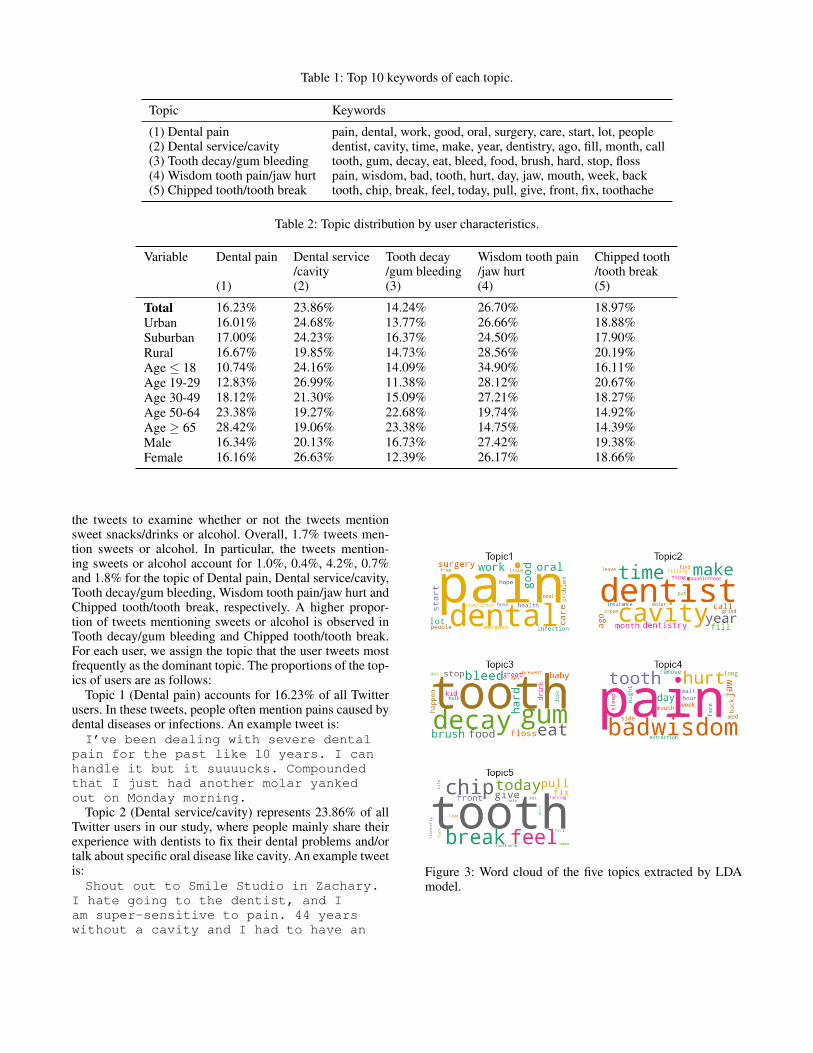
Table 1: Top 10 keywords of each topic.
Topic Keywords
(1) Dental pain pain, dental, work, good, oral, surgery, care, start, lot, people(2) Dental service/cavity dentist, cavity, time, make, year, dentistry, ago, fill, month, call(3) Tooth decay/gum bleeding tooth, gum, decay, eat, bleed, food, brush, hard, stop, floss(4) Wisdom tooth pain/jaw hurt pain, wisdom, bad, tooth, hurt, day, jaw, mouth, week, back(5) Chipped tooth/tooth break tooth, chip, break, feel, today, pull, give, front, fix, toothache
Table 2: Topic distribution by user characteristics.
Variable Dental pain Dental service Tooth decay Wisdom tooth pain Chipped tooth/cavity /gum bleeding /jaw hurt /tooth break
(1) (2) (3) (4) (5)
Total 16.23% 23.86% 14.24% 26.70% 18.97%Urban 16.01% 24.68% 13.77% 26.66% 18.88%Suburban 17.00% 24.23% 16.37% 24.50% 17.90%Rural 16.67% 19.85% 14.73% 28.56% 20.19%Age ≤ 18 10.74% 24.16% 14.09% 34.90% 16.11%Age 19-29 12.83% 26.99% 11.38% 28.12% 20.67%Age 30-49 18.12% 21.30% 15.09% 27.21% 18.27%Age 50-64 23.38% 19.27% 22.68% 19.74% 14.92%Age ≥ 65 28.42% 19.06% 23.38% 14.75% 14.39%Male 16.34% 20.13% 16.73% 27.42% 19.38%Female 16.16% 26.63% 12.39% 26.17% 18.66%
the tweets to examine whether or not the tweets mentionsweet snacks/drinks or alcohol. Overall, 1.7% tweets men-tion sweets or alcohol. In particular, the tweets mention-ing sweets or alcohol account for 1.0%, 0.4%, 4.2%, 0.7%and 1.8% for the topic of Dental pain, Dental service/cavity,Tooth decay/gum bleeding, Wisdom tooth pain/jaw hurt andChipped tooth/tooth break, respectively. A higher propor-tion of tweets mentioning sweets or alcohol is observed inTooth decay/gum bleeding and Chipped tooth/tooth break.For each user, we assign the topic that the user tweets mostfrequently as the dominant topic. The proportions of the top-ics of users are as follows:
Topic 1 (Dental pain) accounts for 16.23% of all Twitterusers. In these tweets, people often mention pains caused bydental diseases or infections. An example tweet is:I’ve been dealing with severe dental
pain for the past like 10 years. I canhandle it but it suuuucks. Compoundedthat I just had another molar yankedout on Monday morning.
Topic 2 (Dental service/cavity) represents 23.86% of allTwitter users in our study, where people mainly share theirexperience with dentists to fix their dental problems and/ortalk about specific oral disease like cavity. An example tweetis:Shout out to Smile Studio in Zachary.
I hate going to the dentist, and Iam super-sensitive to pain. 44 yearswithout a cavity and I had to have an
Figure 3: Word cloud of the five topics extracted by LDAmodel.
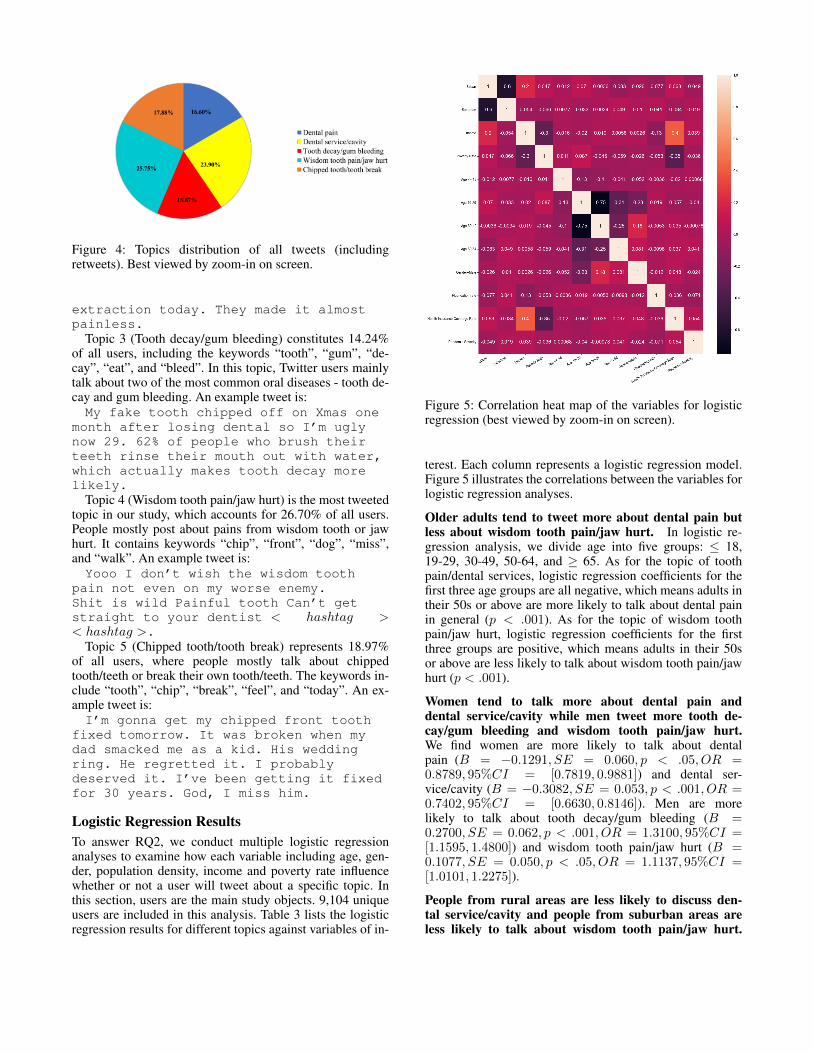
Figure 4: Topics distribution of all tweets (includingretweets). Best viewed by zoom-in on screen.
extraction today. They made it almostpainless.
Topic 3 (Tooth decay/gum bleeding) constitutes 14.24%of all users, including the keywords “tooth”, “gum”, “de-cay”, “eat”, and “bleed”. In this topic, Twitter users mainlytalk about two of the most common oral diseases - tooth de-cay and gum bleeding. An example tweet is:My fake tooth chipped off on Xmas one
month after losing dental so I’m uglynow 29. 62% of people who brush theirteeth rinse their mouth out with water,which actually makes tooth decay morelikely.
Topic 4 (Wisdom tooth pain/jaw hurt) is the most tweetedtopic in our study, which accounts for 26.70% of all users.People mostly post about pains from wisdom tooth or jawhurt. It contains keywords “chip”, “front”, “dog”, “miss”,and “walk”. An example tweet is:Yooo I don’t wish the wisdom tooth
pain not even on my worse enemy.Shit is wild Painful tooth Can’t getstraight to your dentist < hashtag >< hashtag >.
Topic 5 (Chipped tooth/tooth break) represents 18.97%of all users, where people mostly talk about chippedtooth/teeth or break their own tooth/teeth. The keywords in-clude “tooth”, “chip”, “break”, “feel”, and “today”. An ex-ample tweet is:I’m gonna get my chipped front tooth
fixed tomorrow. It was broken when mydad smacked me as a kid. His weddingring. He regretted it. I probablydeserved it. I’ve been getting it fixedfor 30 years. God, I miss him.
Logistic Regression ResultsTo answer RQ2, we conduct multiple logistic regressionanalyses to examine how each variable including age, gen-der, population density, income and poverty rate influencewhether or not a user will tweet about a specific topic. Inthis section, users are the main study objects. 9,104 uniqueusers are included in this analysis. Table 3 lists the logisticregression results for different topics against variables of in-
Figure 5: Correlation heat map of the variables for logisticregression (best viewed by zoom-in on screen).
terest. Each column represents a logistic regression model.Figure 5 illustrates the correlations between the variables forlogistic regression analyses.
Older adults tend to tweet more about dental pain butless about wisdom tooth pain/jaw hurt. In logistic re-gression analysis, we divide age into five groups: ≤ 18,19-29, 30-49, 50-64, and ≥ 65. As for the topic of toothpain/dental services, logistic regression coefficients for thefirst three age groups are all negative, which means adults intheir 50s or above are more likely to talk about dental painin general (p < .001). As for the topic of wisdom toothpain/jaw hurt, logistic regression coefficients for the firstthree groups are positive, which means adults in their 50sor above are less likely to talk about wisdom tooth pain/jawhurt (p < .001).
Women tend to talk more about dental pain anddental service/cavity while men tweet more tooth de-cay/gum bleeding and wisdom tooth pain/jaw hurt.We find women are more likely to talk about dentalpain (B = −0.1291, SE = 0.060, p < .05, OR =0.8789, 95%CI = [0.7819, 0.9881]) and dental ser-vice/cavity (B = −0.3082, SE = 0.053, p < .001, OR =0.7402, 95%CI = [0.6630, 0.8146]). Men are morelikely to talk about tooth decay/gum bleeding (B =0.2700, SE = 0.062, p < .001, OR = 1.3100, 95%CI =[1.1595, 1.4800]) and wisdom tooth pain/jaw hurt (B =0.1077, SE = 0.050, p < .05, OR = 1.1137, 95%CI =[1.0101, 1.2275]).
People from rural areas are less likely to discuss den-tal service/cavity and people from suburban areas areless likely to talk about wisdom tooth pain/jaw hurt.
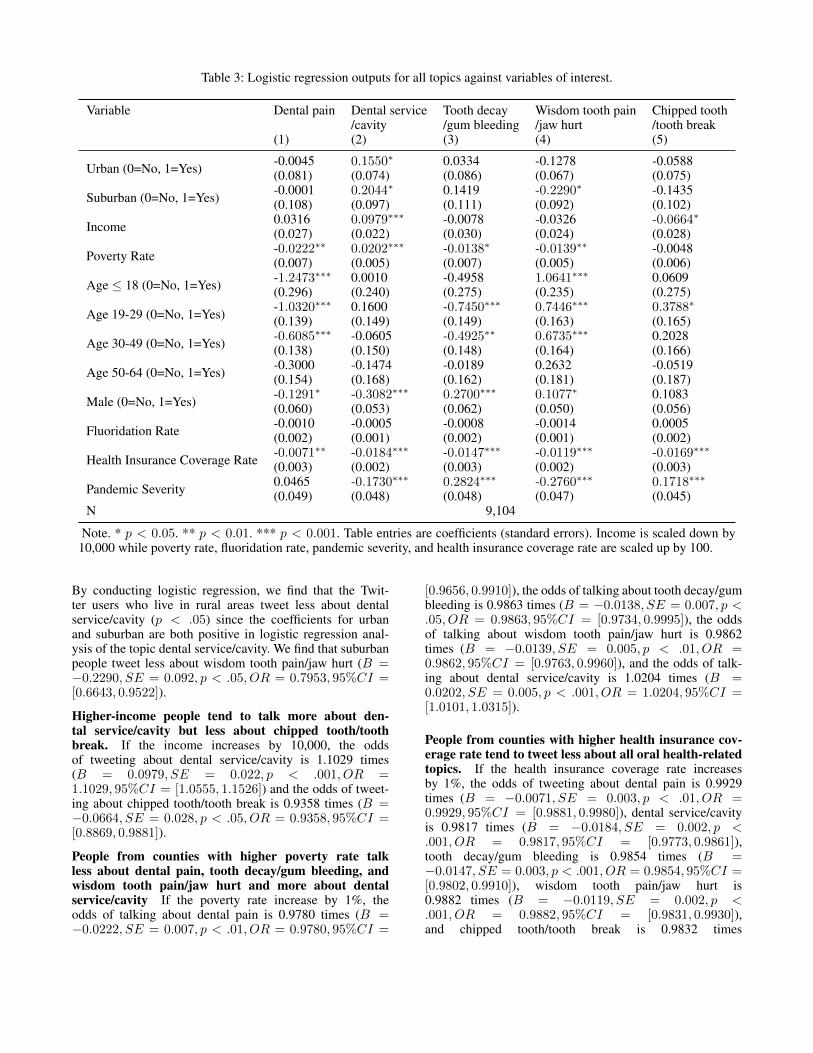
Table 3: Logistic regression outputs for all topics against variables of interest.
Variable Dental pain Dental service Tooth decay Wisdom tooth pain Chipped tooth/cavity /gum bleeding /jaw hurt /tooth break
(1) (2) (3) (4) (5)
Urban (0=No, 1=Yes) -0.0045(0.081)
0.1550∗
(0.074)0.0334(0.086)
-0.1278(0.067)
-0.0588(0.075)
Suburban (0=No, 1=Yes) -0.0001(0.108)
0.2044∗
(0.097)0.1419(0.111)
-0.2290∗(0.092)
-0.1435(0.102)
Income 0.0316(0.027)
0.0979∗∗∗
(0.022)-0.0078(0.030)
-0.0326(0.024)
-0.0664∗(0.028)
Poverty Rate -0.0222∗∗(0.007)
0.0202∗∗∗
(0.005)-0.0138∗(0.007)
-0.0139∗∗(0.005)
-0.0048(0.006)
Age ≤ 18 (0=No, 1=Yes) -1.2473∗∗∗(0.296)
0.0010(0.240)
-0.4958(0.275)
1.0641∗∗∗
(0.235)0.0609(0.275)
Age 19-29 (0=No, 1=Yes) -1.0320∗∗∗(0.139)
0.1600(0.149)
-0.7450∗∗∗(0.149)
0.7446∗∗∗
(0.163)0.3788∗
(0.165)
Age 30-49 (0=No, 1=Yes) -0.6085∗∗∗(0.138)
-0.0605(0.150)
-0.4925∗∗(0.148)
0.6735∗∗∗
(0.164)0.2028(0.166)
Age 50-64 (0=No, 1=Yes) -0.3000(0.154)
-0.1474(0.168)
-0.0189(0.162)
0.2632(0.181)
-0.0519(0.187)
Male (0=No, 1=Yes) -0.1291∗(0.060)
-0.3082∗∗∗(0.053)
0.2700∗∗∗
(0.062)0.1077∗
(0.050)0.1083(0.056)
Fluoridation Rate -0.0010(0.002)
-0.0005(0.001)
-0.0008(0.002)
-0.0014(0.001)
0.0005(0.002)
Health Insurance Coverage Rate -0.0071∗∗(0.003)
-0.0184∗∗∗(0.002)
-0.0147∗∗∗(0.003)
-0.0119∗∗∗(0.002)
-0.0169∗∗∗(0.003)
Pandemic Severity 0.0465(0.049)
-0.1730∗∗∗(0.048)
0.2824∗∗∗
(0.048)-0.2760∗∗∗(0.047)
0.1718∗∗∗
(0.045)N 9,104
Note. * p < 0.05. ** p < 0.01. *** p < 0.001. Table entries are coefficients (standard errors). Income is scaled down by10,000 while poverty rate, fluoridation rate, pandemic severity, and health insurance coverage rate are scaled up by 100.
By conducting logistic regression, we find that the Twit-ter users who live in rural areas tweet less about dentalservice/cavity (p < .05) since the coefficients for urbanand suburban are both positive in logistic regression anal-ysis of the topic dental service/cavity. We find that suburbanpeople tweet less about wisdom tooth pain/jaw hurt (B =−0.2290, SE = 0.092, p < .05, OR = 0.7953, 95%CI =[0.6643, 0.9522]).
Higher-income people tend to talk more about den-tal service/cavity but less about chipped tooth/toothbreak. If the income increases by 10,000, the oddsof tweeting about dental service/cavity is 1.1029 times(B = 0.0979, SE = 0.022, p < .001, OR =1.1029, 95%CI = [1.0555, 1.1526]) and the odds of tweet-ing about chipped tooth/tooth break is 0.9358 times (B =−0.0664, SE = 0.028, p < .05, OR = 0.9358, 95%CI =[0.8869, 0.9881]).
People from counties with higher poverty rate talkless about dental pain, tooth decay/gum bleeding, andwisdom tooth pain/jaw hurt and more about dentalservice/cavity If the poverty rate increase by 1%, theodds of talking about dental pain is 0.9780 times (B =−0.0222, SE = 0.007, p < .01, OR = 0.9780, 95%CI =
[0.9656, 0.9910]), the odds of talking about tooth decay/gumbleeding is 0.9863 times (B = −0.0138, SE = 0.007, p <.05, OR = 0.9863, 95%CI = [0.9734, 0.9995]), the oddsof talking about wisdom tooth pain/jaw hurt is 0.9862times (B = −0.0139, SE = 0.005, p < .01, OR =0.9862, 95%CI = [0.9763, 0.9960]), and the odds of talk-ing about dental service/cavity is 1.0204 times (B =0.0202, SE = 0.005, p < .001, OR = 1.0204, 95%CI =[1.0101, 1.0315]).
People from counties with higher health insurance cov-erage rate tend to tweet less about all oral health-relatedtopics. If the health insurance coverage rate increasesby 1%, the odds of tweeting about dental pain is 0.9929times (B = −0.0071, SE = 0.003, p < .01, OR =0.9929, 95%CI = [0.9881, 0.9980]), dental service/cavityis 0.9817 times (B = −0.0184, SE = 0.002, p <.001, OR = 0.9817, 95%CI = [0.9773, 0.9861]),tooth decay/gum bleeding is 0.9854 times (B =−0.0147, SE = 0.003, p < .001, OR = 0.9854, 95%CI =[0.9802, 0.9910]), wisdom tooth pain/jaw hurt is0.9882 times (B = −0.0119, SE = 0.002, p <.001, OR = 0.9882, 95%CI = [0.9831, 0.9930]),and chipped tooth/tooth break is 0.9832 times
(B = −0.0169, SE = 0.003, p < .001, OR =0.9832, 95%CI = [0.9782, 0.9881]).
People from counties at a higher risk of COVID-19 talk less about dental service/cavity, wisdom toothpain/jaw hurt and more about tooth decay/gum bleed-ing and chipped tooth/tooth break. If the 7-day av-erage relative change of the number of daily COVID-19 confirmed cases grows by 1%, the odds of tweet-ing about dental service/cavity is 0.8411 times (B =−0.1730, SE = 0.048, p < .001, OR = 0.8411, 95%CI =[0.7657, 0.9240]), wisdom tooth pain/jaw hurt is 0.7588times (B = −0.2760, SE = 0.047, p < .001, OR =0.7588, 95%CI = [0.6921, 0.8319]), tooth decay/gumbleeding is 1.3263 times (B = 0.2824, SE = 0.048, p <.001, OR = 1.3263, 95%CI = [1.2080, 1.4564]),and chipped tooth/tooth break is 1.1874 times (B =0.1718, SE = 0.045, p < .001, OR = 1.1874, 95%CI =[1.0876, 1.2969]).
Discussions and ConclusionsWe have analyzed 10,883 tweets from 9,104 Twitter usersacross 26 states (with sufficient samples) during the periodof November 12, 2020 to June 14, 2021. Among the Twitterusers in our study, 26.70% talk about wisdom tooth pain/jawhurt, 23.86% tweet about dental service/cavity, 18.97% dis-cuss chipped tooth/tooth break, 16.23% talk about dentalpain, and 14.24% talk about tooth decay/gum bleeding.
Overall, women are more likely to discuss oral healthamid the COVID-19 pandemic. On one hand, this might bebecause men are more likely to ignore their dental healthand visit dentists less frequently for disease prevention (Lip-sky et al. 2021). On the other hand, studies (Doerr et al.1998; Stouthard, Mellenbergh, and Hoogstraten 1993) showthat women are more dentally anxious, which might lead tophysiological, cognitive, behavioural, health, and social is-sues (Cohen, Fiske, and Newton 2000). COVID-19 has alsochanged people’s work patterns as many companies encour-age or require employees to work from home to prevent thespread of virus,19 which was found to influence people’s oralhealth by increasing the consumption of products that aredetrimental to oral health such as snacks and alcohol and in-creasing the consumption of oral health products.20 Anotherpotential reason that women tend to talk about oral healthamid the COVID-19 pandemic is that they are more likelyto reduce work hours and spend more time on oral healthsince they can stay home longer (Collins et al. 2020; Xionget al. 2021). With respect to age, younger adults (19-29) tendto tweet more often about oral health problems. This echoesthe finding that younger adults experience a higher preva-lence of dental fear and anxiety (DFA), high DFA, and se-vere DFA (Silveira et al. 2021).
19https://www.gartner.com/en/newsroom/press-releases/2020-03-19-gartner-hr-survey-reveals-88--of-organizations-have-e[Accessed March 25, 2021]
20https://bridgedental.com/2020/04/26/the-impact-of-working-from-home-during-the-coronavirus-lockdown-on-dental-health/[Accessed September 15, 2021]
We observe that the topics of interest vary across usercharacteristics including age, gender, population density,income, poverty rate, and health insurance coverage rate.Older adults, who are identified as the highest risk group forfatal COVID-19 clinical outcomes (Marchini and Ettinger2020; Sharma 2021) are more likely to talk about dentalpain (p < .001) and less likely to tweet about wisdom toothpain/jaw hurt. It is noteworthy that due to the pandemic,older adults are facing lack of access to the oral healthcare (Wall, Vujicic, and Nasseh 2012). Women tend to fo-cus more on dental pain (p < .05) and dental service/cavity(p < .001) while men are more interested in discussing toothdecay/gum bleeding (p < .001) and wisdom tooth pain/jawhurt (p < .05). Studies (Furuta et al. 2011; Heft et al. 2007)show that women are almost twice as likely to have receiveda regular dental check-up and are more likely to reportgeneral fear of dental pain compared to men. People fromrural areas are less likely to discuss dental service/cavity(p < .05) which is possibly due to the lack of access todental care. People living in rural America have about 8%(children) to 10% (adults aged 18–64) less access to dentalservices compared with their urban counterparts in 2017.21
Suburban people talk less about wisdom tooth pain/jaw hurt(p < .05). Higher-income people talk more about dental ser-vice/cavity (p < .001) but less about chipped tooth/toothbreak (p < .05). High cost is the most significant reasonfor people not visiting dentists in the US. 22 Higher-incomepeople may care less about the high cost and have more fre-quent dental services which suggests the disparities in oralhealth. People from counties with a higher poverty rate talkless about dental pain (p < .01), tooth decay/gum bleeding(p < .05), and wisdom tooth pain/jaw hurt (p < .01). Al-though Kim et al. (2017) suggests that Community WaterFluoridation is associated with lowering the risks of havingcertain oral diseases like dental caries, our study has shownthat state-level fluoridation rate is not associated with theprediction of any oral health-related topics. This may be dueto the limitation of not having publicly available more gran-ular fluoridation rate data. Health insurance coverage rateis the most important predictor for the logistic regressionfor topic prediction. People from counties with a higher in-surance coverage rate tend to tweet less about all topics oforal health (p < .01) which is consistent with the findingsof Zivkovic et al. (2020) that health or more specificallydental insurance plays an important role in improving peo-ple’s oral health conditions. With respect to the pandemicseverity, people from counties at a higher risk of COVID-19talk less about dental service/cavity (p < .001) and wisdomtooth pain/jaw hurt (p < .001) but more about tooth de-cay/gum bleeding (p < .001) and chipped tooth/tooth break(p < .001). On one hand, it is likely that people delay oravoid dental visits because of closure and reduced hours ofdental care and the fear of being infected with the virus dur-
21https://www.cdc.gov/nchs/data/hus/2018/037.pdf [AccessedSeptember 12, 2021]
22https://www.ada.org/~/media/ADA/Science%20and%20Research/HPI/OralHealthWell-Being-StateFacts/US-Oral-Health-Well-Being.pdf [Accessed September 12, 2021]
ing their dental appointments (Brian and Weintraub 2020;WongLaura et al. 2020). On the other hand, COVID-19 hasan negative effect on oral health possibly resulting from xe-rostomia, loss of taste or smell sensation, and mental healthbreakdown (Farook et al. 2020).
This is the first large-scale social media-based study tounderstand the public discussions on oral health during theCOVID-19 pandemic in the US. We hope our work can pro-mote research on public health issues through the lens ofsocial media, provide insights for oral health practitionersand policy makers, enhance the public awareness of the im-portance of oral health, and ultimately improve oral healthin America amid the COVID-19 pandemic. There are somelimitations of our study. Some states with a smaller sam-ple size are not included in the study population. Tempo-ral changes have not been investigated. Future work can bedirected to analyzing oral health-related discussions acrossmultiple social media platforms to achieve broader and morecomprehensive perspectives.
ReferencesAssociation, A. D.; et al. 2020. HPI poll examines impact ofCOVID-19 on dental practices.Blei, D. M.; Ng, A. Y.; and Jordan, M. I. 2003. Latent dirich-let allocation. Journal of Machine Learning Research 3:993–1022.Bonnevie, E.; Gallegos-Jeffrey, A.; Goldbarg, J.; Byrd, B.;and Smyser, J. 2021. Quantifying the rise of vaccine oppo-sition on Twitter during the COVID-19 pandemic. Journalof Communication in Healthcare 14(1): 12–19.Botros, N.; Iyer, P.; and Ojcius, D. M. 2020. Is there anassociation between oral health and severity of COVID-19complications? Biomedical Journal 43(4): 325–327.Brian, Z.; and Weintraub, J. A. 2020. Peer Reviewed: OralHealth and COVID-19: Increasing the Need for Preventionand Access. Preventing Chronic Disease 17.Cohen, S.; Fiske, J.; and Newton, J. 2000. The impactof dental anxiety on daily living. British Dental Journal189(7): 385–390.Collins, C.; Landivar, L. C.; Ruppanner, L.; and Scarbor-ough, W. J. 2020. COVID-19 and the gender gap in workhours. Gender, Work & Organization .Daly, J.; and Black, E. A. 2020. The impact of COVID-19on population oral health. Community Dent Health 37(4):236–238.Doerr, P. A.; Lang, W. P.; Nyquist, L. V.; and Ronis, D. L.1998. Factors associated with dental anxiety. The Journalof the American Dental Association 129(8): 1111–1119.Dong, E.; Du, H.; and Gardner, L. 2020. An interactive web-based dashboard to track COVID-19 in real time. The LancetInfectious Diseases 20(5): 533–534.Dziedzic, A.; and Wojtyczka, R. 2021. The impact of coro-navirus infectious disease 19 (COVID-19) on oral health.Oral Diseases 27: 703–706.
Estrich, C. G.; Mikkelsen, M.; Morrissey, R.; Geisinger,M. L.; Ioannidou, E.; Vujicic, M.; and Araujo, M. W.2020. Estimating COVID-19 prevalence and infection con-trol practices among US dentists. The Journal of the Ameri-can Dental Association 151(11): 815–824.Farook, F. F.; Nuzaim, M. N. M.; Ababneh, K. T.; Alsham-mari, A.; and Alkadi, L. 2020. COVID-19 pandemic: oralhealth challenges and recommendations. European Journalof Dentistry .Furuta, M.; Ekuni, D.; Irie, K.; Azuma, T.; Tomofuji, T.;Ogura, T.; and Morita, M. 2011. Sex differences in gin-givitis relate to interaction of oral health behaviors in youngpeople. Journal of Periodontology 82(4): 558–565.González-Olmo, M. J.; Ortega-Martínez, A. R.; Delgado-Ramos, B.; Romero-Maroto, M.; and Carrillo-Diaz, M.2020. Perceived vulnerability to Coronavirus infection: im-pact on dental practice. Brazilian Oral Research 34.Guntuku, S. C.; Sherman, G.; Stokes, D. C.; Agarwal, A. K.;Seltzer, E.; Merchant, R. M.; and Ungar, L. H. 2020. Track-ing mental health and symptom mentions on twitter dur-ing covid-19. Journal of General Internal Medicine 35(9):2798–2800.Heft, M. W.; Meng, X.; Bradley, M. M.; and Lang, P. J. 2007.Gender differences in reported dental fear and fear of dentalpain. Community Dentistry and Oral Epidemiology 35(6):421–428.Hollander, J. E.; and Carr, B. G. 2020. Virtually perfect?Telemedicine for COVID-19. New England Journal ofMedicine 382(18): 1679–1681.Jung, S.-G.; An, J.; Kwak, H.; Salminen, J.; and Jansen, B. J.2018. Assessing the accuracy of four popular face recog-nition tools for inferring gender, age, and race. In TwelfthInternational AAAI Conference on Web and Social Media.Kalash, D. A. 2020. How COVID-19 deepens child oralhealth inequities. Journal of the American Dental Associa-tion (1939) 151(9): 643.Kim, H.-N.; Kim, J.-H.; Kim, S.-Y.; and Kim, J.-B. 2017.Associations of community water fluoridation with cariesprevalence and oral health inequality in children. Interna-tional Journal of Environmental Research and Public Health14(6): 631.Lipsky, M. S.; Su, S.; Crespo, C. J.; and Hung, M. 2021.Men and Oral Health: A Review of Sex and GenderDifferences. American Journal of Men’s Health 15(3):15579883211016361.Lyu, H.; Chen, L.; Wang, Y.; and Luo, J. 2020. Sense andsensibility: Characterizing social media users regarding theuse of controversial terms for covid-19. IEEE Transactionson Big Data .Lyu, H.; Wang, J.; Wu, W.; Duong, V.; Zhang, X.; Dye, T. D.;and Luo, J. 2021. Social media study of public opinionson potential COVID-19 vaccines: informing dissent, dispar-ities, and dissemination. Intelligent Medicine .
Machado, R. A.; de Souza, N. L.; Oliveira, R. M.; Júnior,H. M.; and Bonan, P. R. F. 2020. Social media andtelemedicine for oral diagnosis and counselling in theCOVID-19 era. Oral Oncology 105: 104685.Marchini, L.; and Ettinger, R. L. 2020. COVID-19 pan-demics and oral health care for older adults. Special Carein Dentistry 40(3): 329.Pérez-Núñez, R.; Medina-Solis, C. E.; Maupomé, G.; andVargas-Palacios, A. 2006. Factors associated with dentalhealth care coverage in Mexico: Findings from the NationalPerformance Evaluation Survey 2002–2003. CommunityDentistry and Oral Epidemiology 34(5): 387–397.Sampson, V.; Kamona, N.; and Sampson, A. 2020. Couldthere be a link between oral hygiene and the severity ofSARS-CoV-2 infections? British Dental Journal 228(12):971–975.Sharma, A. 2021. Estimating older adult mortality fromCOVID-19. The Journals of Gerontology: Series B 76(3):e68–e74.Silveira, E. R.; Cademartori, M. G.; Schuch, H. S.; Armfield,J. A.; and Demarco, F. F. 2021. Estimated prevalence ofdental fear in adults: a systematic review and meta-analysis.Journal of Dentistry 103632.Singh, A.; Peres, M.; and Watt, R. 2019. The relationshipbetween income and oral health: a critical review. Journalof Dental Research 98(8): 853–860.Stouthard, M. E.; Mellenbergh, G. J.; and Hoogstraten, J.1993. Assessment of dental anxiety: a facet approach. Anx-iety, Stress and Coping 6(2): 89–105.Tao, Z.-Y.; Chu, G.; McGrath, C.; Hua, F.; Leung, Y. Y.;Yang, W.-F.; Su, Y.-X.; et al. 2020. Nature and diffusion ofCOVID-19–related oral health information on Chinese so-cial media: analysis of tweets on weibo. Journal of MedicalInternet Research 22(6): e19981.Valdez, D.; Ten Thij, M.; Bathina, K.; Rutter, L. A.; andBollen, J. 2020. Social media insights into US mental health
during the COVID-19 pandemic: longitudinal analysis oftwitter data. Journal of Medical Internet Research 22(12):e21418.Wall, T. P.; Vujicic, M.; and Nasseh, K. 2012. Recent trendsin the utilization of dental care in the United States. Journalof Dental Education 76(8): 1020–1027.Weintraub, J. A. 2020. Oral Health and COVID-19: Increas-ing the Need for Prevention and Access (vol 17, E93, 2020).Preventing Chronic Disease 17.Wojcik, S.; and Hughes, A. 2019. Sizing up Twitter users.Pew Research Center 24.WongLaura, E.; HawkinsJessica, E.; MurrellKaren, L.; et al.2020. Where are all the patients? Addressing Covid-19 fearto encourage sick patients to seek emergency care. NEJMCatalyst Innovations in Care Delivery .Wu, W.; Lyu, H.; and Luo, J. 2021. Characterizing Discourseabout COVID-19 Vaccines: A Reddit Version of the Pan-demic Story. arXiv preprint arXiv:2101.06321 .Xiong, Z.; Li, P.; Lyu, H.; and Luo, J. 2021. Social MediaOpinions on Working From Home in the United States Dur-ing the COVID-19 Pandemic: Observational Study. JMIRMedical Informatics 9(7): e29195.Zhang, Y.; Lyu, H.; Liu, Y.; Zhang, X.; Wang, Y.; Luo, J.;et al. 2021. Monitoring Depression Trends on Twitter Dur-ing the COVID-19 Pandemic: Observational Study. JMIRInfodemiology 1(1): e26769.Zhou, J.; Zogan, H.; Yang, S.; Jameel, S.; Xu, G.; and Chen,F. 2021. Detecting community depression dynamics due tocovid-19 pandemic in australia. IEEE Transactions on Com-putational Social Systems .Zivkovic, N.; Aldossri, M.; Gomaa, N.; Farmer, J. W.; Sing-hal, S.; Quiñonez, C.; and Ravaghi, V. 2020. Providing den-tal insurance can positively impact oral health outcomes inOntario. BMC Health Services Research 20(1): 1–9.
Top Related