Oral Health Research: A Social Disparities...
85
Oral Health Research: A Social Disparities Perspective Benjamin Chaffee Lisa Chung Stuart Gansky UCSF Center to Address Disparities in Children’s Oral Health Center on Social Disparities in Health Seminar Series November 5, 2014 UCSF Center to Address Disparities in Children’s Oral Health
Transcript of Oral Health Research: A Social Disparities...
Oral Health Research: A Social Disparities Perspective Benjamin Chaffee Lisa Chung Stuart Gansky UCSF Center to Address Disparities in Children’s Oral Health Center on Social Disparities in Health Seminar Series November 5, 2014
UCSF Center to Address Disparities in Children’s Oral Health
2
Oral Health & Oral Health Disparities: A Global Overview
3
Oral Health & Oral Health Disparities
Oral Health is Health Medicine and Dentistry have professional boundaries The biological and social determinants of what makes us healthy or sick affect the entire body
4
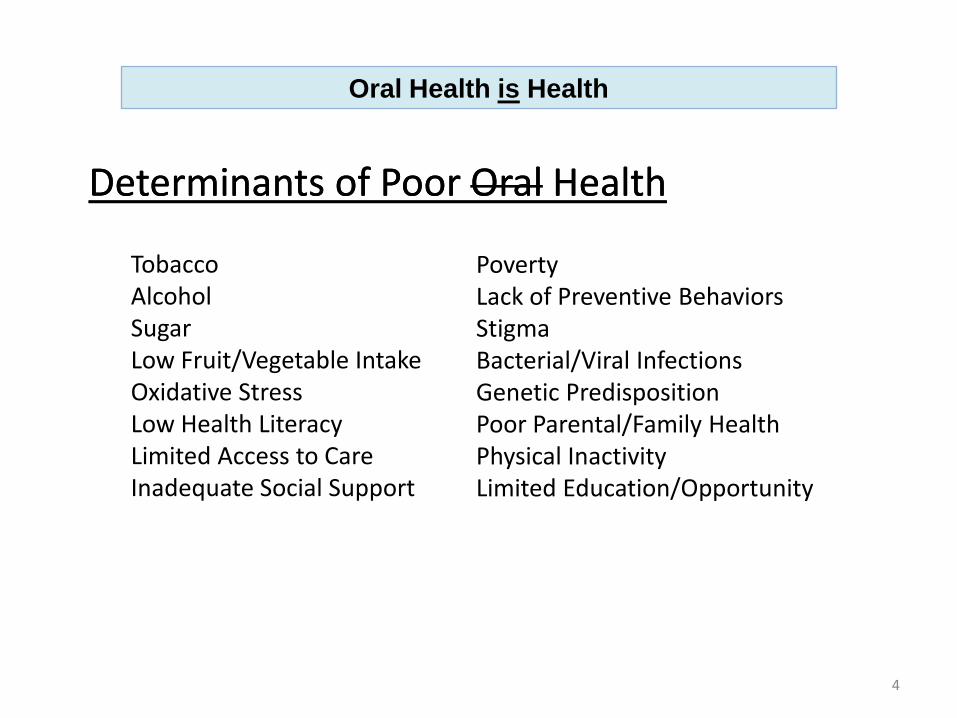
Determinants of Poor Oral Health
Oral Health is Health
Tobacco Alcohol Sugar Low Fruit/Vegetable Intake Oxidative Stress Low Health Literacy Limited Access to Care Inadequate Social Support
Poverty Lack of Preventive Behaviors Stigma Bacterial/Viral Infections Genetic Predisposition Poor Parental/Family Health Physical Inactivity Limited Education/Opportunity
Determinants of Poor Oral Health
5
Oral Health: More Than Cavities
Periodontal disease Tooth loss Oral cancer Noma (cancrum oris) Oral infections Salivary dysfunction Caries: children and adults

6
Oral Health is Health
Poor general health can be reflected in the oral cavity:
Diabetes is major contributor to periodontal disease
HIV/AIDS can lead to oral infections/complications
Image credit: Dr Augustin Zerón (left); public domain files from Wikimedia Commons
7
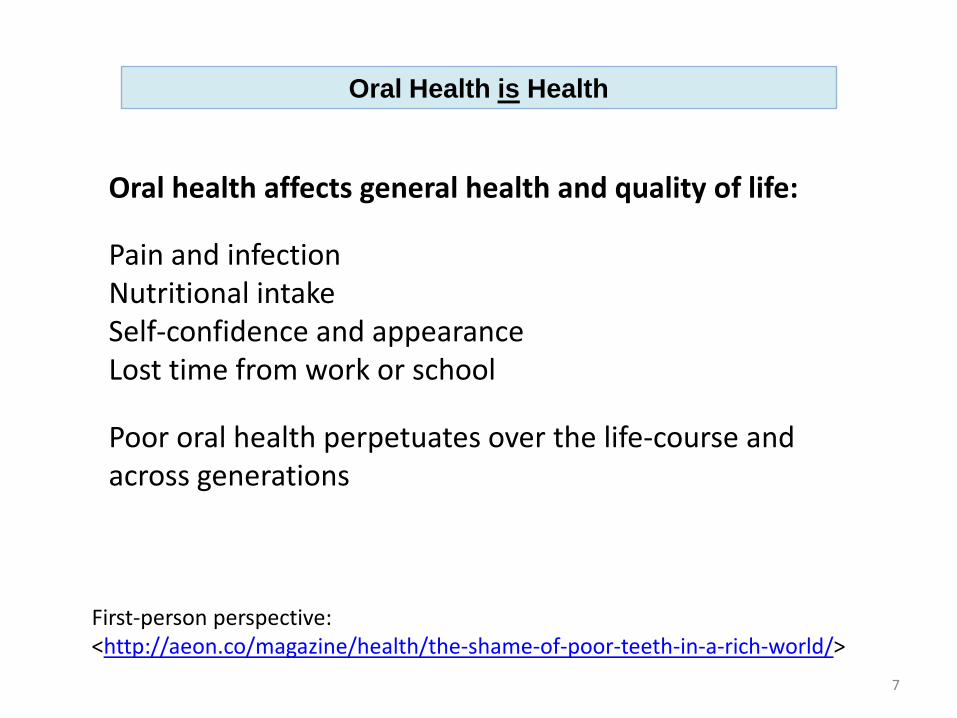
Oral Health is Health
Oral health affects general health and quality of life: Pain and infection Nutritional intake Self-confidence and appearance Lost time from work or school
First-person perspective: <http://aeon.co/magazine/health/the-shame-of-poor-teeth-in-a-rich-world/>
Poor oral health perpetuates over the life-course and across generations
8
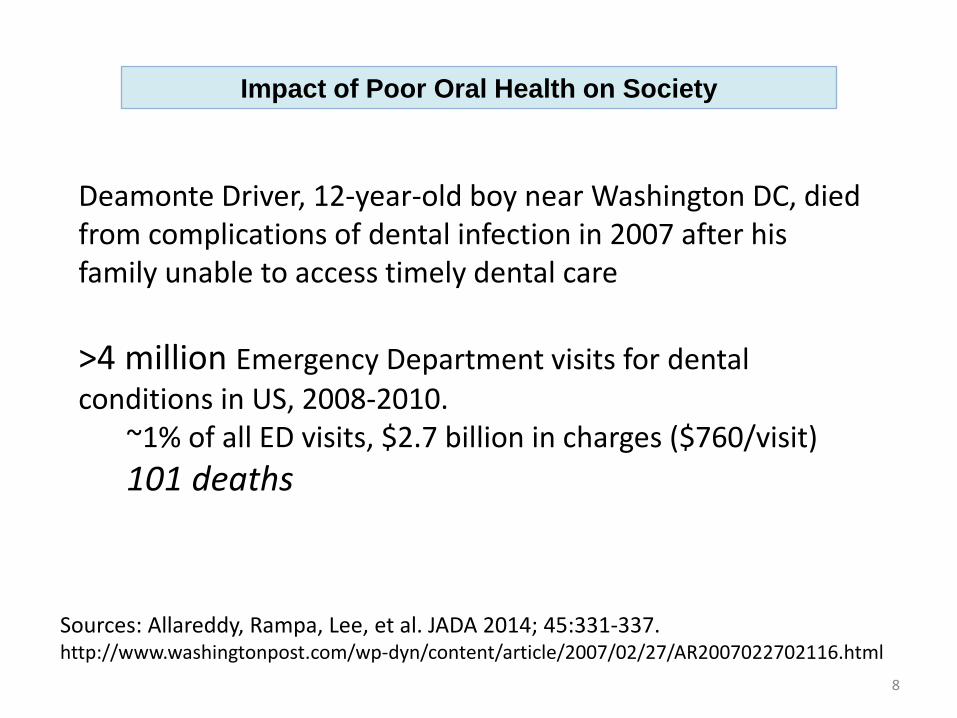
Impact of Poor Oral Health on Society
>4 million Emergency Department visits for dental conditions in US, 2008-2010. ~1% of all ED visits, $2.7 billion in charges ($760/visit) 101 deaths
Sources: Allareddy, Rampa, Lee, et al. JADA 2014; 45:331-337. http://www.washingtonpost.com/wp-dyn/content/article/2007/02/27/AR2007022702116.html
Deamonte Driver, 12-year-old boy near Washington DC, died from complications of dental infection in 2007 after his family unable to access timely dental care
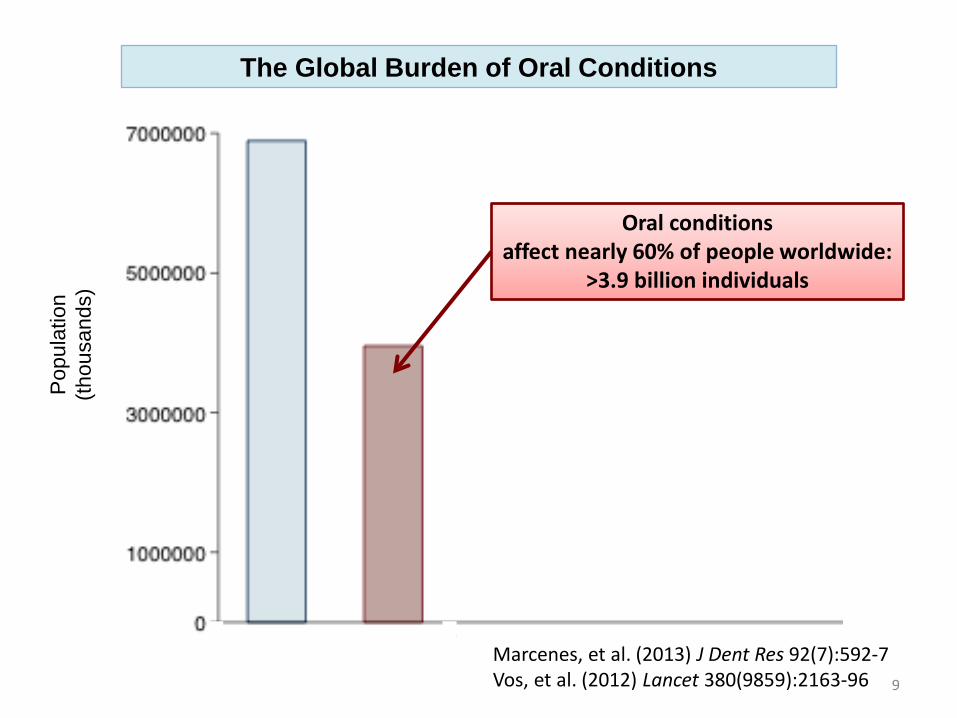
Oral conditions affect nearly 60% of people worldwide:
>3.9 billion individuals
Marcenes, et al. (2013) J Dent Res 92(7):592-7 Vos, et al. (2012) Lancet 380(9859):2163-96
Pop
ulat
ion
(thou
sand
s)
9
The Global Burden of Oral Conditions
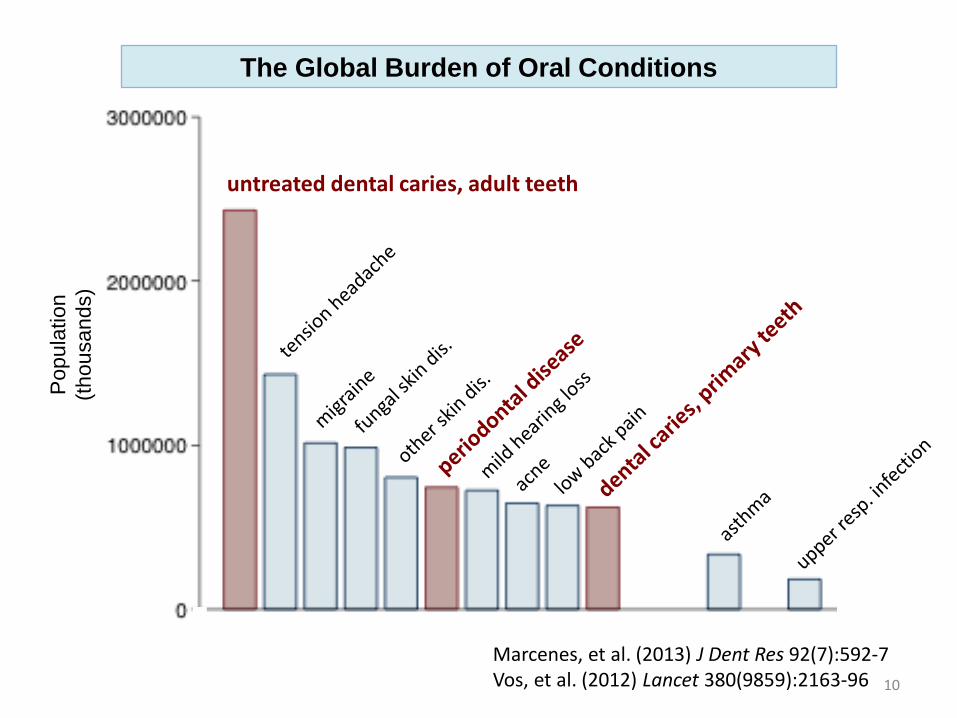
Marcenes, et al. (2013) J Dent Res 92(7):592-7 Vos, et al. (2012) Lancet 380(9859):2163-96
Pop
ulat
ion
(thou
sand
s)
untreated dental caries, adult teeth
10
The Global Burden of Oral Conditions
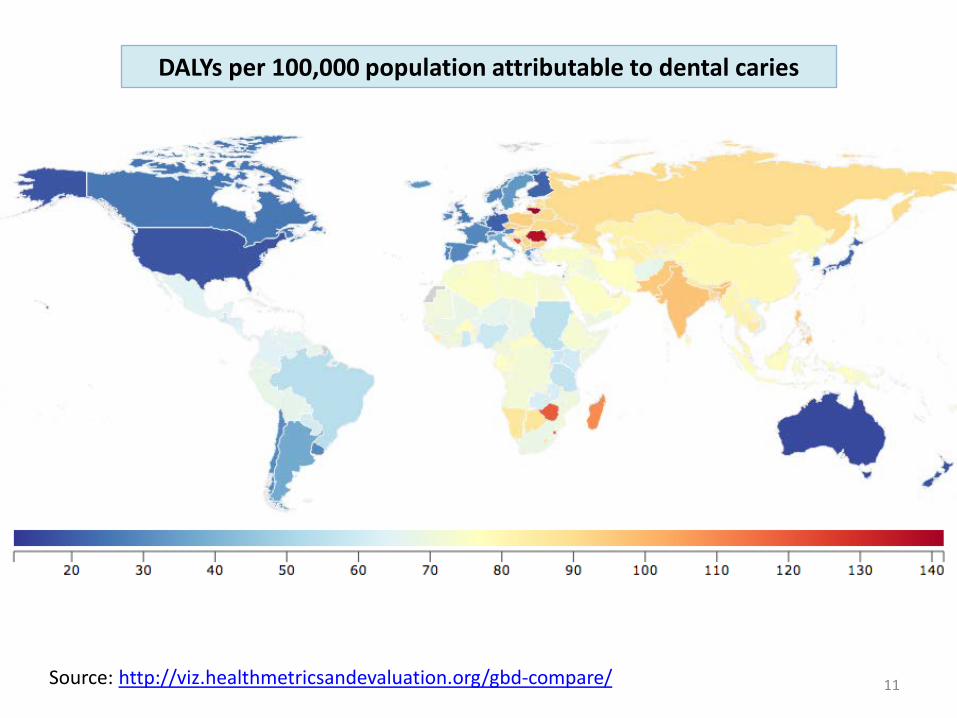
11 Source: http://viz.healthmetricsandevaluation.org/gbd-compare/
DALYs per 100,000 population attributable to dental caries
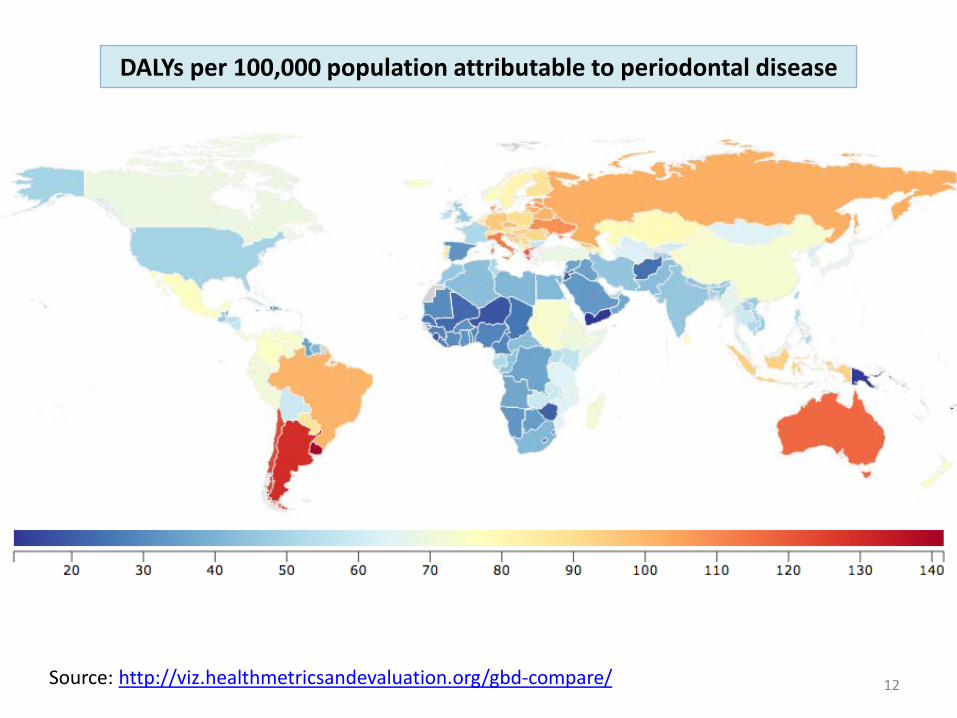
12 Source: http://viz.healthmetricsandevaluation.org/gbd-compare/
DALYs per 100,000 population attributable to periodontal disease
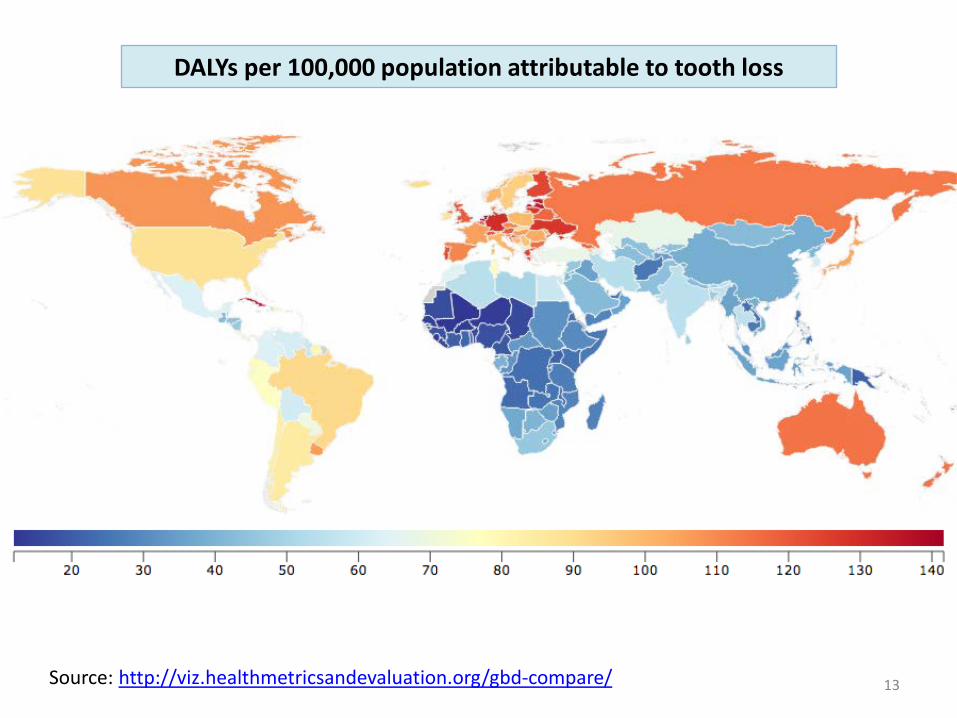
13 Source: http://viz.healthmetricsandevaluation.org/gbd-compare/
DALYs per 100,000 population attributable to tooth loss
14
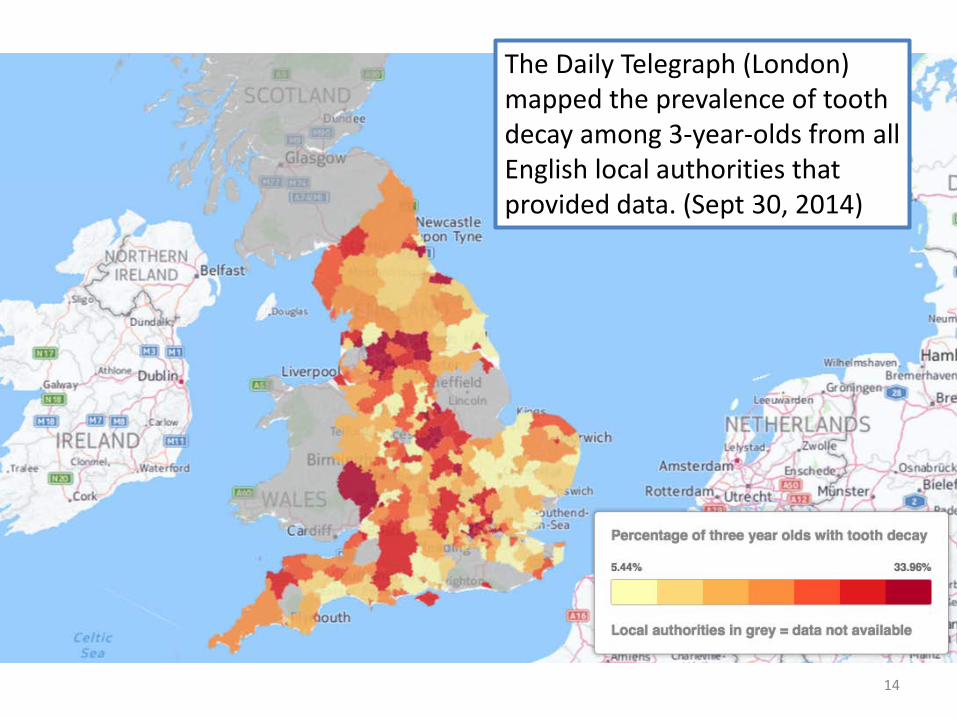
The Daily Telegraph (London) mapped the prevalence of tooth decay among 3-year-olds from all English local authorities that provided data. (Sept 30, 2014)
15
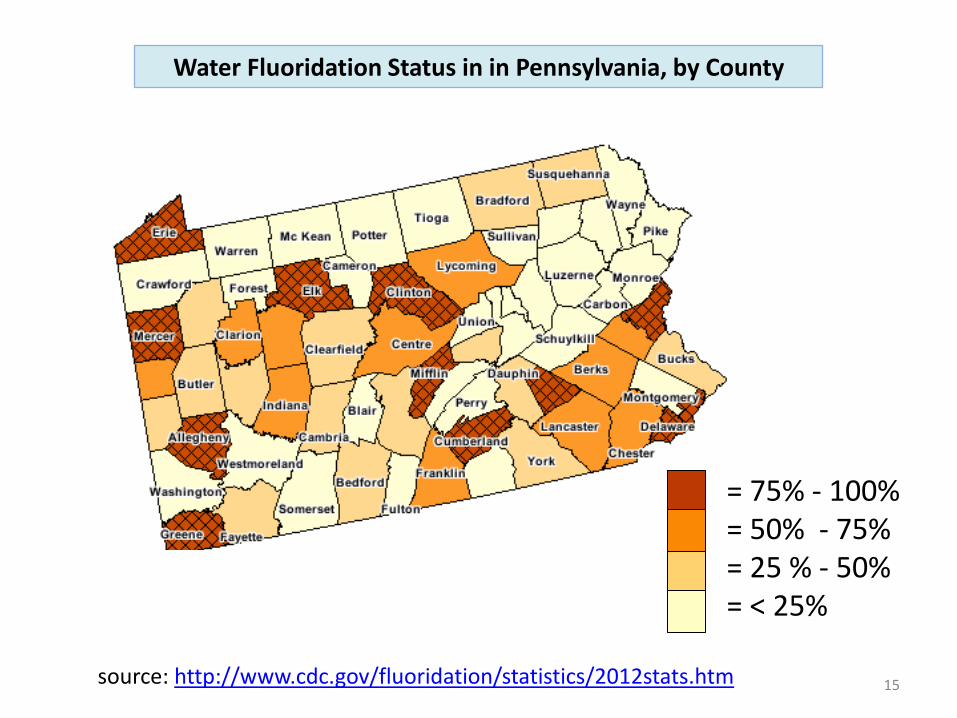
= 75% - 100% = 50% - 75% = 25 % - 50% = < 25%
source: http://www.cdc.gov/fluoridation/statistics/2012stats.htm
Water Fluoridation Status in in Pennsylvania, by County
16
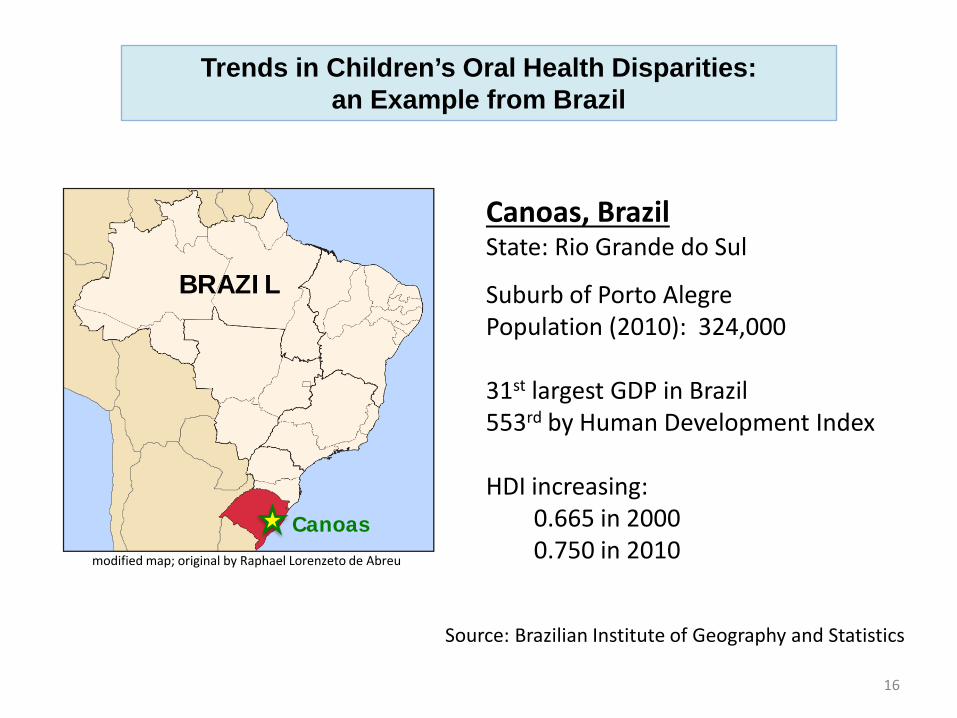
Trends in Children’s Oral Health Disparities: an Example from Brazil
modified map; original by Raphael Lorenzeto de Abreu
Canoas
BRAZIL
Canoas, Brazil State: Rio Grande do Sul
Suburb of Porto Alegre Population (2010): 324,000 31st largest GDP in Brazil 553rd by Human Development Index HDI increasing: 0.665 in 2000 0.750 in 2010
Source: Brazilian Institute of Geography and Statistics
17
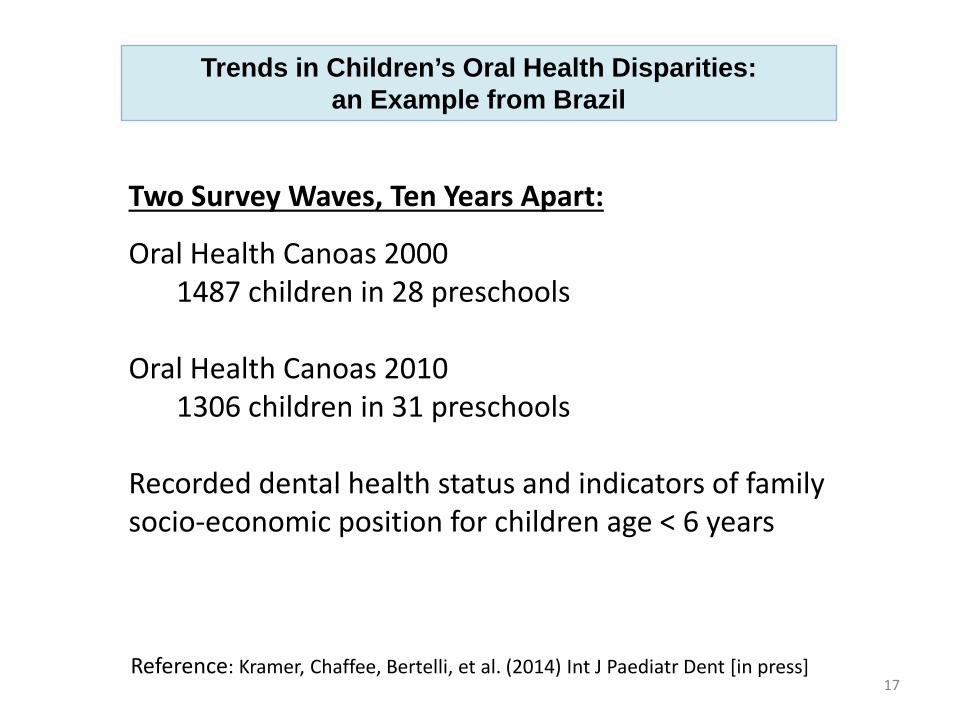
Trends in Children’s Oral Health Disparities: an Example from Brazil
Reference: Kramer, Chaffee, Bertelli, et al. (2014) Int J Paediatr Dent [in press]
Two Survey Waves, Ten Years Apart:
Oral Health Canoas 2000 1487 children in 28 preschools Oral Health Canoas 2010 1306 children in 31 preschools Recorded dental health status and indicators of family socio-economic position for children age < 6 years
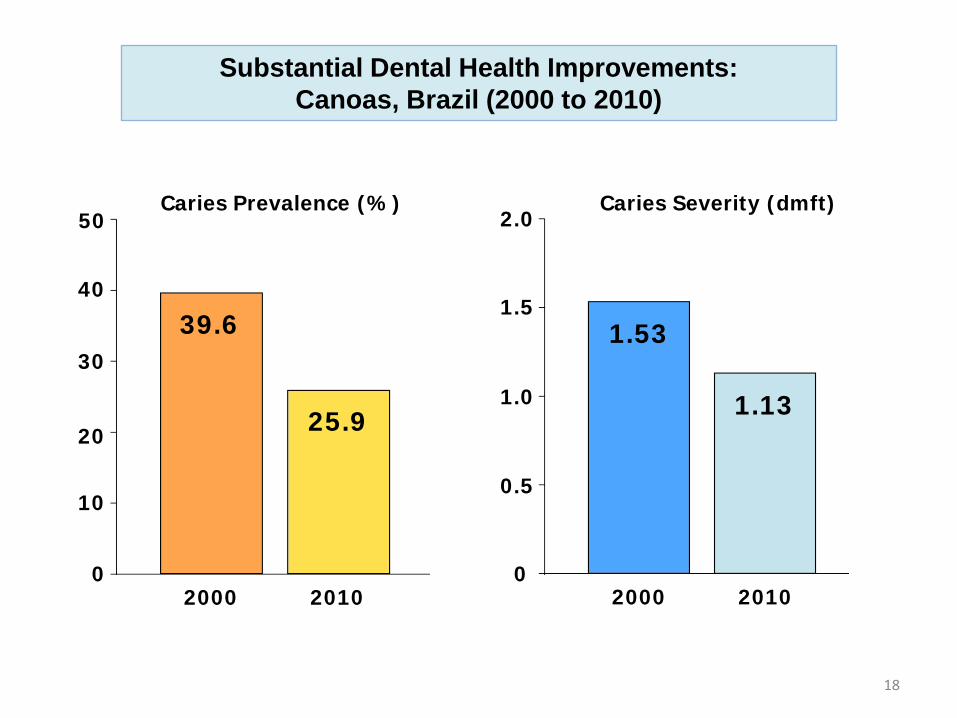
2000 2010 2000 2010 0
10
20
30
40
50 Caries Prevalence (%)
39.6 1.53
0
0.5
1.0
1.5
2.0 Caries Severity (dmft)
25.9 1.13
Substantial Dental Health Improvements: Canoas, Brazil (2000 to 2010)
18
19
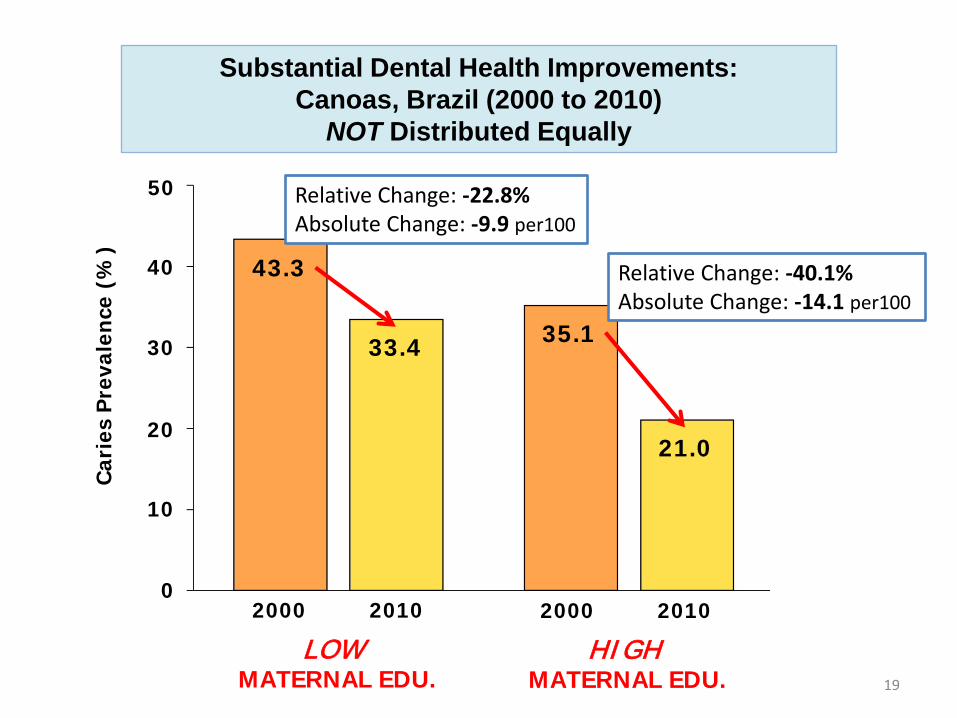
Substantial Dental Health Improvements: Canoas, Brazil (2000 to 2010)
NOT Distributed Equally
LOW MATERNAL EDU.
HIGH MATERNAL EDU.
0
10
20
30
40
50
Car
ies
Pre
vale
nce
(%)
2000 2010 2000 2010
43.3
33.4 35.1
21.0
Relative Change: -22.8% Absolute Change: -9.9 per100
Relative Change: -40.1% Absolute Change: -14.1 per100
0
0.5
1.0
1.5
2.0
Car
ies
Seve
rity
(dm
ft)
1st (lowest) 2nd 3rd 4th 5th (highest) HOUSEHOLD INCOME QUINTILE
20
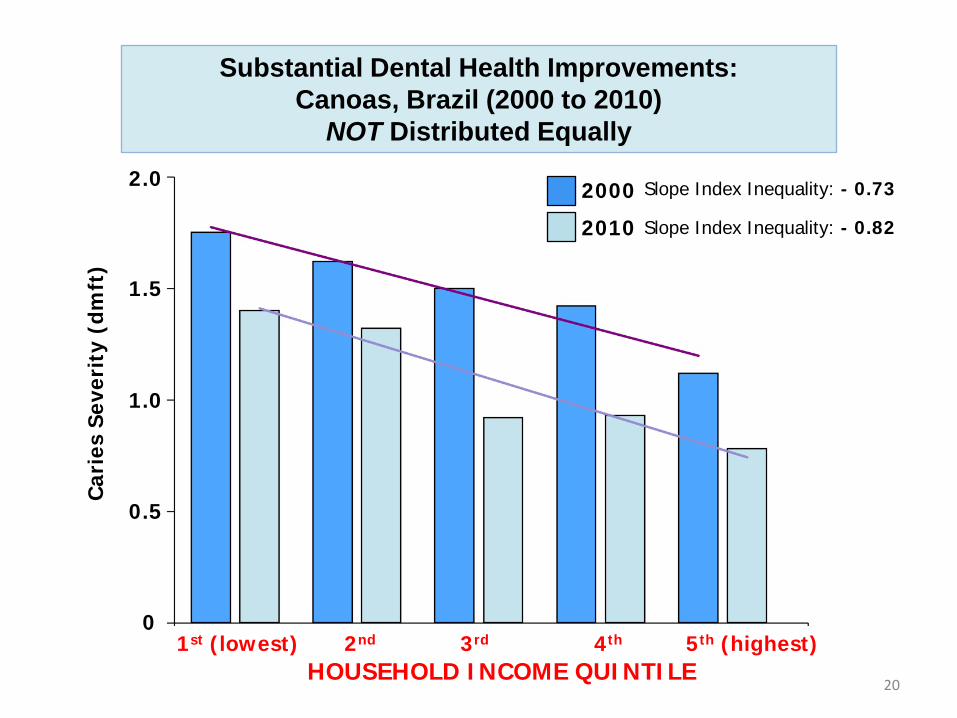
Substantial Dental Health Improvements: Canoas, Brazil (2000 to 2010)
NOT Distributed Equally
2000
2010
Slope Index Inequality: - 0.73
Slope Index Inequality: - 0.82
21
Trends in Children’s Oral Health Disparities: an Example from Brazil
Brazilian primary health care system reorganized in 1990s and significantly expanded in 2000s “Oral health teams” were incorporated into public health centers, with emphasis on service utilization (Navarro, 2012) Major expansion in number of dentists; >100 new dental schools opened 1995-2008 (Saliba, 2009) Striking inequalities in access/utilization of dental services and in perceived treatment needs (Peres, 2013)
Reducing Oral Health Disparities CAN DO Multidisciplinary Research
UCSF Center to Address Disparities in Oral Health
Support: US DHHS NIH/NIDCR U54 DE 014251, R03 DE 018116, R21 DE 018650, R21 DE 019210, U54 DE 019285, P30 DE 020752
CreativeCommons.org attribution, non-commercial, cite alike
23
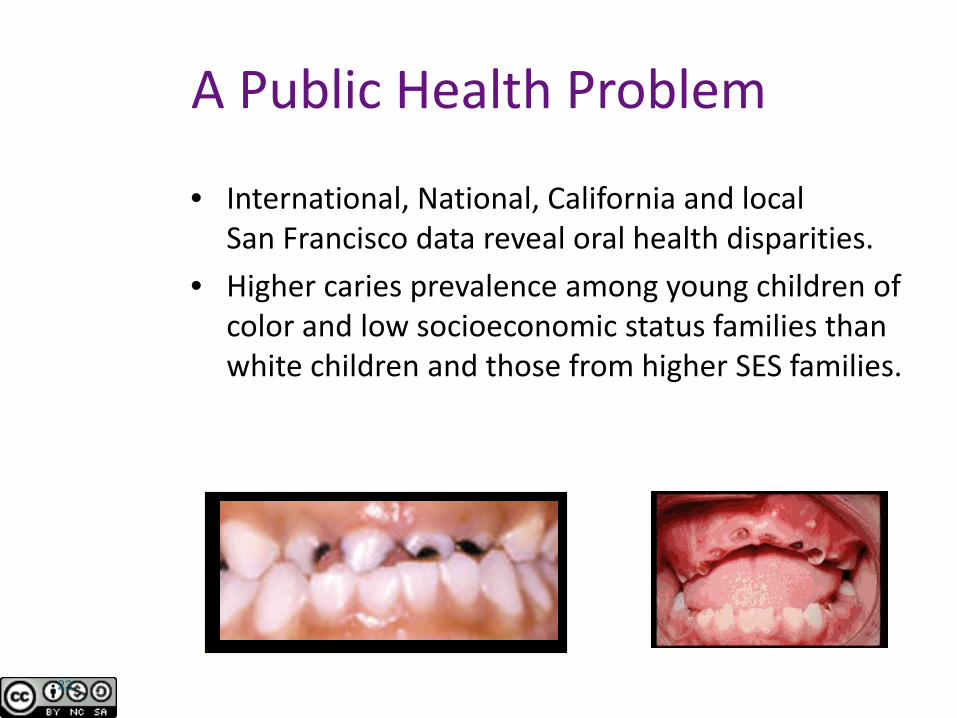
A Public Health Problem
• International, National, California and local San Francisco data reveal oral health disparities.
• Higher caries prevalence among young children of color and low socioeconomic status families than white children and those from higher SES families.
24
• To reduce oral health disparities among children and their caregivers through research, training, and dissemination with community partners
• Focus: preventing and reducing
early childhood caries
CAN DO Mission
.
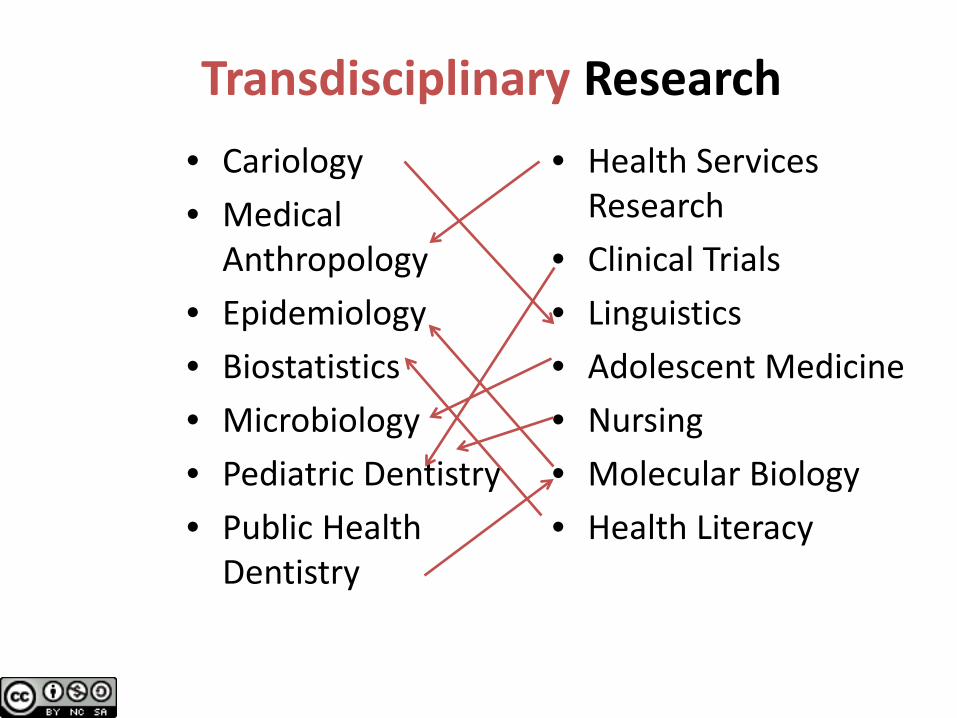
Interdisciplinary Research
• Cariology • Medical
Anthropology • Epidemiology • Biostatistics • Microbiology • Pediatric Dentistry • Public Health
Dentistry
• Health Services Research
• Clinical Trials • Linguistics • Adolescent Medicine • Nursing • Molecular Biology • Health Literacy
Multidisciplinary Research Transdisciplinary Research
Summary of Study Populations • Low-income Hispanic, Chinese, Filipino,
African-American families • Preschool children • Parents/caregivers • Pregnant women • Agricultural worker families • English language learners • Dentists, Primary medical care providers
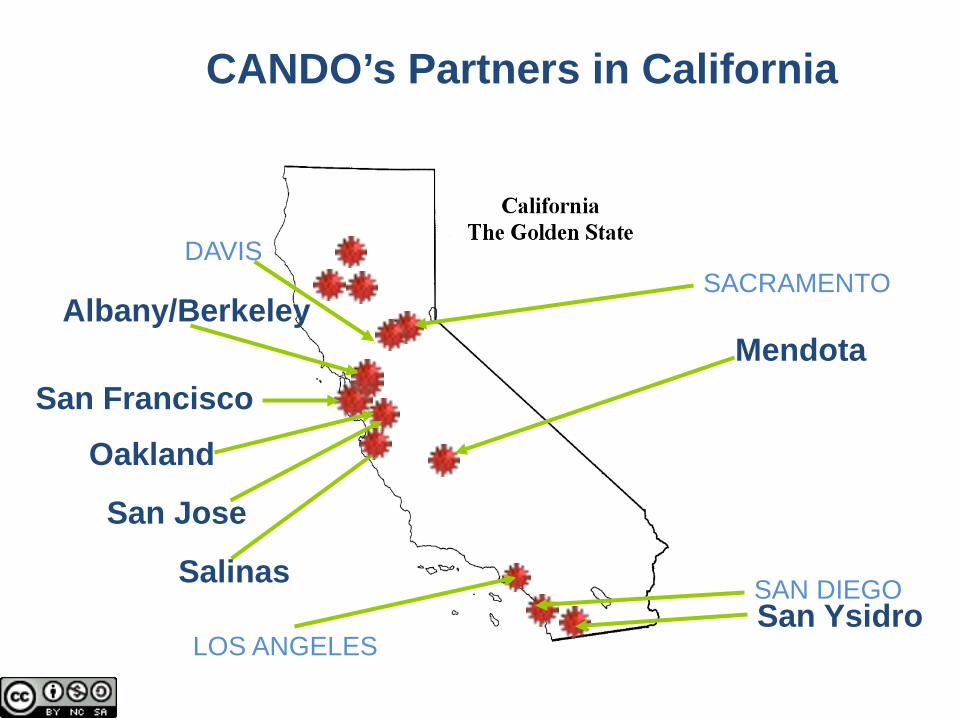
CANDO’s Partners in California
DAVIS
San Francisco Mendota
San Ysidro SAN DIEGO
San Jose
SACRAMENTO Albany/Berkeley
Oakland
Salinas
LOS ANGELES
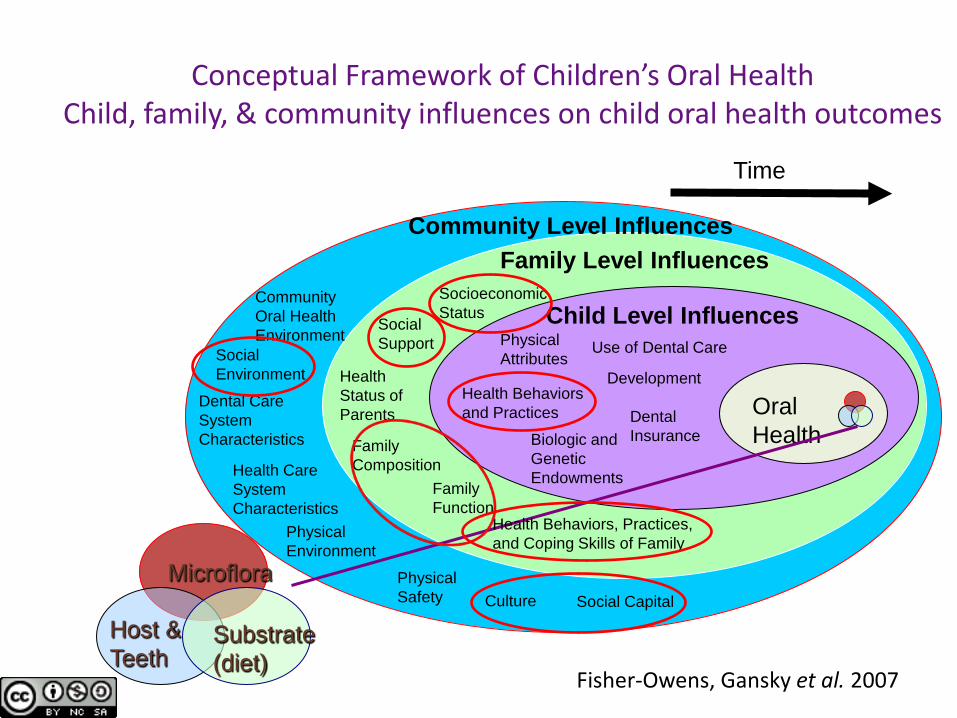
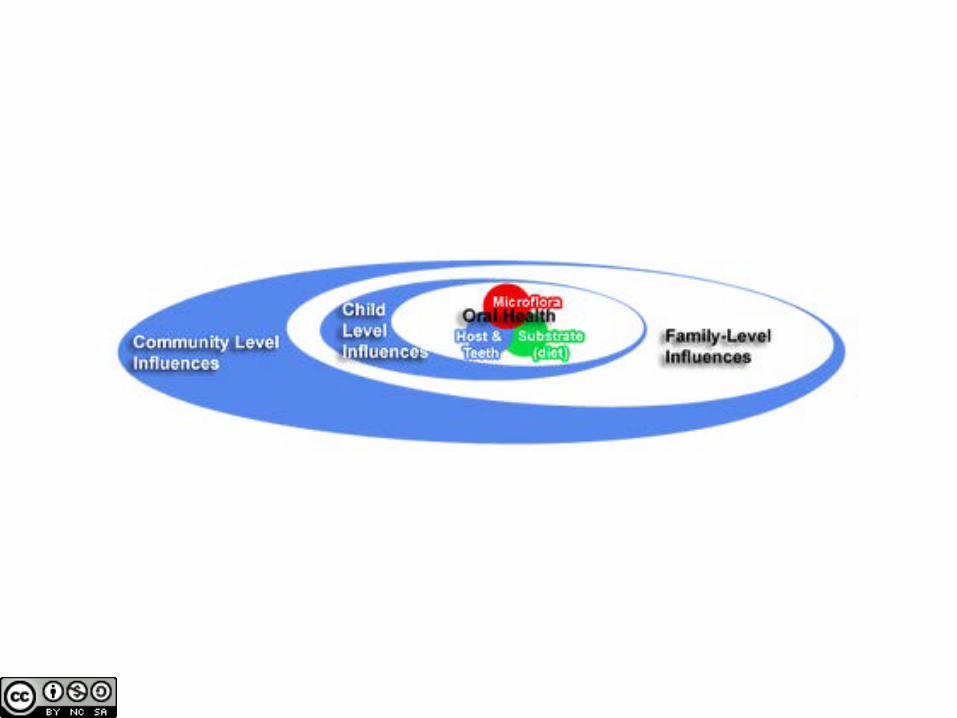
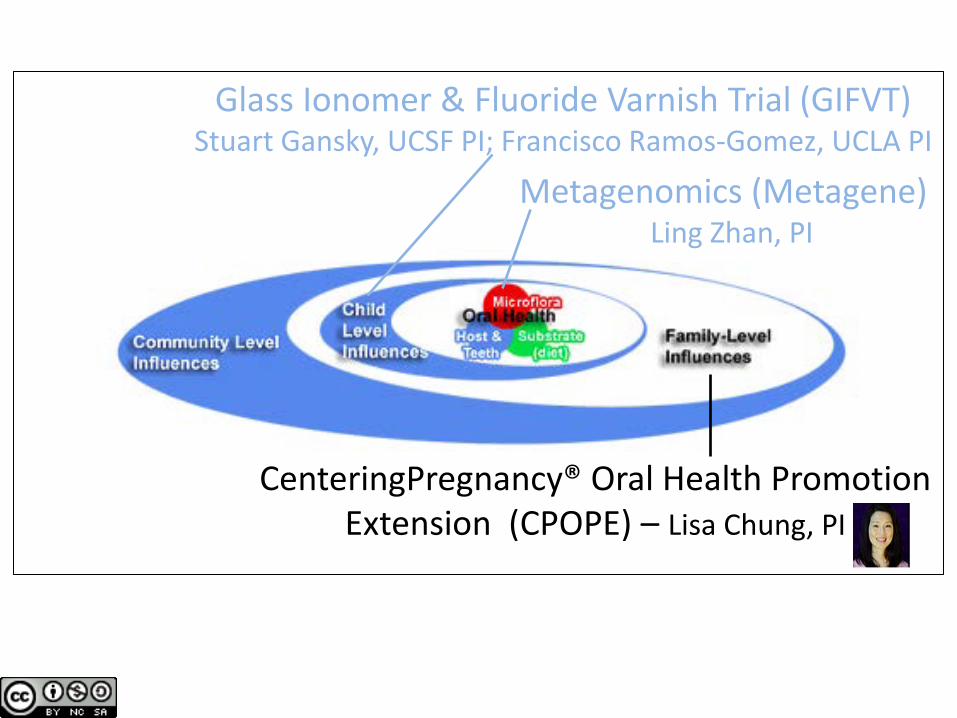
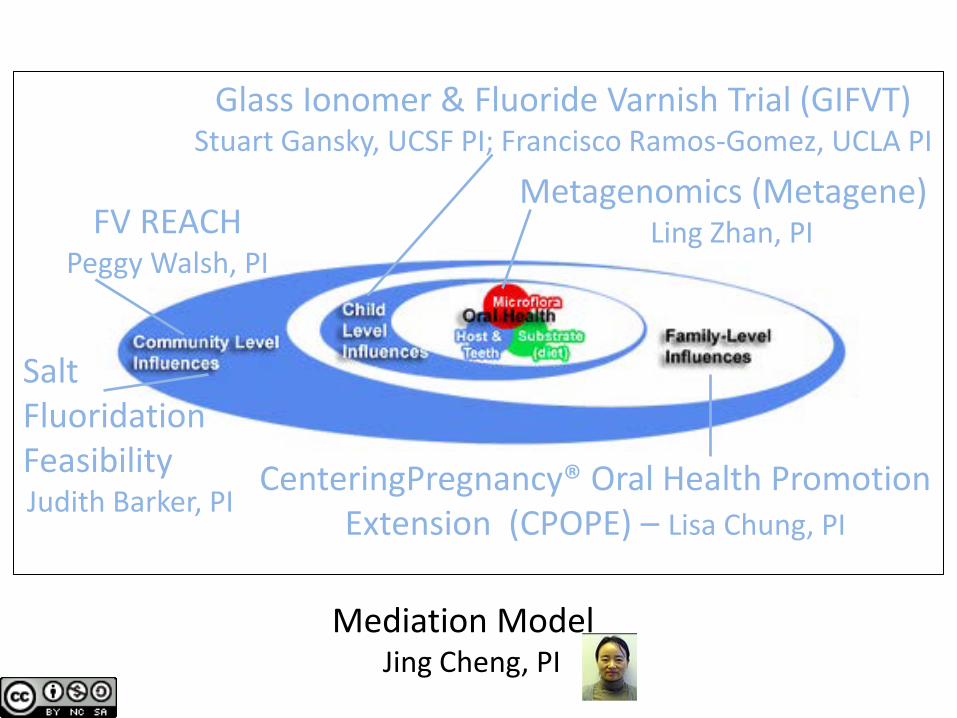
Conceptual Framework of Children’s Oral Health Child, family, & community influences on child oral health outcomes
Microflora
Substrate (diet)
Host & Teeth
Oral Health
Child Level Influences
Development
Use of Dental Care
Dental Insurance Biologic and
Genetic Endowments
Physical Attributes
Health Behaviors and Practices
Family Level Influences Socioeconomic Status
Social Support
Health Status of Parents
Family Composition
Family Function
Health Behaviors, Practices, and Coping Skills of Family
Social Environment
Community Level Influences
Dental Care System Characteristics
Health Care System Characteristics
Physical Environment
Culture Social Capital Physical Safety
Community Oral Health Environment
Time
Fisher-Owens et al. Pediatrics 2007 NIH/NIDCR R03DE016571
Fisher-Owens, Gansky et al. 2007
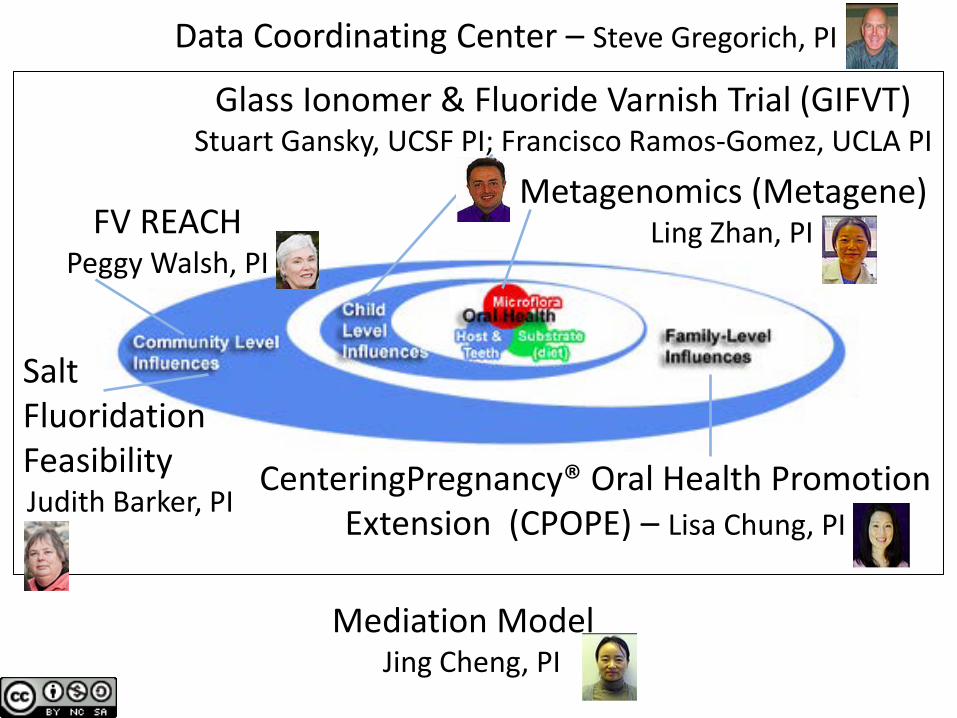
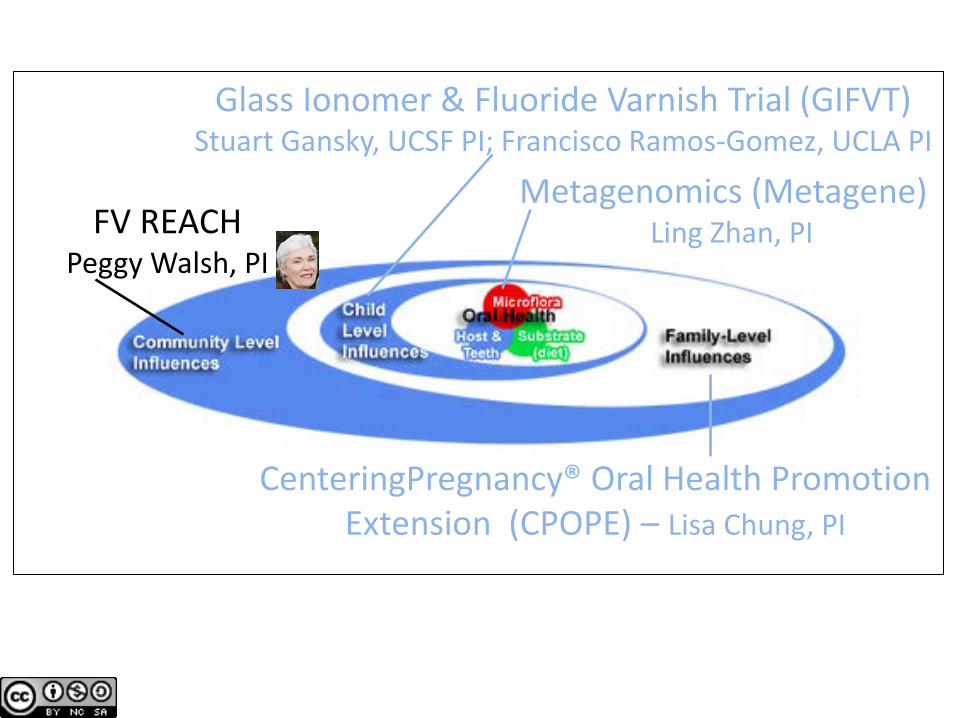
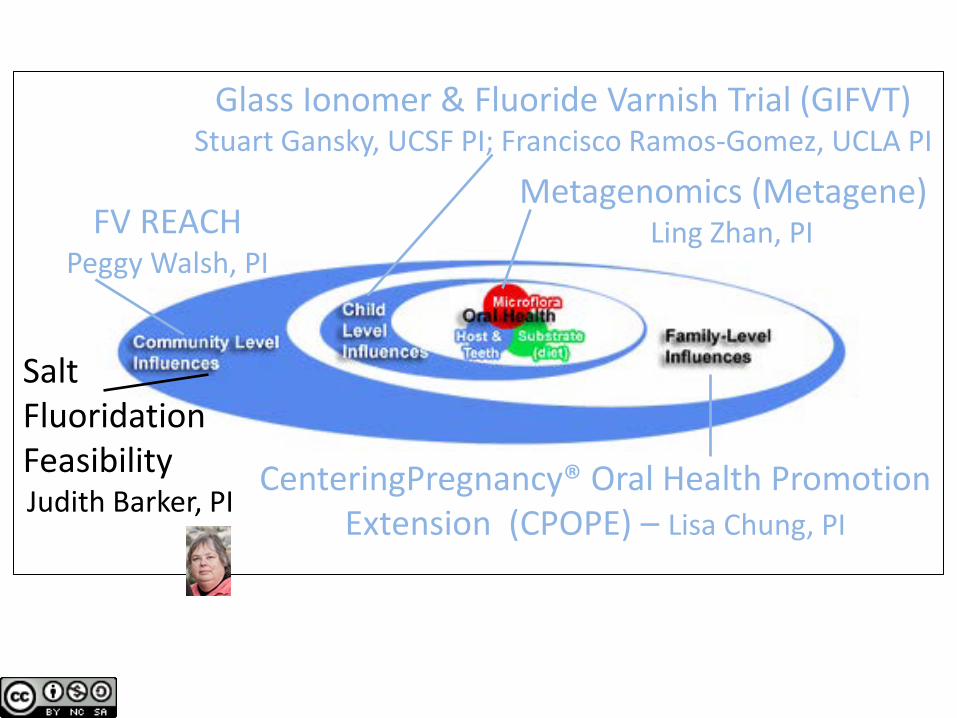
Glass Ionomer & Fluoride Varnish Trial (GIFVT) Stuart Gansky, UCSF PI; Francisco Ramos-Gomez, UCLA PI
Metagenomics (Metagene) Ling Zhan, PI
CenteringPregnancy® Oral Health Promotion Extension (CPOPE) – Lisa Chung, PI
Salt Fluoridation Feasibility Judith Barker, PI
FV REACH Peggy Walsh, PI
Mediation Model Jing Cheng, PI
Data Coordinating Center – Steve Gregorich, PI
Glass Ionomer & Fluoride Varnish Trial (GIFVT) Stuart Gansky, UCSF PI; Francisco Ramos-Gomez, UCLA PI
Metagenomics (Metagene) Ling Zhan, PI
CenteringPregnancy® Oral Health Promotion Extension (CPOPE) – Lisa Chung, PI
Glass Ionomer & Fluoride Varnish Trial (GIFVT) Stuart Gansky, UCSF PI; Francisco Ramos-Gomez, UCLA PI
Metagenomics (Metagene) Ling Zhan, PI
CenteringPregnancy® Oral Health Promotion Extension (CPOPE) – Lisa Chung, PI
FV REACH Peggy Walsh, PI
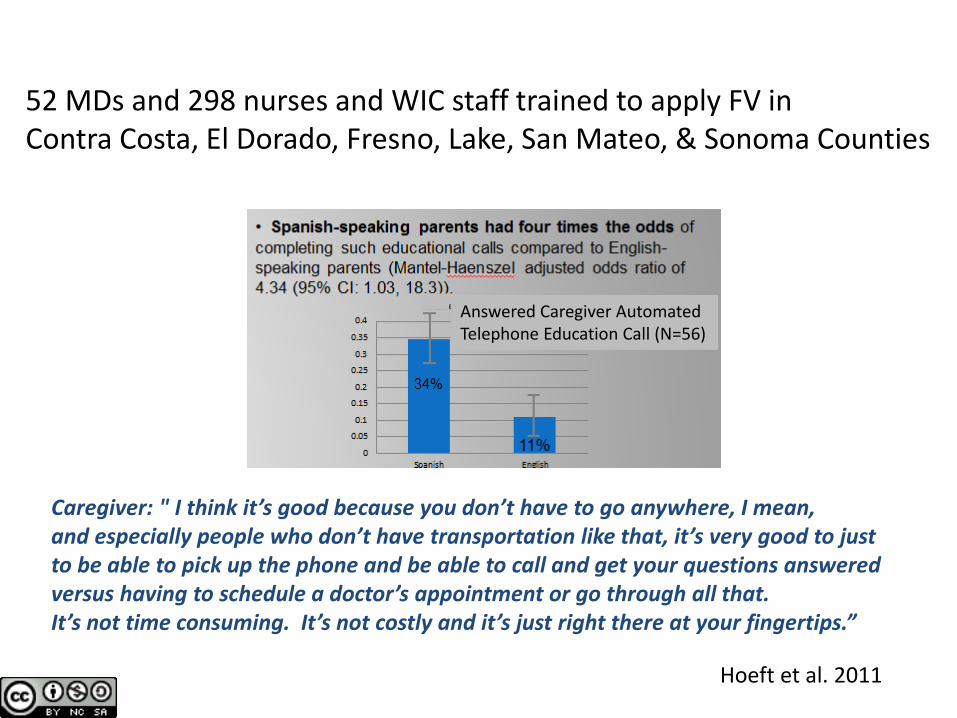
52 MDs and 298 nurses and WIC staff trained to apply FV in Contra Costa, El Dorado, Fresno, Lake, San Mateo, & Sonoma Counties
Hoeft et al. 2011
Caregiver: " I think it’s good because you don’t have to go anywhere, I mean, and especially people who don’t have transportation like that, it’s very good to just to be able to pick up the phone and be able to call and get your questions answered versus having to schedule a doctor’s appointment or go through all that. It’s not time consuming. It’s not costly and it’s just right there at your fingertips.”
Answered Caregiver Automated Telephone Education Call (N=56)
Glass Ionomer & Fluoride Varnish Trial (GIFVT) Stuart Gansky, UCSF PI; Francisco Ramos-Gomez, UCLA PI
Metagenomics (Metagene) Ling Zhan, PI
CenteringPregnancy® Oral Health Promotion Extension (CPOPE) – Lisa Chung, PI
Salt Fluoridation Feasibility Judith Barker, PI
FV REACH Peggy Walsh, PI
Glass Ionomer & Fluoride Varnish Trial (GIFVT) Stuart Gansky, UCSF PI; Francisco Ramos-Gomez, UCLA PI
Metagenomics (Metagene) Ling Zhan, PI
CenteringPregnancy® Oral Health Promotion Extension (CPOPE) – Lisa Chung, PI
Salt Fluoridation Feasibility Judith Barker, PI
FV REACH Peggy Walsh, PI
Mediation Model Jing Cheng, PI
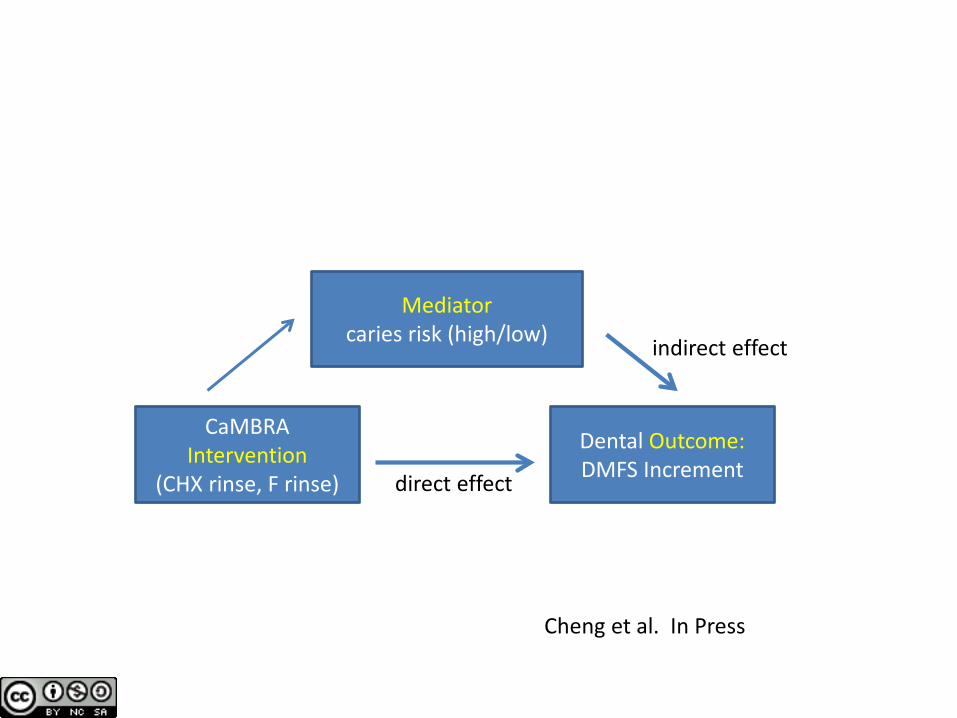
CaMBRA Intervention
(CHX rinse, F rinse)
Mediator caries risk (high/low)
Dental Outcome: DMFS Increment direct effect
indirect effect
Cheng et al. In Press
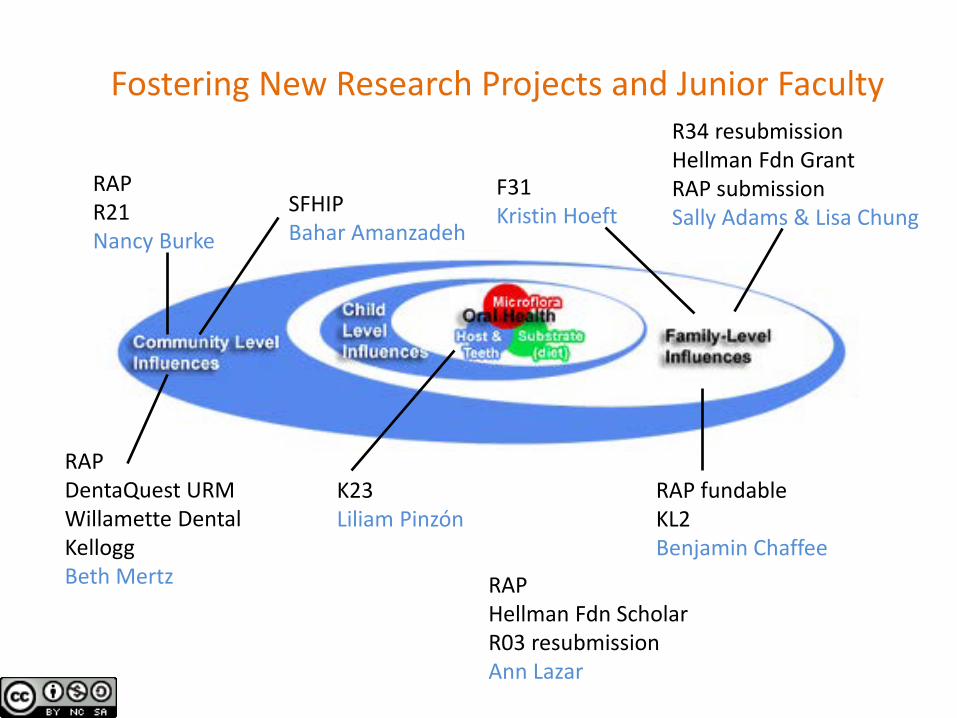
RAP R21 Nancy Burke
RAP DentaQuest URM Willamette Dental Kellogg Beth Mertz
F31 Kristin Hoeft
RAP fundable KL2 Benjamin Chaffee
RAP Hellman Fdn Scholar R03 resubmission Ann Lazar
R34 resubmission Hellman Fdn Grant RAP submission Sally Adams & Lisa Chung
K23 Liliam Pinzón
Fostering New Research Projects and Junior Faculty
SFHIP Bahar Amanzadeh
caries health disparities in California school-children:
1993-94 to 2004-05 Stuart A. Gansky, DrPH
Gloria C. Mejia, DDS, MPH, PhD Estefania Guerreros
Pamela Z. Han, BS, MPH Nancy F. Cheng, MS, MS Sally H. Adams, RN, PhD
University of California, San Francisco Center to Address Disparities in Children’s Oral Health
US DHHS/NIH/NIDCR R03 DE 018116 & NDDK R25 DK78382-04
39
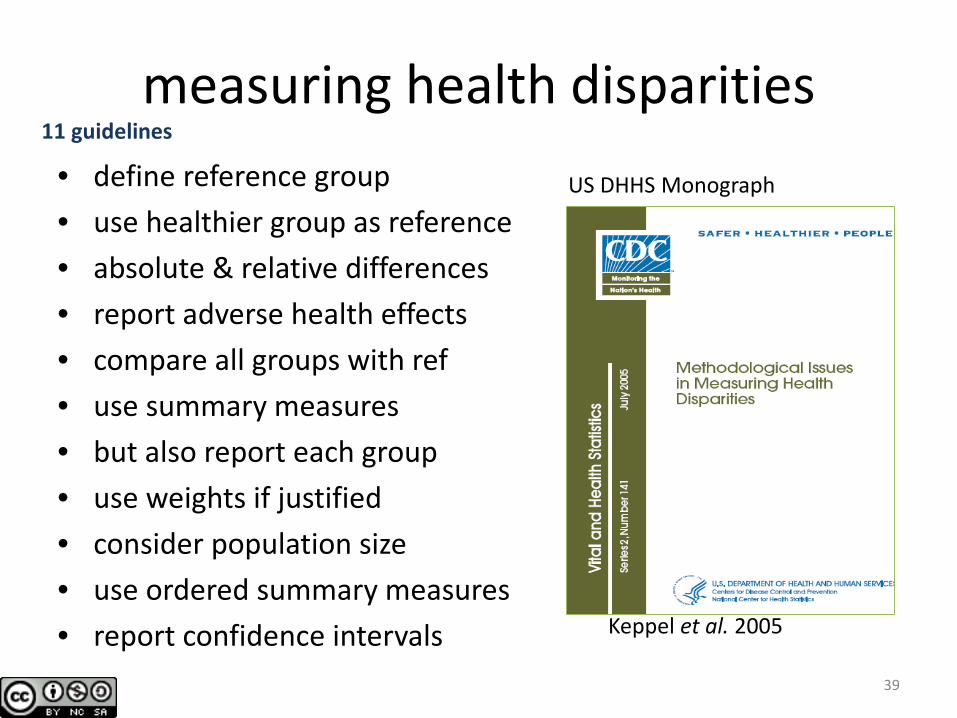
measuring health disparities • define reference group • use healthier group as reference • absolute & relative differences • report adverse health effects • compare all groups with ref • use summary measures • but also report each group • use weights if justified • consider population size • use ordered summary measures • report confidence intervals Keppel et al. 2005
US DHHS Monograph
11 guidelines
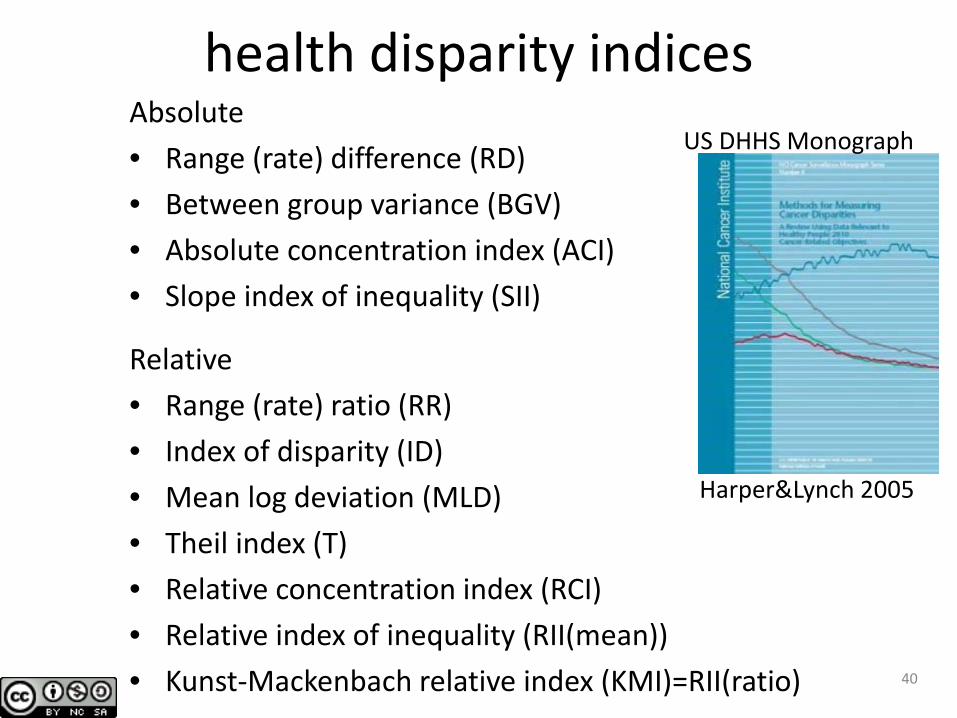
health disparity indices Absolute • Range (rate) difference (RD) • Between group variance (BGV) • Absolute concentration index (ACI) • Slope index of inequality (SII)
Relative • Range (rate) ratio (RR) • Index of disparity (ID) • Mean log deviation (MLD) • Theil index (T) • Relative concentration index (RCI) • Relative index of inequality (RII(mean)) • Kunst-Mackenbach relative index (KMI)=RII(ratio) 40
Harper&Lynch 2005
US DHHS Monograph
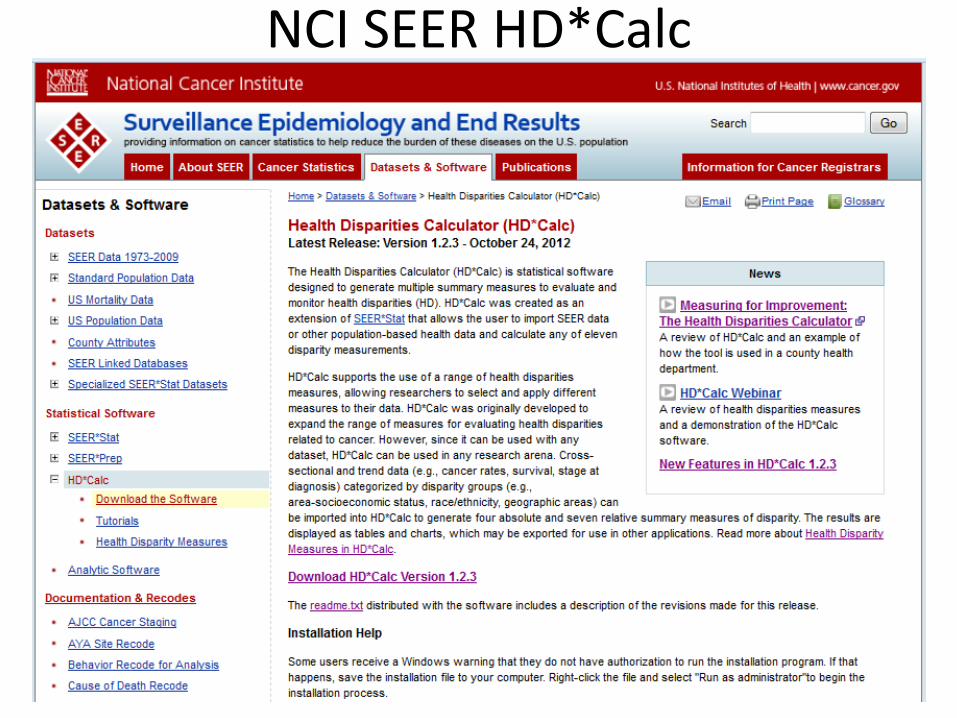
NCI SEER HD*Calc
41
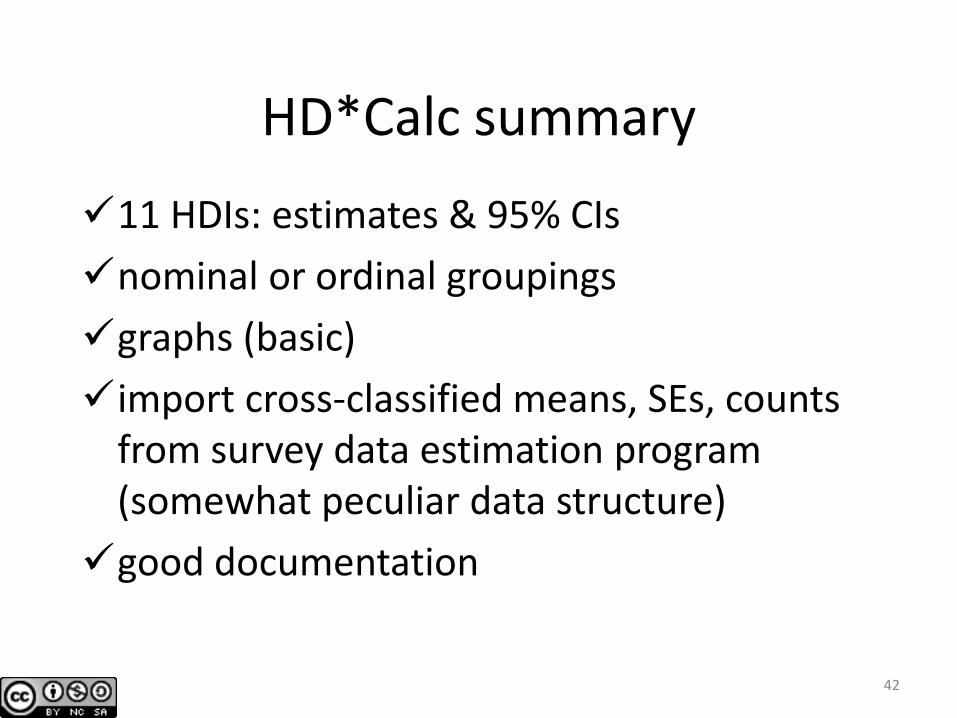
HD*Calc summary
11 HDIs: estimates & 95% CIs nominal or ordinal groupings graphs (basic) import cross-classified means, SEs, counts
from survey data estimation program (somewhat peculiar data structure) good documentation
42
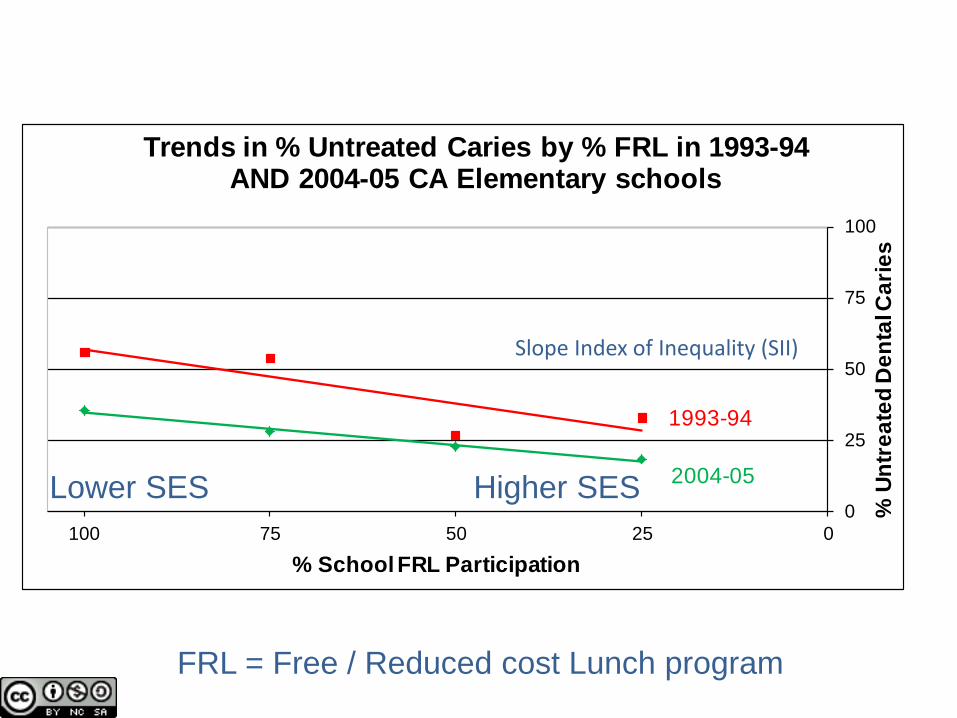
2004-05
1993-94
0
25
50
75
100
0255075100
% U
ntre
ated
Den
tal C
arie
s
% School FRL Participation
Trends in % Untreated Caries by % FRL in 1993-94 AND 2004-05 CA Elementary schools
FRL = Free / Reduced cost Lunch program
Slope Index of Inequality (SII)
Lower SES Higher SES
0
0.1
0.2
0.3
0.4
0.5
0.6
0.7
0 1 2 3 4
Prev
alen
ce
Year
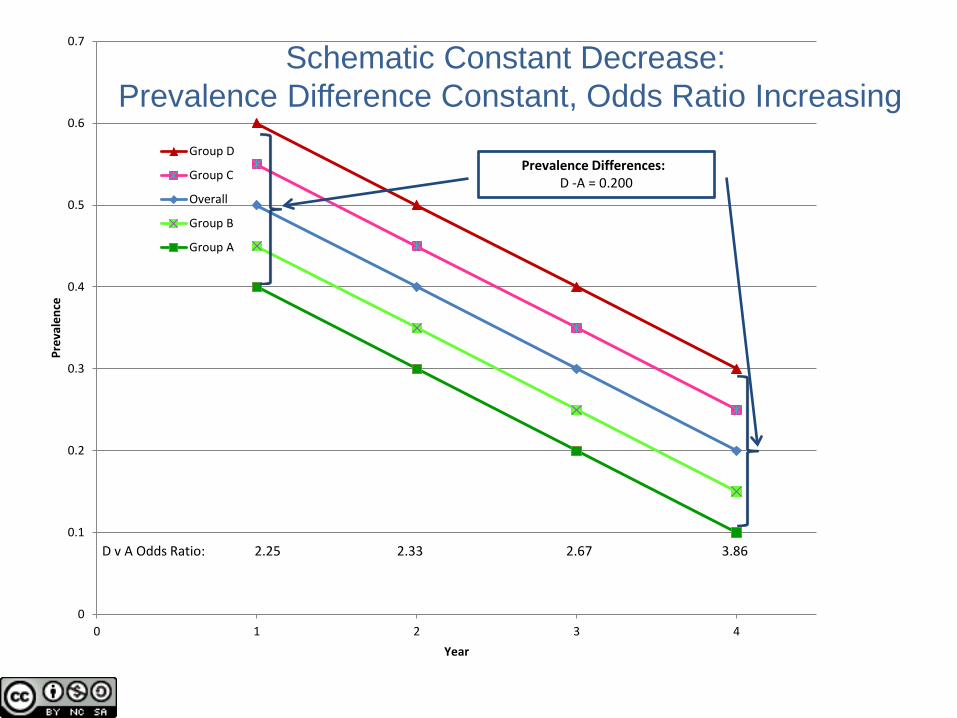
Group D
Group C
Overall
Group B
Group A
D v A Odds Ratio: 2.25 2.33 2.67 3.86
Prevalence Differences: D -A = 0.200
Schematic Constant Decrease: Prevalence Difference Constant, Odds Ratio Increasing
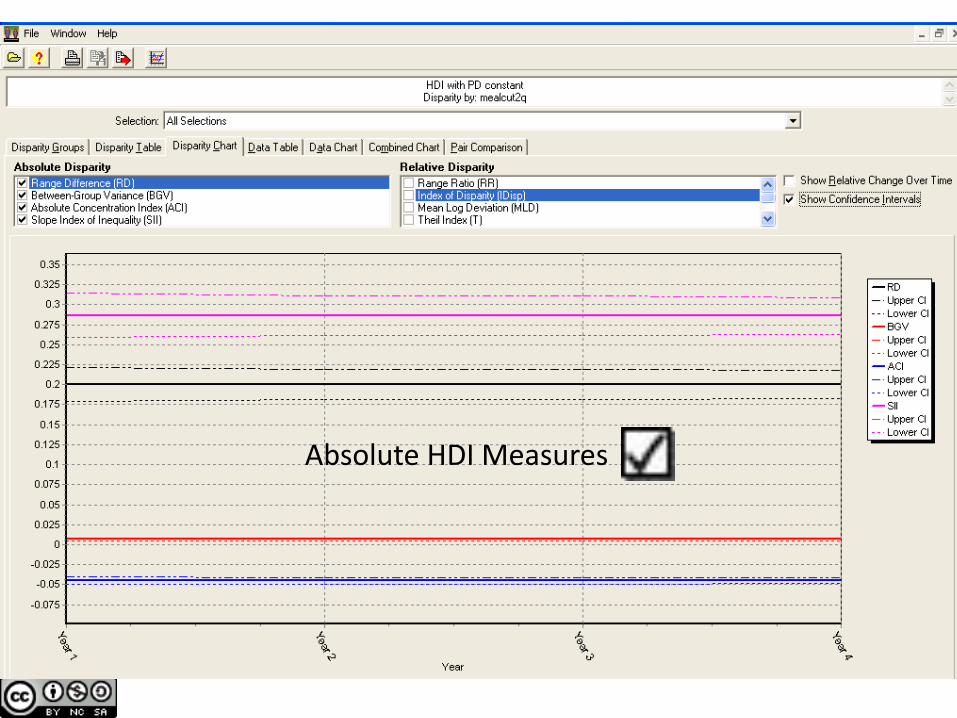
Absolute HDI Measures
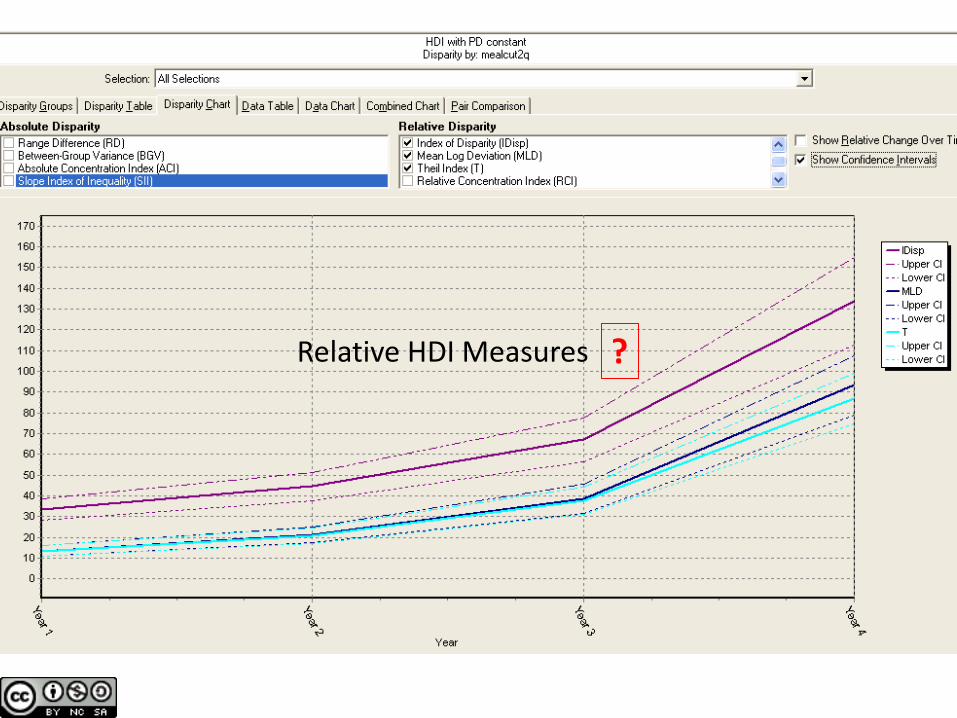
Relative HDI Measures ?
Absolute & Relative HD Indices differ In most scenarios, Absolute HDIs assess public health and policy targets
47
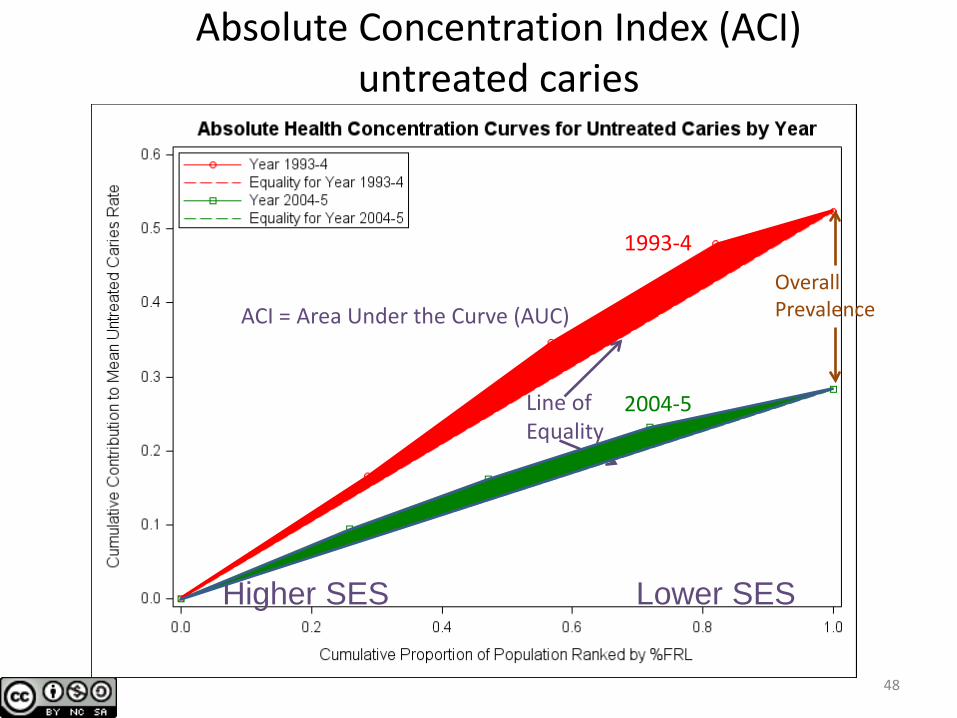
Absolute Concentration Index (ACI) untreated caries
48
low %FRL = high SES
high %FRL = low SES
1993-4
2004-5 Line of Equality
Higher SES Lower SES
Overall Prevalence ACI = Area Under the Curve (AUC)
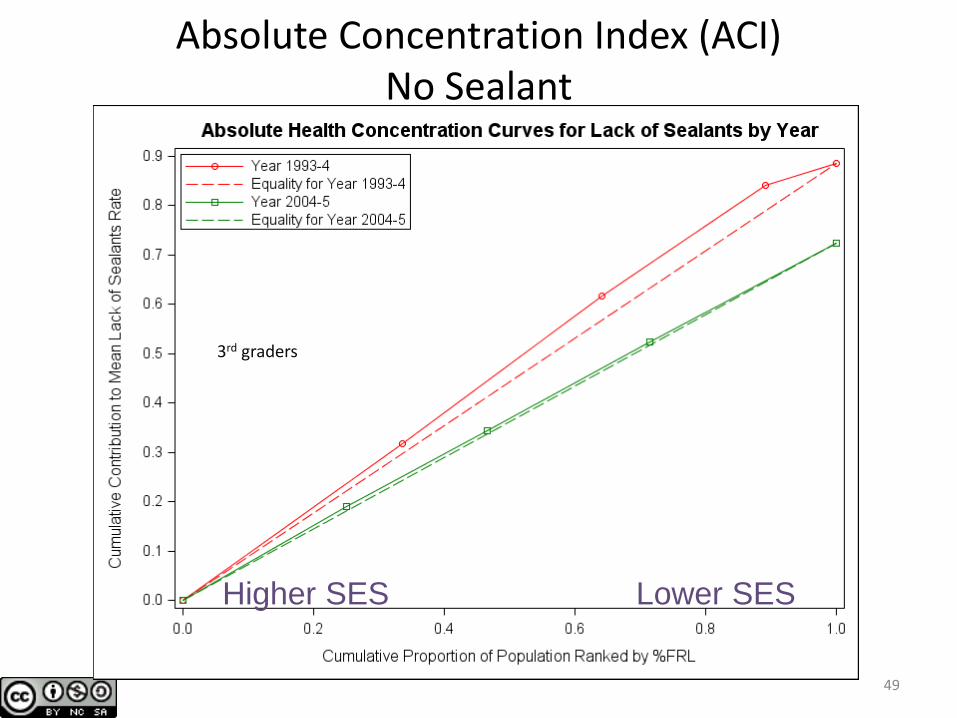
Absolute Concentration Index (ACI) No Sealant
49
3rd graders
Higher SES Lower SES
50
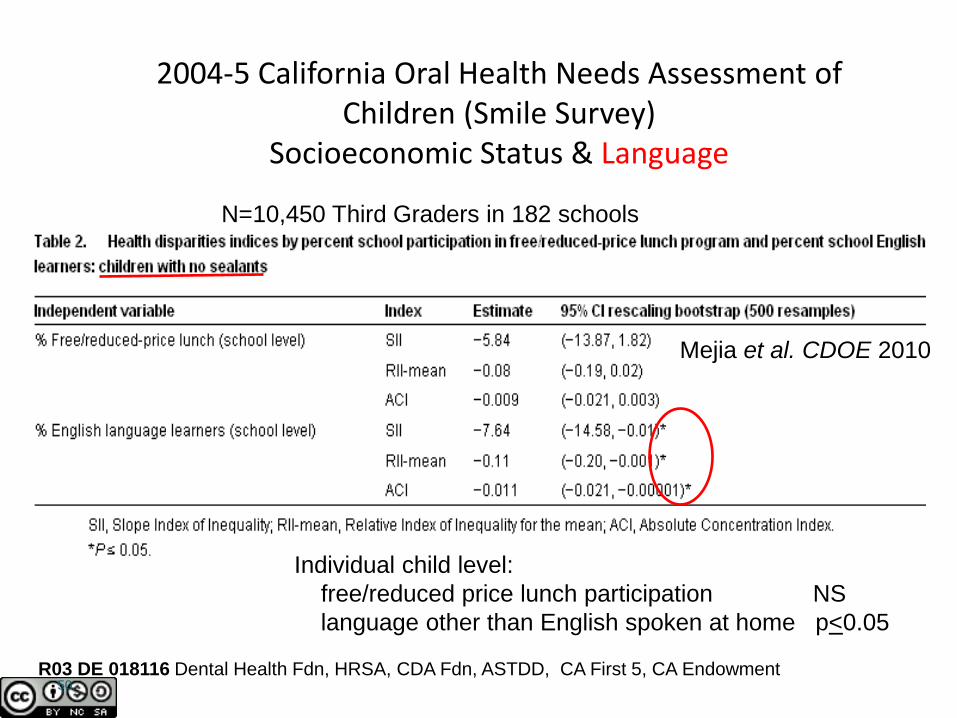
2004-5 California Oral Health Needs Assessment of Children (Smile Survey)
Socioeconomic Status & Language
Individual child level: free/reduced price lunch participation NS language other than English spoken at home p<0.05
N=10,450 Third Graders in 182 schools
R03 DE 018116 Dental Health Fdn, HRSA, CDA Fdn, ASTDD, CA First 5, CA Endowment
Mejia et al. CDOE 2010
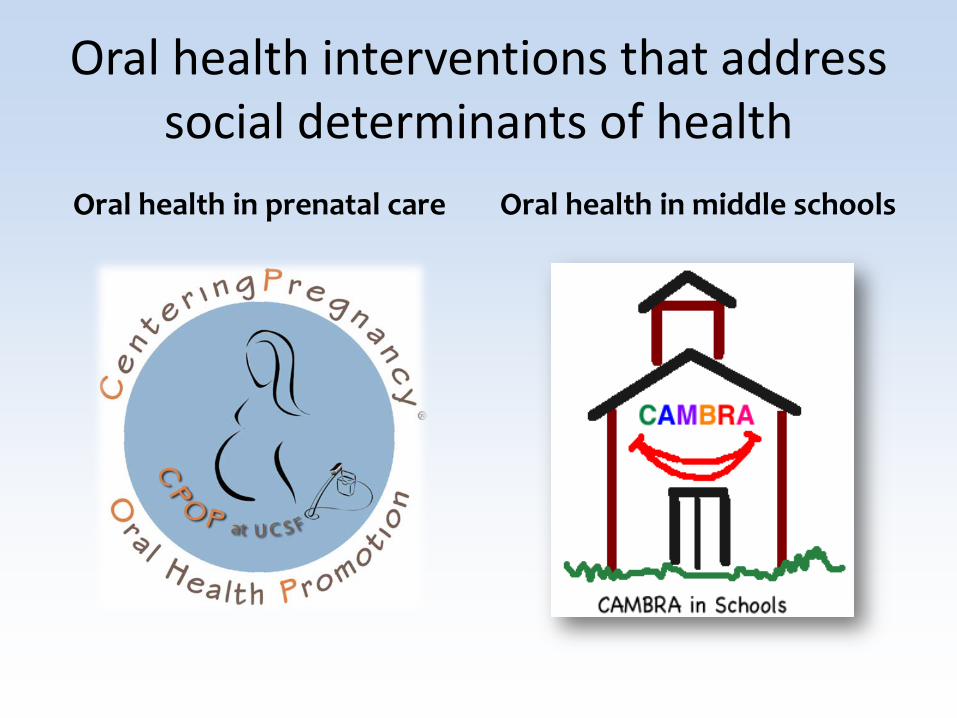
Oral health interventions that address social determinants of health
Oral health in prenatal care Oral health in middle schools
UCSF-Elev8 Healthy Students & Families
• The Atlantic Philanthropies’ national initiative: struggling middle schools thriving places of learning and wellness
1. Enhanced learning 2. School based health centers 3. Family support services 4. Family engagement and advocacy
Awarded by Atlantic Philanthropies 6/11-6/14
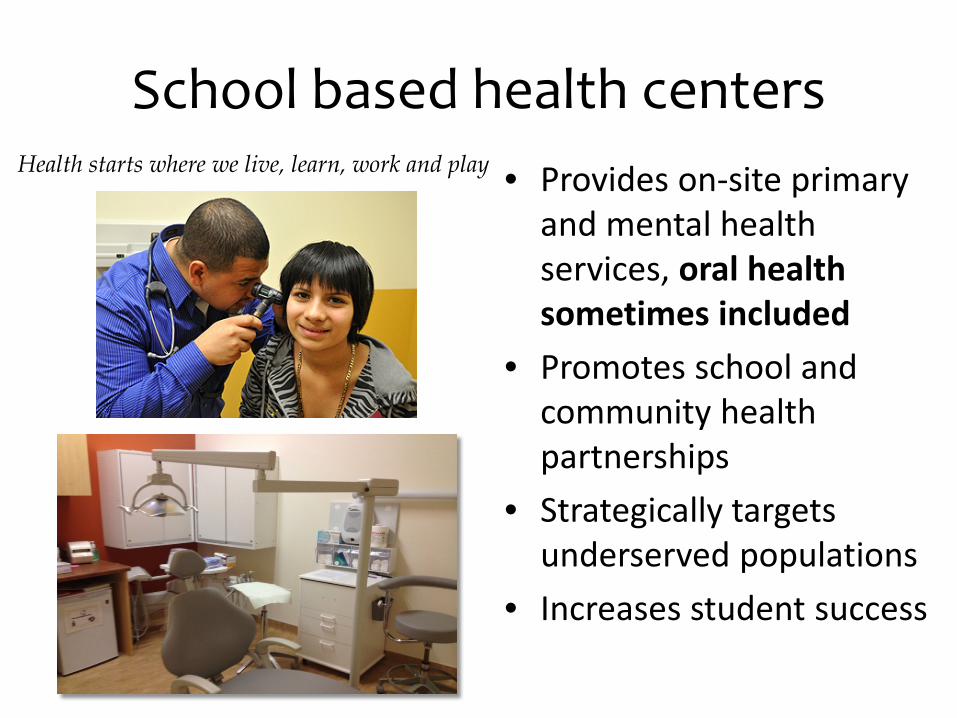
School based health centers • Provides on-site primary
and mental health services, oral health sometimes included
• Promotes school and community health partnerships
• Strategically targets underserved populations
• Increases student success
Health starts where we live, learn, work and play
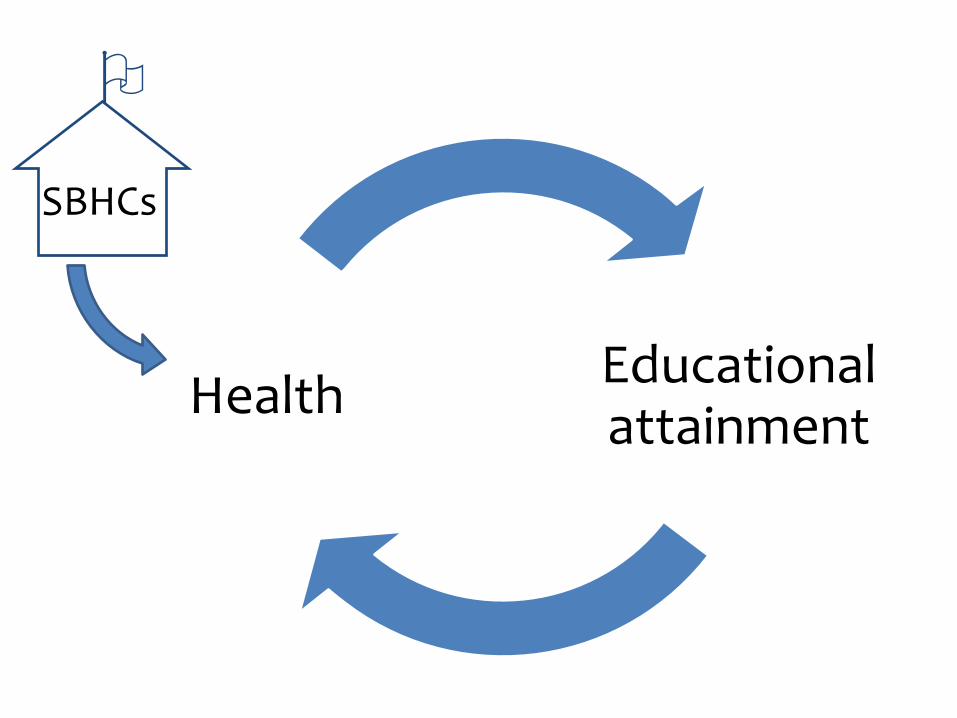
Educational attainment Health
SBHCs
Implementing CAMBRA in a School Setting: a pilot study
University of California San Francisco advancing health worldwide
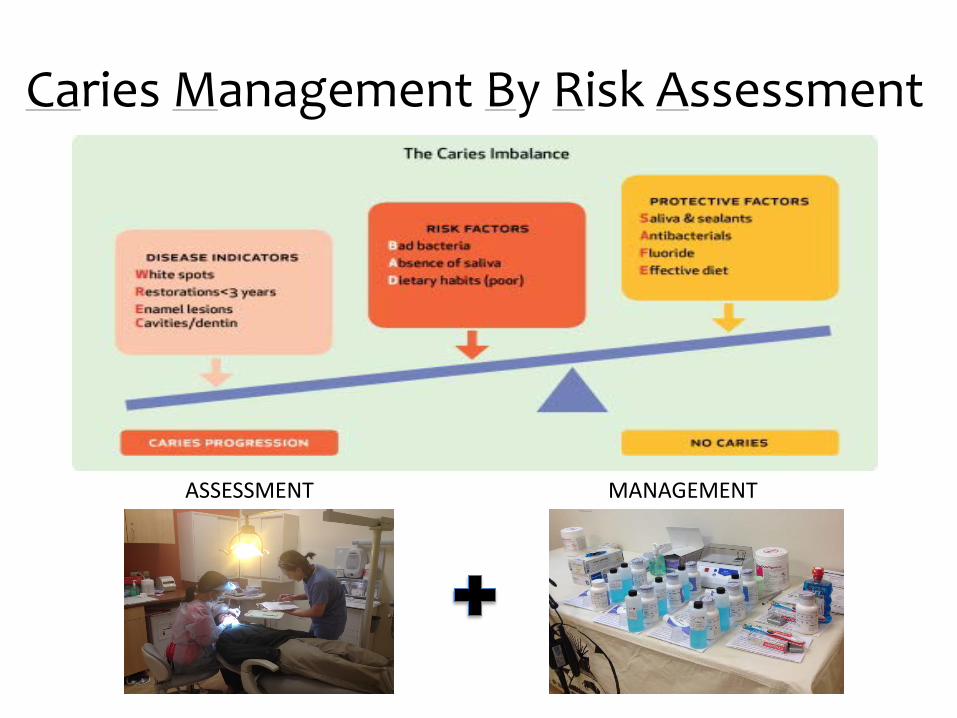
Caries Management By Risk Assessment
MANAGEMENT ASSESSMENT
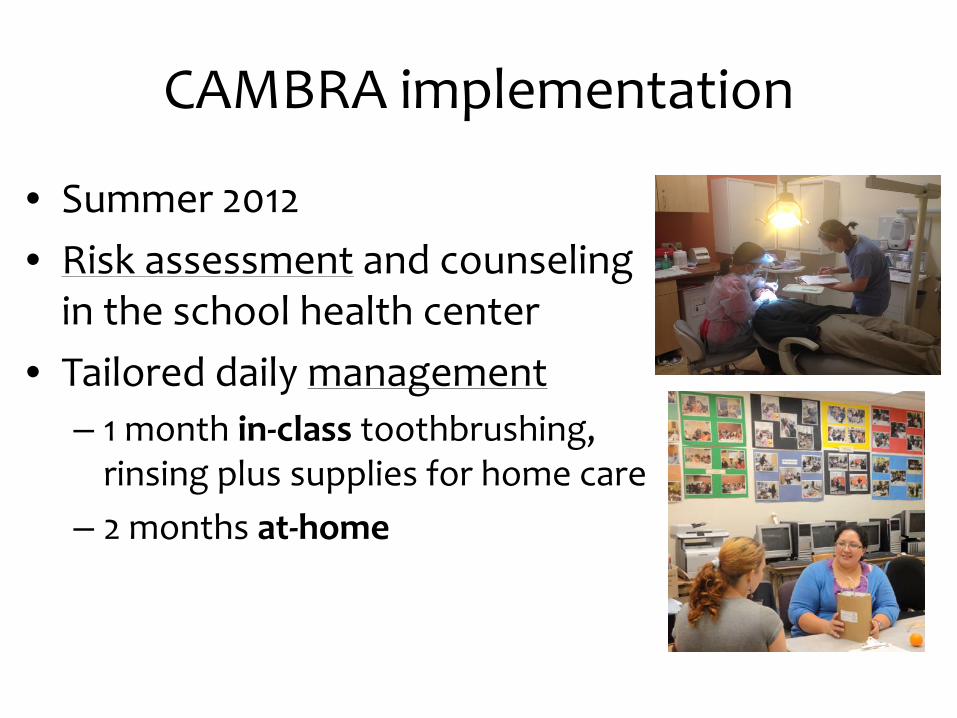
CAMBRA implementation
• Summer 2012 • Risk assessment and counseling
in the school health center • Tailored daily management
– 1 month in-class toothbrushing, rinsing plus supplies for home care
– 2 months at-home
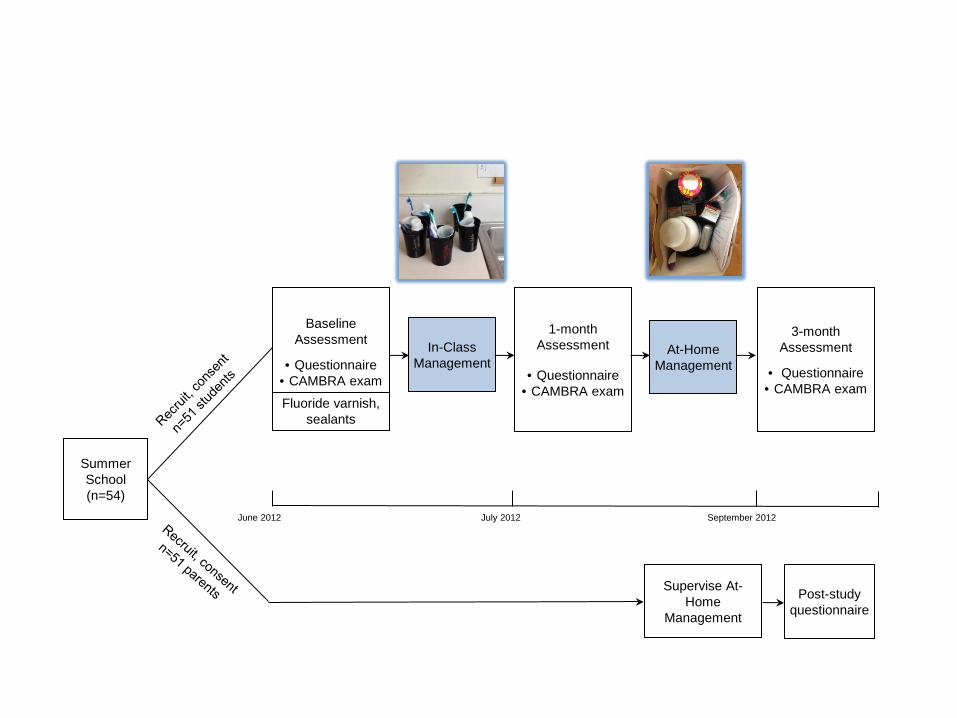
At-Home Management
3-month Assessment
• Questionnaire • CAMBRA exam
Baseline Assessment
• Questionnaire • CAMBRA exam
Fluoride varnish, sealants
1-month Assessment
• Questionnaire • CAMBRA exam
In-Class Management
Summer School (n=54)
Supervise At-Home
Management
Post-study questionnaire
June 2012 July 2012 September 2012
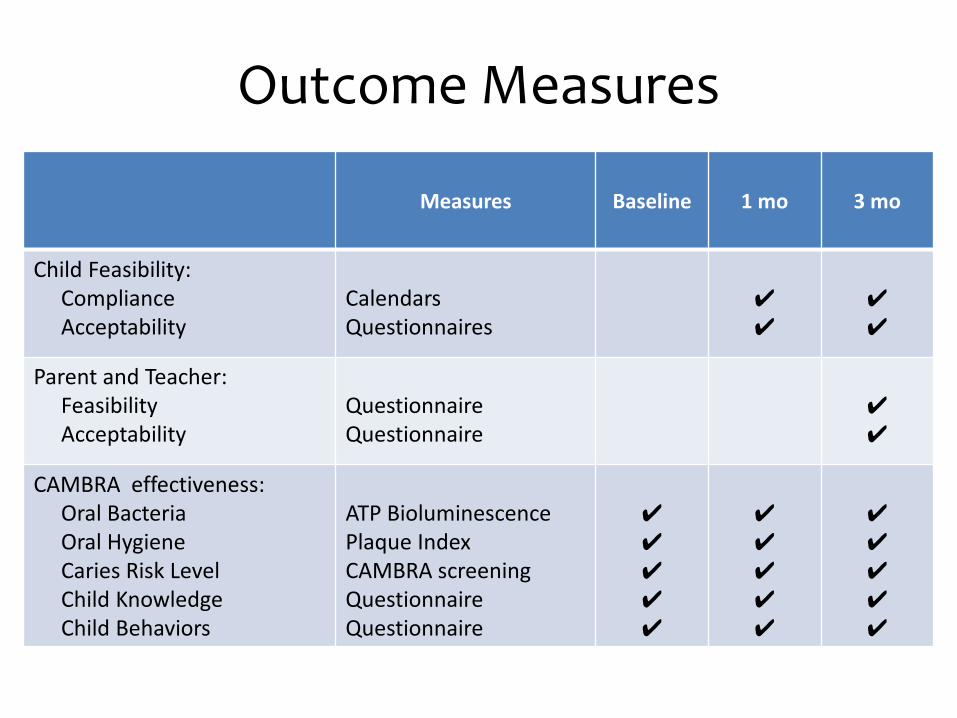
Measures Baseline 1 mo 3 mo
Child Feasibility: Compliance Acceptability
Calendars Questionnaires
✔ ✔
✔ ✔
Parent and Teacher: Feasibility Acceptability
Questionnaire Questionnaire
✔ ✔
CAMBRA effectiveness: Oral Bacteria Oral Hygiene Caries Risk Level Child Knowledge Child Behaviors
ATP Bioluminescence Plaque Index CAMBRA screening Questionnaire Questionnaire
✔ ✔ ✔ ✔ ✔
✔ ✔ ✔ ✔ ✔
✔ ✔ ✔ ✔ ✔
Outcome Measures
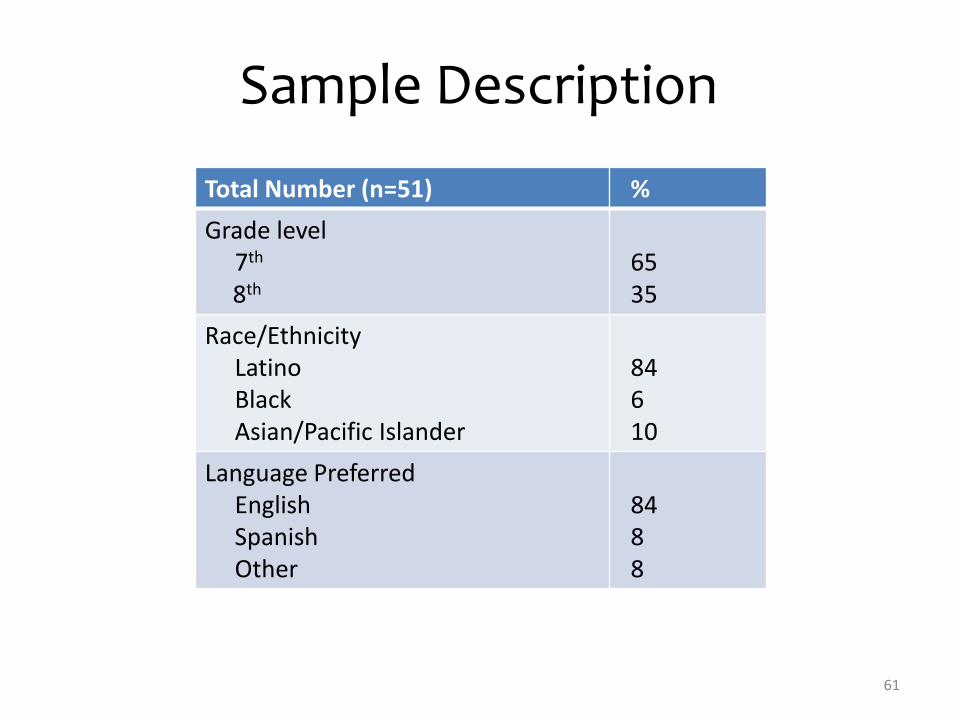
Total Number (n=51) % Grade level 7th
8th
65 35
Race/Ethnicity Latino Black Asian/Pacific Islander
84 6 10
Language Preferred English Spanish Other
84 8 8
Sample Description
61
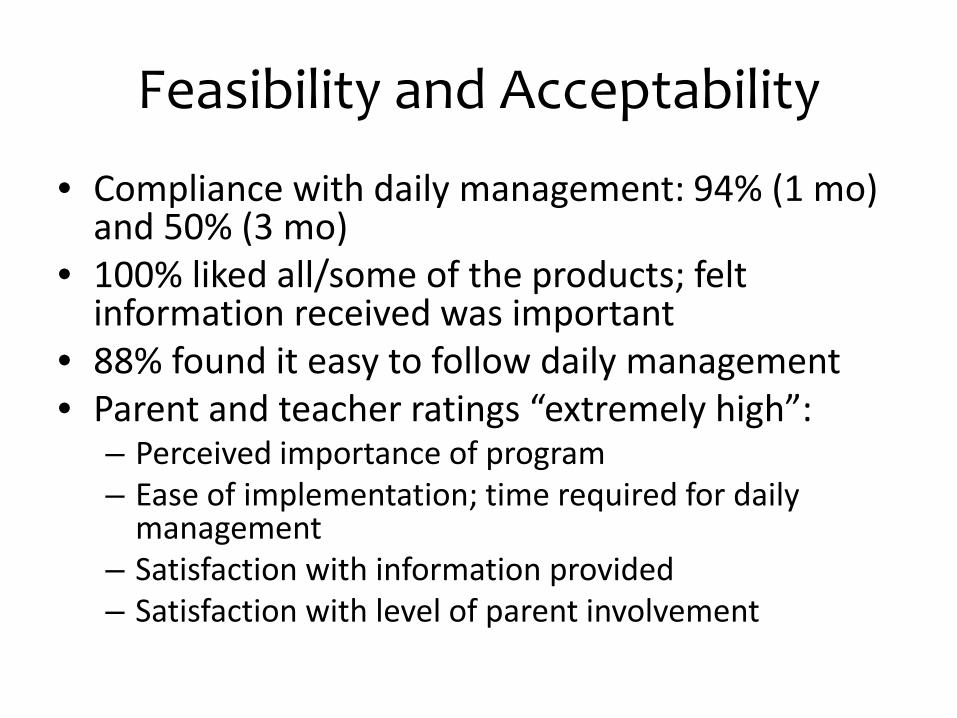
Feasibility and Acceptability
• Compliance with daily management: 94% (1 mo) and 50% (3 mo)
• 100% liked all/some of the products; felt information received was important
• 88% found it easy to follow daily management • Parent and teacher ratings “extremely high”:
– Perceived importance of program – Ease of implementation; time required for daily
management – Satisfaction with information provided – Satisfaction with level of parent involvement
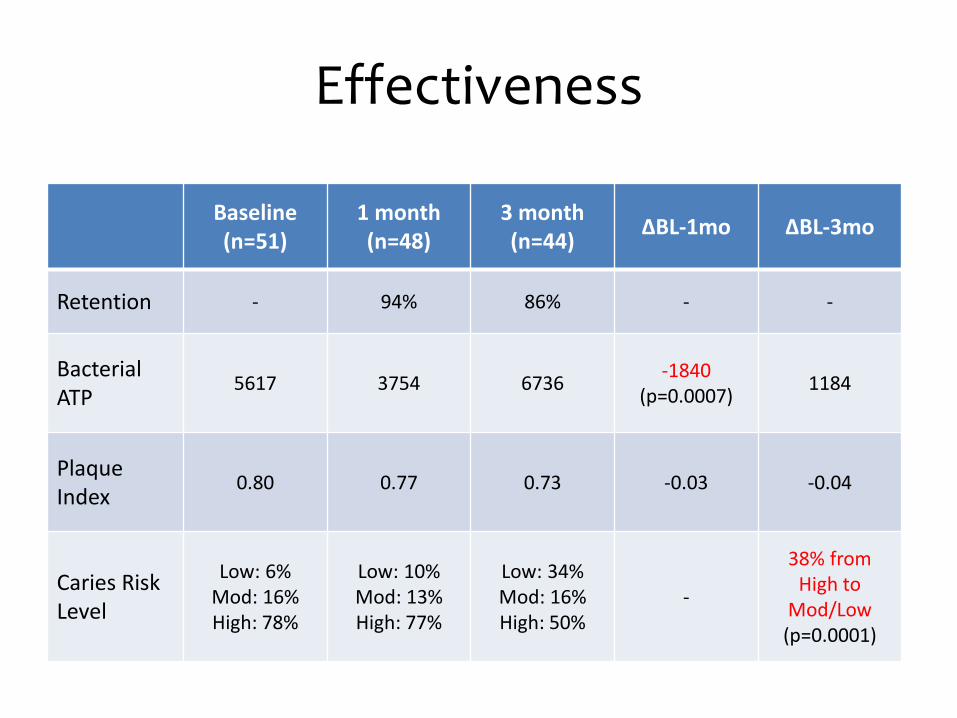
Effectiveness
Baseline (n=51)
1 month (n=48)
3 month (n=44) ΔBL-1mo ΔBL-3mo
Retention - 94% 86% - -
Bacterial ATP
5617 3754 6736 -1840 (p=0.0007) 1184
Plaque Index
0.80
0.77 0.73 -0.03 -0.04
Caries Risk Level
Low: 6% Mod: 16% High: 78%
Low: 10% Mod: 13% High: 77%
Low: 34% Mod: 16% High: 50%
-
38% from High to
Mod/Low (p=0.0001)
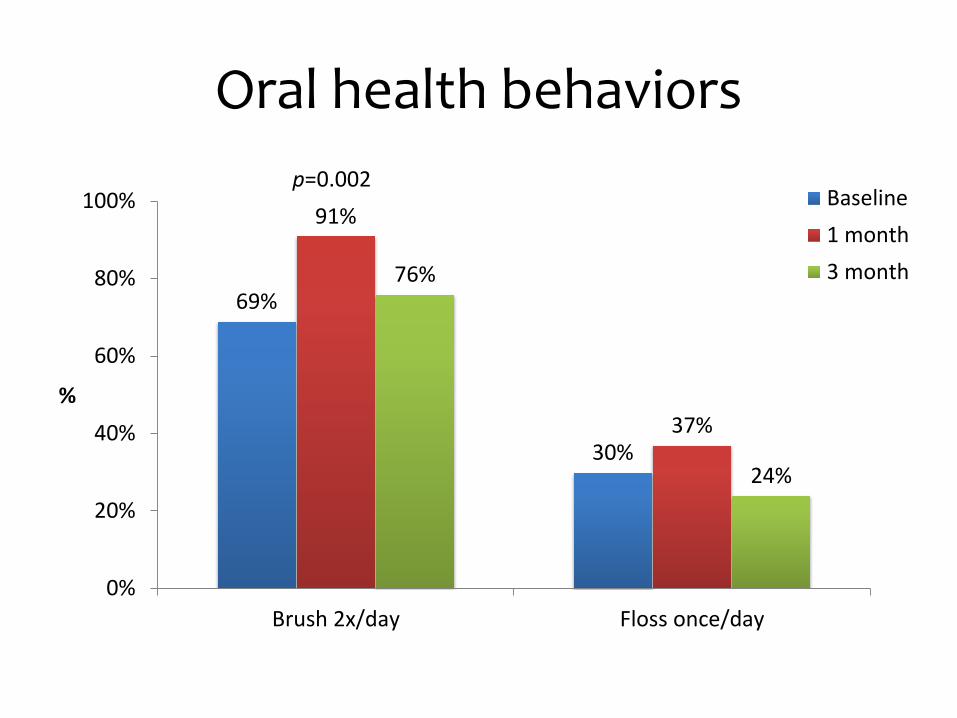
69%
30%
91%
37%
76%
24%
0%
20%
40%
60%
80%
100%
Brush 2x/day Floss once/day
%
Baseline1 month3 month
Oral health behaviors
p=0.002
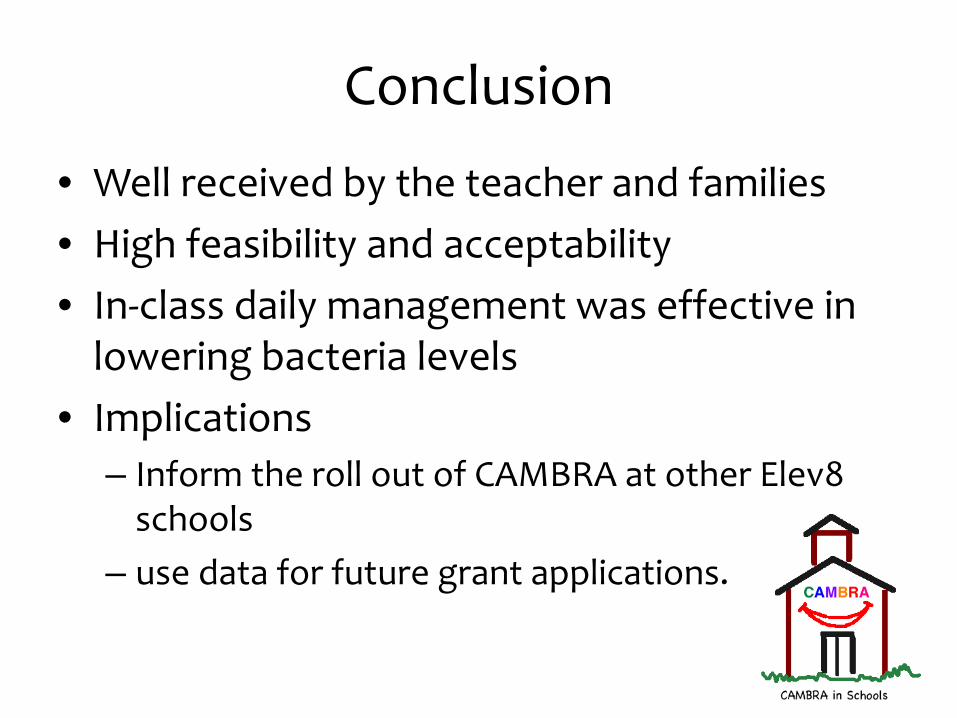
• Well received by the teacher and families • High feasibility and acceptability • In-class daily management was effective in
lowering bacteria levels • Implications
– Inform the roll out of CAMBRA at other Elev8 schools
– use data for future grant applications.
Conclusion
CenteringPregnancy Oral Health Promotion (CPOP) Project
PI’s: Sally Adams & Lisa Chung
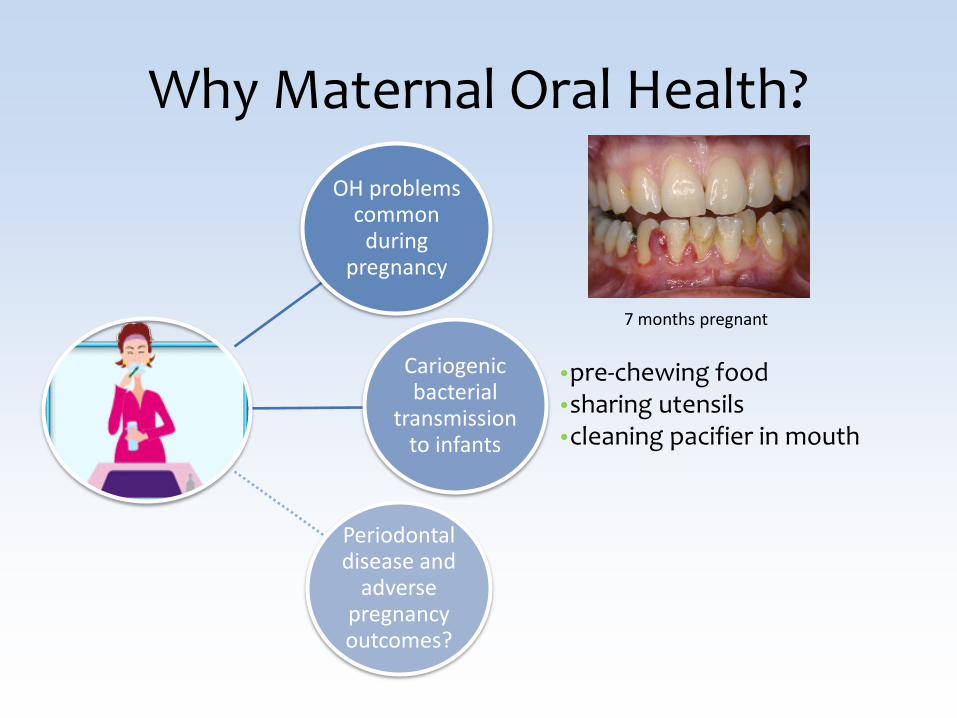
Why Maternal Oral Health? OH problems
common during
pregnancy
Cariogenic bacterial
transmission to infants
Periodontal disease and
adverse pregnancy outcomes?
7 months pregnant
•pre-chewing food •sharing utensils •cleaning pacifier in mouth
68
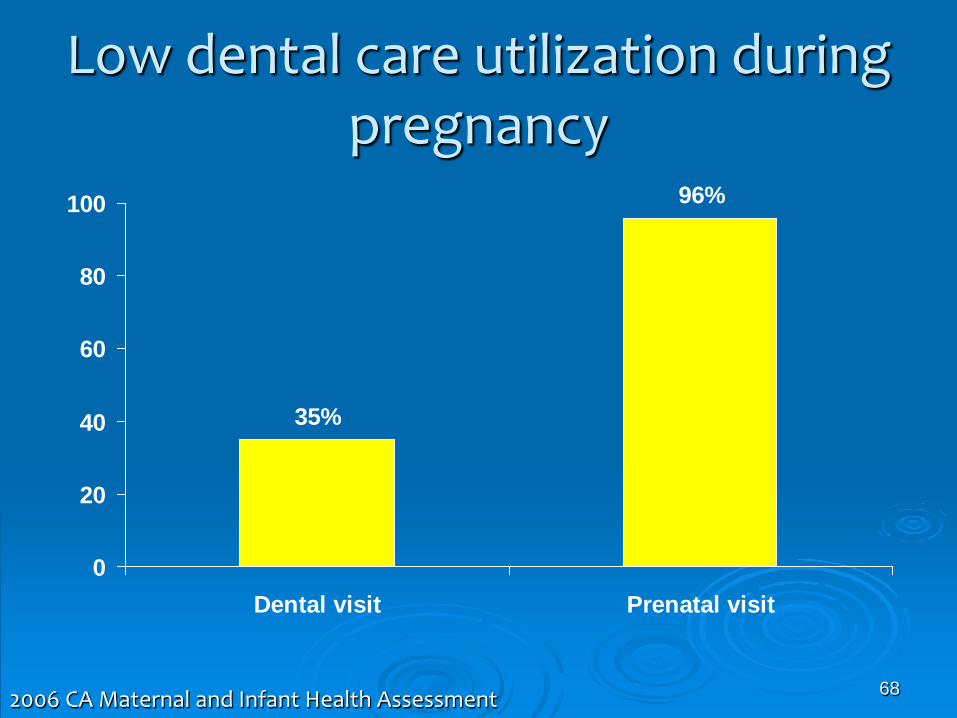
Low dental care utilization during pregnancy
96%
35%
0
20
40
60
80
100
Dental visit Prenatal visit
2006 CA Maternal and Infant Health Assessment
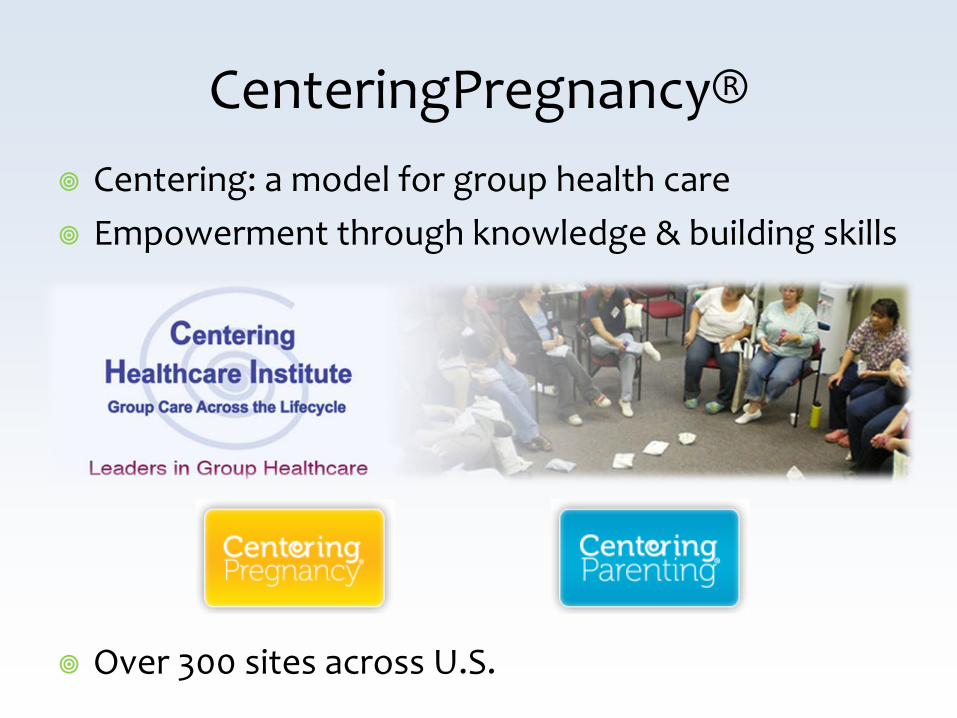
CenteringPregnancy® Centering: a model for group health care Empowerment through knowledge & building skills
Over 300 sites across U.S.
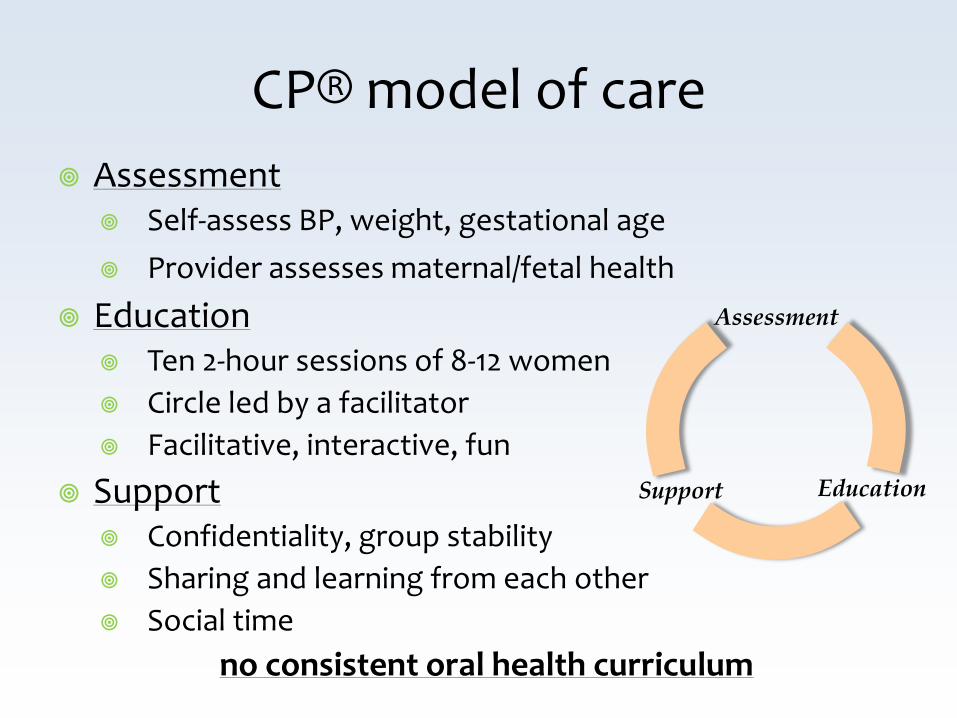
CP® model of care Assessment
Self-assess BP, weight, gestational age Provider assesses maternal/fetal health
Education Ten 2-hour sessions of 8-12 women Circle led by a facilitator Facilitative, interactive, fun
Support Confidentiality, group stability Sharing and learning from each other Social time
no consistent oral health curriculum
Assessment
Education Support
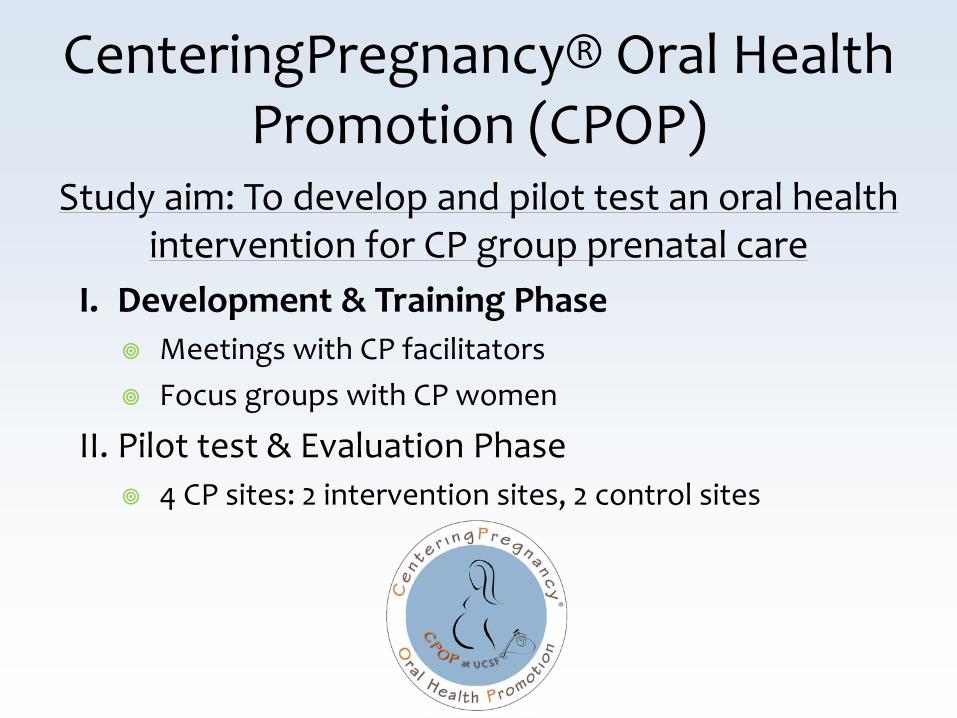
CenteringPregnancy® Oral Health Promotion (CPOP)
Study aim: To develop and pilot test an oral health intervention for CP group prenatal care
I. Development & Training Phase Meetings with CP facilitators Focus groups with CP women
II. Pilot test & Evaluation Phase 4 CP sites: 2 intervention sites, 2 control sites
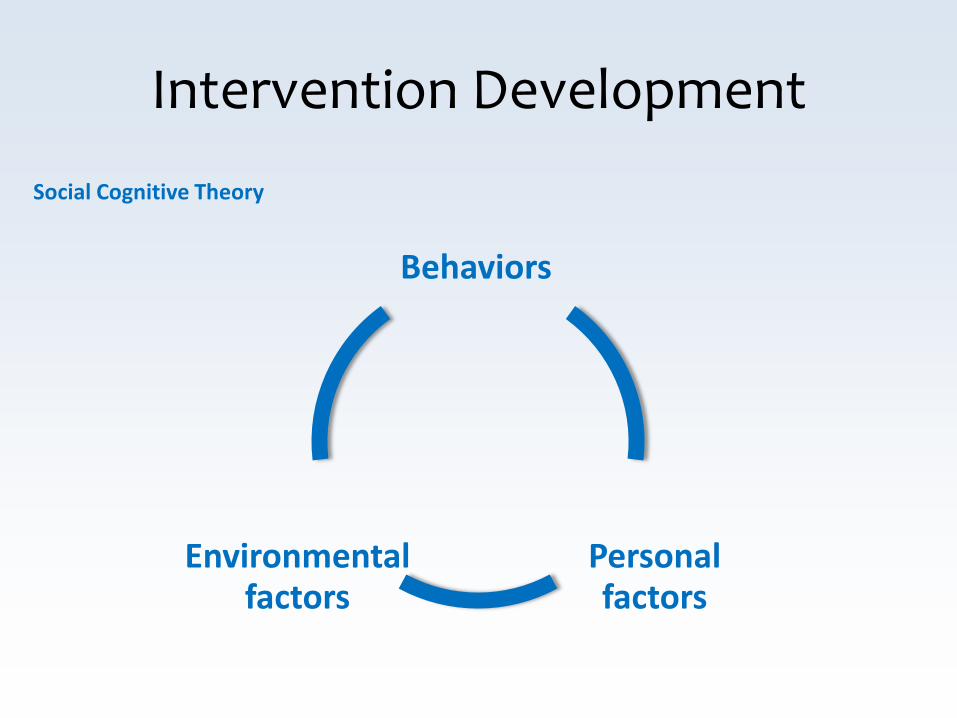
Behaviors
Personal factors
Environmental factors
Intervention Development
Social Cognitive Theory
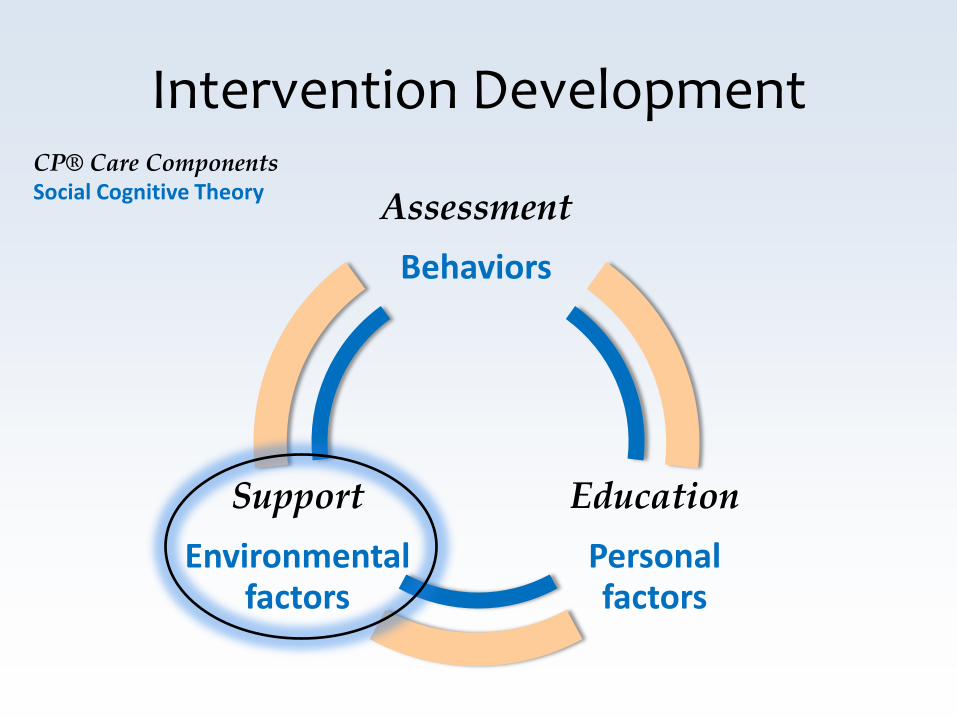
Intervention Development CP® Care Components Social Cognitive Theory Assessment
Behaviors
Education Personal factors
Support Environmental
factors
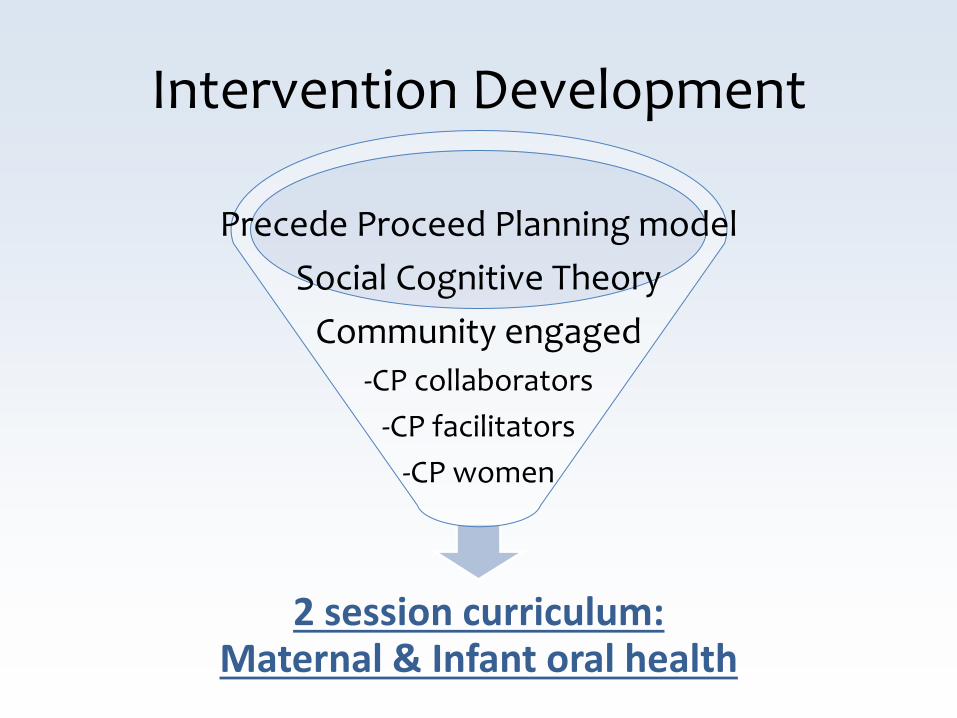
2 session curriculum: Maternal & Infant oral health
Intervention Development
Precede Proceed Planning model Social Cognitive Theory
Community engaged -CP collaborators
-CP facilitators -CP women
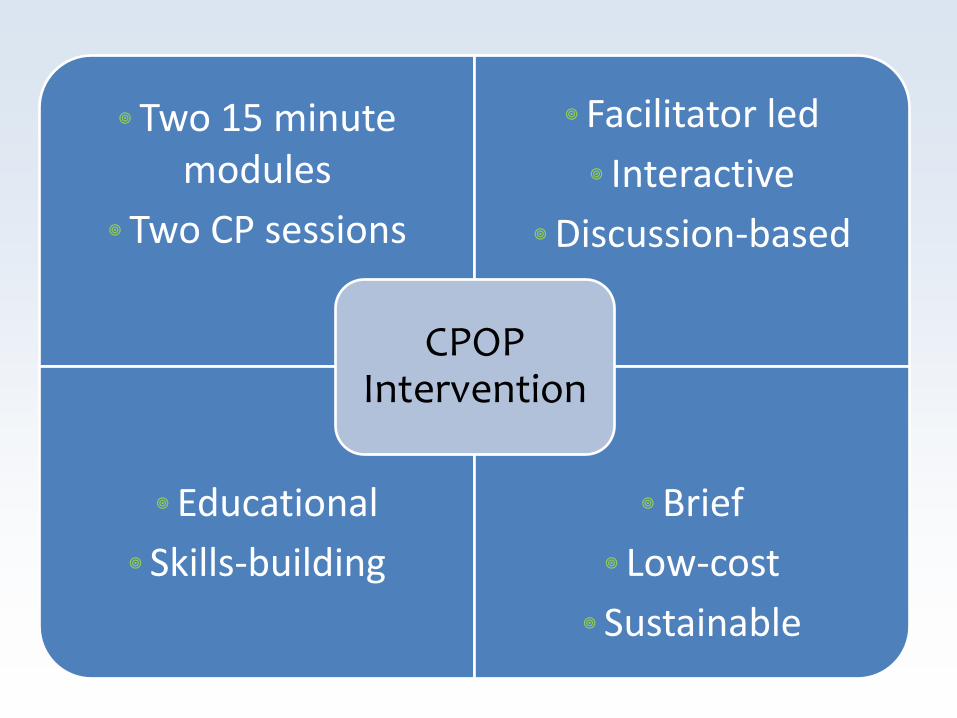
Two 15 minute modules
Two CP sessions
Facilitator led Interactive
Discussion-based
Educational Skills-building
Brief Low-cost
Sustainable
CPOP Intervention
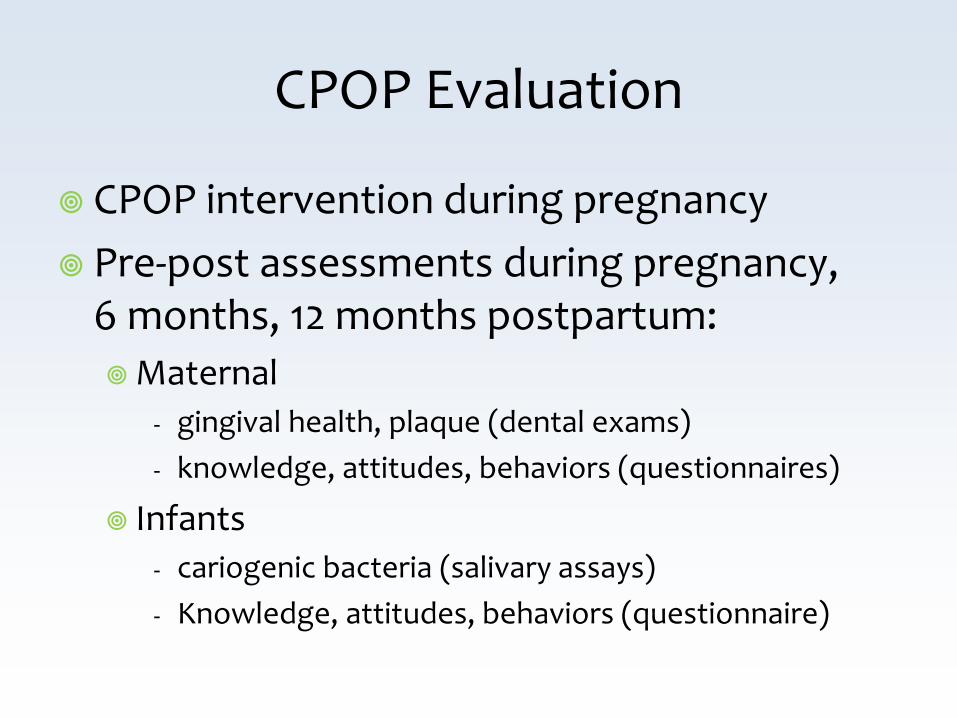
CPOP Evaluation
CPOP intervention during pregnancy Pre-post assessments during pregnancy,
6 months, 12 months postpartum: Maternal
- gingival health, plaque (dental exams) - knowledge, attitudes, behaviors (questionnaires)
Infants - cariogenic bacteria (salivary assays) - Knowledge, attitudes, behaviors (questionnaire)
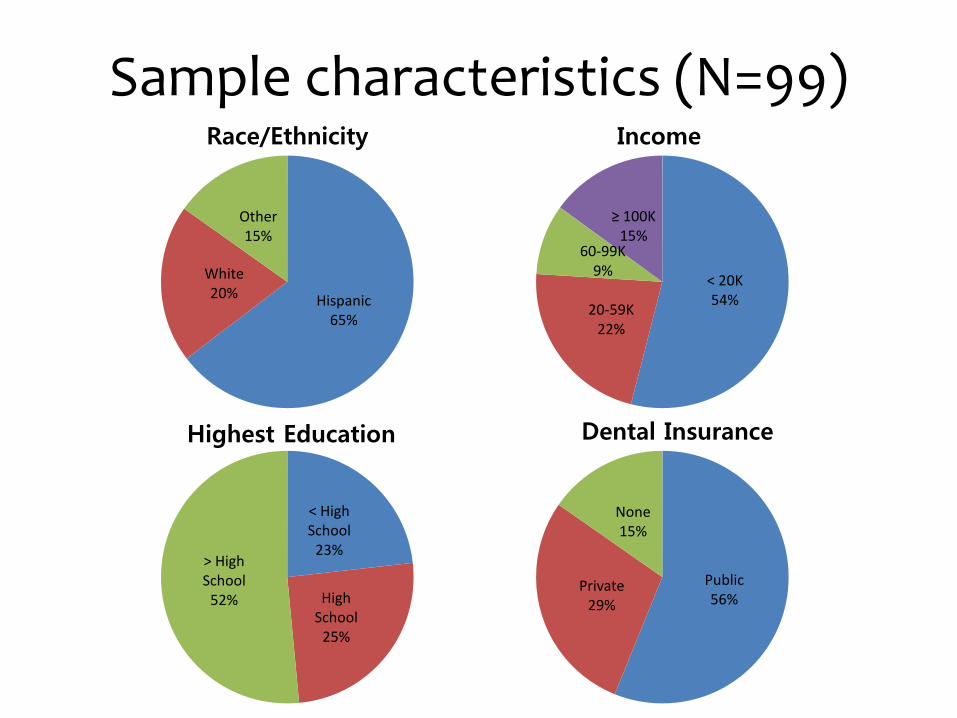
Sample characteristics (N=99)
Hispanic 65%
White 20%
Other 15%
Race/Ethnicity
< High School
23%
High School
25%
> High School
52%
Highest Education
Public 56%
Private 29%
None 15%
Dental Insurance
< 20K 54% 20-59K
22%
60-99K 9%
≥ 100K 15%
Income
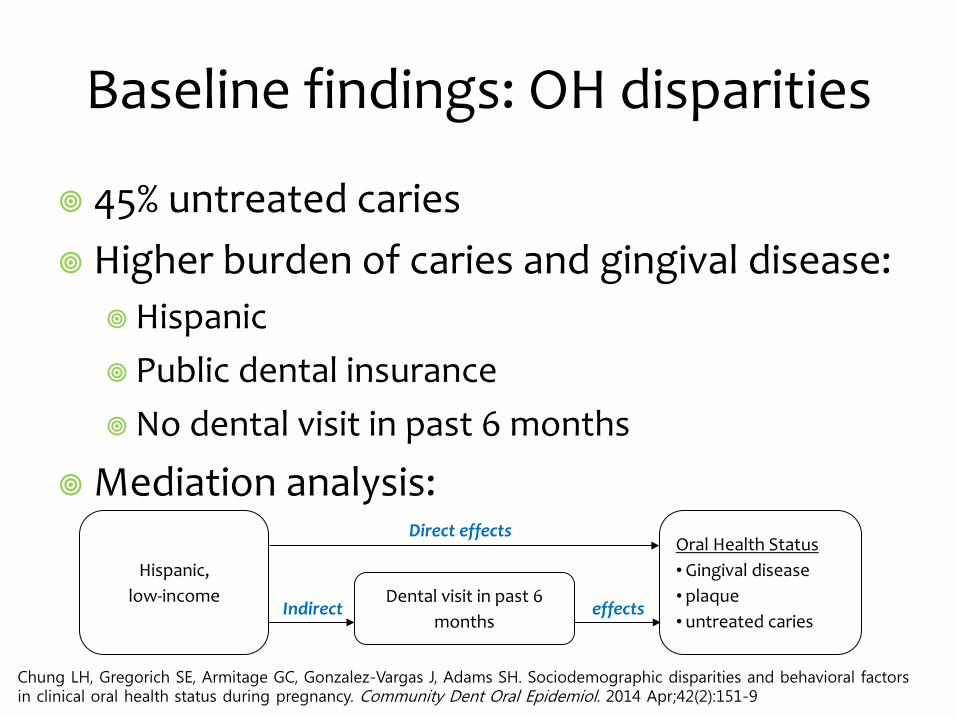
Baseline findings: OH disparities
45% untreated caries Higher burden of caries and gingival disease:
Hispanic Public dental insurance No dental visit in past 6 months
Mediation analysis:
Chung LH, Gregorich SE, Armitage GC, Gonzalez-Vargas J, Adams SH. Sociodemographic disparities and behavioral factors in clinical oral health status during pregnancy. Community Dent Oral Epidemiol. 2014 Apr;42(2):151-9
Hispanic, low-income
Oral Health Status • Gingival disease • plaque • untreated caries
Dental visit in past 6 months
Direct effects
Indirect effects
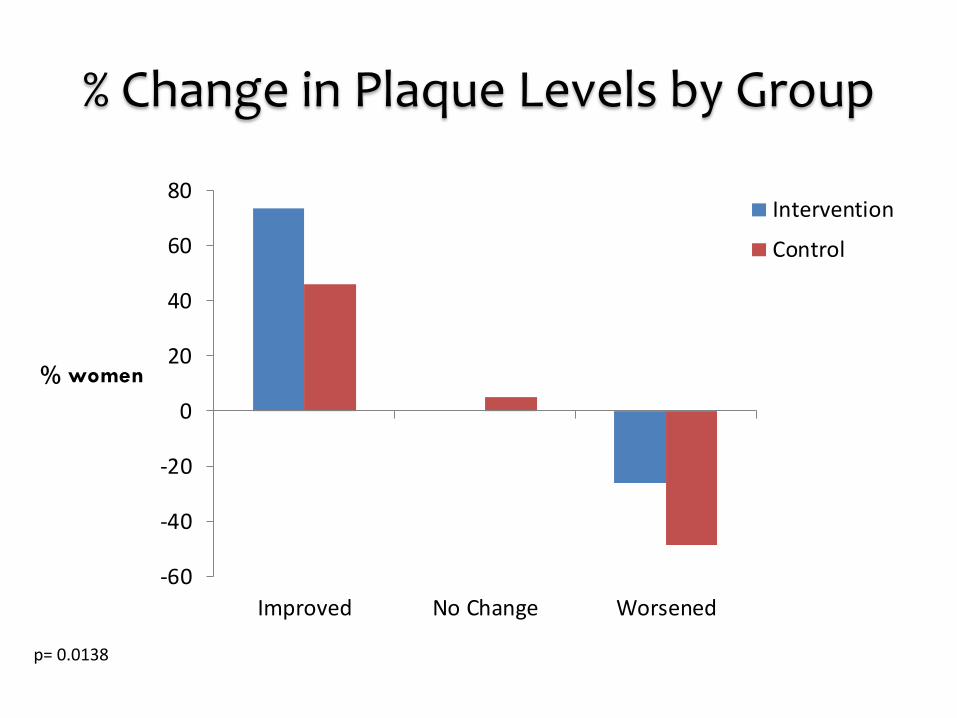
% Change in Plaque Levels by Group
-60
-40
-20
0
20
40
60
80
Improved No Change Worsened
% women
Intervention
Control
p= 0.0138
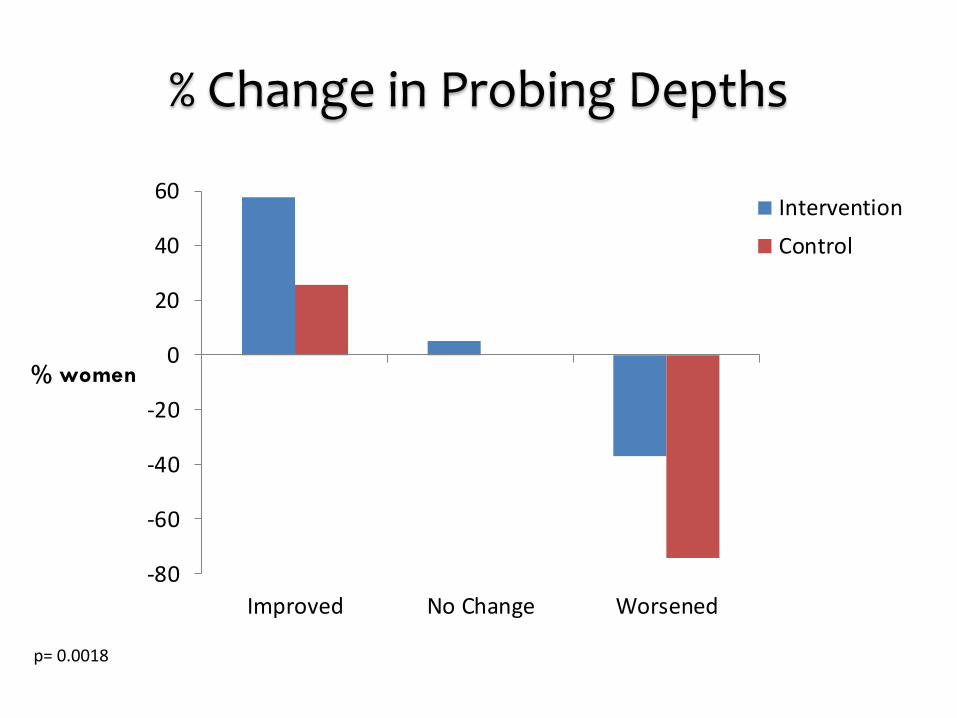
% Change in Probing Depths
-80
-60
-40
-20
0
20
40
60
Improved No Change Worsened
% women
InterventionControl
p= 0.0018
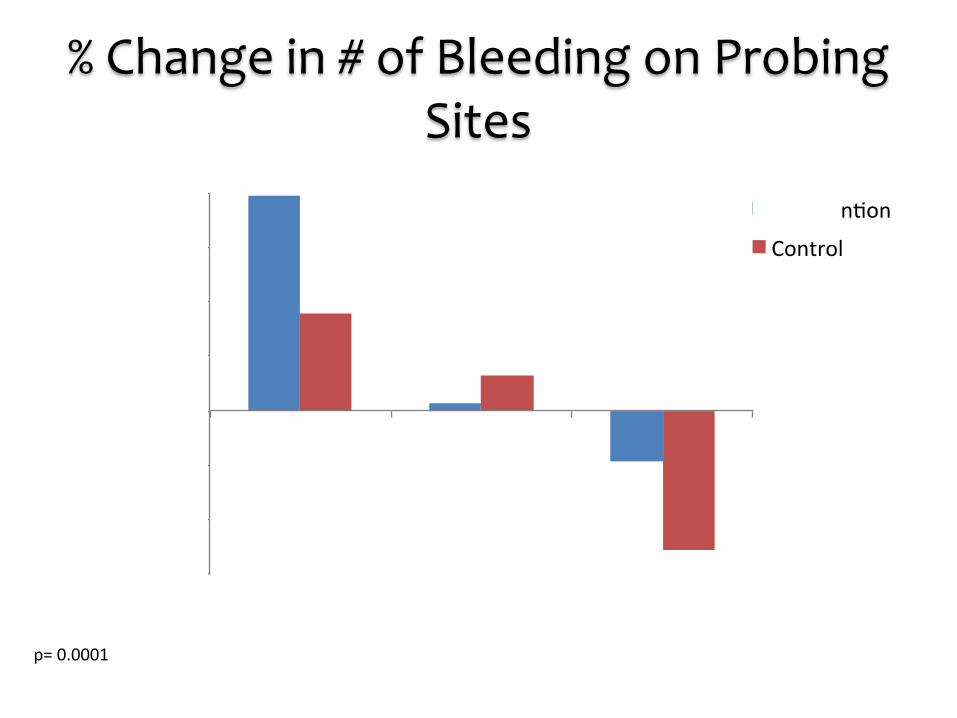
% Change in # of Bleeding on Probing Sites
p= 0.0001
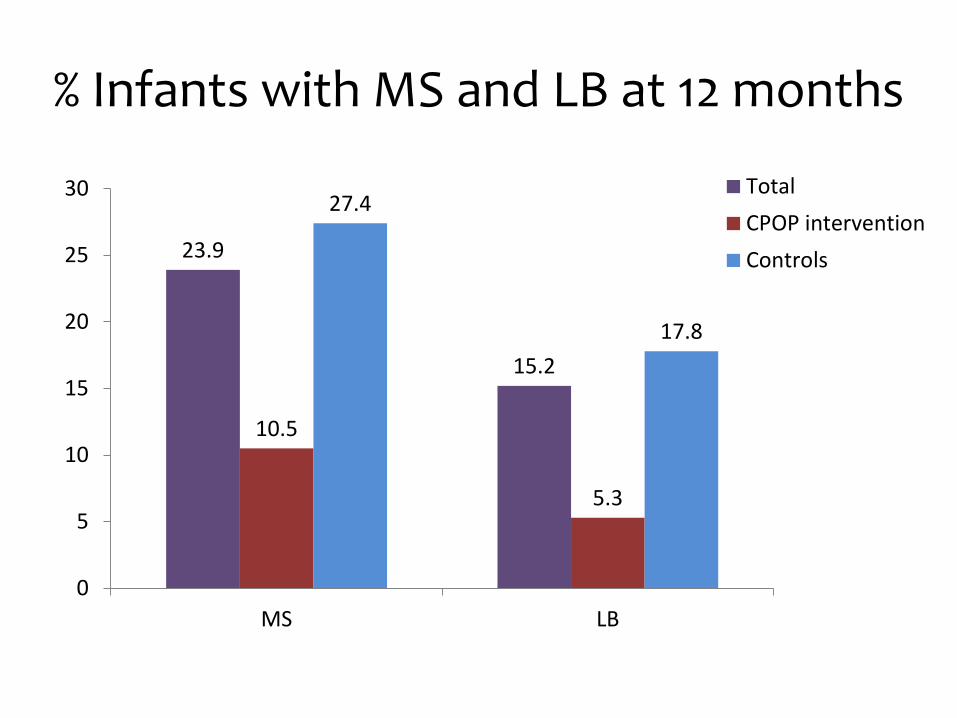
% Infants with MS and LB at 12 months
23.9
15.2
10.5
5.3
27.4
17.8
0
5
10
15
20
25
30
MS LB
TotalCPOP interventionControls
Conclusions
A brief education and skills- based intervention delivered by non-dental providers in prenatal care may be effective in improving women and children’s oral health.
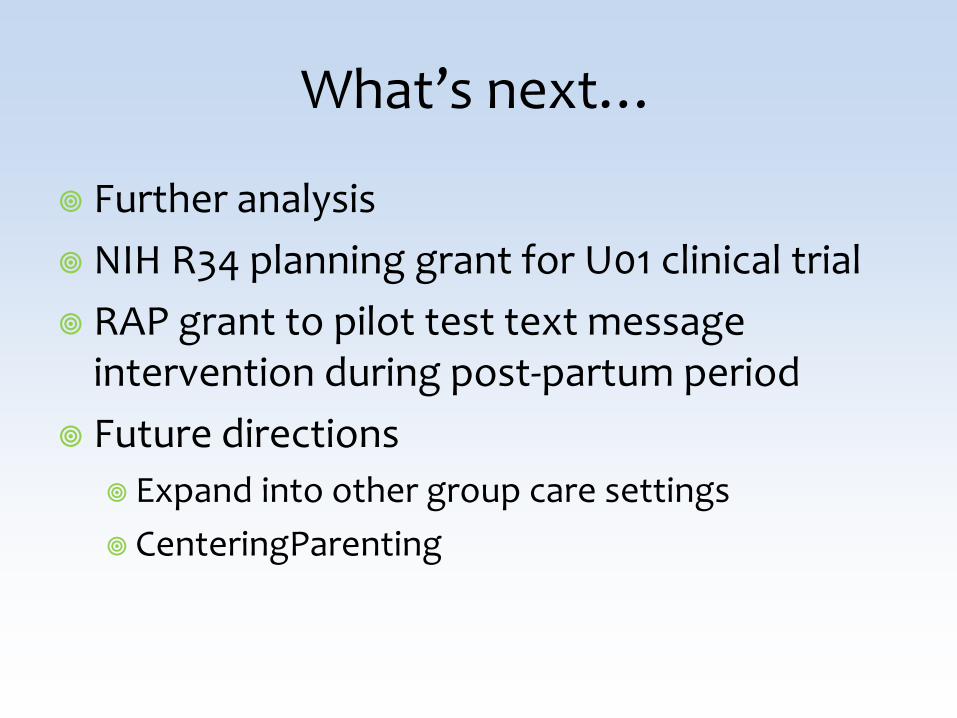
What’s next…
Further analysis NIH R34 planning grant for U01 clinical trial RAP grant to pilot test text message
intervention during post-partum period Future directions
Expand into other group care settings CenteringParenting
Acknowledgements
CPOP CP® partners: facilitators, women, Sharon Rising NIH/National Institute of Dental and Craniofacial Research
(NIDCR) Award #R21DE019211 UCSF Center to Address Disparities in Oral Health (CAN DO)
NIH/NIDCR Award #U54 DE019285 Dental Trade Alliance Foundation
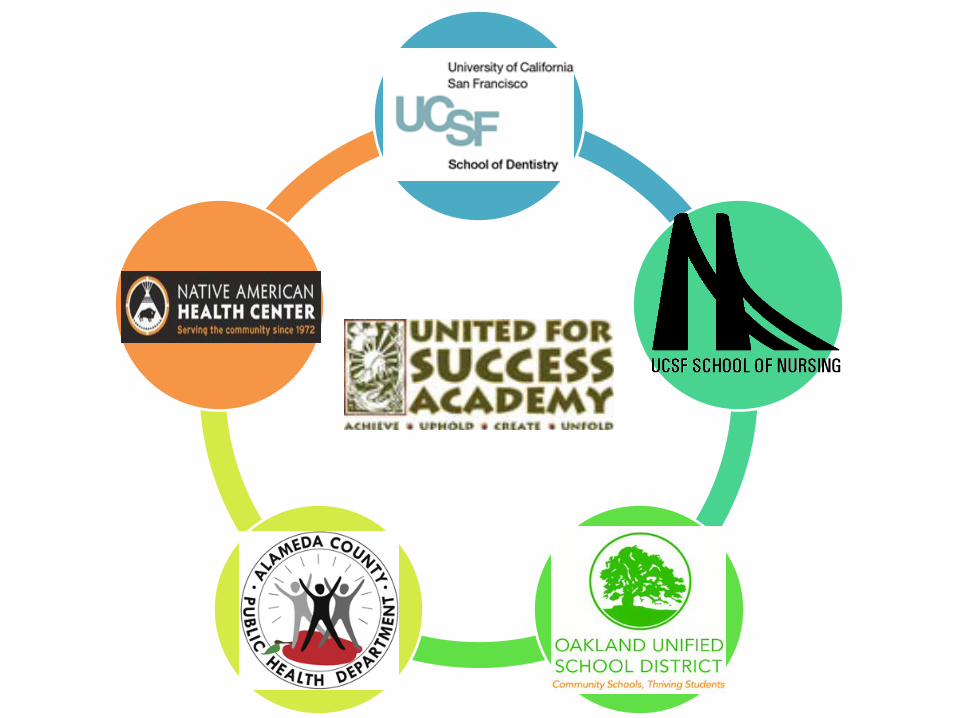
CAMBRA in Schools Elev8 partners: Native American Health Center Oakland,
United for Success Academy, UCSF School of Nursing Atlantic Philanthropies American Association for Dental Research