


Languages
Pages
Legal

FY2019 Results AnnouncementAnalyst Briefing: Fourth Quarter ended 30 June 201927 Aug 2019

Sime Darby BerhadGroup Results
2
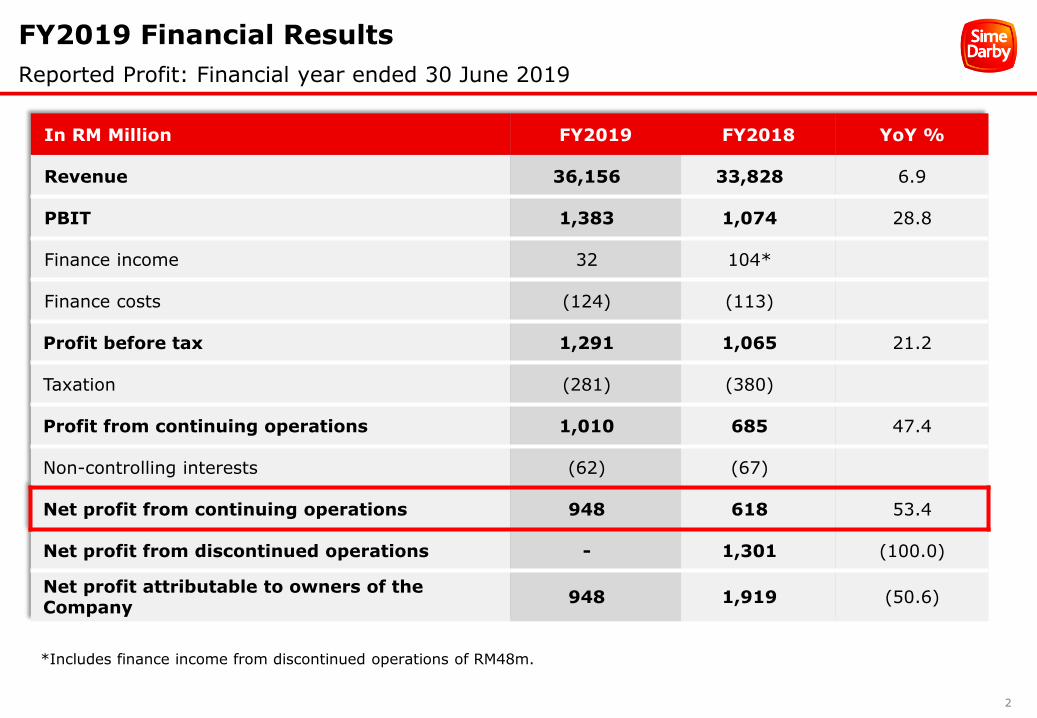
FY2019 Financial Results
Reported Profit: Financial year ended 30 June 2019
In RM Million FY2019 FY2018 YoY %
Revenue 36,156 33,828 6.9
PBIT 1,383 1,074 28.8
Finance income 32 104*
Finance costs (124) (113)
Profit before tax 1,291 1,065 21.2
Taxation (281) (380)
Profit from continuing operations 1,010 685 47.4
Non-controlling interests (62) (67)
Net profit from continuing operations 948 618 53.4
Net profit from discontinued operations - 1,301 (100.0)
Net profit attributable to owners of the Company
948 1,919 (50.6)
*Includes finance income from discontinued operations of RM48m.
3
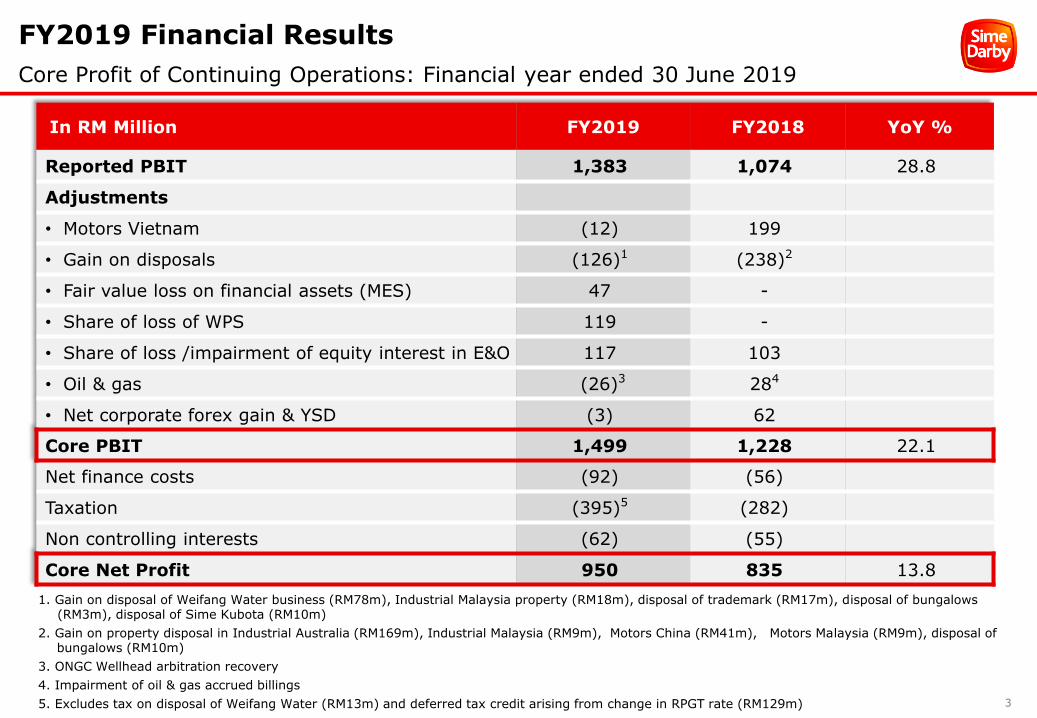
FY2019 Financial Results
Core Profit of Continuing Operations: Financial year ended 30 June 2019
In RM Million FY2019 FY2018 YoY %
Reported PBIT 1,383 1,074 28.8
Adjustments
• Motors Vietnam (12) 199
• Gain on disposals (126)1 (238)2
• Fair value loss on financial assets (MES) 47 -
• Share of loss of WPS 119 -
• Share of loss /impairment of equity interest in E&O 117 103
• Oil & gas (26)3 284
• Net corporate forex gain & YSD (3) 62
Core PBIT 1,499 1,228 22.1
Net finance costs (92) (56)
Taxation (395)5 (282)
Non controlling interests (62) (55)
Core Net Profit 950 835 13.8
1. Gain on disposal of Weifang Water business (RM78m), Industrial Malaysia property (RM18m), disposal of trademark (RM17m), disposal of bungalows (RM3m), disposal of Sime Kubota (RM10m)
2. Gain on property disposal in Industrial Australia (RM169m), Industrial Malaysia (RM9m), Motors China (RM41m), Motors Malaysia (RM9m), disposal of bungalows (RM10m)
3. ONGC Wellhead arbitration recovery
4. Impairment of oil & gas accrued billings
5. Excludes tax on disposal of Weifang Water (RM13m) and deferred tax credit arising from change in RPGT rate (RM129m)

4
FY2019 Financial Results
Segmental PBIT: Financial year ended 30 June 2019
Adjustments :
1. Gain on disposal of property (RM18m), fair value loss on financial asset (RM47m), gain on disposal of Sime Kubota (RM10m)
2. Profit from Motors Vietnam (RM12m)
3. Gain on disposal of Weifang Water (RM78m), Share of losses of Weifang Port Services (RM119m)
4. Share of losses of E&O (RM117m), ONGC recovery (RM26m), gain on trademark disposal (RM17m)
5. Gain on disposal of bungalows (RM3m)
6. Gain on disposal of properties (RM178m)
7. Gain on disposal of properties (RM50m) and Vietnam losses (RM199m)
8. Impairment of Oil & Gas accrued billings (RM28m) and impairment of E&O (RM103m)
9. Includes writedown of YSD assets (RM61m), expenses (RM37m) and reversal of accruals (RM13m)
In RM Million
FY2019 FY2018 Reported PBIT
YoY %
Core PBIT
YoY %Reported
PBITAdjustments
Core PBIT
Reported PBIT
AdjustmentsCore PBIT
Industrial 798 191 817 612 (178)6 434 30.4 88.2
Motors 628 (12)2 616 543 1497 692 15.7 (11.0)
Logistics 2 413 43 74 - 74 (97.3) (41.9)
Healthcare 49 - 49 57 - 57 (14.0) (14.0)
Others (51) 744 23 (98) 1318 33 48.0 (30.3)
Corporate (46) (3)5 (49) (52) (10) (62) 11.5 21.0
Forex 3 (3) - 23 (23) - (87.0) -
YSD - - - (85) 859 - 100.0 -
PBIT 1,383 116 1,499 1,074 154 1,228 28.8 22.1

5
Q4 FY2019 Financial Results
Quarter ended 30 June 2019
In RM Million Q4 FY2019 Q4 FY2018 YoY %
Revenue 9,323 8,575 8.7
PBIT 367 354 3.7
Finance income 8 13
Finance costs (31) (26)
Profit before tax 344 341 0.9
Taxation (142) (164)
Profit after tax 202 177 14.1
Non-controlling interests (18) (14)
Net profit attributable to owners of the Company
184 163 12.9
6
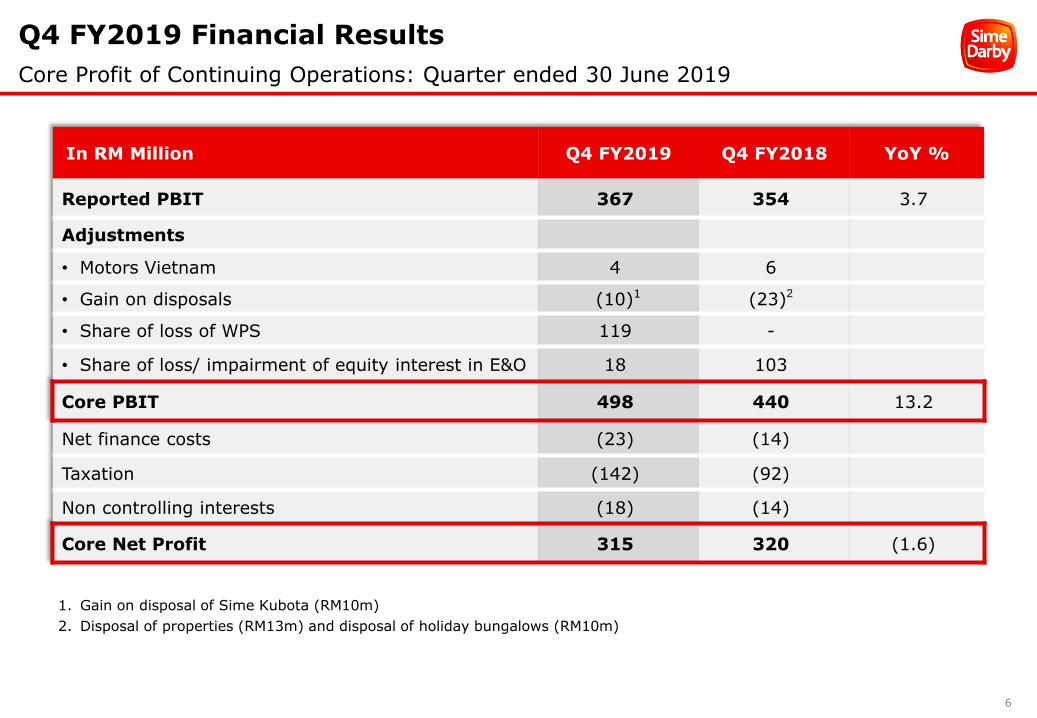
Q4 FY2019 Financial Results
Core Profit of Continuing Operations: Quarter ended 30 June 2019
1. Gain on disposal of Sime Kubota (RM10m)
2. Disposal of properties (RM13m) and disposal of holiday bungalows (RM10m)
In RM Million Q4 FY2019 Q4 FY2018 YoY %
Reported PBIT 367 354 3.7
Adjustments
• Motors Vietnam 4 6
• Gain on disposals (10)1 (23)2
• Share of loss of WPS 119 -
• Share of loss/ impairment of equity interest in E&O 18 103
Core PBIT 498 440 13.2
Net finance costs (23) (14)
Taxation (142) (92)
Non controlling interests (18) (14)
Core Net Profit 315 320 (1.6)
7
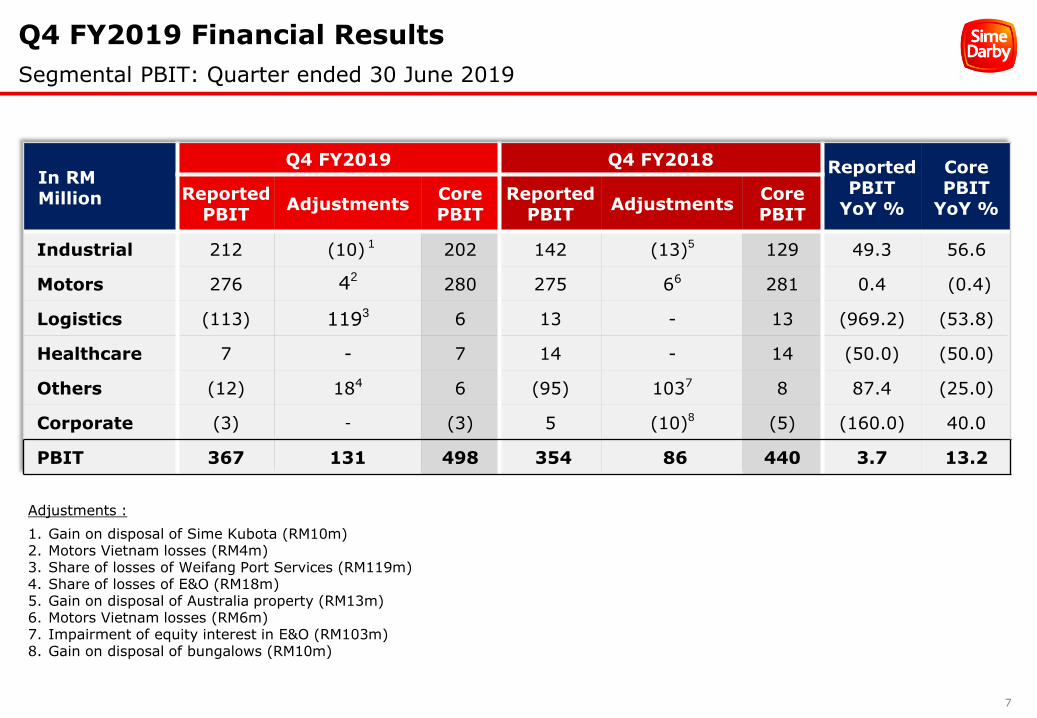
Q4 FY2019 Financial Results
Segmental PBIT: Quarter ended 30 June 2019
Adjustments :
1. Gain on disposal of Sime Kubota (RM10m)2. Motors Vietnam losses (RM4m)3. Share of losses of Weifang Port Services (RM119m)4. Share of losses of E&O (RM18m)5. Gain on disposal of Australia property (RM13m)6. Motors Vietnam losses (RM6m)7. Impairment of equity interest in E&O (RM103m)8. Gain on disposal of bungalows (RM10m)
In RM Million
Q4 FY2019 Q4 FY2018 Reported PBIT
YoY %
Core PBIT
YoY %Reported
PBITAdjustments
Core PBIT
Reported PBIT
AdjustmentsCore PBIT
Industrial 212 (10) 1 202 142 (13)5 129 49.3 56.6
Motors 276 42280 275 66 281 0.4 (0.4)
Logistics (113) 1193 6 13 - 13 (969.2) (53.8)
Healthcare 7 - 7 14 - 14 (50.0) (50.0)
Others (12) 184 6 (95) 1037 8 87.4 (25.0)
Corporate (3) - (3) 5 (10)8 (5) (160.0) 40.0
PBIT 367 131 498 354 86 440 3.7 13.2

8
3,308
2,397
212
178
31-Mar-19 30-Jun-19
ST Borrowings LT Borrowings
FY2019 Results Announcement
Snapshot of borrowings position as at 30 June 2019
RM2.6bnAs at 30 June 2019
RM1.7bnBank balances, deposits
and cash
17.03%Debt/Equity Ratio
RM15.1bnTotal Equity
T o t a l B o r r o w i n g sL o n g T e r m v s S h o r t T e r m B o r r o w i n g s
31 March 2019 30 June 2019

Segmental Results

10
Industrial Division
Increased sales and profits in Australasia
In RM Million FY2018 FY2019
Australasia 7,166 8,459
China 3,944 3,810
Malaysia 1,184 1,121
Southeast Asia 747 723
Total Revenue 13,041 14,113
Australasia 209 545
China 161 188
Malaysia 37 24
Southeast Asia 27 60
Total Core PBIT 434 817
Disposal of properties & Sime Kubota
178 28
FV loss on Financial Asset - (47)
Total PBIT 612 798
PBIT margin 4.7% 5.7%
Core PBIT margin 3.3% 5.8%
ROIC 7.9% 10.5%
A u s t r a l a s i a
• Higher equipment deliveries to both mining and construction sectors
• Higher margins from parts and services
• Contribution from Hardchrome since Dec 2018 - RM15m
• Results partly offset by the weakening of AUD/MYR by 7% from 3.16 to 2.95 and fair value loss on financial assets of RM47 million
C h i n a
• Higher margins compensated for the weaker RMB by 3%from 0.626 to 0.605
• Better margin realization from engines and productsupport and CAT subsidy claim
M a l a y s i a
• Lower CAT equipment deliveries to the construction sector
• Improved contribution from power systems and services
• Includes restructuring cost of RM12m (FY2018 – RM3m) and YSD donation of RM10m (FY2018 – RM5m)
S o u t h E a s t A s i a
• Lower equipment deliveries to the construction sector compensated by higher product support sales with better margins in Singapore
• Share of losses from associates of RM1m (FY2018 –RM17m)
P r o p e r t y D i s p o s a l s
• RM18m gain on disposal of a property in Malaysia in FY2019
• RM169m in Australia and RM9m in Malaysia in FY2018
+8.2%
13,041 14,113
Revenue
612
798
PBITJun-18 Jun-19
+30.4%
11
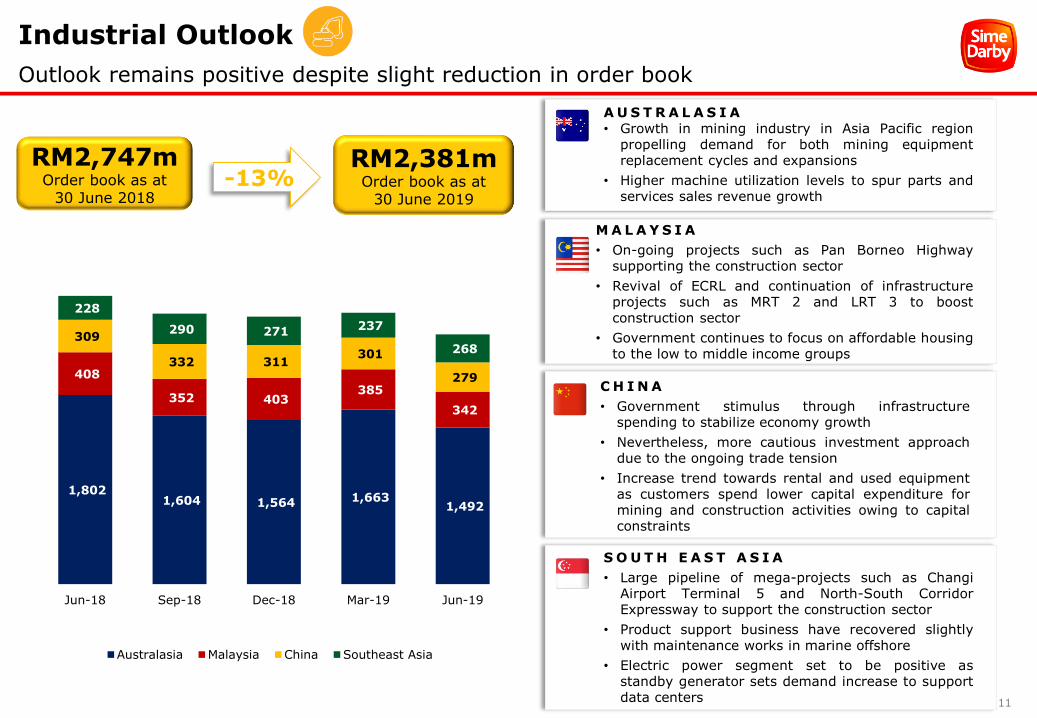
Industrial Outlook
Outlook remains positive despite slight reduction in order book
RM2,381mOrder book as at
30 June 2019
-13%
A U S T R A L A S I A• Growth in mining industry in Asia Pacific region
propelling demand for both mining equipmentreplacement cycles and expansions
• Higher machine utilization levels to spur parts andservices sales revenue growth
M A L A Y S I A
• On-going projects such as Pan Borneo Highwaysupporting the construction sector
• Revival of ECRL and continuation of infrastructureprojects such as MRT 2 and LRT 3 to boostconstruction sector
• Government continues to focus on affordable housingto the low to middle income groups
C H I N A
• Government stimulus through infrastructurespending to stabilize economy growth
• Nevertheless, more cautious investment approachdue to the ongoing trade tension
• Increase trend towards rental and used equipmentas customers spend lower capital expenditure formining and construction activities owing to capitalconstraints
S O U T H E A S T A S I A
• Large pipeline of mega-projects such as ChangiAirport Terminal 5 and North-South CorridorExpressway to support the construction sector
• Product support business have recovered slightlywith maintenance works in marine offshore
• Electric power segment set to be positive asstandby generator sets demand increase to supportdata centers
RM2,747mOrder book as at
30 June 2018
1,802 1,604 1,564 1,663
1,492
408
352 403 385
342
309
332 311 301
279
228
290 271 237
268
Jun-18 Sep-18 Dec-18 Mar-19 Jun-19
Australasia Malaysia China Southeast Asia

12
20,341 21,606
RevenueJun-18 Jun-19
543
628
PBIT
Motors Division
Intensifying competition in major markets
In RM Million FY2018 FY2019
China, HK, Macau & Taiwan 8,672 10,398
Singapore & Thailand 5,127 4,493
Malaysia 3,576 3,935
Australia & NZ 2,897 2,779
Vietnam 69 1
Total Revenue 20,341 21,606
China, HK, Macau & Taiwan 236 235
Singapore & Thailand 121 36
Malaysia 210 247
Australia & NZ 125 98
Total Core PBIT 692 616
VietnamProperty disposal/compensation
(199)50
12-
Total PBIT 543 628
PBIT margin 2.7% 2.9%
Core PBIT margin 3.4% 2.9%
ROIC 9.2% 10.1%
C h i n a , H K , M a c a u , T a i w a n
• Higher units of BMW and Super Luxury vehicles sold in China, however margins for BMW operations were lower due to competitive market.
• Lower margins from after-sales operations from BMW and multi-franchise operations in HK
• Taiwan recorded LBIT (RM26m) in FY2019 vs (RM29m) in FY2018 - Improved margins and lower marketing expenses
S i n g a p o r e , T h a i l a n d
• Lower sales and margins in Singapore due to the competitive market
• Lower units of Ford vehicles sold in Thailand
M a l a y s i a
• Higher sales volume from BMW and Ford (FY2019: 16,872 units vs FY2018: 16,611 units)
• Increased contribution from car rental and engine assembly, partly offset by YSD donation of RM10m in FY2019 (FY2018 –RM5m)
A u s t r a l i a , N Z
• Aus - Lower sales and margins from BMW Brisbane
• NZ – Lower units sold and margins from retail operations
V i e t n a m
• Includes tax and duties refund in FY2019
• Impairment of distribution rights (RM61m) and write-down of inventories (RM89m) in FY2018
+6.2% +15.7%
13
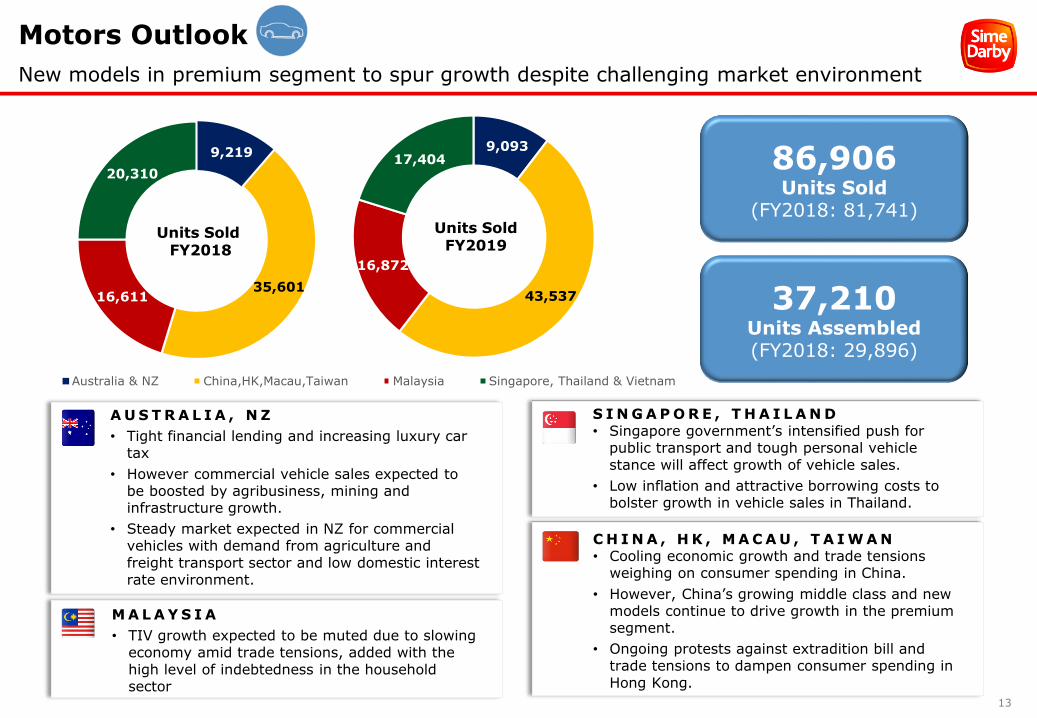
9,093
43,537
16,872
17,404
Units SoldFY2019
Motors Outlook
New models in premium segment to spur growth despite challenging market environment
86,906Units Sold
(FY2018: 81,741)
37,210Units Assembled(FY2018: 29,896)
C H I N A , H K , M A C A U , T A I W A N• Cooling economic growth and trade tensions
weighing on consumer spending in China.
• However, China’s growing middle class and new models continue to drive growth in the premium segment.
• Ongoing protests against extradition bill and trade tensions to dampen consumer spending in
Hong Kong.
S I N G A P O R E , T H A I L A N D• Singapore government’s intensified push for
public transport and tough personal vehicle
stance will affect growth of vehicle sales.
• Low inflation and attractive borrowing costs to bolster growth in vehicle sales in Thailand.
M A L A Y S I A
• TIV growth expected to be muted due to slowing economy amid trade tensions, added with the
high level of indebtedness in the household sector
A U S T R A L I A , N Z
• Tight financial lending and increasing luxury car tax
• However commercial vehicle sales expected to be boosted by agribusiness, mining and infrastructure growth.
• Steady market expected in NZ for commercial vehicles with demand from agriculture and
freight transport sector and low domestic interest rate environment.
9,219
35,601 16,611
20,310
Australia & NZ China,HK,Macau,Taiwan Malaysia Singapore, Thailand & Vietnam
Units Sold FY2018
14
Motors Outlook
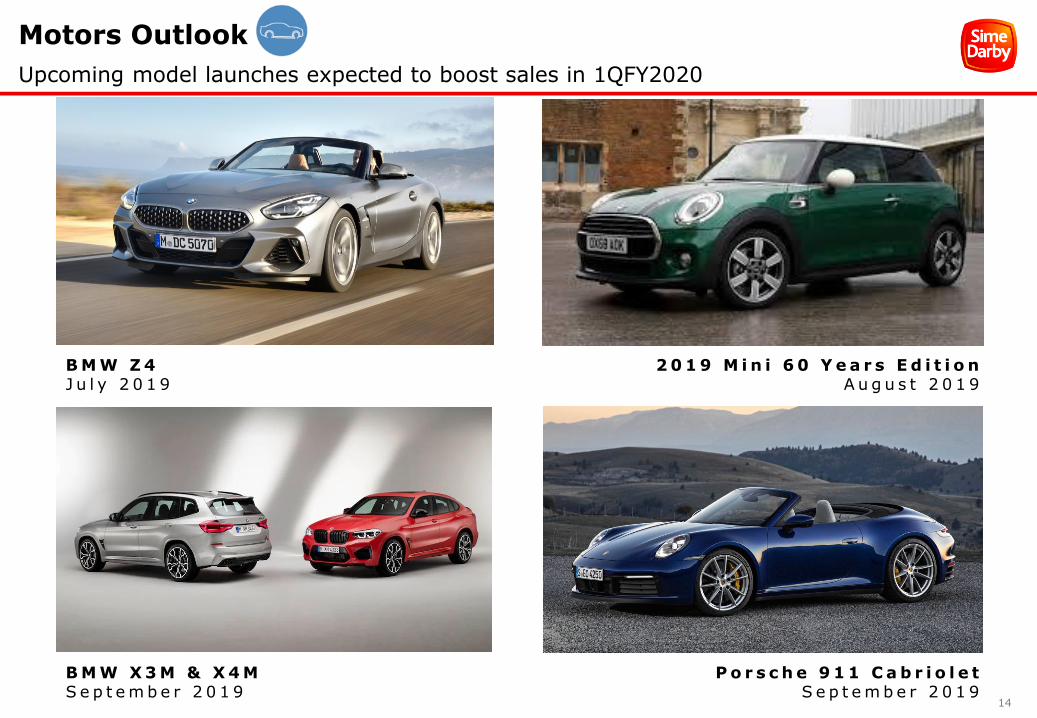
Upcoming model launches expected to boost sales in 1QFY2020
B M W Z 4J u l y 2 0 1 9
B M W X 3 M & X 4 MS e p t e m b e r 2 0 1 9
2 0 1 9 M i n i 6 0 Y e a r s E d i t i o nA u g u s t 2 0 1 9
P o r s c h e 9 1 1 C a b r i o l e tS e p t e m b e r 2 0 1 9

15
74
2
PBIT
341
283
RevenueJun-18 Jun-19
-17.0%-97.3%
Logistics and Healthcare
Logistics results weighted down by impairment; modest growth from healthcare operations
Logistics Healthcare
In RM Million FY2018 FY2019
Ports 275 264
Water 66 19
Total Revenue 341 283
Ports 44 41
Water 28 9
Forex 2 (7)
Total Core PBIT 74 43
Gain on disposal - 78
Share of loss of WPS
- (119)
Total PBIT 74 2
Core PBIT margin 21.7% 15.2%
ROIC 3.2% 0.1%
272,435 TEUContainer throughput(FY2018: 240,536 TEU)
30.3 million MTGeneral cargo throughput(FY2018: 32.6 million MT)
In RM Million
FY2018 FY2019
Healthcare PBIT
57 49
Healthcare ROIC
7.8% 6.3%
• Current period includes highertax expense
• Higher revenue from Malaysiaand Indonesia operations
-14.0%
57
49
Healthcare PBIT
Jun-18 Jun-19
P o r t s
• Weaker performance due to lower throughput at ports
• Weifang Port Services share of loss of RM119m
W a t e r
• Recorded 3 months contribution prior to disposal in September 2018.
• Gain on disposal of RM 78m.
F o r e x
• Mainly from translation of RMB loans to HKD given to JVs

16
Disclaimer
This presentation does not constitute and is not an offer to sell or the solicitation of an offer to buy securities of any company referred to in this
presentation in the United States or elsewhere. The companies referred to herein have not registered and do not intend to register any
securities under the US Securities Act of 1933, as amended (the “Securities Act”), and any securities may not be offered or sold in the United
States absent registration under the Securities Act or an exemption from registration under the Securities Act. By attending the presentation
you will be deemed to represent, warrant and agree that to the extent that you purchase any securities in any of the companies referred to in
the presentation, you either (i) are a "qualified institutional buyer" within the meaning of Rule 144A under the Securities Act, or (ii) you will do
so in an "offshore transaction" within the meaning of Regulation S under the Securities Act.
This presentation may contain forward-looking statements by Sime Darby Berhad that reflect management’s current expectations, beliefs,
intentions or strategies regarding the future and assumptions in light of currently available information. These statements are based on various
assumptions and made subject to a number of risks, uncertainties and contingencies. Actual results, performance or achievements may differ
materially and significantly from those discussed in the forward-looking statements. Such statements are not and should not be construed as a
representation, warranty or undertaking as to the future performance or achievements of Sime Darby Berhad and Sime Darby Berhad assumes
no obligation or responsibility to update any such statements.
No representation or warranty (either express or implied) is given by or on behalf of Sime Darby Berhad or its related corporations (including
without limitation, their respective shareholders, directors, officers, employees, agents, partners, associates and advisers) (collectively, the
"Parties") as to the quality, accuracy, reliability or completeness of the information contained in this presentation (collectively, the
"Information"), or that reasonable care has been taken in compiling or preparing the Information.
None of the Parties shall be liable or responsible for any budget, forecast or forward-looking statements or other projections of any nature or
any opinion which may have been expressed or otherwise contained or referred to in the Information.
The Information is and shall remain the exclusive property of Sime Darby Berhad and nothing herein shall give, or shall be construed as giving,
to any recipient(s) or party any right, title, ownership, interest, license or any other right whatsoever in or to the Information herein. The
recipient(s) acknowledges and agrees that this presentation and the Information are confidential and shall be held in complete confidence by the
recipient(s).
This presentation is for the purposes of information only and no part of this presentation is intended to be or shall be construed as an offer,
recommendation or invitation to subscribe for or purchase, or otherwise making available, any securities in Sime Darby Berhad.

17
Thank you

Appendices
19
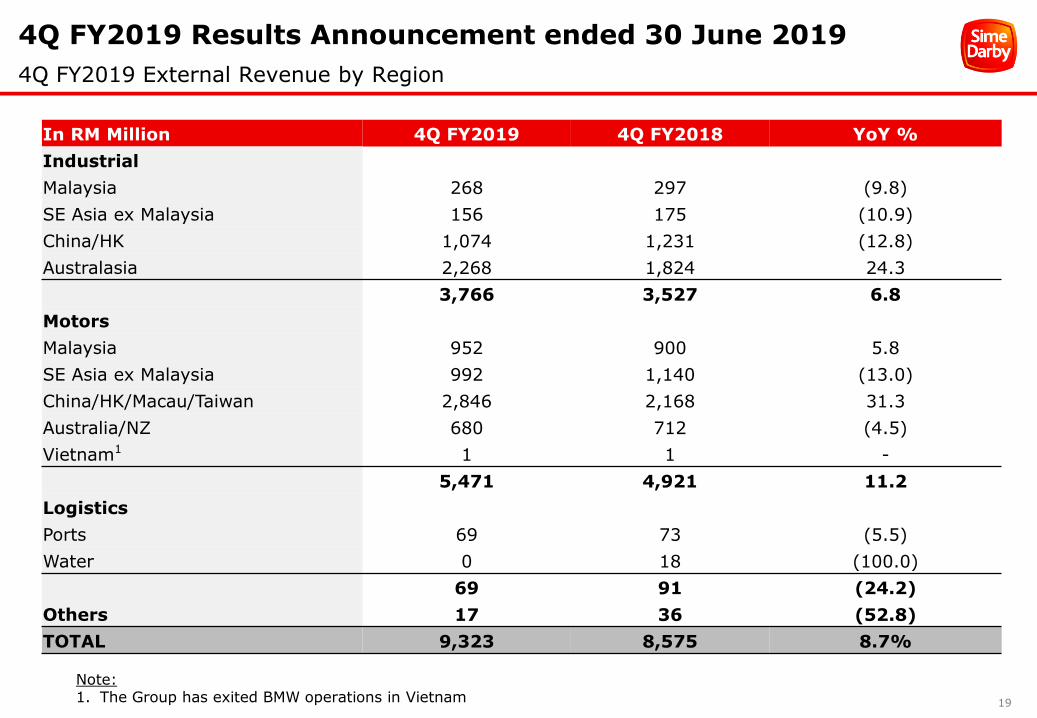
4Q FY2019 Results Announcement ended 30 June 2019
4Q FY2019 External Revenue by Region
Note:1. The Group has exited BMW operations in Vietnam
In RM Million 4Q FY2019 4Q FY2018 YoY %
Industrial
Malaysia 268 297 (9.8)
SE Asia ex Malaysia 156 175 (10.9)
China/HK 1,074 1,231 (12.8)
Australasia 2,268 1,824 24.3
3,766 3,527 6.8
Motors
Malaysia 952 900 5.8
SE Asia ex Malaysia 992 1,140 (13.0)
China/HK/Macau/Taiwan 2,846 2,168 31.3
Australia/NZ 680 712 (4.5)
Vietnam1 1 1 -
5,471 4,921 11.2
Logistics
Ports 69 73 (5.5)
Water 0 18 (100.0)
69 91 (24.2)
Others 17 36 (52.8)
TOTAL 9,323 8,575 8.7%
20
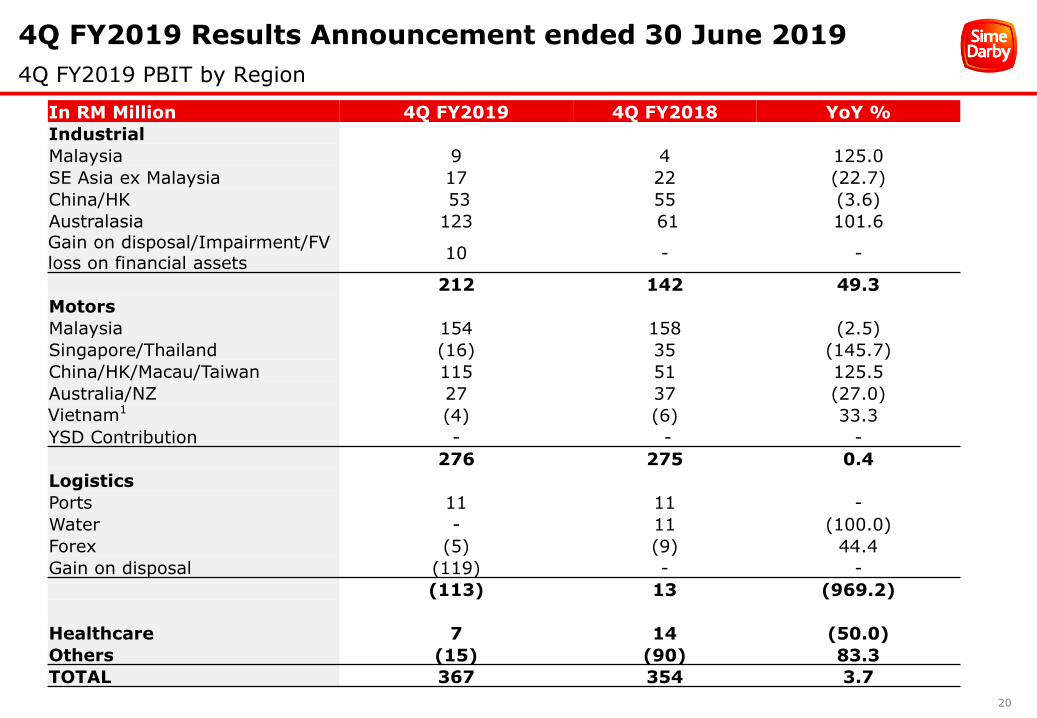
In RM Million 4Q FY2019 4Q FY2018 YoY %
Industrial
Malaysia 9 4 125.0
SE Asia ex Malaysia 17 22 (22.7)
China/HK 53 55 (3.6)
Australasia 123 61 101.6Gain on disposal/Impairment/FV loss on financial assets
10 - -
212 142 49.3
Motors
Malaysia 154 158 (2.5)
Singapore/Thailand (16) 35 (145.7)
China/HK/Macau/Taiwan 115 51 125.5
Australia/NZ 27 37 (27.0)
Vietnam1 (4) (6) 33.3
YSD Contribution - - -
276 275 0.4
Logistics
Ports 11 11 -
Water - 11 (100.0)
Forex (5) (9) 44.4
Gain on disposal (119) - -
(113) 13 (969.2)
Healthcare 7 14 (50.0)
Others (15) (90) 83.3
TOTAL 367 354 3.7
4Q FY2019 Results Announcement ended 30 June 2019
4Q FY2019 PBIT by Region

21
Thank you
Top Related