


Languages
Pages
Legal


SHARE PLEDGING AND ITS CONSEQUENCES:A STUDY OF INDIAN FIRMS
TSCFE WHITE PAPER SERIESNO. 007, SEPTEMBER 2021
AUTHORS
NUPUR PAVAN BANGSOUGATA RAY
NANDIL BHATIAKAVIL RAMACHANDRAN
THOMAS SCHMIDHEINY CENTRE FOR FAMILY ENTERPRISEINDIAN SCHOOL OF BUSINESS
©TSCFE. All rights reserved. Short sections of text, not to exceed two paragraphs, may be quoted without explicit permission. Full credit should be given along with appropriate citation, even if
the content of this white paper is paraphrased.
Thomas SchmidheinyCentre for Family Enterprise

1
CONTENTS
EXECUTIVE SUMMARY .......................................................................................................... 2
1. INTRODUCTION..................................................................................................................... 3
2. THE MECHANISM OF PLEDGING .................................................................................... 5
3. BACKGROUND AND THE STIGMA ................................................................................... 6
4. DATA AND METHODS ........................................................................................................ 10
5. FIRM VALUE ......................................................................................................................... 11
6. EQUITY RISK AND RISK-AVERSION ............................................................................. 14
7. SHARE PLEDGING AND LOSS OF CONTROL .............................................................. 17
8. PLEDGING AS A BENEFICIAL TOOL FOR PROMOTERS ........................................ 18
9. FINDINGS, IMPLICATIONS AND CONCLUSIONS ....................................................... 20
FINDINGS ................................................................................................................................... 20
IMPLICATIONS ........................................................................................................................... 22
CONCLUSION ............................................................................................................................. 23
10. REFERENCES ...................................................................................................................... 25
APPENDIX 1: IDENTIFICATION OF FAMILY FIRMS ..................................................... 26
APPENDIX 2: OWNERSHIP CLASSIFICATIONS .............................................................. 28

2
EXECUTIVE SUMMARY
In a bid to further the understanding of family firms in India, Thomas Schmidheiny Centre for
Family Enterprise, Indian School of Business, carries out in depth, relevant and timely research on
various topics concerning family firms. This is another such attempt. The objective of this study
is to ascertain the implications of share pledging on different types of firms in India, with special
focus on family firms. The various scandals, loss of control of the firm by family promoters,
regulatory responses and warnings led to the common perception that all share pledges by
promoters are bad. Existing empirical research around pledging of shares has also failed to account
for the heterogeneity among the possible use-cases of capital obtained from pledging of shares.
The report calls for more nuanced studies on pledging to explore this anomaly contextually and to
avoid painting all cases with the same brush.
Using data for 1,492 firms listed on the National Stock Exchange of India from 2009 to
2019, the study finds a decline in firm value, higher crash risk and underinvestment in innovation
by firms where promoters of family firms pledge their shares. Interestingly, both the degree of
pledging and the associated governance consequences are comparatively subdued for non-family
firms. We do not find a significant difference in the observed consequences of pledging between
standalone family firms and family firms associated with business groups. The study also shows
how some firms have utilized share pledging by family promoters as a tool to raise capital for
strategic projects and create value for the stakeholders.
We raise calls for investors, regulators, and the family to closely evaluate the phenomenon
of pledging due to its significant impact on the firm’s value and governance mechanisms. We
provide a clarion call for acknowledging that it is an important tool to access financial capital for
family promoters. It acts as an important resource to promote entrepreneurial financing amongst
family businesses and as a source of fund to turnaround the family firm if it is in trouble. Future
studies on share pledging by family promoters must closely evaluate the risks, rewards and
motivations of the promoters when pledging their shares. Along with large sample data driven
research, there is a need for case study based research on pledging in order to understand the
nuanced variations in promoter choices and causes and consequences of the same.

3
SHARE PLEDGING AND ITS CONSEQUENCES: A STUDY OF INDIAN FIRMS
1. INTRODUCTION
Pledging of shares, that is, the use of shares held in a company as collateral to avail loans, is a
popular tool for promoters (primary shareholders of a firm) to raise funds in times when credit
access is limited to them. Promoters utilize funds obtained from pledging for a variety of reasons.
They may use the proceeds of pledging to advance interests of the same firms, or any other firms
owned by the promoters, to create new business ventures or for other personal uses. Despite the
popularity of pledging among promoters as a legitimate tool to raise funds, it is generally
stigmatized as the popular view on pledging seems to be quite negative.
The commonly peddled negative narrative on pledging often dissuades fact based,
informed, balanced, and nuanced debates on its utility, causes and consequences, backed by
rigorous research in spite of its ubiquity in India and many other economies of the world. In a rare
attempt Dou, Masulis & Zein (2019) recently reported pledging in Taiwanese firms and detailed
out the performance and governance implications of pledging by insiders (such as managers and
firm directors). India as a high growth big emerging economy provides a much richer context than
Taiwan to study the phenomenon of pledging due to the omnipresence of heterogenous individual
and multigenerational family promoters, the dominance of business group structure and a
reasonably diverse and robust capital market aided by progressively improving institutional
framework.
Promoters of family as well as non-family firms in India hold significant stakes in the firm
(often greater than 50 percent), and exercise enormous control over the firm’s operations (Bang,
Ray, Ramachandran, & Vishwanathan, 2018). It has been widely reported in popular press that
despite the high family shareholding and managerial control, promoters of family firms, such as
Zee Entertainment, Reliance ADA Group and Café Coffee Day, that had pledged shares of their
firms, had lost ownership and sometimes management control of their firms, destroyed
considerable family wealth and resulted in significant loss of wealth for non-family investors.
However, anecdotal evidences also suggest that several family firms or business groups such as
Asian Paints, Apollo Hospitals, Granules India and Laurus Labs benefitted significantly from

4
judicious use of pledging by the family promoters. Evidently, concentrated shareholding implies
high personal stake for the family promoters in the firm and their decision to pledge also has an
impact on the wealth of other shareholders. These contrasting anecdotal evidences on the impact
of pledging by promoters on the fortune of the firms and paradox of substantial negative perception
of pledging, yet it’s popularity, pique our interest to study its consequences in depth.
In a bid to further the understanding of family firms in India, Thomas Schmidheiny Centre
for Family Enterprise (TSCFE), Indian School of Business, carries out in depth, relevant and
timely research on various topics concerning family firms. This is another such attempt. The
objective of this study is to ascertain the implications of pledging on different types of firms in
India, with special focus on family firms. That is, what are the consequences of pledging in terms
of growth, profitability, risk, value creation, and control for promoters of different categories, viz.
family and non-family, of firms in India? We further examine if heterogeneous family firms face
different consequences, that is, do implications differ for standalone family firms (SFFs) and firms
affiliated to family business groups (FBGFs)?
To answer the above questions, we adopt the analytical methods used by Dou et. al (2019)
for some of our analyses using data for 1,492 NSE listed firms from 2009 to 2019. The research
on pledging of shares is scanty. Moreover, we do not find any other rigorous study that has delved
into a family context while studying pledging of shares. The Dou et. al. (2019) paper is a seminal
paper on pledging of shares in the Taiwanese context. Using this paper as a guide we have
improvised the methods wherever needed to suit the context of Indian family firms’ for gaining
robust data driven and interesting insights.
We find that pledging is generally associated with a decline in firm-value among family
firms, both in the short-term and the long-term. We observe that this decline in firm value is due
to two primary reasons – a higher crash risk and an increase in promoter risk-aversion following
the pledge. These findings are in line with Dou et. al (2019). We also enlist a few cases among
family firms where pledging has been beneficial to the firm. Interestingly, both the degree of
pledging and the associated governance consequences are comparatively subdued for non-family
firms. We do not find a significant difference in the observed consequences of pledging between
SFFs and FBGFs. We conclude our study with a discussion of our findings and present
implications for all the stakeholders associated with pledging.

5
2. THE MECHANISM OF PLEDGING
Financial institutions generally require collaterals while disbursing loans to reduce the financial
risk stemming from an unforeseen default on the loans. Shareholders can legally offer their shares
to financial institutions as collateral to avail loans (that is, share pledging). The value of a
shareholder’s holding in a company, by nature, is highly variable due to the constant variation in
the stock price of a firm. Due to this variability in the collateral value, financial institutions require
shareholders to provide asset covers while disbursing the loans. For example, a bank may ask the
shareholder to provide shares worth 3 times the value of the disbursed loan, that is, an asset cover
of 3, to cover the risk of default and maintain a loan’s margin.
In the unforeseen event that the share price falls, and the asset cover falls below a pre-
determined value, the financial institution would raise a margin call to the shareholder.
Consequently, the shareholder is required to either top-up the loan with more shares or pay off a
portion of the loan’s principal to increase the existing asset cover back to the pre-determined value.
If the shareholder answers the margin call in the stipulated time, they will continue to own the
shares.
If the shareholder is unable to answer the margin call, the financial institution has the right
to sell the shares in the market. The news of a margin call is generally perceived negatively by
investors and the sale of a block of shares of a company in the open market accentuates the negative
sentiment associated with the stock. Investors may indulge in panic selling of the stock. The
increased supply of shares puts downward pressure on the stock price, thereby warranting further
sale of shares by the lending financial institutions. Thus, the mechanisms of pledging and margin
calls may lead to a negative spiral in the firm’s stock price and increase the firm’s crash risk.
In countries where diversified ownership is relatively common, such as the United States,
pledging is generally done by directors and executives to hedge and diversify their personal wealth.
However, in India, pledging often serves as a mechanism to generate financial capital for the focal
firm or its affiliates belonging to the same business group. The traditional family structure and
joint ownership of assets such as real estate, buildings, and other physical assets through a Hindu
undivided family (HUF), holding company or trust make it difficult to pledge or sell those assets.
Thus, promoters with large equity shareholdings may find it easier to leverage their shares as
collateral to set up new companies/ventures or enter new markets through existing companies

6
owned by them. Funds generated from pledging the shares of one firm may end up being ploughed
back into the firm, flow to another firm owned by the promoter, or be used for alternative personal
utility of the promoter. The ease with which promoters can pledge their shares and the difficulties
associated with raising funds through other sources have made pledging very popular in India. So
much so that the Reserve Bank of India (RBI) and the Securities and Exchange Board of India
(SEBI) have not only had to warn the investors of its consequences, but also to introduce certain
pledging specific guidelines.
3. BACKGROUND AND THE STIGMA
The RBI, in its Financial Stability Report (RBI, 2019), outlined that pledging of shares could
become an infectious disease for the Indian economy, if left unchecked. The exposure of Indian
institutions (banks and financial institutions) as well as mutual funds to pledged shares has seen a
considerable jump in the last decade. The aggregate exposure of Indian lenders to pledged shares
stood at approximately ₹2.25 trillion (~ $ 32.3 Billion)1 in March 2019.
Share pledging has been prevalent in India for decades. However, it seeped into the public
consciousness following the Satyam episode in 2009 when Ramalinga Raju, the promoter of
Satyam Computer Services Ltd., disclosed to Satyam’s board in January 2009 that he had pledged
approximately 12.3 billion INR worth of his shares in the firm. Raju’s declaration about the share
pledge was followed by multiple other revelations, such as fudging of accounts and illegal
transactions by the promoters to falsely present a rosy picture of the company’s financial health.
Consequently, on that day, Satyam lost 94 percent of its market capitalization on the New York
Stock Exchange (NYSE) and 78 percent on the NSE.
The SEBI responded with an immediate regulatory amendment post the Satyam disclosure.
The Regulation 8A was added to the existing Substantial Acquisition of Shares and Takeovers
(SAST) Regulations of 1997. It was mandated that all stock pledges would need to be disclosed to
the stock exchanges within seven days, and the shareholders would have a further period of seven
days to make it public. The disclosure requirements and the immediate stigma around pledging
naturally reduced the incidence of pledging in the first year following SEBI’s mandate. Since then,
1 At the prevailing Exchange rates in March 2019, 1 USD = 69.7 INR

7
there has been a steady increase in the number of companies where promoters have pledged their
shares and the degree of promoter pledging (Exhibit 1a and 1b).
Exhibit 1a: Share Pledging in NSE listed companies
Exhibit 1b: The degree of pledging in NSE listed companies
As on March 31, 2020, promoters of 26 percent of all NSE listed companies had pledged
their shares. On average, 12 percent of promoter shares across all companies were pledged. If we
consider only those companies where promoters had pledged shares, the average pledge percent is
a staggering 44 percent of the promoters’ holdings.
0
2
4
6
8
10
12
14
0
200
400
600
800
1000
1200
1400
1600
1800
2000
2009 2010 2011 2012 2013 2014 2015 2016 2017 2018 2019 2020
Number of All NSE Listed Companies Average % shares Pledged by Promoters
0
5
10
15
20
25
30
35
40
45
50
0
100
200
300
400
500
600
2009 2010 2011 2012 2013 2014 2015 2016 2017 2018 2019 2020
Number of NSE Listed Companies with shares pledged by promoters
Average % shares Pledged by Promoters
8
The Institutional Shareholder Services Inc (ISS), the largest provider of corporate
governance solutions globally, considers excessive pledging as a corporate governance failure (ISS
ESG, 2021). As per the ISS, “an executive or director may be forced to sell a substantial amount
of shares, [causing] significant risks for other shareholders, who may see the value of their shares
decline.” In India, SEBI continues to take a close and critical regulatory view on pledging of shares
and has periodically introduced new disclosure norms for promoters around pledging. In June
2019, a new regulation mandated the disclosure of the reason behind each share pledge of the
promoter, if the promoter’s total encumbrance increases to more than 50 percent of their holding,
or the total encumbrance of the firm becomes greater than 20 percent of the outstanding stock.2
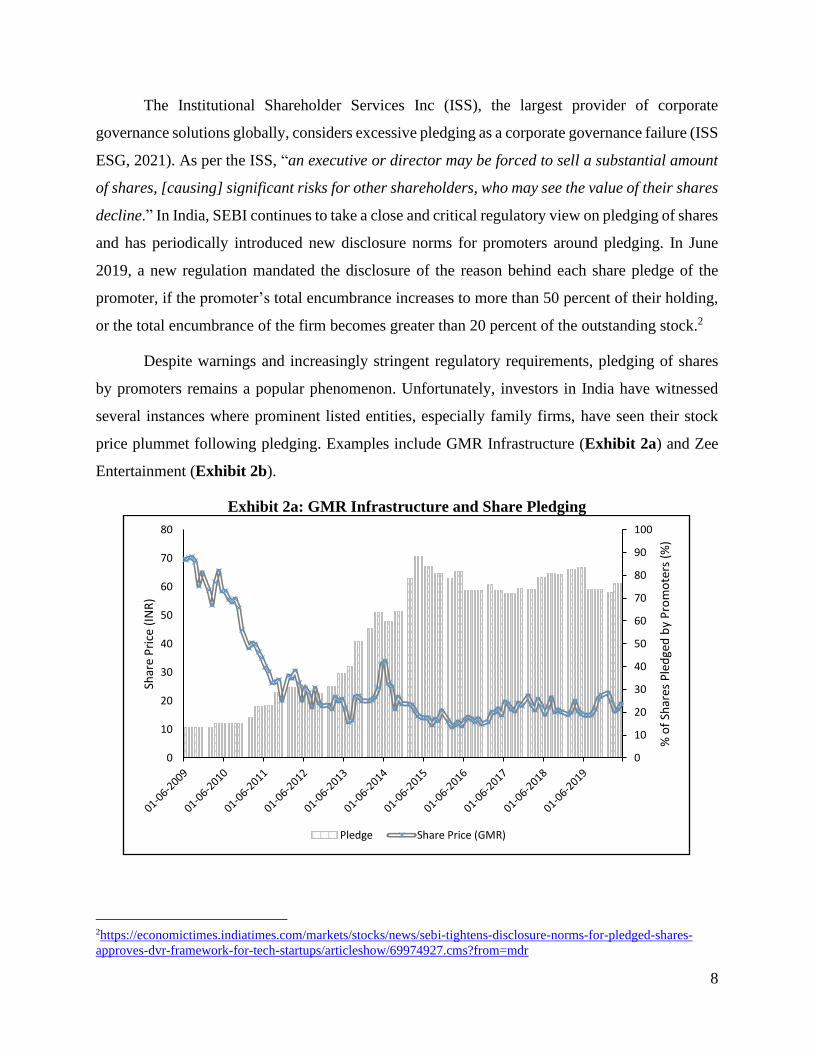
Despite warnings and increasingly stringent regulatory requirements, pledging of shares
by promoters remains a popular phenomenon. Unfortunately, investors in India have witnessed
several instances where prominent listed entities, especially family firms, have seen their stock
price plummet following pledging. Examples include GMR Infrastructure (Exhibit 2a) and Zee
Entertainment (Exhibit 2b).
Exhibit 2a: GMR Infrastructure and Share Pledging
2https://economictimes.indiatimes.com/markets/stocks/news/sebi-tightens-disclosure-norms-for-pledged-shares-
approves-dvr-framework-for-tech-startups/articleshow/69974927.cms?from=mdr
0
10
20
30
40
50
60
70
80
90
100
0
10
20
30
40
50
60
70
80
% o
f Sh
ares
Ple
dge
d b
y P
rom
ote
rs (
%)
Shar
e P
rice
(IN
R)
Pledge Share Price (GMR)

9
Exhibit 2b: Zee Entertainment and Share Pledging
To make matters worse, several family promoters have lost control of their firms owing to
excessive pledging. For example, Subhash Chandra (Zee Entertainment) and Anil Ambani
(Reliance ADA Group) lost ownership and control of their firms due to a combination of erroneous
business decisions and excessive pledging of shares (Exhibit 2c). Given that these firms were in
the public eye, such instances of pledging and subsequent loss of investors’ wealth and/or
promoter’s control have accentuated the negative public sentiments around pledging in India.
Exhibit 2c: Loss of Control at Zee and Reliance Communications Zee Entertainment Reliance Communications
Date Total Promoter
Holding (%) % of Promoter
Holding Pledged Total Promoter
Holding (%) % of Promoter
Holding Pledged
3/31/2014 43.06 41.84 67.80 0
3/31/2015 43.06 37.61 59.69 16.82
3/31/2016 43.06 42.35 58.84 29.69
3/31/2017 43.06 39.32 58.84 64.34
3/31/2018 41.62 52.55 52.96 30.02
3/31/2019 38.20 66.18 21.99 22.06
3/31/2020 4.77 16.38 5.18 0
0
10
20
30
40
50
60
70
80
90
100
0
100
200
300
400
500
600
700
% o
f Sh
ares
Ple
dge
d b
y P
rom
ote
rs (
%)
Shar
e P
rice
(IN
R)
Pledge Share Price (ZEEL)

10
4. DATA AND METHODS
Pledging disclosures in India were mandated only in 2009 following the Satyam corporate
governance scandal. Hence, our sample includes all firms listed on the NSE between 2009 and
2019. For pledging-related information, we rely on the Pledgors database maintained by
Primeinfobase. The remaining firm-specific dependent and independent variables are either
directly downloaded or computed using data from the CMIE Prowess database. We randomly
verified the information obtained from Primeinfobase and CMIE Prowess databases with the
annual reports of listed companies.
We have adopted the family and non-family classification of NSE listed firms developed
by the TSCFE. TSCFE classifies a firm as a family firm on the basis of a minimum ownership of
20 percent equity shares by the family members and management control or succession/business
continuity. Further, TSCFE classifies the family firms into firms affiliated to family business group
(FBGF) and standalone family firms (SFF)3 (Bang, Ray and Ramachandran 2017). The
demographics of the dataset are attached in Exhibit 3. A large portion of firm-year observations
(~90 percent) in our sample are family firms and 57 percent of family firms are firms affiliated to
a family business group.
Exhibit 3: Dataset Demographics
3 Refer to the white paper “Family Businesses: The emerging landscape- 1990-2015” for a detailed description of
the methodology used to classify the firms; https://www.isb.edu/content/dam/sites/isb/research-thought-
leadership/research-center/tscfe/WP-FB-The%20Emerging%20Landscape.pdf and Appendix 1 and 2
43%
57%
Family firms
Standalone Business Group
11
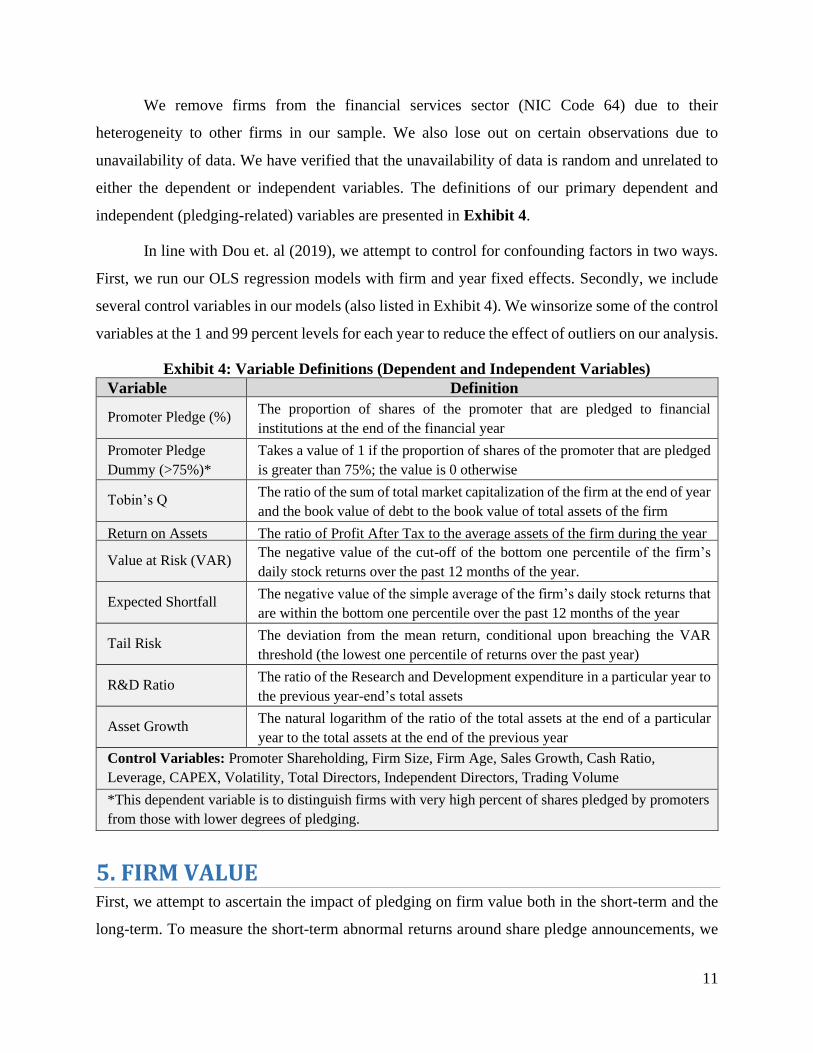
We remove firms from the financial services sector (NIC Code 64) due to their
heterogeneity to other firms in our sample. We also lose out on certain observations due to
unavailability of data. We have verified that the unavailability of data is random and unrelated to
either the dependent or independent variables. The definitions of our primary dependent and
independent (pledging-related) variables are presented in Exhibit 4.
In line with Dou et. al (2019), we attempt to control for confounding factors in two ways.
First, we run our OLS regression models with firm and year fixed effects. Secondly, we include
several control variables in our models (also listed in Exhibit 4). We winsorize some of the control
variables at the 1 and 99 percent levels for each year to reduce the effect of outliers on our analysis.
Exhibit 4: Variable Definitions (Dependent and Independent Variables)
Variable Definition
Promoter Pledge (%) The proportion of shares of the promoter that are pledged to financial
institutions at the end of the financial year
Promoter Pledge
Dummy (>75%)*
Takes a value of 1 if the proportion of shares of the promoter that are pledged
is greater than 75%; the value is 0 otherwise
Tobin’s Q The ratio of the sum of total market capitalization of the firm at the end of year
and the book value of debt to the book value of total assets of the firm
Return on Assets The ratio of Profit After Tax to the average assets of the firm during the year
Value at Risk (VAR) The negative value of the cut-off of the bottom one percentile of the firm’s
daily stock returns over the past 12 months of the year.
Expected Shortfall The negative value of the simple average of the firm’s daily stock returns that
are within the bottom one percentile over the past 12 months of the year
Tail Risk The deviation from the mean return, conditional upon breaching the VAR
threshold (the lowest one percentile of returns over the past year)
R&D Ratio The ratio of the Research and Development expenditure in a particular year to
the previous year-end’s total assets
Asset Growth The natural logarithm of the ratio of the total assets at the end of a particular
year to the total assets at the end of the previous year
Control Variables: Promoter Shareholding, Firm Size, Firm Age, Sales Growth, Cash Ratio,
Leverage, CAPEX, Volatility, Total Directors, Independent Directors, Trading Volume
*This dependent variable is to distinguish firms with very high percent of shares pledged by promoters
from those with lower degrees of pledging.
5. FIRM VALUE First, we attempt to ascertain the impact of pledging on firm value both in the short-term and the
long-term. To measure the short-term abnormal returns around share pledge announcements, we

12
conduct an event study. As seen in Exhibit 5, we run a Fama-French three factor model to measure
abnormal returns for the three days around a share pledge announcement, where the announcement
date is day 0. We remove confounding events from our analysis and ensure that we isolate the
impact of pledging on a shareholder response.
Exhibit 5: Shareholder Reaction to Pledging announcements (Event Study)
Transaction Type N Mean# t-value
1. Family firms
Pledge Creation 4,685 -0.384 -5.392***
Pledge Invocation 753 -1.409 -4.975***
Pledge Release 3695 -0.043 -0.5565
1a. Standalone Family
firms
Pledge Creation 1379 -0.348 -2.1432***
Pledge Invocation 369 -1.522 -3.368***
Pledge Release 989 -0.035 -0.197
1b. Family Business
Group firms
Pledge Creation 3306 -0.399 -5.331***
Pledge Invocation 384 -1.3 -3.348***
Pledge Release 2706 -0.046 -0.551
2. Non-Family firms
Pledge Creation 165 0.105 0.275
Pledge Invocation 40 -1.892 -2.15***
Pledge Release 136 0.584 1.476
# All abnormal returns are calculated using the Fama French Three Factor Model (-1,1)
***significant at 0.001 level
Note: As a robustness test, we conducted the event study for windows centered around a share pledge
over 5 days (-2 to +2) and 7 days (-3 to +3) as well. Our results do not differ significantly across each of
these windows.
We find that the short-term investor reaction to share pledging by promoters is significantly
negative across family firms. There is no counter-positive reaction seen when the share pledge is
released (de-pledged). Forced sale of shares (pledge invocations) are expectedly accompanied by
even higher negative investor reactions. We do not find a definitive investor reaction to share
pledges among non-family firms. However, even for non-family firms, there is significant negative
abnormal returns in the event of pledge invocation, signaling the loss of confidence of investors in
the firm and the firm itself being in trouble. The event of pledging invocation is found to destroy
value of any types of firms.
The results of the event study imply that non-promoter investors on an average view a
pledge event as a negative signal. It also implies that the non-promoter investors are cognizant of
the potential risks that pledging by family promoters induces on the firm. It is interesting to note
13
that conversely pledge-release announcements are not accompanied by positive reactions. This
may be due to the sentiment that the promoter may re-pledge the shares for additional loans.
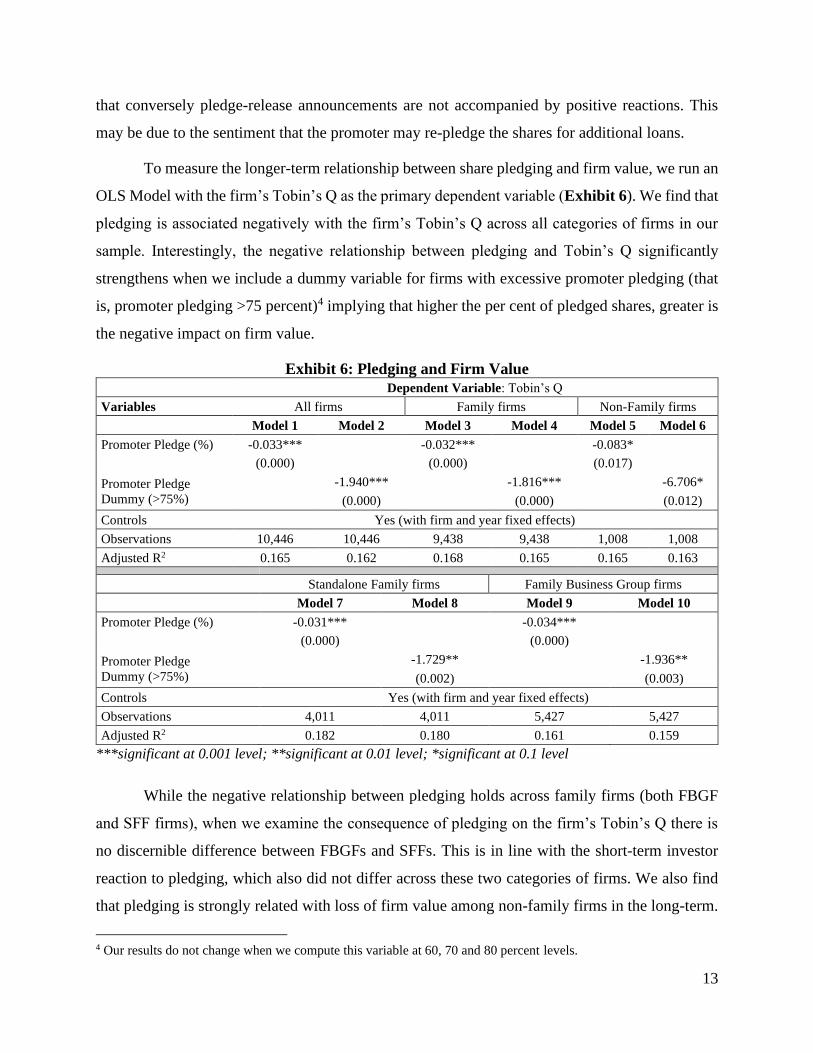
To measure the longer-term relationship between share pledging and firm value, we run an
OLS Model with the firm’s Tobin’s Q as the primary dependent variable (Exhibit 6). We find that
pledging is associated negatively with the firm’s Tobin’s Q across all categories of firms in our
sample. Interestingly, the negative relationship between pledging and Tobin’s Q significantly
strengthens when we include a dummy variable for firms with excessive promoter pledging (that
is, promoter pledging >75 percent)4 implying that higher the per cent of pledged shares, greater is
the negative impact on firm value.
Exhibit 6: Pledging and Firm Value
Dependent Variable: Tobin’s Q
Variables All firms Family firms Non-Family firms
Model 1 Model 2 Model 3 Model 4 Model 5 Model 6
Promoter Pledge (%) -0.033*** -0.032*** -0.083*
(0.000) (0.000) (0.017)
Promoter Pledge
Dummy (>75%)
-1.940*** -1.816*** -6.706*
(0.000) (0.000) (0.012)
Controls Yes (with firm and year fixed effects)
Observations 10,446 10,446 9,438 9,438 1,008 1,008
Adjusted R2 0.165 0.162 0.168 0.165 0.165 0.163
Standalone Family firms Family Business Group firms
Model 7 Model 8 Model 9 Model 10
Promoter Pledge (%) -0.031*** -0.034***
(0.000) (0.000)
Promoter Pledge
Dummy (>75%)
-1.729** -1.936**
(0.002) (0.003)
Controls Yes (with firm and year fixed effects)
Observations 4,011 4,011 5,427 5,427
Adjusted R2 0.182 0.180 0.161 0.159
***significant at 0.001 level; **significant at 0.01 level; *significant at 0.1 level
While the negative relationship between pledging holds across family firms (both FBGF
and SFF firms), when we examine the consequence of pledging on the firm’s Tobin’s Q there is
no discernible difference between FBGFs and SFFs. This is in line with the short-term investor
reaction to pledging, which also did not differ across these two categories of firms. We also find
that pledging is strongly related with loss of firm value among non-family firms in the long-term.
4 Our results do not change when we compute this variable at 60, 70 and 80 percent levels.

14
You may recall that the short-term investor reaction to share pledging for non-family firms was
found to be insignificant. However, it is not surprising that in the long-term, Tobin’s Q, a market-
based performance measure, was found to be significantly negative, even for non-family firms.
6. EQUITY RISK AND RISK-AVERSION
The reasons behind the decline in firm value found above need to be investigated further. Dou et.
al (2019) outlined two primary reasons for this decline – higher crash risk and an increase in insider
risk-aversion. We attempt to determine if these two reasons hold in the Indian context too.
Firstly, to measure the impact of pledging on the firm’s crash risk, we utilize three measures
suggested by Dou et. al. (2019) – Value at Risk, Expected Shortfall, and Tail Risk. The variables
are measured for the year following the pledge (that is, t+1). We find that pledging is consistently
linked with a higher crash risk in the year following the pledge by the primary shareholder for all
family firms, with there being only slight differences among the coefficients for SFF and FBGF
firms (Exhibit 7). The results are in line with our expectations. We had previously highlighted the
nature of margin calls and the cascading negative impact that forced sale of shares is likely to have
on the firm’s equity risk. We find evidence of a higher equity risk in our sample of family firms.
We do not find evidence of higher equity risk among non-family firms in our sample.
Exhibit 7: Pledging and Firm Crash Risk [t+1]
All firms
Dependent Variables (t+1) VAR Exp. Short. Tail Risk
Variables Model 1 Model 2 Model 3
Promoter Pledge (%) 0.085*** 0.126*** 0.157***
(0.000) (0.000) (0.001)
Controls Yes (with firm and year fixed effects)
Observations 10,263 10,263 10,263
Adjusted R2 0.0938 0.0445 0.0498
Family firms Non-Family firms
Dependent Variables (t+1) VAR Exp. Short. Tail Risk VAR Exp. Short. Tail Risk
Model 4 Model 5 Model 6 Model 7 Model 8 Model 9
Promoter Pledge (%) 0.084*** 0.127*** 0.163*** 0.127 0.118 0.032
(0.000) (0.000) (0.001) (0.163) (0.425) (0.871)
Controls Yes (with firm and year fixed effects)
Observations 9,272 9,272 9,272 991 991 991
Adjusted R2 0.0934 0.0424 0.0485 0.116 0.0863 0.0941
Standalone Family firms Family Business Group firms

15
Dependent Variables (t+1) VAR Exp. Short. Tail Risk VAR Exp. Short. Tail Risk
Model 10 Model 11 Model 12 Model 13 Model 14 Model 15
Promoter Pledge (%) 0.085** 0.146** 0.179** 0.084*** 0.121** 0.167*
(0.006) (0.004) (0.007) (0.000) (0.004) (0.011)
Controls Yes (with firm and year fixed effects)
Observations 3,893 3,893 3,893 5,379 5,379 5,379
Adjusted R2 0.0858 0.0559 0.0693 0.110 0.0382 0.0434
***significant at 0.001 level; **significant at 0.01 level; *significant at 0.1 level
Secondly, we investigate the impact of pledging on insider risk-aversion (Exhibit 8). Since
pledging puts the shareholding of a promoter under considerable risk, they may be motivated to
attempt to reduce the potential variability in the stock price of the firm. Thus, promoters may
attempt to stifle the firm’s risk-taking behavior (such as long-term investments and investment in
R&D) to ensure that short-term negative returns do not lead to potential margin calls. This behavior
is more likely to occur when the funds obtained from pledging shares are diverted to an investment
destination outside the firm whose shares are being pledged.
Exhibit 8: Pledging and Firm Risk-taking All firms
Dependent Variables (t+1) R&D Capex Assets
Variables Model 1 Model 2 Model 3
Promoter Pledge (%) -0.014* -0.018*** -0.052***
(0.055) (0.001) (0.000)
Controls Yes (with firm and year fixed effects)
Observations 9,383 9,136 9,383
Adjusted R2 0.00644 0.133 0.186
Family firms Non-Family firms
Dependent Variables (t+1) R&D Capex Assets R&D Capex Assets
Model 4 Model 5 Model 6 Model 7 Model 8 Model 9
Promoter Pledge (%) -0.014* -0.020*** -0.052*** -0.009 0.053 0.004
(0.056) (0.000) (0.000) (0.420) (0.162) (0.968)
Controls Yes (with firm and year fixed effects)
Observations 8,492 8,268 8,492 891 868 891
Adjusted R2 0.00663 0.138 0.187 0.0147 0.108 0.181
Standalone Family firms Family Business Group firms
Dependent Variables (t+1) R&D Capex Assets R&D Capex Assets
Model 10 Model 11 Model 12 Model 13 Model 14 Model 15
Promoter Pledge (%) 0.005 -0.019* -0.037 -0.025* -0.020*** -0.061***
(0.132) (0.063) (0.104) (0.032) (0.000) (0.001)
Controls Yes (with firm and year fixed effects)
Observations 3,584 3,443 3,584 4,908 4,825 4,908
Adjusted R2 0.00960 0.142 0.210 0.0108 0.134 0.166
***significant at 0.001 level; **significant at 0.01 level; *significant at 0.1 level

16
Based on the data from our sample, we document a negative relationship between promoter
pledging and the firm’s R&D and investment intensity among family firms, with the detrimental
impact of pledging being slightly more emphasized among FBGFs compared to SFFs. We also
find that firms where promoters have pledged shares face a lower growth in their total assets. We
don’t find evidence of this insider risk-aversion among non-family firms.
Evidence of higher crash risk and an increase in insider risk-aversion, as found in the
analysis above, raise significant concerns around the family firm’s corporate governance
mechanisms. Potential underinvestment in assets (capital expenditure) and R&D could imply that
the firm’s long-term competitive advantage may wither away due to pledging, leading to concerns
around survivability as well. As an additional analysis, we test whether lower firm risk-taking also
translates into poorer firm performance following the pledge by the promoter due to
underinvestment and risk-averse decision-making. To measure the relationship between firm
performance (measured through ROA) and promoter pledging, we run a model specification
outlined in Exhibit 9. As expected, we find a negative relationship between firm performance and
pledging among family firms in our sample. However, the relationship is insignificant for non-
family firms.
Exhibit 9: Pledging and Firm Performance
Dependent Variable: Return on Assets [t+1]
All firms Family firms Non-Family firms
Variables Model 1 Model 2 Model 3 Model 4 Model 5 Model 6
Promoter Pledge (%) -0.018** -0.019** -0.008
(0.009) (0.009) (0.754)
Promoter Pledge
Dummy (>75%)
-2.058** -2.034** -2.150
(0.004) (0.006) (0.220)
Controls Yes (with firm and year fixed effects)
Observations 9,375 9,375 8,484 8,484 891 891
Adjusted R2 0.119 0.120 0.121 0.122 0.140 0.141
Standalone Family firms Family Business Group firms
Variables Model 7 Model 8 Model 9 Model 10
Promoter Pledge (%) -0.024* -0.013
(0.053) (0.111)
Promoter Pledge
Dummy (>75%)
-2.215* -1.763*
(0.064) (0.051)
Controls Yes (with firm and year fixed effects)
Observations 3,580 3,580 4,904 4,904
Adjusted R2 0.140 0.140 0.111 0.112
***significant at 0.001 level; **significant at 0.01 level; *significant at 0.1 level
17
7. SHARE PLEDGING AND LOSS OF CONTROL
Pledging puts the shareholding of the pledging shareholder under considerable risk. An unexpected
negative event could potentially reduce the stock price of the firm to an extent that a margin call is
triggered. This may lead to the possibility of a forced sale of shares by financial institutions along
with a stock price slump. Such situations could lead to a stock rout, leading to margin calls,
implying loss of majority/controlling ownership for the promoters, if they are not able to meet the
margin calls.
The events that lead to such stock routs may be completely extrinsic to the firm. For
example, during the Covid-19 pandemic, the benchmark indices fell more than 35 percent in a
month. The impact of Covid-19 pandemic on pledged shares was significant. The value of pledged
shares declined from ₹1.78 trillion on 31 December 2019 to ₹1.27 trillion on 20 March 20205.
Listed entities across several sectors such as Future Retail and SpiceJet (Aviation) were projected
to be impacted by downgraded ratings and pressures to provide additional collaterals. With some
of these firms being highly leveraged, it was predicted that strategic debt restructuring, or sale of
stake would be the only way out for these promoters.
We attempt to gauge the potential impact of pledging on control, in terms of shareholding,
if the pledged shares of the promoters were to be invoked in entirety, as has happened in various
cases in India Inc. Exhibit 10a showcases the shareholding of the promoters in firms where the
promoters have pledged their shares. The promoter shareholding for a majority of the firms lies
above the 50 percent mark. This implies an ability to exert considerable control over the firm and
lend a clear strategic direction as a majority shareholder.
Exhibit 10b, showcases the promoter holding of the same companies, as in Exhibit 10a,
that is not pledged to a financial institution. We show the proportion of the firm that the promoter
would continue to own if the promoter were to lose the part of their shareholding that they had
pledged. The results indicate a gloomy story. We find that most companies with pledged shares are
at the risk of losing the ability of their promoters to exert control on the firm. Only a few firms lie
above the 50 percent mark in terms of the unpledged shareholding of the promoter group. This may
be detrimental to the firm’s prospects, especially if the promoter has some specialized skill or
5 Report can be retrieved from: https://www.livemint.com/market/stock-market-news/decline-in-pledged-shares-
sends-promoters-running-for-cover-11584900054974.html

18
knowledge that is not easily transferable or replicated, which is often the case in family owned and
managed firms.
Exhibit 10a: Promoter Shareholding in Pledged family firms (2020)
Exhibit 10b: Promoter Shareholding after potential loss of pledged shares (2020)
8. PLEDGING AS A BENEFICIAL TOOL FOR PROMOTERS
Most of the extant literature and prior analyses on share pledging ha treated the shareholder’s
motivation behind pledging to be singular, that is, personal wealth diversification. This is in part
due to the focus of literature on firms in countries where diversified ownership is common. In this
context, directors and executives often pledge (and hedge) their shareholding in the firm to

19
diversify their personal wealth. We find, however, that several promoters of family-owned Indian
firms have utilized pledging to finance entrepreneurial projects across listed companies and new
ventures, especially when credit availability is dire. Pledging enables family owners to borrow
money due to the sheer size of their shareholdings in their firms. Often, even with asset cover
requirements of two or three, promoters may be able to borrow up to 25 percent of the total market
capitalization of the firm by pledging their shares.
When pledging for business loans is done under contingency planning and there is clear
confidence on the promoter’s part that the strategic projects may lend a future positive NPV to the
firm, pledging may be beneficial for the promoter without causing undue negative consequences
for the firm. We highlight this with two examples – Apollo Hospitals (Exhibit 11a) and Asian
Paints (Exhibit 11b). The promoters of Apollo Hospitals had pledged their shares for financial
capital that would enable the firm to undertake strategic investments in the core business segment
of the firm during a credit crunch. Consequently, the share price of Apollo rose considerably
between 2014 and 2020 due to the firm benefitting from these strategic investments. The promoter
pledge significantly reduced in 2020.
Exhibit 11a: Apollo Hospitals
Another example of pledging creating value for the promoters as also for other shareholders
is that of Asian Paints. The promoters of Asian Paints had pledged their shares prior to 2010 to
0
10
20
30
40
50
60
70
80
90
100
0
200
400
600
800
1000
1200
1400
1600
1800
2000
% o
f Sh
ares
Ple
dge
d b
y P
rom
ote
rs (
%)
Shar
e P
rice
(IN
R)
Pledging Share Price (APOLLO)

20
increase their holding in the company (i.e., buying back shares from the market)6. The share price
of Asian Paints has consistently increased over the past decade due to strong growth and robust
underlying financials. While the stock price has steadily grown without any significant downturns,
the promoter pledge has also been coming down.
Exhibit 11b: Asian Paints
9. FINDINGS, IMPLICATIONS AND CONCLUSIONS
In this study, we have attempted to ascertain the consequences of share pledging by promoters of
different category of firms (family, non-family and SFFs and FBGFs) in the Indian context. We
utilized data for all firms listed on the NSE between 2009 and 2019. While the results of our study
primarily hold for family firms, some of these implications may apply to non-family firms as well.
We discuss our primary findings, their implications and conclusions below.
Findings
Margin calls and threat of price declines: In the event of declining share price, the lender would
make a margin call to the promoter who pledged shares. Though the promoter may not possess
liquid cash to bring the value of the loan down to re-balance the loan’s margin and asset cover.
6 Source: https://timesofindia.indiatimes.com/business/india-business/asian-paints-promoters-pledged-
shares/articleshow/4049280.cms
0
10
20
30
40
50
0
200
400
600
800
1000
1200
1400
1600
1800
2000
% o
f Sh
ares
Ple
dge
d b
y P
rom
ote
rs (
%)
Shar
e P
rice
(IN
R)
Pledging Share Price (Asian Paints)

21
Financial institutions, as a result, are likely to sell the shares in the market if margin call is unmet.
Sale of shares in bulk may further exacerbate the price decline, leading to even more shares
being sold. This increases the firm’s equity risk, that is the risk of value of the equity declining.
Reduction in Investment Intensity: Post the share pledge, the threat of the share price decline and
subsequent margin calls continue to linger for the promoter and the firm. As such, there may be a
strong motivation for the promoter to reduce the firm’s investment in innovation (R&D) and
capital expenditure since they may cause short-term variability in performance and the firm’s stock
price. Promoters are likely to become risk-averse due to the threat of margin calls. In the long-
term, this risk-aversion is likely to lead to poorer firm performance and may even threaten the
chances of firm survival.
Decline in Firm Value and Governance Implications: As a consequence of lower risk-taking and
higher crash risk, investors generally react negatively to the news of a share pledge. Firm value
may decline in the short-term and the decline is likely to sustain (or even worsen) in the long term.
This situation creates a serious problem from a governance perspective. The primary shareholder
(promoter) who pledges the shares benefits from the pledge in the form of a loan. For a minority
shareholder of the firm pledging may lead to decline in wealth, higher riskiness of their
investments, and no associated upsides when the pledging funds are diverted to outside the firm.
The threat of loss of control: Several examples exist in the Indian context, such as Subhash
Chandra (Zee) and Anil Ambani (Reliance), where family promoters lost ownership and control
of their firms owing to excessive pledging. Our analysis of the state of pledging among Indian
promoters leads to the conclusion that several listed firms face a similar threat in the event of an
unexpected share price decline. Investors perceive the firm to be closely associated with the
family promoter, and loss of ownership and control raises doubts among investors about the
future of the firm itself.
Pledging is not always harmful: Due to the instances of loss of control and governance scandals
associated with pledging, it is not surprising that the phenomenon is perceived negatively.
However, we find that when used strategically, pledging may not lead to the severe governance
implications outlined by us previously. In times of a credit crunch, firms may find promoter
pledging to be an effective, cheap, and quick way to finance projects and investments. Apollo
Hospitals, Granules India, and Asian Paints are some of the examples of firms where promoter

22
pledging ended up being beneficial to the promoters and/or to the firm. Governance interventions
and provisions may prevent shareholders from over-pledging their shares.
Implications
Based on our findings in the study, we describe the implications arising out of this study for the
primary stakeholders associated with pledged shares in the market – controlling shareholders,
minority shareholders, the firm’s board of directors, and the regulators. We also include the family
in this list as an important stakeholder as, for the family firms, pledging of shares has significant
long term implications for family wealth and reputation.
Controlling Shareholders: It is key for controlling shareholders to understand that pledging to raise
funds for motives such as diversification of personal wealth or setting up new entrepreneurial
ventures puts the firm whose shares are being pledged at considerable risk. Unexpected downturns
due to reasons that may be either internal or external to the firm would lead to loss of ownership
in the firm. Hence, over-optimistic investment plans and over-pledging shares without pre-
planned repayment strategies are likely to lead to a crisis later.
Minority shareholders: Our analysis implies that it is necessary for a minority shareholder to
further attempt to understand the motivations of the controlling shareholder behind pledging before
concluding that pledging is all bad for the firm. If the controlling shareholder has pledged to take
advantage of a strategic opportunity for the firm itself, it may be beneficial to hold on to the stock
and monitor its performance closely. However, when done under distress for firm loans, pledging
may reveal significant negative information about the current financials of the firm and present an
ominous picture of the future of the company. If pledging of shares has been done for any other
reason such as repaying the controlling shareholder’s personal loans or diverting money to an
alternative destination, the firm stands to be under higher risk and poses serious corporate
governance challenges for the firm. Investors must keep a track of their portfolio and regularly
evaluate if the controlling shareholders of the firms in which they have invested have pledged
their shares. In case they find that they are invested in such a firm, they should continually monitor
the quantum of shares pledged. If the risks arising from holding stock ownership of these firms
outweigh the benefits, it may be a good idea to let go of their holding in the firm. Large institutional
investors may also go a step further and monitor the share pledges of family promoters in other
group companies. It may provide indications about the financial health of the overall group.

23
Board of Directors: The firm would benefit by empowering the Board of directors to check the
level of pledging by controlling shareholders and insiders in the firm and advise against it if
deemed harmful to the financial health of and rationale decision-making at the firm. Board of
directors of firms must caution controlling shareholders from over pledging their stakes and
should shield the firm from such shareholders if they try to manage the margin calls by taking
hasty or short-term view decisions in the firm.
Regulators: The corporate governance implications of pledging in our study should help
regulators in better decision making as well. There is merit in exploration of regulations and
directives that reduce the incidence of “Rubber-Stamp Boards”, that is, boards which fail to
monitor the promoters and take decisions under the influence of the promoter itself. The RBI must
direct financial institutions to evaluate the detailed plan associated with the investment of proceeds
obtained by pledging and construct the pledging loan contract (such as interest of the loan and the
equity cover required to be obtained) in accordance. SEBI’s decision to mandate disclosures of
reasons for share pledges in highly pledged companies was an excellent move, as evidenced by
our findings in this study. Moving forward, the regulator may choose to introduce newer
regulations that discourage pledging for personal utility. Further, RBI and SEBI should talk more
to each other as their regulations on pledging of shares is complimentary at the moment.
Family: Pledging of shares, coupled with bad decision-making and/or over ambitious growth
plans, resulted in complete destruction of family wealth in many family firms. In few cases, passive
family members, those who were not involved in the business and its affairs, may not even be
aware of the consequences of pledging. There is need to create awareness and build stronger
family governance processes that would put checks and balances with regards to excessive
pledging.
Conclusion
This study highlights the prevalence of share pledging in the Indian context and the possible
implications that pledging may present for stakeholders, especially in family firms. Our study finds
a decline in firm value, higher crash risk and underinvestment in innovation by firms where
promoters of family firms pledge their shares. However, we also show how some firms have
utilized share pledging by family promoters as a tool to raise capital for strategic projects and
create value for the stakeholders.

24
The various scandals, loss of control of the firm by family promoters, regulatory responses
and warnings led to the common perception that all share pledges by promoters are bad. Existing
empirical research around pledging of shares has also failed to account for the heterogeneity among
the possible use-cases of capital obtained from pledging of shares.
We raise calls for investors, regulators, and the family to closely evaluate the phenomenon
of pledging due to its significant impact on the firm’s value and governance mechanisms. The lack
of commensurate institutional provisions to prevent minority shareholder expropriation may
worsen agency conflicts between the promoter and the minority shareholder among several Indian
firms in the event of pledging. Given its far-reaching consequences, it is important to take
cognizance of this phenomenon. We provide a clarion call for acknowledging that it is an important
tool to access financial capital for family promoters. It acts as an important resource to promote
entrepreneurial financing amongst family businesses and as a source of fund to turnaround the
family firm if it is in trouble.
Future studies on share pledging by family promoters must closely evaluate the risks,
rewards and motivations of the promoters when pledging their shares. The studies should also
discriminate between the end use of funds rather than assuming that all share pledges are
essentially bad. Along with large sample data driven research, there is a need for case study based
research on pledging in order to understand the nuanced variations in promoter choices and causes
and consequences of the same. More war-room stories of pledges gone wrong as well as pledging
as an important component of a successful entrepreneurial financial strategy are needed. Such
case-based accumulated evidences can provide valuable inputs on why family businesses choose
this as a source of alternative finance, how to manage and govern pledging more effectively both
by promoters and the board and how to frame more balanced regulations that will reduce the
overall systemic risk with proper safeguards and help create a more efficient market for pledging.

25
10. REFERENCES Bagchi, Amiya. 1967. Concentration of Economic Power in India. Economic and Political Weekly
2 (33/35): 1613-1615, 1617-1618.
Bang, N. P., S. Ray, & K. Ramachandran. 2017. Family Businesses: The Emerging Landscape
1990-2015. Thomas Schmidheiny Centre for Family Enterprise, Indian School of
Business.
Bang, N. P., Ray, S., Ramachandran, K., & Vishwanathan, A. 2018. Family Businesses:
Promoters’ Skin in the Game 2001-2017. Thomas Schmidheiny Centre for Family
Enterprise, Indian School of Business.
Dou, Y., Masulis, R. W., & Zein, J. 2019. Shareholder Wealth Consequences of Insider Pledging
of Company. The Review of Financial Studies, 32(12), 4810 - 4854.
Granovetter, M. 2005. Business Groups and Social Organization. In N. J. Smelser, & R.
Swedberg, The Handbook of Economic Sociology (pp. 429-450). New York, Princeton
and Oxford: Princeton University Press and Russell Sage Foundation.
ISS ESG. June, 2021. Governance Quality Score, Institutional Shareholder Services, p199
https://www.issgovernance.com/file/products/qualityscore-techdoc.pdf
Machek, O., Kolouchová, D., & Hnilica, J. 2015. Identifying Family Businesses: The Surname
Matching Approach. Recent Advances in Environmental and Earth Sciences and
Economics 96-100.
Markusen, J. R. 1995. The Boundaries of Multinational Enterprises and the Theory of International
Trade. The Journal of Economic Perspectives, 9(2), 169-189.
RBI. June, 2019. Financial Stability Report, Financial Stability Unit, Reserve Bank of India,
Mumbai, India, Issue No. 19, p111.
https://rbidocs.rbi.org.in/rdocs/PublicationReport/Pdfs/FSRJUNE2019E5ECDDAD7E51
4756AFEF1E71CB2ADA2B.PDF

26
Appendix 1: Identification of Family Firms
In the literature, family businesses are generally classified on the basis of ownership, management
and succession or business continuity. In the family business literature, 79 percent of the studies
used ownership, 53 percent used management control, 28 percent used directorship, 15 percent
used self-identification, 9 percent used multiple generations and 7 percent used intra-family
succession intention, as the criteria to define a family firm (Machek, Kolouchová, & Hnilica,
2015).
The Thomas Schmidheiny Centre for Family enterprise, Indian School of Business,
identifies a firm as family firm if the first condition of significant ownership is met and any one of
the other two conditions are met:
a. An equity ownership above 20 percent by family members or family-controlled firms as on
date (March 31, 2020) or the last shareholding data available. The cutoff of 20 percent was
deemed to be appropriate as it has been found that individuals/families are able to control
companies with much lower shareholdings due to large number of other shareholders that are
widely scattered or financial institutions as shareholders that are not interested in the
management of the company (Bagchi 1967) 7.
b. Family member as chairman of the board, or two or more family members8 in the board of the
firm. Once it was established that a Family has more than 20 percent shareholding in a
company, it was determined if the family also exerts management control on the company.
Wherever the Chairman of the Board, the Chief Executive Officer (CEO), the Managing
Director, or a person in the board of directors was also a promoter and member of the family
holding more than 20 percent stake in the company, that company was considered to be a
Family Business.
In cases where the information about the Board of Directors was not available or it was difficult
to determine whether the individual is a family member or not, the Annual Report of the
7 No significant changes were observed when the ownership cutoff was relaxed to 15 percent or increased to 25
percent. 8 Family members were many times identified using the ‘surname’ matching approach when any conclusive
evidence of relationship was not available. See (Machek, Kolouchová and Hnilica 2015) for a primer on the
approach.
27
company and the website, especially the History section and the Team/ Management/
Leadership sections, was explored to gain clarity.
c. Multiple generations or multiple members of same generation actively involved in business. If
a classification could not be arrived at through conditions (a) and (b), then the website of the
company, along with search on the internet to get more information about the company was
explored. But if there was ambiguity in step (b), as there were companies where a family owned
more than 20 percent shares, but the company was managed by a non-family CEO or Managing
Director, in such cases, whether the stake of the company was being passed on from one
generation to the other and the members of the family were involved in the company as owners,
even if it was not in a leadership role, was checked for.
The above criteria have been primarily used to classify companies into Family and Non-
Family businesses.

28
Appendix 2: Ownership classifications
Businesses in India are characterized by many differing ownership structures. Prior literature on
BGs does not distinguish between family and non-family business groups. Similarly, the prior
literature on family businesses either focus on business groups or family firms irrespective of
whether they are a part of a group or not. BG affiliated firms are usually bound together by various
multiple ties such as common ownership, directors, products, financial, or interpersonal ties.
Moreover, there is typically a core entity or dominant coalition, offering common administrative
or financial control, or managerial coordination among the member firms (Granovetter, 2005). We
believe that the family firms that are not affiliated to any business group will behave differently
than the group affiliated ones.
SOEs or public sector undertakings as they are commonly referred to in India, are legal entities
that are created by the government in order to partake in commercial activities on the government's
behalf. It can be either wholly or partially owned by a government and is typically earmarked to
participate in commercial activities. Examples include Indian Oil, NTPC, ONGC and Coal India.
MNCs are firms that have entered India through foreign direct investment. These firms make
investments through which they acquire a substantial controlling interest in a domestic firm or set
up a subsidiary in a foreign country (Markusen, 1995). Examples include Nestle, Cadbury and
Microsoft.
Other Business group affiliated firms (OBGFs)- One key characteristic of Business Groups in the
literature is ‘kinship’ amongst top management. Business groups affiliated family businesses are
therefore BGs in the true sense and have been classified as Family Business group firms (FBGFs)
in this study. The other firms that meet the criteria of business group affiliated firms to a large
extent but the top management in the various affiliated firms are not related in any way have the
‘kinship’ that a family has missing. They are hence classified separately as OBGFs. Examples are
the ICICI Group, IVRCL Group, Larsen and Toubro Group, among others.
BG affiliated firms which were SOEs or MNCs were classified under SOEs and MNCs, not under
OBGFs. For example, the companies under the State Bank of India group would be a part of SOEs.

29
Standalone non-family firms (NFFs) form the remaining set of firms in the dataset. These firms
are usually characterized by distributed ownership and a high degree of professionalization.
Examples include Infosys, ITC and Global Trust Bank Ltd.
SFFs are family firms that are not part of a business group.
In this study, we have not delved into the sub-classification of non-family firms as pledging
in non-family firms is limited.

ABOUT THE INDIAN SCHOOL OF BUSINESS
ABOUT THE CENTRE
The Indian School of Business (ISB) is a global business school offering world class management education to professionals at its two LEED rated green building campuses – Hyderabad and Mohali. A rich and vibrant pool of research-oriented resident faculty, robust academic partnerships, thriving alumni network, and backing of an influential board and guidance of industry’s thought leadership has enabled ISB to fast emerge and consolidate itself as a premier global business school in the emerging markets. The school is also one of the largest providers of executive education in Asia and the most research-productive Indian management institution.
For more Information, please visit https://www.isb.edu/en/about-isb.html
The Thomas Schmidheiny Centre for Family Enterprise brings together faculty and practitioners from India and abroad with the broad aim of combining theory and practice to enhance research and innovation in the field.
Family businesses make a major contribution towards wealth creation, job generation, and increasing competitiveness in countries around the world. As such, the unique challenges and opportunities faced by them are rapidly becoming an important subject of management research.
The Centre has been generously funded with support from Thomas Schmidheiny, Founder and Chairman of Spectrum Value Management, Ltd, Switzerland.
For more details visit www.isb.edu/fambiz
Family Business Briefshttp://newsletters.isb.edu/FamilyBusiness-Newsletter/
Family Business Bloghttp://blogs.isb.edu/centre-for-family-enterprise/
Contact: [email protected]: +91 40 2318 7189
Registered Office & Hyderabad Campus: Gachibowli, Hyderabad - 500 111, Telangana, India.
Ph: +91 40 2300 7000, Fax: +91 40 2300 7099Mohali Campus: Knowledge City, Sector 81, SAS Nagar
Mohali - 140 306, Punjab, India. Ph: +91 172 459 0000www.isb.eduCorporate Identity Number: U80100TG1997NPL036631
Thomas SchmidheinyCentre for Family Enterprise
Top Related