


Languages
Pages
Legal

1
Shadow Banking and Offshore Finance: the role of the Netherlands
Introduction
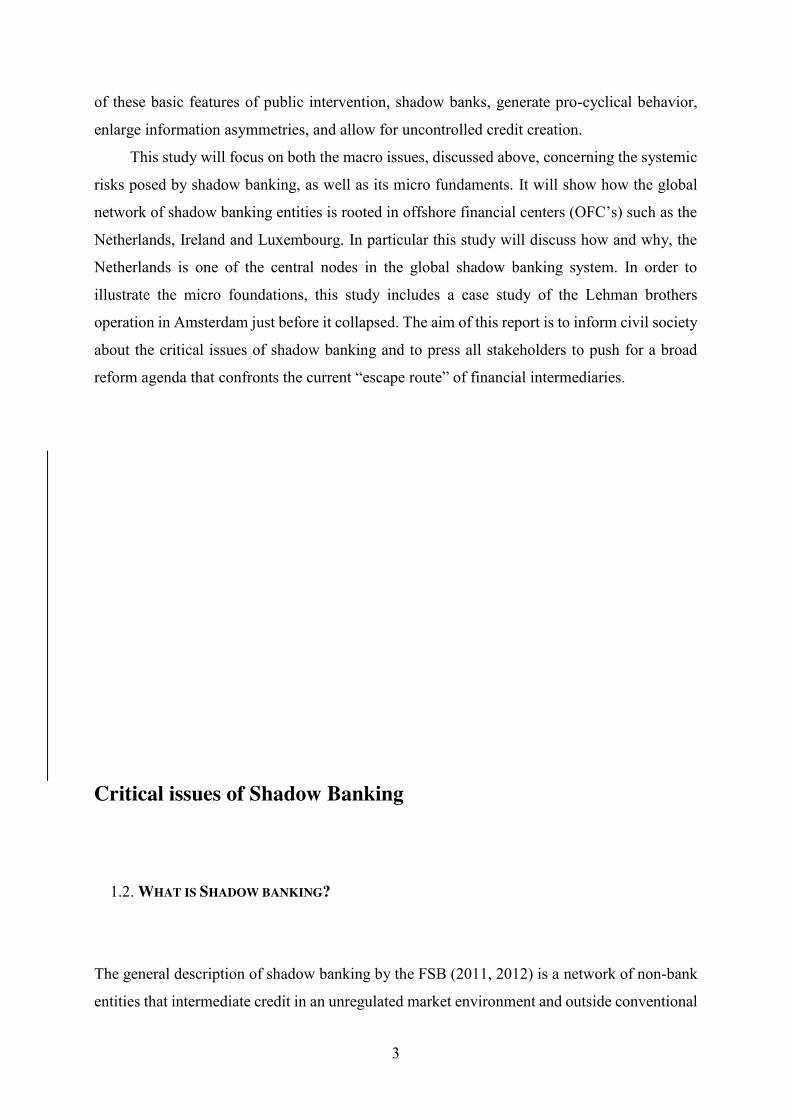
1.1. AIM OF THE REPORT
The financial crisis that emerged in 2007 with the bankruptcy of the hedge fund of Bear Stearns
and developed into a full blown systemic crisis, with the collapse of Lehman Brothers in 2008,
introduced the hidden world of haute finance to a wider public. In the public debate that
followed these events, securitization, the bundling of non-liquid loans, mostly mortgages, into
tradable assets, like bonds, moved to the forefront. The collateral to these securitized assets
turned sour as an increasing share of home owners was unable to service their debt. The assets,
mostly on the books of banks and institutional investors became “toxic”, with an unknown risk
profile as markets froze. In the academic world this banking model was coined as “originate
and distribute”, referring to banks that made loans (originate) and bundled these into tradable
assets to be sold (distribute) to end-investors like other banks and pension funds. This banking
model involved the use of a special purpose entity (SPE), a separate legal vehicle that acted as
intermediary in the securitization process and kept the risks, assets and liabilities out of the
balance sheet of the parent bank (loan warehousing).
With amazement the wider public took notice of this complex world of finance where
credit was intermediated in unconventional ways, outside the regular banking system. This
universe of SPE’s, linking home owners to pension funds, however, was only the tip of the
iceberg.
The new catch-all phrase to describe, define and delimit non-conventional finance is
“Shadow Banking”. The term was coined in 2007 by Paul McCully from PIMCO, at the yearly
meeting of the US Federal Reserve in Jackson Hole. Since then, the term shadow banking was
used in a rising number of articles in the Financial Times, 33 in 2007, 100 in 2008 and 222 in
2011. Also, from 2010 onwards, Shadow Banking, became a focal point in the analysis of the
crisis ridden financial landscape by the US Fed, the IMF, the EU commission and the FSB,
reflected in a growing literature and amount of policy documents. The EU commission issued

2
a green paper in early 2011, recognizing the need to better understand this under regulated, but
sizeable part of modern finance that performs systemically important functions.
Shadow Banking is defined as: ‘financial intermediation by non-banks’, and involves a
broad range of actors, activities, products and markets that operate and interact from across
different jurisdictions. It includes, repo markets, hedge funds, money market funds (MMF),
securitization vehicles and other special purpose entities (SPE’s), to name but a few. An
essential role is played by the largest investment banks, connecting the different shadow bank
entities through their role as dealer, broker and underwriter. This makes these banks pivotal
nodes in the shadow banking system.
In essence shadow banking is largely a non-regulated transnational environment where
the supply and demand for financial services and products of under-regulated entities is
matched, priced, executed and institutionalized. While particular segments, markets, techniques
and actors may be regulated in a particular national jurisdiction, the shadow banking system,
the aggregate level is not. The recent financial crisis showed the dangers of national regulators
focusing exclusively on individual actors, like banks, instead of broader financial structures in
which they are embedded and the related systemic risk. This omission in the mode of regulation
has been widely recognized since 2008 and has led to the current regulatory framework of
“macro prudential regulation”. This turn in the regulation of finance, towards “the whole”
instead of “the parts”, is important to understand why the attention of policy makers has turned
to shadow banking.
The problems associated with shadow banking can broadly be divided into two areas.
First, regulatory arbitrage. This unregulated financial environment, is contrasted by the
conventional domain of banking and capital markets, which is regulated. These parallel
domains, one regulated and one unregulated, hamper attempts by national regulators to re-
regulate finance in the post crisis environment. Instead, regulating conventional capital markets
and banks may lead to ever larger flows into the shadow bank network, i.e. creating a ‘waterbed
effect’. Therefore the central issue of shadow banking, its ability to enable regulatory and tax
arbitrage, is blocking attempts to bring order in global financial markets and to rebalance the
“financial economy” and the “real economy”.
The second problematic area of shadow banking is the host of systemic risks it creates,
magnifies and obscures. These systemic risks will be discussed below. In essence, shadow
banking, recreates the classical problems of unregulated financial markets that existed in
developed economies up until central banks and governments started to act as back stop,
stopping the spread of wildfires, by providing transparency, rules and guarantees. In the absence
3
of these basic features of public intervention, shadow banks, generate pro-cyclical behavior,
enlarge information asymmetries, and allow for uncontrolled credit creation.
This study will focus on both the macro issues, discussed above, concerning the systemic
risks posed by shadow banking, as well as its micro fundaments. It will show how the global
network of shadow banking entities is rooted in offshore financial centers (OFC’s) such as the
Netherlands, Ireland and Luxembourg. In particular this study will discuss how and why, the
Netherlands is one of the central nodes in the global shadow banking system. In order to
illustrate the micro foundations, this study includes a case study of the Lehman brothers
operation in Amsterdam just before it collapsed. The aim of this report is to inform civil society
about the critical issues of shadow banking and to press all stakeholders to push for a broad
reform agenda that confronts the current “escape route” of financial intermediaries.
Critical issues of Shadow Banking
1.2. WHAT IS SHADOW BANKING?
The general description of shadow banking by the FSB (2011, 2012) is a network of non-bank
entities that intermediate credit in an unregulated market environment and outside conventional

4
banking structures, that involves (A) leverage and (B) maturity transformation. Conventional
banks are engaged in maturity transformation by taking deposits from households and
corporations and extending credit to households, corporations and the state. Long term assets
(such as mortgages) are financed with short term liabilities (such as deposits) within the bank.
Shadow banking, essentially, does the same. It transforms short term liabilities into long term
assets. The difference being that it operates outside a bank and involves a wide range of different
actors in an uncoordinated and in transparent manner. The short term liabilities, the functional
equivalents of deposits in the banking system, are primarily money market funds (MMF’s),
hedge funds and repo transactions (FSB 2011; FED NY 2010). The long term assets are
typically a variety of structured asset backed paper owned by structured investment vehicles,
other special purpose entities and conduit structures (IMF 2011triffin;Alain UK). What we see
is that these shadow banking entities combined, create a chain, connecting short term funds
with to long term assets, and hence perform the task of maturity transformation and create
leverage, just like regular banks.
The credit that was intermediated through this chain of shadow banking entities was an
estimated 20 trillion in the US, in 2008 compared to 12 trillion in the conventional banking
system (NY FED 2010). A study by the NY FED shows how the liablities of shadow banking
entities overtook the liabilities of conventional banking in the mid 1990s. As the financial crisis
progressed the liabilities of shadow banking entities in the US declined to 16 trillion in 2010.
The FSB quantifed the world total liabilities of shadow banking at 60 trillion in 2008, up from
27 trillion in 2002 (FSB 2011). While this exercise in trying to quantify the size of the market
of shadow banking may look impressive, it is important to understand that these are prelimenary
studies and little is yet known about the nature and interconnectedness of different entities, the
methods to disentangle the capital flows, and double counting of assets and liabilities.
One particular set of interconnections that is critical to the policy debates is the relation
between shadow banking and regular banks. As we witnessed with the collapse of the subprime
market in 2007, the complex interconnections of modern finance, created different types of
infections, freezing markets, previously understood to operate at large distance from structured
finance. Instead of conceptualizing these two banking domains as separate, Adair Turner,
chairman of the financial services authority in the UK, argues that “we need to understand
shadow banking not as something parallel to and separate from the core banking system, but
deeply intertwined with it.”
5
“Shadow banking could, at least theoretically, exist as a standalone system parallel to
but quite separate from banking. But in practice it didn’t;; rather the shadow banking
system which actually developed involved complex interconnections between the
banking system and shadow banks”
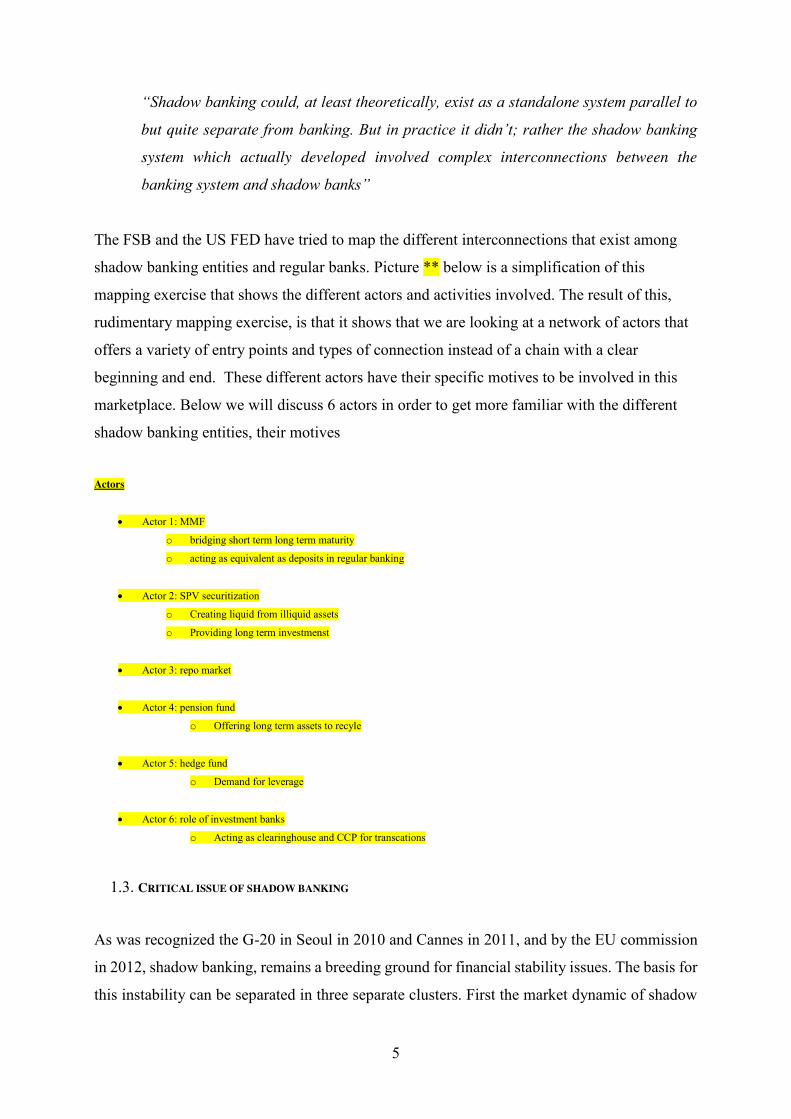
The FSB and the US FED have tried to map the different interconnections that exist among
shadow banking entities and regular banks. Picture ** below is a simplification of this
mapping exercise that shows the different actors and activities involved. The result of this,
rudimentary mapping exercise, is that it shows that we are looking at a network of actors that
offers a variety of entry points and types of connection instead of a chain with a clear
beginning and end. These different actors have their specific motives to be involved in this
marketplace. Below we will discuss 6 actors in order to get more familiar with the different
shadow banking entities, their motives
Actors
Actor 1: MMF
o bridging short term long term maturity
o acting as equivalent as deposits in regular banking
Actor 2: SPV securitization
o Creating liquid from illiquid assets
o Providing long term investmenst
Actor 3: repo market
Actor 4: pension fund
o Offering long term assets to recyle
Actor 5: hedge fund
o Demand for leverage
Actor 6: role of investment banks
o Acting as clearinghouse and CCP for transcations
1.3. CRITICAL ISSUE OF SHADOW BANKING As was recognized the G-20 in Seoul in 2010 and Cannes in 2011, and by the EU commission
in 2012, shadow banking, remains a breeding ground for financial stability issues. The basis for
this instability can be separated in three separate clusters. First the market dynamic of shadow

6
banking is prone for procyclic behavior, is nontransparent and inherently instable. Second, the
absence of a backstop by a public authority, a lender of last resort, creates the type of market
problems that characterized the US financial system up until the federal reserve was setup after
the ‘panic of 1907’. Third, the transnational nature of shadow banking, and its embeddedness
in a web of offshore financial centers and tax haven makes it a showcase for regulatory
arbitrage, which hampers attempts to regulate this market segment.
1.3.1. Nature of instability
Shadow banking proved to be unstable after the collapse of Lehman Brothers. Different types
markets froze, turned illiquid and collapsed, pointing to complex interconnections between
different domains of modern financial markets. According to the FSB (2012) the lack of
transparency in separate segments of shadow banking and on their interconnections remains a
prime obstacle for regulators to comprehend and police the market. This lack of transparency
is found at the macro level and the micro level. In particular the cross border and the bilateral
nature of transactions creates an opaque market environment, where existing statistics, methods
and techniques provide insufficient oversight to national regulators (FSB 2012).
Next to problems of transparency is the issue of procyclicality. As shadow banking
connects across separated markets a change in the valuation of collateral in one market
influences another. As particular long term assets experience a boom, like mortgage backed
securities (MBS) did up until 2007, their use in the hypothecation process (repo markets and
MMF) also increases. Once the market for (ABS) collapsed so did its use as collateral in
hypothecation. This shows that the change in the valuation of collateral is enhanced in good
times and reduced in bad times and hence means that the market operates procyclical, i.e.
enforces booms and busts (FSB 2012).
Short term credit – enforces procyclical behavior and contributes to overall instability
“Shadow banking activities are exposed to similar financial risks as banks, without
being subject to comparable constraints imposed by banking regulation and
supervision. For example, certain shadow banking activities are financed by short-
term funding, which is prone to risks of sudden and massive withdrawals of funds by
clients.” (EU commission 2012)

7
problem of high leverage
“High leverage can increase the fragility of the financial sector and be a source of
systemic risk. Shadow banking activities can be highly leveraged with collateral funding
being churned several times, without being subject to the limits imposed by regulation
and supervision.” (EU commission 2012)
1.3.2. Bank runs and the absence of a public backstop
Shadow banking entities do not have access to the central bank acting as lender of last
resort.
This absence of a public backstop means confidence can evaporate
This means that modern finance is back to pre 1907, i.e. the panic of 1907 after which
the US fed was setup to act as public backstop
This also increases the public costs as regulated banks are affected by a crisis in the
shadow banking circuit, as we saw with the recent financial crisis
1.3.3. Embeddedness in offshore financial centers and tax havens
Next to these issues of financial instability, shadow banking thrives in offshore financial centers
and enables the conditions to avoid taxes (Palan et al 2011). Shadow banking consists of a
variety of actors, discussed above, that often operate across different national jurisdictions. This
geography matters for ability of different entities to create complex transnational
interconnections. This in turn enables regulatory arbitrage. While regulation remains
predominantly confined to the national scale, the network of shadow bank entities often
operates across borders on a global scale. The growing transnational nature of corporations
from the 1980s onwards was identified by the IMF as a “fiscal termite”, i.e. a source for tax
avoidance (IMF 2000). The growing intra-firm trade and capital flows enabled TNC’s to shift
an increasing share of profits and taxable income to offshore financial centers and tax havens
(OECD 2013).
The IMF identified innovative modes of financial intermediation, in particular derivatives
and hedge funds to be another type of “fiscal termite”, eroding the capacity of nation states to

8
tax corporations (IMF 2000). The case of Lehman Brothers, discussed below, clearly shows
how the global architecture of this bank was largely tax driven. This spatial organization of
different legal entities operating from across different jurisdictions enabled the optimal tax
planning and regulatory arbitrage. This aspect of shadow banking, which is not that different
from non-financial TNC’s, creates an extra dimension to the complexity of shadow banking.
This complexity slows down regulators in the different national jurisdictions. It obstructs the
quick and clear-cut separation of entities, responsibilities, assets and liabilities that is required
in a crisis situation. Moreover it can lead to obscured leverage and counter party risk.
The Netherlands is known to be a pivotal offshore financial center for capital flows related
to activities of TNC’s, banks and non-bank financial institutions (DNB 2012; EU 2012; FSB
2012). Other financial centers that perform a similar task of pass-through jurisdiction are Ireland
and Luxembourg. An IMF study1, “in search of a definition for offshore financial centers”,
concluded (IMF 2007):
“As indicated above, the current definitions of OFCs do not adequately capture the intrinsic
feature of the OFC phenomenon, which is its raison d’être—the provision of financial
services to nonresidents, namely, exports of financial services. Although one could argue
that any given economy, to some extent, provides financial services, the peculiarity of OFCs
is that they have specialized in the supply of financial services on a scale far exceeding the
needs and the size of their economies. The following definition attempts to capture that
feature so characteristic of OFCs.
An OFC is a country or jurisdiction that provides financial services to nonresidents on a
scale that is incommensurate with the size and the financing of its domestic economy.”
Another similar definition of an OFC is provided by Liz Dixon of the Bank of England (2001):
“An OFC may be defined as a jurisdiction in which transactions with non-residents far
outweigh transactions related to the domestic economy”
Furthermore Dixon states that the nature of OFC’s as pass-through jurisdiction means that:
1 Zoromé (2007)
9
“data on OFC-intermediated business might provide an early indication of interesting
developments in global finance. Because financial intermediation undertaken by entities
based in many OFC’s is almost entirely ‘entrepot’, the pattern of financial flows through
them may occasionally give a clearer reading of developments than data on flows
through other international financial centers, such as London and New York, where
activity related to the domestic economy is greater.”
Central to the way these OFC’s operate are the wide range of pass-through entities or Special
Purpose Entities (SPE’s) domiciled in their jurisdiction. These entities, ranging from wholly
owned subsidiaries to complex and opaque ownership structures mostly operate as “brass plate”
firm, or “letter-box” company, with no economic activity in the jurisdiction in which they are
domiciled, but generate large capital flows. The different subsidiaries of Lehman Brothers in
the EU, further elaborated in chapter 4 below, serve as example of how unmanned legal entities,
SPE’s, with no economic substance, were able to issue complex and opaque structured notes.
This points to the need to address more carefully the relation between the different types
of pass through entities, the underlying economy of specialized service providers, lawyers,
fiduciary services, accountants and trusts, and why these entities are geographically
concentrated, in a small number of offshore centers like Luxembourg, the Netherlands and
Ireland. This serves to understand how the network of shadow bank entities is able to operate
effectively across borders, circumventing regulation and taxes. Before having a closer look at
Lehman Brothers this study will focus on the Netherlands to provide context to the debate on
how offshore finance and shadow banking relate.
The Netherlands as a hub in global shadow banking 3.1 THE DUTCH OFFSHORE FINANCIAL CENTER IN INTERNATIONAL CONTEXT
The Netherlands is an offshore financial center, according to the definition, quoted above, that
stresses the size of the export of financial services in relation to the domestic economy. By
different measures the Netherlands is a large financial entrepot, with large inward and outward
flows in relation to its domestic economy. This section provides an overview of different capital
flows through which we can contextualize the importance of the Netherlands as OFC. If we
10
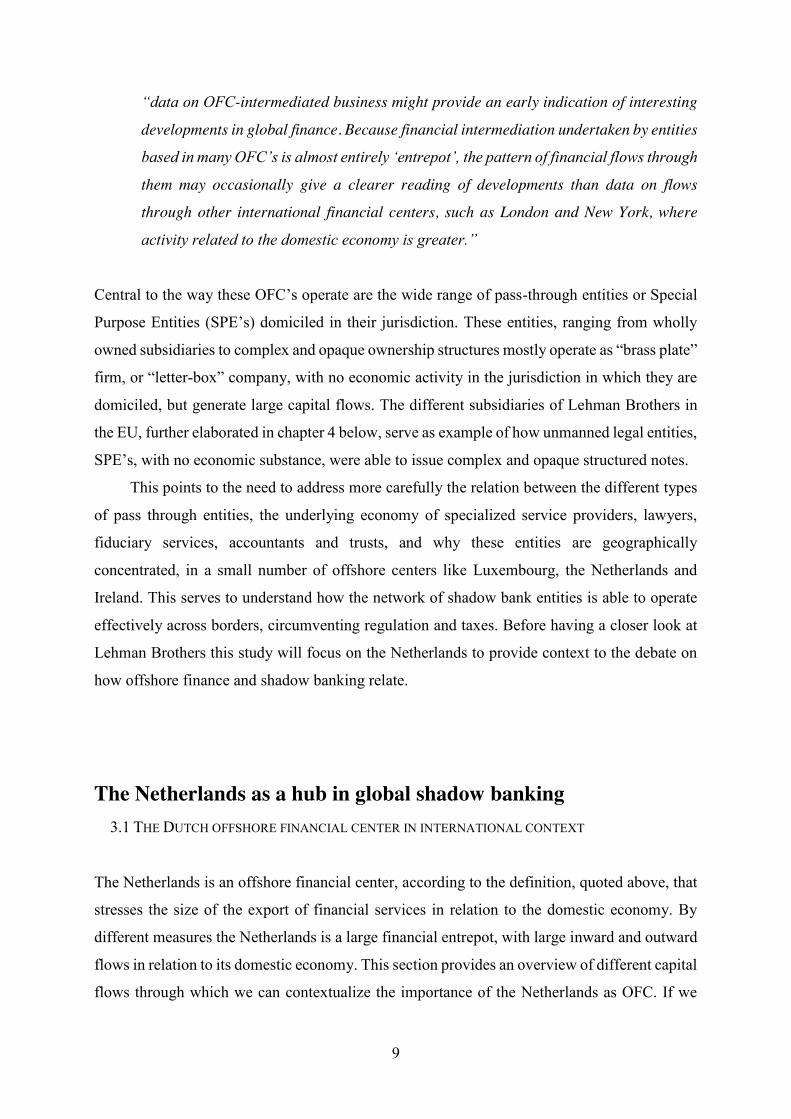
look at IMF data on foreign portfolio equity investment (FPEI), in table 1 below, the
Netherlands, together with other OFC’s, like the Cayman Islands, Luxembourg and Ireland
features on the list of ten largest jurisdictions for flows in 2011. The Netherlands together with
Luxembourg, however, are the only two OFC’s that feature in the top ten in both liabilities and
assets.
Table 1. Largest ten jurisdictions by holdings and liabilities of FPEI in billion dollar years end of 2011.
holdings Liabilities United States 6,815,650 United States 8,274,515 Japan 3,375,244 United Kingdom 3,423,282 United Kingdom 3,219,158 Germany 2,807,698 Luxembourg 2,670,504 France 2,678,837 Germany 2,380,350 Cayman Islands 1,907,790 France 2,366,447 Luxembourg 1,833,818 Ireland 1,854,040 Netherlands 1,833,668 Netherlands 1,430,193 Japan 1,416,636 Switzerland 1,084,613 Italy 1,176,617 Italy 1,030,634 Canada 1,122,323
Source: http://cpis.imf.org
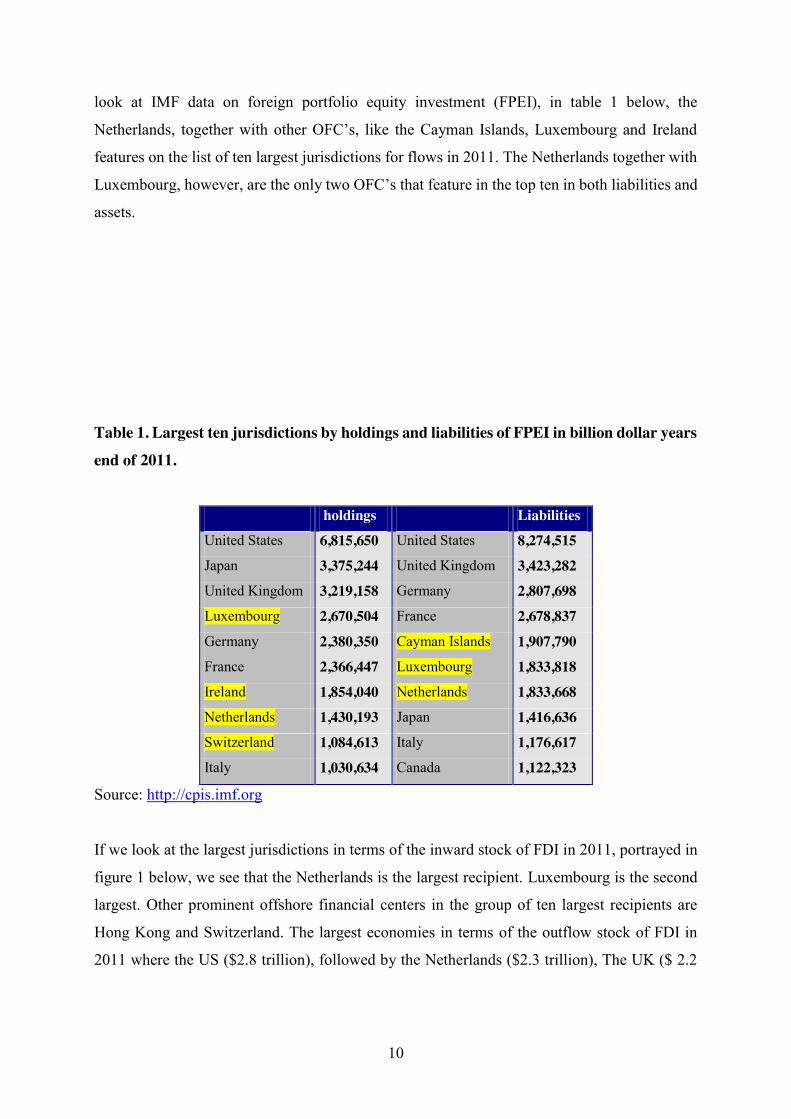
If we look at the largest jurisdictions in terms of the inward stock of FDI in 2011, portrayed in
figure 1 below, we see that the Netherlands is the largest recipient. Luxembourg is the second
largest. Other prominent offshore financial centers in the group of ten largest recipients are
Hong Kong and Switzerland. The largest economies in terms of the outflow stock of FDI in
2011 where the US ($2.8 trillion), followed by the Netherlands ($2.3 trillion), The UK ($ 2.2
11
trillion) and Luxembourg ($1.8 trillion) (IMF data).2 Again we see that the Netherlands and
Luxembourg feature prominently in both the inward and outward stock of FDI.
Next to exceptionally large volumes of FDI in relation to its national economy, the other feature
of the Netherlands, and other OFC’s, is that these flows are typically generated by special
purpose entities (SPE’s) or other ‘brass plate’ pass-through vehicles with no or little economic
substance. The purpose of these entities is to provide a formal domicile in a jurisdiction and
primarily act as conduit structure to re-route capital for tax planning purposes. According to the
OECD: “In general terms SPE’s are entities with no or few employees, little or no physical
presence in the host economy, whose assets and liabilities represent investments in or from
other countries, and whose core business consists of group financing or holding activities”
OECD 2013.
The bureau of economic analysis (BEA) of the US department of commerce provides
data for investments in holdings. This is a proxy for investment flows into SPE’s. This data
shows the bilateral FDI flows from the point of view of the US economy. The dominance of
OFC’s in outbound FDI flows is evident. Figure 2 below shows the largest 13 jurisdictions in
2 http://elibrary-data.imf.org/Report.aspx?Report=11666810
0
500.000
1.000.000
1.500.000
2.000.000
2.500.000
3.000.000
3.500.000
Mill
ion
of d
olla
r
Figure 1. Top ten reporting inward FDI stock in 2011
Source: IMF
12
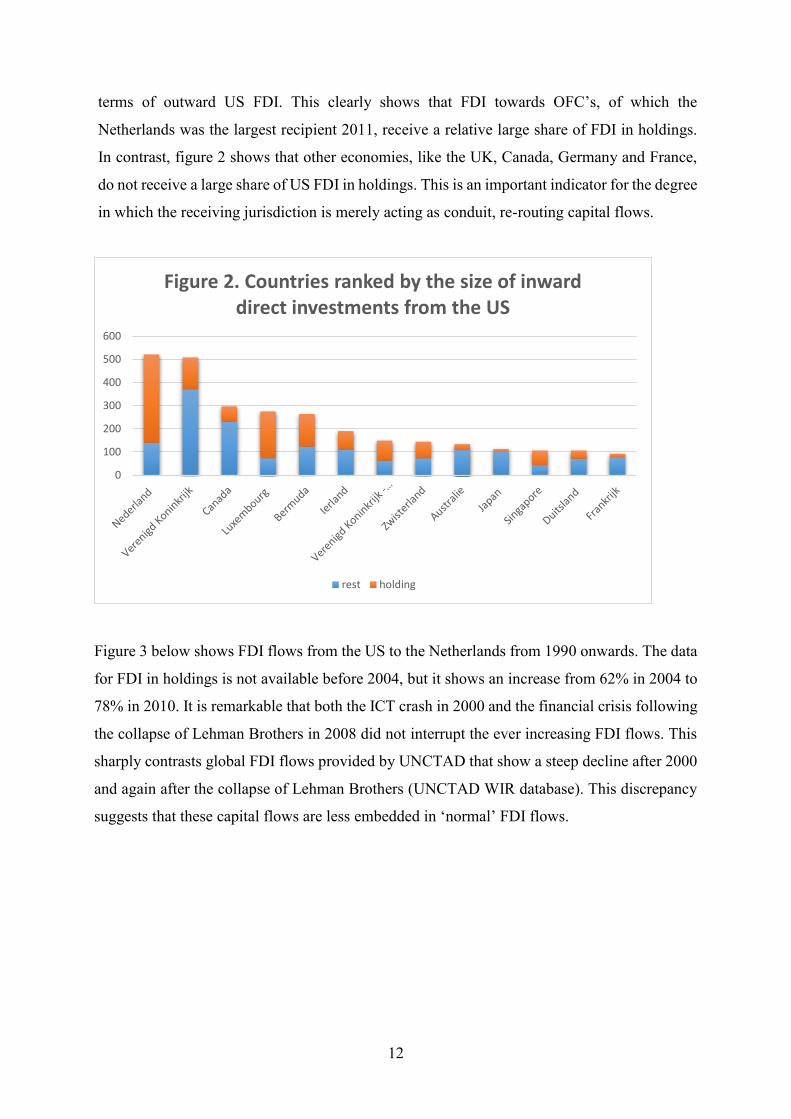
terms of outward US FDI. This clearly shows that FDI towards OFC’s, of which the
Netherlands was the largest recipient 2011, receive a relative large share of FDI in holdings.
In contrast, figure 2 shows that other economies, like the UK, Canada, Germany and France,
do not receive a large share of US FDI in holdings. This is an important indicator for the degree
in which the receiving jurisdiction is merely acting as conduit, re-routing capital flows.
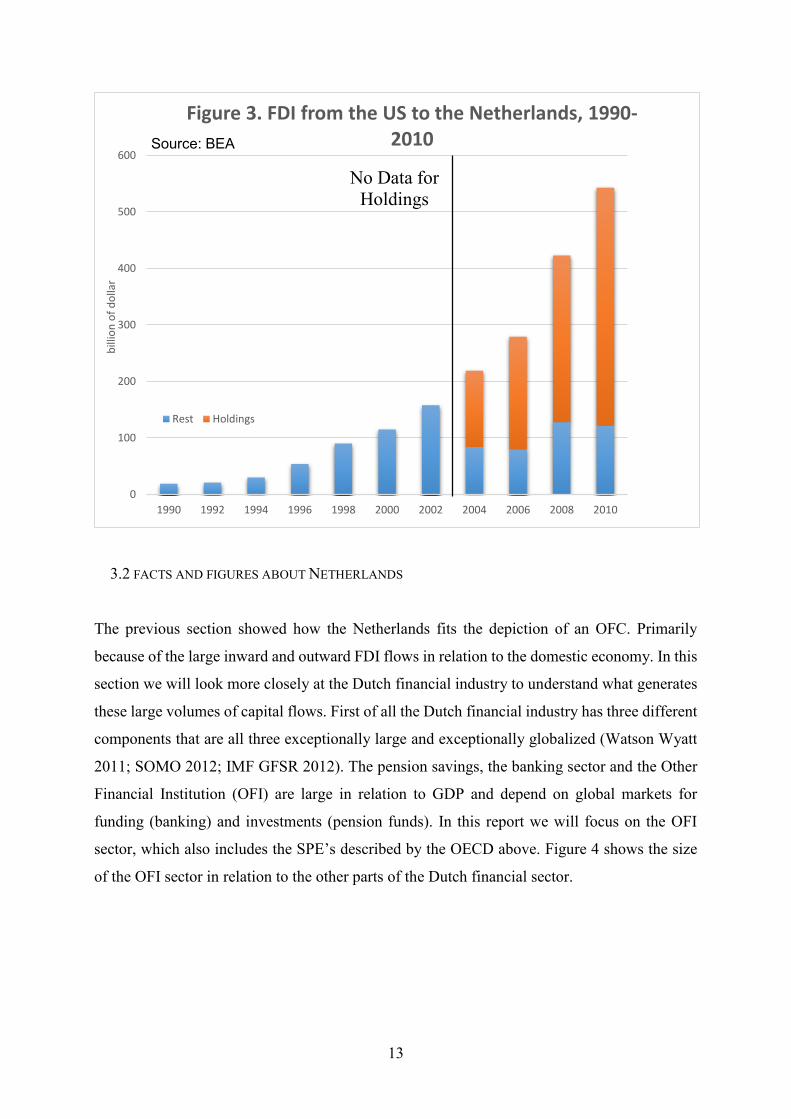
Figure 3 below shows FDI flows from the US to the Netherlands from 1990 onwards. The data
for FDI in holdings is not available before 2004, but it shows an increase from 62% in 2004 to
78% in 2010. It is remarkable that both the ICT crash in 2000 and the financial crisis following
the collapse of Lehman Brothers in 2008 did not interrupt the ever increasing FDI flows. This
sharply contrasts global FDI flows provided by UNCTAD that show a steep decline after 2000
and again after the collapse of Lehman Brothers (UNCTAD WIR database). This discrepancy
suggests that these capital flows are less embedded in ‘normal’ FDI flows.
0
100
200
300
400
500
600
Figure 2. Countries ranked by the size of inward direct investments from the US
rest holding
13
3.2 FACTS AND FIGURES ABOUT NETHERLANDS
The previous section showed how the Netherlands fits the depiction of an OFC. Primarily
because of the large inward and outward FDI flows in relation to the domestic economy. In this
section we will look more closely at the Dutch financial industry to understand what generates
these large volumes of capital flows. First of all the Dutch financial industry has three different
components that are all three exceptionally large and exceptionally globalized (Watson Wyatt
2011; SOMO 2012; IMF GFSR 2012). The pension savings, the banking sector and the Other
Financial Institution (OFI) are large in relation to GDP and depend on global markets for
funding (banking) and investments (pension funds). In this report we will focus on the OFI
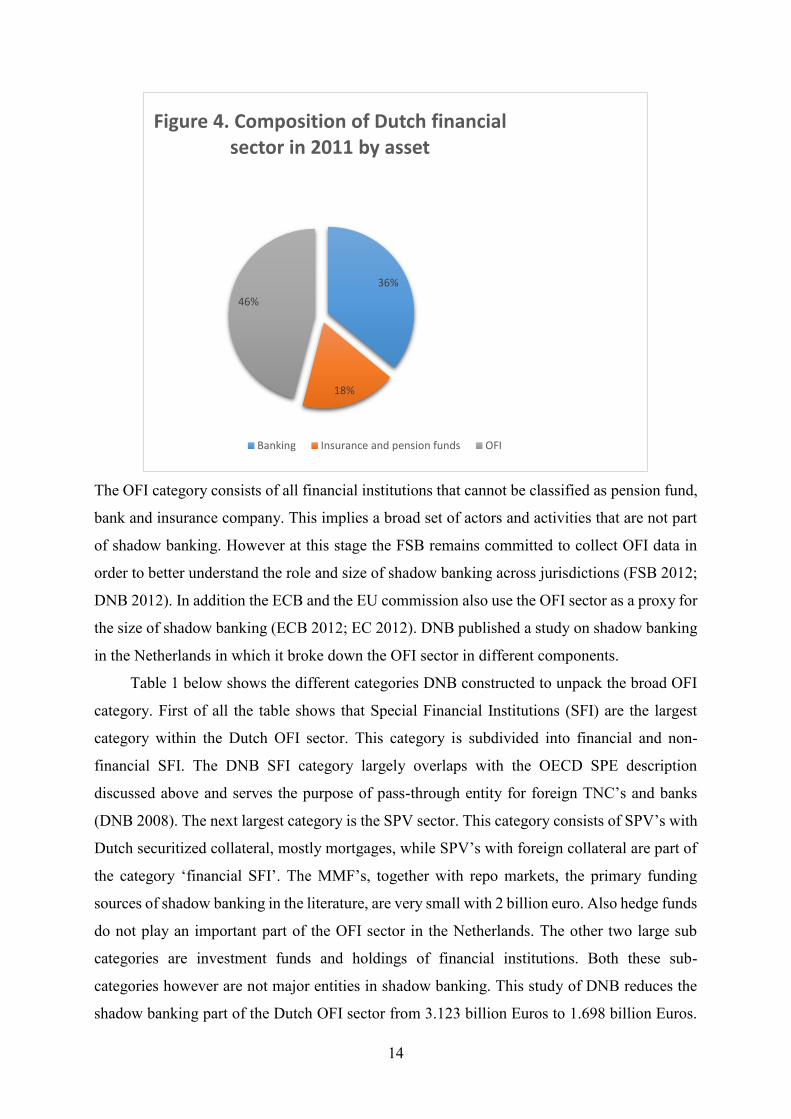
sector, which also includes the SPE’s described by the OECD above. Figure 4 shows the size
of the OFI sector in relation to the other parts of the Dutch financial sector.
0
100
200
300
400
500
600
1990 1992 1994 1996 1998 2000 2002 2004 2006 2008 2010
billi
on o
f dol
lar
Figure 3. FDI from the US to the Netherlands, 1990-2010
Rest Holdings
Source: BEA
No Data for Holdings
14
The OFI category consists of all financial institutions that cannot be classified as pension fund,
bank and insurance company. This implies a broad set of actors and activities that are not part
of shadow banking. However at this stage the FSB remains committed to collect OFI data in
order to better understand the role and size of shadow banking across jurisdictions (FSB 2012;
DNB 2012). In addition the ECB and the EU commission also use the OFI sector as a proxy for
the size of shadow banking (ECB 2012; EC 2012). DNB published a study on shadow banking
in the Netherlands in which it broke down the OFI sector in different components.
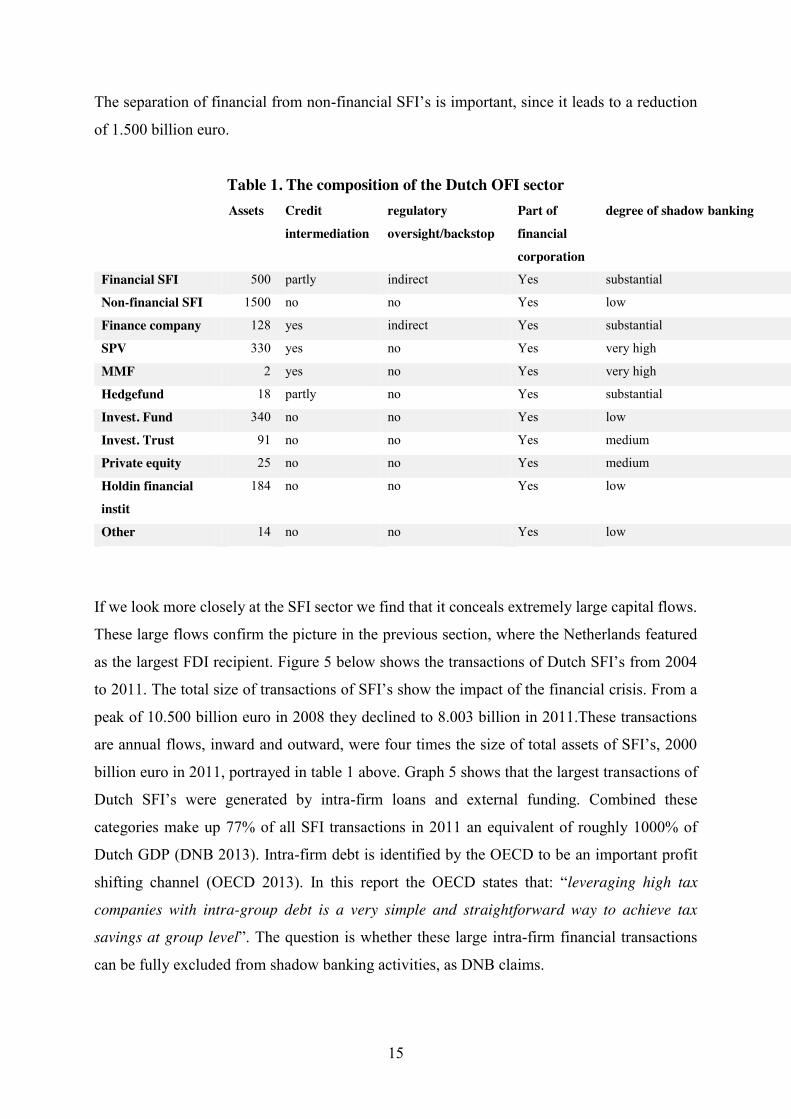
Table 1 below shows the different categories DNB constructed to unpack the broad OFI
category. First of all the table shows that Special Financial Institutions (SFI) are the largest
category within the Dutch OFI sector. This category is subdivided into financial and non-
financial SFI. The DNB SFI category largely overlaps with the OECD SPE description
discussed above and serves the purpose of pass-through entity for foreign TNC’s and banks
(DNB 2008). The next largest category is the SPV sector. This category consists of SPV’s with
Dutch securitized collateral, mostly mortgages, while SPV’s with foreign collateral are part of
the category ‘financial SFI’. The MMF’s, together with repo markets, the primary funding
sources of shadow banking in the literature, are very small with 2 billion euro. Also hedge funds
do not play an important part of the OFI sector in the Netherlands. The other two large sub
categories are investment funds and holdings of financial institutions. Both these sub-
categories however are not major entities in shadow banking. This study of DNB reduces the
shadow banking part of the Dutch OFI sector from 3.123 billion Euros to 1.698 billion Euros.
36%
18%
46%
Figure 4. Composition of Dutch financial sector in 2011 by asset
Banking Insurance and pension funds OFI
15
The separation of financial from non-financial SFI’s is important, since it leads to a reduction
of 1.500 billion euro.
Table 1. The composition of the Dutch OFI sector Assets Credit
intermediation
regulatory
oversight/backstop
Part of
financial
corporation
degree of shadow banking
Financial SFI 500 partly indirect Yes substantial
Non-financial SFI 1500 no no Yes low
Finance company 128 yes indirect Yes substantial
SPV 330 yes no Yes very high
MMF 2 yes no Yes very high
Hedgefund 18 partly no Yes substantial
Invest. Fund 340 no no Yes low
Invest. Trust 91 no no Yes medium
Private equity 25 no no Yes medium
Holdin financial
instit
184 no no Yes low
Other 14 no no Yes low
If we look more closely at the SFI sector we find that it conceals extremely large capital flows.
These large flows confirm the picture in the previous section, where the Netherlands featured
as the largest FDI recipient. Figure 5 below shows the transactions of Dutch SFI’s from 2004
to 2011. The total size of transactions of SFI’s show the impact of the financial crisis. From a
peak of 10.500 billion euro in 2008 they declined to 8.003 billion in 2011.These transactions
are annual flows, inward and outward, were four times the size of total assets of SFI’s, 2000
billion euro in 2011, portrayed in table 1 above. Graph 5 shows that the largest transactions of
Dutch SFI’s were generated by intra-firm loans and external funding. Combined these
categories make up 77% of all SFI transactions in 2011 an equivalent of roughly 1000% of
Dutch GDP (DNB 2013). Intra-firm debt is identified by the OECD to be an important profit
shifting channel (OECD 2013). In this report the OECD states that: “leveraging high tax
companies with intra-group debt is a very simple and straightforward way to achieve tax
savings at group level”. The question is whether these large intra-firm financial transactions
can be fully excluded from shadow banking activities, as DNB claims.

16
3.3 THE DUTCH HUB IN SHADOW BANKING
In this section we will compare the OFI statistics from different sources in order to better
understand the role of OFC’s in shadow banking. The first graph shows the development of
selected global financial and economic indicators between 2004 and 2010. It shows that the size
of the global OFI sector kept pace with the growth rate of world GDP. This figure also shows
that the size of regular banking, at the global scale, remains significantly larger than the OFI
sector. This contrasts the data provided by the New York Federal Reserve study on Shadow
banking (Pozsar et al 2010). This study showed that in the US shadow banking had outgrown
the size of regular banking since 1992 and reached a peak in 2008 of 20 trillion dollar (regular
banking was roughly $15 trillion in 2008) in the US. This shows that the rise of shadow banking
has not been equal across regions.
0
2000
4000
6000
8000
10000
12000
2004 2005 2006 2007 2008 2009 2010 2011
Figure 5. Composition of Dutch SFI transactions in Billion of Euro
participation intra-firm loan securities and derivatives external funding

17
The geography of shadow banking is concentrated in developed economies. Some economies,
however, stand out in shadow banking assets and transactions. The US and the UK harbor the
world’s largest financial centers, New York and London that are the natural habitat of
innovative modes of financial intermediation that underpin shadow banking. The US is the
birthplace of MMF’s and remains pivotal for MMF’s and repo transactions (ECB 2012). In the
BRIC countries, on the other hand, shadow banking, and other types of innovative financial
intermediation are not widespread. In India for instance the size of the OFI sector was 21% of
GDP (375 billion dollar) while the regular banking sector was 86% of GDP in 2011(Sinha
2013).
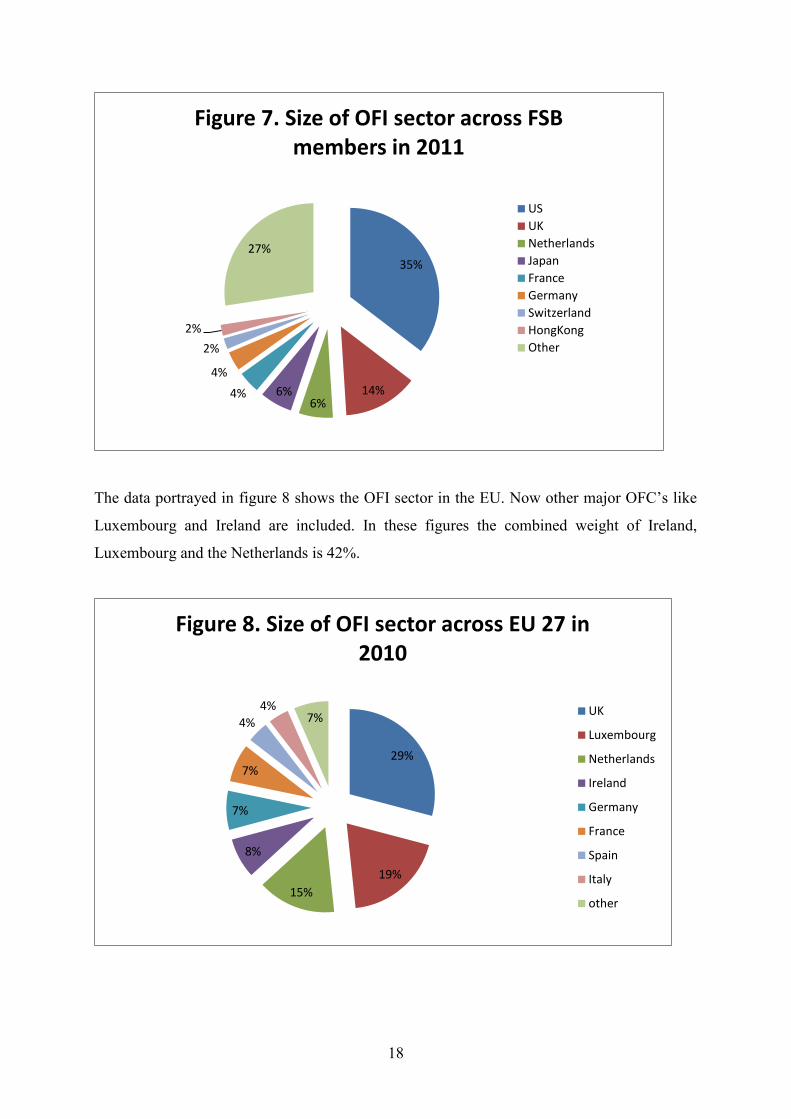
Figure 7 below shows the size of the OFI sector across the different FSB members. The
US and the UK, with respectively 34% and 14% of OFI assets are the leading shadow bank
jurisdiction. Next are Japan and the Netherlands with both 6% of FSB assets. Japan is the third
largest economy and Tokyo remains one of the central global financial centers. The Netherlands
on the other hand is not a major economy but an OFC, which captures large global OFI flows
through its SPE’s, discussed above. In this FSB, Ireland and Luxembourg are absent.
0
20000
40000
60000
80000
100000
120000
2002 2003 2004 2005 2006 2007 2008 2009 2010
Billi
ons o
f Dol
lar
Figure 6. Selected global banking, capital markets, shadow banking, stockmarket and GDP statistics
GDP World stock market capitalizationpublic debt securities private debt securitiesBank assets OFI assets
source: IMF GFSR 2004, 2005, 2006. 2007, 2008, 2009, 2010, 2011, 2012 (all April), except OFI source is FSB 2012
18
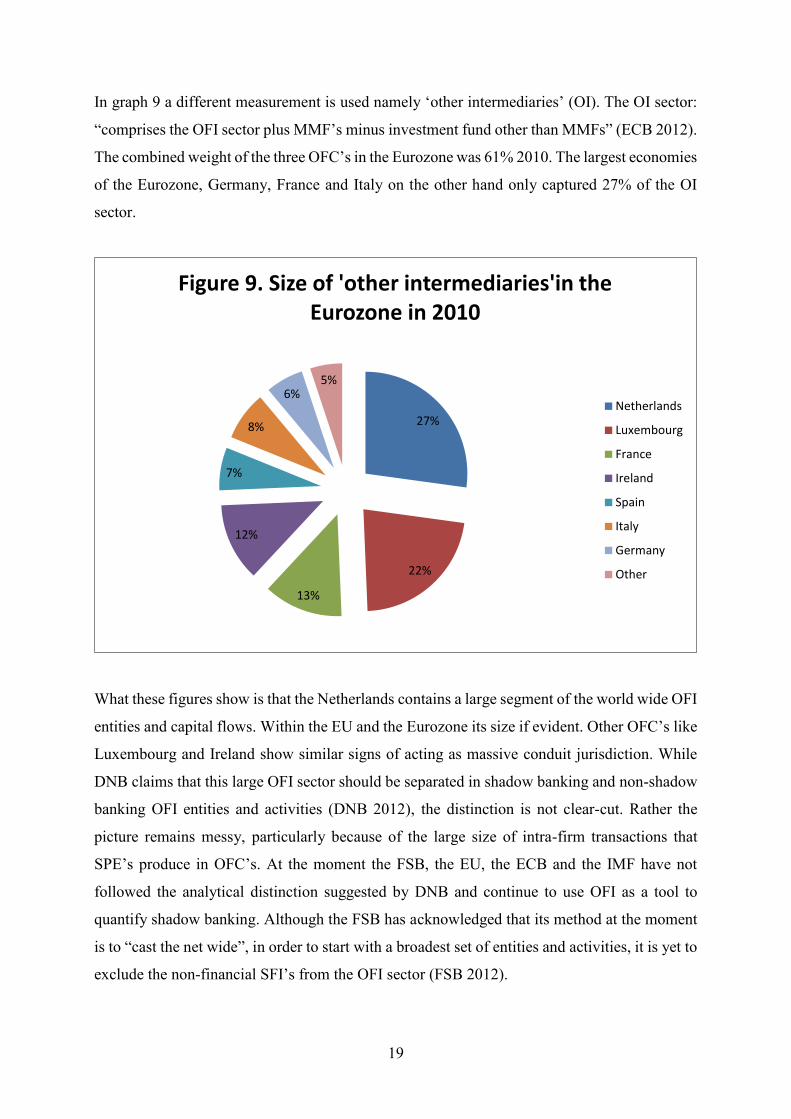
The data portrayed in figure 8 shows the OFI sector in the EU. Now other major OFC’s like
Luxembourg and Ireland are included. In these figures the combined weight of Ireland,
Luxembourg and the Netherlands is 42%.
35%
14%6%
6%4%4%
2%2%
27%
Figure 7. Size of OFI sector across FSB members in 2011
USUKNetherlandsJapanFranceGermanySwitzerlandHongKongOther
29%
19%15%
8%
7%
7%
4%4%
7%
Figure 8. Size of OFI sector across EU 27 in 2010
UK
Luxembourg
Netherlands
Ireland
Germany
France
Spain
Italy
other
19
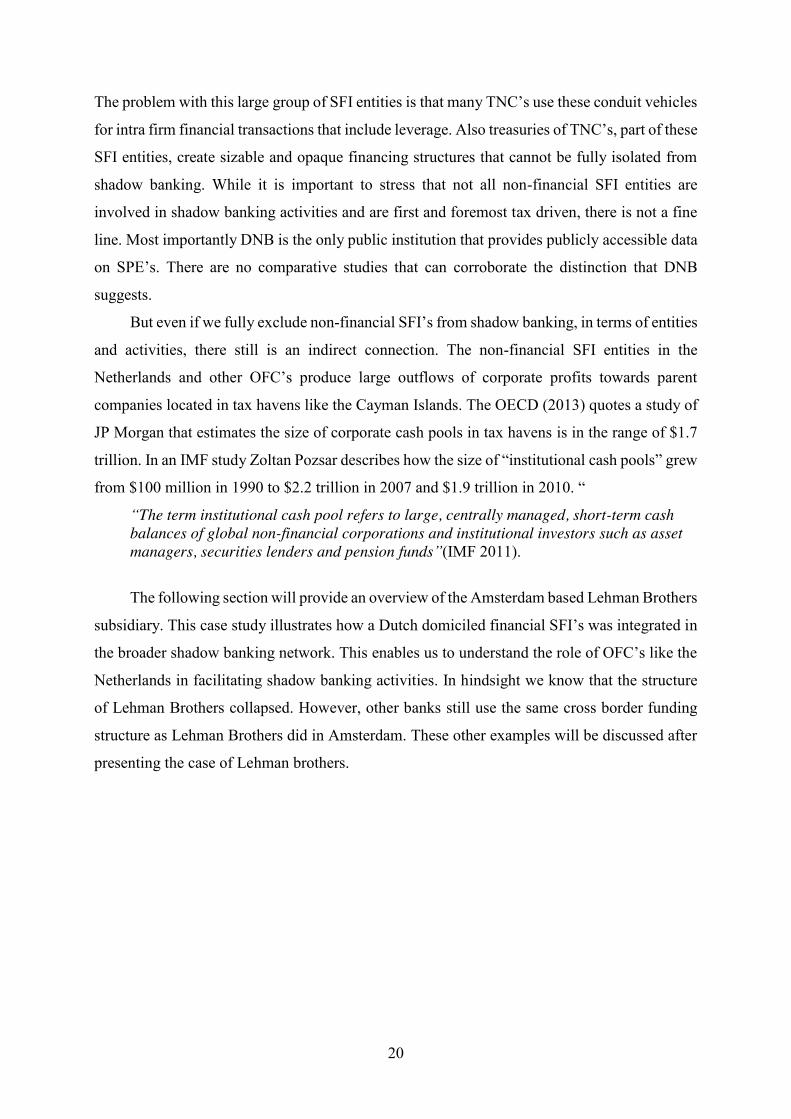
In graph 9 a different measurement is used namely ‘other intermediaries’ (OI). The OI sector:
“comprises the OFI sector plus MMF’s minus investment fund other than MMFs” (ECB 2012).
The combined weight of the three OFC’s in the Eurozone was 61% 2010. The largest economies
of the Eurozone, Germany, France and Italy on the other hand only captured 27% of the OI
sector.
What these figures show is that the Netherlands contains a large segment of the world wide OFI
entities and capital flows. Within the EU and the Eurozone its size if evident. Other OFC’s like
Luxembourg and Ireland show similar signs of acting as massive conduit jurisdiction. While
DNB claims that this large OFI sector should be separated in shadow banking and non-shadow
banking OFI entities and activities (DNB 2012), the distinction is not clear-cut. Rather the
picture remains messy, particularly because of the large size of intra-firm transactions that
SPE’s produce in OFC’s. At the moment the FSB, the EU, the ECB and the IMF have not
followed the analytical distinction suggested by DNB and continue to use OFI as a tool to
quantify shadow banking. Although the FSB has acknowledged that its method at the moment
is to “cast the net wide”, in order to start with a broadest set of entities and activities, it is yet to
exclude the non-financial SFI’s from the OFI sector (FSB 2012).
27%
22%
13%
12%
7%
8%
6%5%
Figure 9. Size of 'other intermediaries'in the Eurozone in 2010
Netherlands
Luxembourg
France
Ireland
Spain
Italy
Germany
Other
20
The problem with this large group of SFI entities is that many TNC’s use these conduit vehicles
for intra firm financial transactions that include leverage. Also treasuries of TNC’s, part of these
SFI entities, create sizable and opaque financing structures that cannot be fully isolated from
shadow banking. While it is important to stress that not all non-financial SFI entities are
involved in shadow banking activities and are first and foremost tax driven, there is not a fine
line. Most importantly DNB is the only public institution that provides publicly accessible data
on SPE’s. There are no comparative studies that can corroborate the distinction that DNB
suggests.
But even if we fully exclude non-financial SFI’s from shadow banking, in terms of entities
and activities, there still is an indirect connection. The non-financial SFI entities in the
Netherlands and other OFC’s produce large outflows of corporate profits towards parent
companies located in tax havens like the Cayman Islands. The OECD (2013) quotes a study of
JP Morgan that estimates the size of corporate cash pools in tax havens is in the range of $1.7
trillion. In an IMF study Zoltan Pozsar describes how the size of “institutional cash pools” grew
from $100 million in 1990 to $2.2 trillion in 2007 and $1.9 trillion in 2010. “
“The term institutional cash pool refers to large, centrally managed, short-term cash balances of global non-financial corporations and institutional investors such as asset managers, securities lenders and pension funds”(IMF 2011).
The following section will provide an overview of the Amsterdam based Lehman Brothers
subsidiary. This case study illustrates how a Dutch domiciled financial SFI’s was integrated in
the broader shadow banking network. This enables us to understand the role of OFC’s like the
Netherlands in facilitating shadow banking activities. In hindsight we know that the structure
of Lehman Brothers collapsed. However, other banks still use the same cross border funding
structure as Lehman Brothers did in Amsterdam. These other examples will be discussed after
presenting the case of Lehman brothers.
21
Lehman Brothers Treasury B.V.: the Dutch link in the worldwide operations of Lehman Brothers.
4.1. LEHMAN BROTHERS: A GLOBAL NETWORK OF SUBSIDIARIES
The collapse of Lehman Brothers (LB) in 2008 showed how one of the largest and most
successful wall street investment banks disintegrated into chaos, leaving behind a highly
complex web of unwound inner company debt, derivative transactions, and joint financing
programs, connected by subsidiaries across the planet. Most of the subsidiaries, over 70, where
located in the state of Delaware in the US, a well documented tax haven. Other tax havens and
offshore financial centers that acted as steppingstone for LB where the Caiman Islands with
over 30 affiliates, Hong Kong, Singapore, Switzerland, The Dutch Antilles, Luxembourg and
Ireland.
The ultimate owner of all the LB subsidiaries was Lehman Brothers Holding Inc (LBHI),
incorporated in Delaware. Underneath this holding a variety of subsidiaries operated
independently of each other. Some subsidiaries, acted as independent units, and operated
different affiliates themselves. Lehman Brothers Inc, among other activities like investment
banking and merchant banking, was one of the largest brokerage companies in the US, acting
as primary broker for the Federal Reserve Bank of New York. The Neuberger Berman Inc was
an investment advisory firm with assets under management worth 140 billion Dollar and a range
of activities like tax planning, trust services, mutual funds, institutional management and private
asset management. The London cluster housed a number of affiliates that where involved in the
full range of services and products, from private banking, brokerage, underwriting to
investment banking. The German based Lehman Brothers Bankhaus AG had a fully-licensed
German bank, involved in corporate finance, securities dealing and had its own affiliate in
London.
Next to these subsidiaries in the larger financial centers, that employed personnel, that
where regulated, that were members of stock exchanges, and had a clear physical presence,
often in an iconic building, representing their status as one of the portals to one of the prime
investment banks in the world, we find a wide range of shell companies. These subsidiaries,
mostly without any employee and no rental contract or ownership of real estate, where scattered
across many jurisdictions. The nature of these subsidiaries was always highly specialized as
opposed to the subsidiaries in the larger financial centers that offered a wide range of services,

22
and catered to a broad public, private, public and institutional. Instead these shell companies
almost exclusively interacted with other LB entities and where booking entities, pass-through
entities, issuing vehicle, and other type of special purpose entities for a variety of financial
transaction. These empty shells where the machinery of LB outside the prime financial centers,
through which regulation and taxes could be circumvented to achieve the optimum corporate
structure across different jurisdictions.
For instance, the two vehicles located in Luxembourg where specialized into being repo
counterpart and as issuance vehicle for securities that where hedged by derivatives by other LB
entities, respectively. The Swiss subsidiary was the central vehicle to book the equity
derivatives business, including OTC transactions and a broad range of specialized derivatives
products. The subsidiary incorporated in the Netherlands Antilles was a fully owned subsidiary
of the Lehman Brothers Asia holdings, and was primarily involved with issuing equity and debt
certificates. This case study will focus on a subsidiary which is located in this web of shell
companies, outside the larger financial centers, without employees, no physical presence and
primarily a vehicle for inter-company transactions, for the purpose of regulatory and fiscal
arbitrage. This case study describes the role of the Amsterdam based SPE within the broader
structure of LB and focuses on the motives to use the Netherlands as a preferred location to
issue debt. This in turn helps to understand the role of the Netherlands as a prominent pass-
through jurisdiction in the broader shadow banking network.
4.2.LEHMAN BROTHERS IN AMSTERDAM: A SHELL COMPANY ACTING AS CONDUIT FOR THE
GLOBAL LEHMAN BROTHERS OPERATIONS
The Dutch subsidiary of LB, Lehman Brothers Treasury B.V. (LBTBV), was established in
Amsterdam in 1995. Figure 2. shows the ownership structure on the left side and the services
provided by other LB entities on the right side. LBTBV was fully owned by LB UK holdings
(Delaware) Inc, which in turn was fully owned by the ultimate parent, LBHI. As LBTBV was
a typical shell company, without employees, or office, it required other LB entities to do the
actual work, primarily the treasury function (holding and moving capital across accounts) and
secretarial work. The treasury function was provided by the Swiss based LB Bank SA. The
secretary functions where performed by the London based LB Holdings Plc. In the middle
section of figure 2. we see intertrust, A Dutch trust company that arranged and managed the
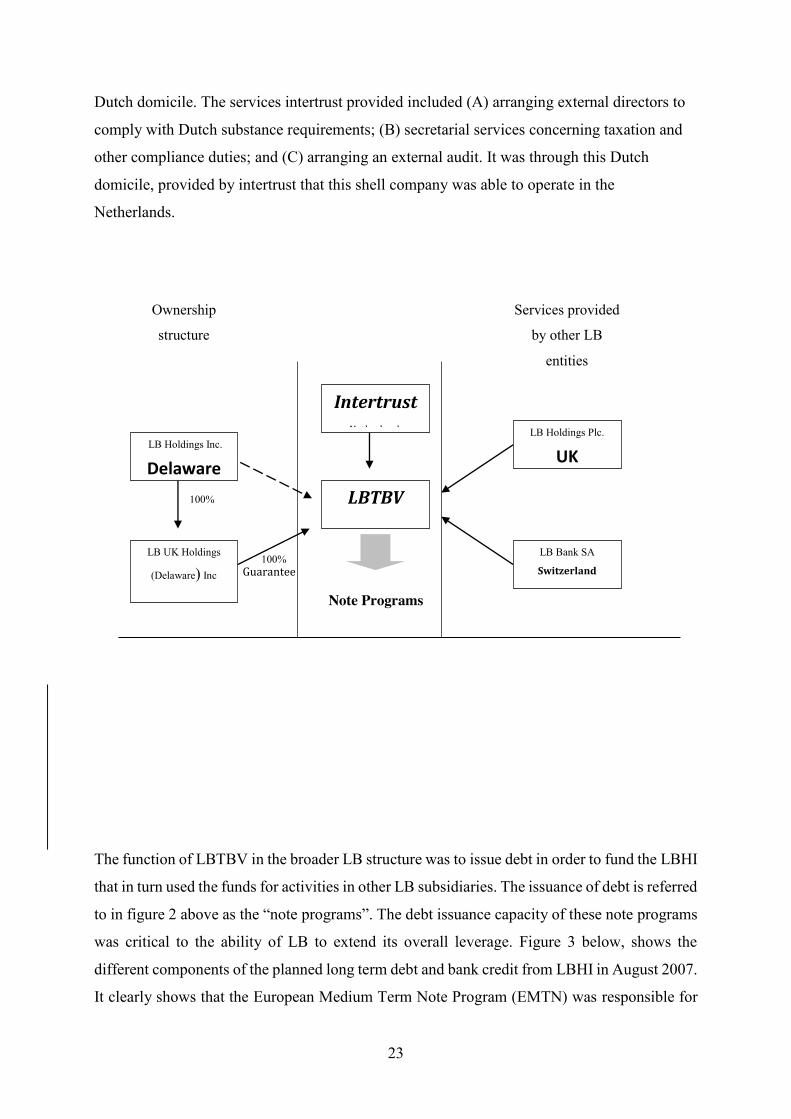
23
Dutch domicile. The services intertrust provided included (A) arranging external directors to
comply with Dutch substance requirements; (B) secretarial services concerning taxation and
other compliance duties; and (C) arranging an external audit. It was through this Dutch
domicile, provided by intertrust that this shell company was able to operate in the
Netherlands.
The function of LBTBV in the broader LB structure was to issue debt in order to fund the LBHI
that in turn used the funds for activities in other LB subsidiaries. The issuance of debt is referred
to in figure 2 above as the “note programs”. The debt issuance capacity of these note programs
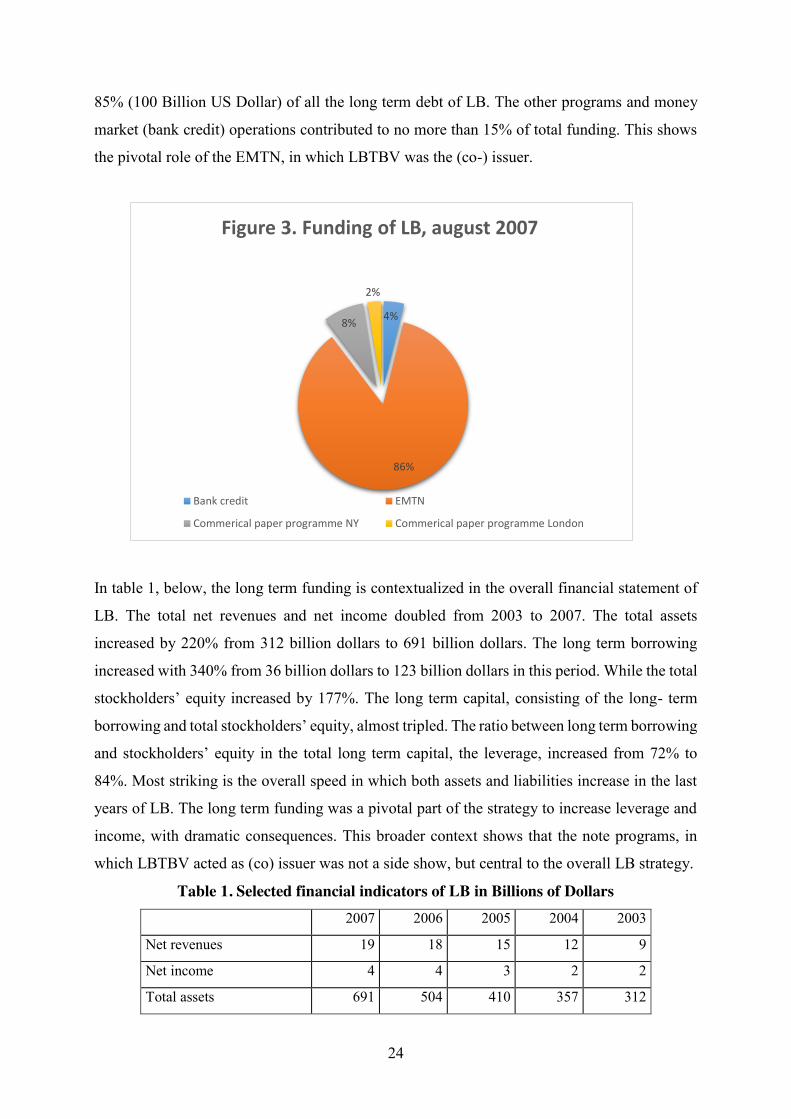
was critical to the ability of LB to extend its overall leverage. Figure 3 below, shows the
different components of the planned long term debt and bank credit from LBHI in August 2007.
It clearly shows that the European Medium Term Note Program (EMTN) was responsible for
LB Holdings Inc.
Delaware LBTBV
LB UK Holdings
(Delaware) Inc
Delaware
Intertrust Netherlands
LB Bank SA
Switzerland
LB Holdings Plc.
UK
100%
100%
Services provided
by other LB
entities
Ownership structure
Note Programs
Guarantee
24
85% (100 Billion US Dollar) of all the long term debt of LB. The other programs and money
market (bank credit) operations contributed to no more than 15% of total funding. This shows
the pivotal role of the EMTN, in which LBTBV was the (co-) issuer.
In table 1, below, the long term funding is contextualized in the overall financial statement of
LB. The total net revenues and net income doubled from 2003 to 2007. The total assets
increased by 220% from 312 billion dollars to 691 billion dollars. The long term borrowing
increased with 340% from 36 billion dollars to 123 billion dollars in this period. While the total
stockholders’ equity increased by 177%. The long term capital, consisting of the long- term
borrowing and total stockholders’ equity, almost tripled. The ratio between long term borrowing
and stockholders’ equity in the total long term capital, the leverage, increased from 72% to
84%. Most striking is the overall speed in which both assets and liabilities increase in the last
years of LB. The long term funding was a pivotal part of the strategy to increase leverage and
income, with dramatic consequences. This broader context shows that the note programs, in
which LBTBV acted as (co) issuer was not a side show, but central to the overall LB strategy.
Table 1. Selected financial indicators of LB in Billions of Dollars 2007 2006 2005 2004 2003
Net revenues 19 18 15 12 9
Net income 4 4 3 2 2
Total assets 691 504 410 357 312
4%
86%
8%
2%
Figure 3. Funding of LB, august 2007
Bank credit EMTN
Commerical paper programme NY Commerical paper programme London

25
Long-term borrowing 123 81 54 49 36
Total stockholders’ equity 23 19 17 15 13
Total long-term capital 146 100 71 64 49
Source: Annual report 2007
4.3.THE NOTE PROGRAMS OF LBTBV
The EMTN, portrayed in figure 3 above, was one of four different note programs in which
LBTBV acted as issuer. These other note programs included the German note program (4
billion Euro) and the Swiss note program (2 billion dollar). All these programs consisted in
setting up a consortium of different LB subsidiaries, each with its particular architecture, to
issue and sell debt certificates. However, while the note programs had a stipulated maximum
of debt issuance, these thresholds where not reached before LB went bankrupt. Therefore the
total issuance was lower than the structures, setup under the different note programs, allowed.
Graph 1 below portrays the debt ceiling set by the EMTN. It shows that the maximum issuance
was increased in a number of steps since the note program was established in 1995. The latest
and largest increase was in 2007 when LB increased the maximum debt issuance from 60 billion
to 100 billion dollar.
0
20
40
60
80
100
120
1995 1996 1997 1998 1999 2000 2001 2002 2003 2004 2005 2006 2007 2008
Billi
on o
f Dol
lar
Graph 1. Maximimum debt isuance of EMTN
26
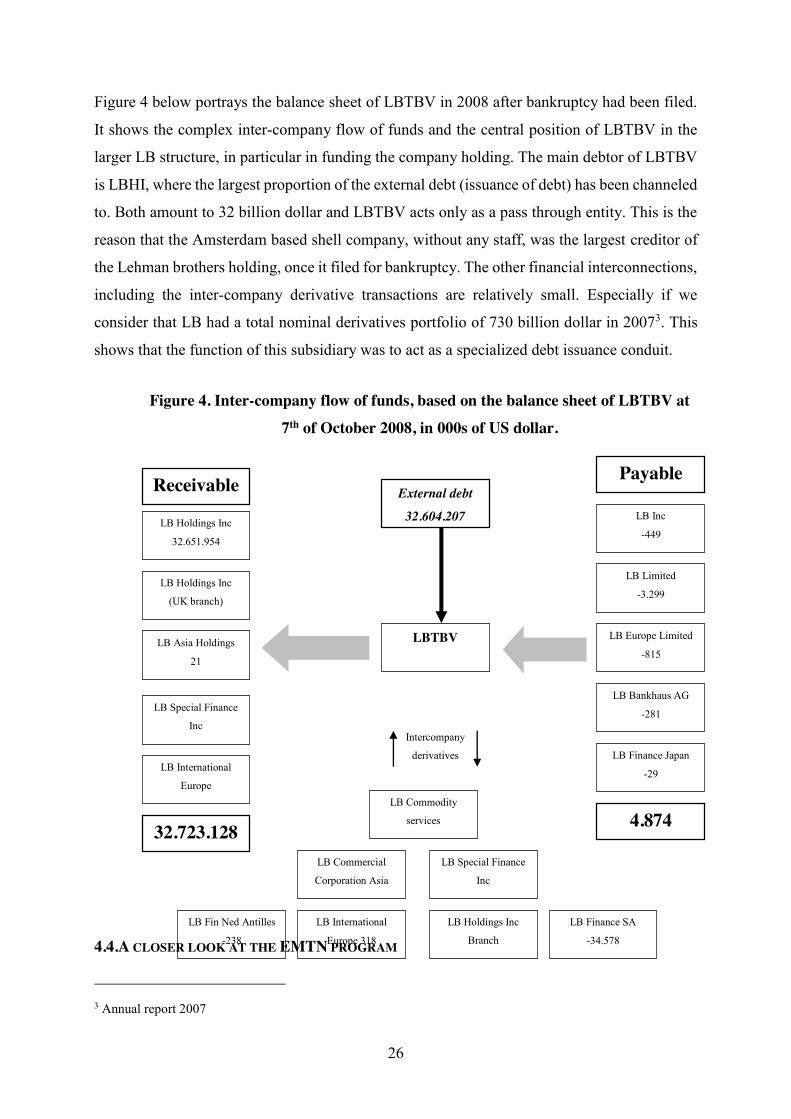
Figure 4 below portrays the balance sheet of LBTBV in 2008 after bankruptcy had been filed.
It shows the complex inter-company flow of funds and the central position of LBTBV in the
larger LB structure, in particular in funding the company holding. The main debtor of LBTBV
is LBHI, where the largest proportion of the external debt (issuance of debt) has been channeled
to. Both amount to 32 billion dollar and LBTBV acts only as a pass through entity. This is the
reason that the Amsterdam based shell company, without any staff, was the largest creditor of
the Lehman brothers holding, once it filed for bankruptcy. The other financial interconnections,
including the inter-company derivative transactions are relatively small. Especially if we
consider that LB had a total nominal derivatives portfolio of 730 billion dollar in 20073. This
shows that the function of this subsidiary was to act as a specialized debt issuance conduit.
Figure 4. Inter-company flow of funds, based on the balance sheet of LBTBV at 7th of October 2008, in 000s of US dollar.
4.4.A CLOSER LOOK AT THE EMTN PROGRAM
3 Annual report 2007
LB Special Finance
Inc
445
LB Holdings Inc
(UK branch)
70.365
LB Holdings Inc
32.651.954
LB Asia Holdings
21
LB International
Europe
341
LB Commercial
Corporation Asia
145
LB Special Finance
Inc
232.308
LBTBV
LB Fin Ned Antilles
-238
LB Inc
-449
LB Commodity
services
-121
LB Finance Japan
-29
LB Europe Limited
-815
LB Bankhaus AG
-281
LB Limited
-3.299
LB Finance SA
-34.578
External debt
32.604.207
Receivable Payable
4.874 32.723.128
LB International
Europe 318
LB Holdings Inc
Branch
-30
Intercompany
derivatives

27
The EMTN program was established in 1995, the same year LBTBV founded (Euronote 1995).
The three original issuing parties where (A) LBTBV, (B) LBHI and (C) the London domiciled
Lehman Brothers Holding Plc (LBHP).4 In 2001 LBHP seized to be an issuing party, and in
2004, the German domiciled Lehman Brothers Bankhaus AG (LBB), became an issuing party.
The purpose of the EMTN program was to issue notes “from time to time”, “in one or more
series”, “outside of the United States”.
In short the EMTN program organized the cooperation of different LB subsidiaries in issuing
debt instruments outside of the US. This allowed LB to mobilize funds without the regulatory
scrutiny of the SEC. The issued notes, however, where “irrevocably and unconditionally
guaranteed” by LBHI. The arranger and dealer of the program was the London based, Lehman
Brothers International Europe (LBIE).
This organizational structure remained largely unchanged throughout the note program. What
changed where the exchanges on which the notes were listed. The first notes where issued on
the exchanges of Paris, Luxembourg, and London in 1999. In 2001 the notes were listed on the
exchange of London, Singapore, Luxembourg and Australia (Euronote 2001). In 2008 the notes
were listed on exchange of Ireland, Singapore and Australia (Euronote 2008). Also in the 2008
program the diversity of types of notes, level of complexity and domestically adjusted notes
was greatly enlarged. For instance, specific notes where issued for Norway, Denmark, Sweden,
Finland, Australia and New Zeeland. These notes where issued in the respective currencies of
these countries and each fulfilled the national regulatory and fiscal requirements (Euronote
2008). What we see is that the level of complexity increased as the EMTN program progressed
in time. The role of the London based LBIE remained the workhorse of the program acting as
arranger and dealer, and LBTVB remained the conduit that was connected to an increasing
amount of subsidiaries in ever more different participating countries.
4 http://www.lehmanbrotherstreasury.com/pdf/english/docs/1999/50180LehmanBrosInfoMemo%5B1%5D.PDF
, LBTBV Managing Directors account 2007.
28
5. Lehman Brother look-alike entities in the Netherlands: can “it” happen again?
The case above describes how Lehman Brothers operated through SPE’s in the Netherlands and
elsewhere. This was primarily to avoid withholding taxes and to create a transnational layer of
complexity. The activities of LBTBV were not supervised in the Netherlands by DNB. Instead
the US was responsible for the supervision of the Dutch entity of Lehman Brothers (DNB 2012).
The use of the exchanges of Luxembourg and Ireland to list the notes issued in the Netherlands
is yet another layer of complexity.
This financial architecture, however, was not restricted to Lehman Brothers. It was and
still is the typical model for financial institutions and banks that seek to setup a conduit structure
in the Netherlands. The format these banks and financial institutions use is identical to the
structure described in the Lehman Brothers case. The financing structures are about creating ad
hoc divisions of labor for each tranche of debt that is issued. Sometimes the structure is copied
and extended for another issuance, but most often the actors involved and the division of labor
among them changes only slightly. The main tasks to divide are: the “arranger”, the “lead
manager”, the “main stabilizer”, the “swap counterparty”, the “cash manager”, and the “seller
and servicer”. In the case of Lehman brother these tasks were all performed by Lehman entities.
In the case of other financing structures that have a conduit structure in the Netherlands we
often find a collaboration of two or more globally active banks.
Moreover these structures combine the following features:
A. The London branch of the globally active bank acts as lead manager and arranger;
B. The Dutch entity (SPE) is a shell company and formally acts as issuer of the notes;
C. A large Dutch trust firm is responsible for all local administrative tasks and
responsibilities that are related to a Dutch domicile and tax ruling;
D. Administrative functions related to the note program, are conducted by one or
more banks located in the UK;
E. The notes are listed on the exchanges of Ireland, Luxembourg, or both, but are
also sold OTC;
F. The notes are not offered to US buyers that are not “qualified institutional
investors”, in accordance with regulation S.

29
An example of this structure is the securitization program of the FCE bank. FCE bank is an
independent UK based bank that acts as finance vehicle for the Ford Motor Company. It
finances both retail activities and wholesale and intercompany transactions.5 The funding of
this credit institution relied on securitization for around 40% of its operations from 2005 to
2012. For each yearly tranche of securitized assets, the FCE bank setup a separate Dutch legal
entity (an SPE). For instance the 2012 tranche of 531 million euro was issued by the SPE named
“Globaldrive Auto Receivables 2012-A B.V.”.6 The SPE that issued 508 million euro of
securitized assets in 2011 was named “Globaldrive Auto Receivables 2011-A B.V”. If we
compare both issuing structures we find that in the 2011 tranche, Barclays, Deutsche Bank and
HSBC, were the lead managers and lead arrangers. In 2012 the lead managers were Bank of
America Merrill Lynch, Credit Agricole Corporate investment Bank, HSBC, SMBC Nikko.
An example of the issuance of debt by a foreign bank with a complex collateral is
provided by “Morgan Stanly Investment Management Coniston B.V.” which constructs
CDO’s.7 Unlike Lehman Brothers, which dealt exclusively with other Lehman brothers
subsidiaries, this SPE is organized as follows. The collateral manager is Morgan Stanly. The
collateral administrator is Deutsche bank (London branch) and the arranger is Citi group global
markets limited. Another SPE from Morgan Stanly in Amsterdam, also issuing notes backed
by a collateral of CDO’s in 2007, used Lehman Brothers Europe as arranger, and Deutsche
Bank London branch as collateral administrator.8
Another example is the “Asset Repackaging Trust Five B.V.”. This is a Dutch based SPE
that since 2001 issues debt to fund securitized mortgages. It operates within a note program
with a maximum of 10 billion dollar (August 31 2011). Its lead arranger is the London branch
of Deutsche Bank. In this case the London Branch of Deutsche Bank also acts as swap
counterpart and issuing and paying agent. The Dutch SPE is domiciled by “Equity Trust”, one
of the largest trust firms in the Netherlands. The notes are listed on the exchange in Dublin and
restricted in their global sales according to US regulation S.
These examples show that the architecture Lehman Brothers used is the general rule in
the world of SPE’s, investment banking and TNC’s that seek external funding in the
5 In the FCE bank annual report on 2012, p 6, we find that 56% of the loans advanced where retail and 44% were
wholesale. See: http://www.fcebank.com/reports/2012_Annual_FCEReport.pdf 6 See: http://credit.ford.com/webcontent/absus/2012-A_Prospectus_BLACK_FINAL.pdf 7 See: http://www.ise.ie/debt_documents/morgstaninvmancon_9831.pdf 8 See: http://www.ise.ie/debt_documents/morgan%20stanley%20inv%20P_9991.pdf

30
Netherlands. The exceptionally large capital flows that that enter and exit the Netherlands,
discussed above, are largely the result of activities of these SPE’s. Although we need to
differentiate between financial and non-financial SFI’s, discussed above, it is clear that both
operate in the same market environment. Both types of SFI’s use similar legal methods and an
identical architecture in which Dutch specialized service providers organize the domicile in the
Netherlands. We see that the legal structure and trust industry that enable TNC’s to operate
through shell-companies, allow financial institutions, banks and shadow bank entities to embed
their operations in a network of OFC’s. This shows that the issue of tax avoidance and shadow
banking largely overlap. This also means that the type of uncontrolled funding that Lehman
Brothers was engaged in, is widely available for other financial institutions and therefore needs
to be addressed.
6. Conclusion
The world of finance progressively moved away from traditional banking in the decades
preceding the financial crisis of 2008. Particularly since the 1990s we saw how the use of
innovative forms of intermediation, like securitization, the use of MMF’s and Repo markets
accompanied an increasing leverage in developed economies. These complex forms of
intermediating credit outside the traditional banking system where coined shadow banking.
This banking system consists of a network of intermediaries that interact from across different
jurisdictions. Essential to this geography is the role of OFC’s, like the Netherlands,
Luxembourg and Ireland, that act as conduit jurisdiction. These locations do not harbor the
higher value added services, we find in first-tier financial centers like New York and London,
but instead we find a specialized service industry that supports pass-through entities.
These jurisdictions enable financial institutions to create levels of complexity and allow
for tax avoidance. The large scale use of SPE’s, shell–companies, that offer domicile in OFC’s,
for financial and non-financial institution is at the heart of creating layers of complexity that
only add to the systemic risk and the erosion of the tax base. The data show that OFC’s contain
a massive part of global financial flows. As discussed above we see that the combined weight
of Luxembourg, the Netherlands and Ireland in the EU 27 was 42% of all OFI transactions. The
case of Lehman Brothers shows how a consortium of legal entities operated from across EU
jurisdictions to setup a funding operation that largely operated outside the scope of any EU

31
regulatory body. Also we saw how the same architecture that Lehman Brothers used is the norm
in the world of investment banks.
This study tries to contribute to the debate on shadow banking by pointing to the role of
OFC’s and SPE’s. The major concern voiced in the policy debate by the FSB and the EU is the
set of systemic risks that shadow banking harbors. Notably the absence of a public backstop
and the highly cyclical nature market activities. Our contribution, stressing the role of OFC’s
in shadow banking, is complementary to these concerns.
We show that OFC’s matter in trying to put in place effective forms of control and
regulation for global finance. As long as OFC’s offer a safe place to SPE’s, financial institutions
and banks can continue to operate in a lightly regulated environment/ regulatory twilight zone.
This issue needs to be addressed. In the wake of the financial crisis we have seen policy
initiatives aiming at re-regulating finance in different policy communities. The debate on
shadow banking is part of these debates. As long as OFC’s are able to offer a safe haven for
financial institutions that aim to circumvent regulation and taxes we will be confronted with a
dual market environment. On the one hand we find the conventional market, which includes a
clear regulatory framework, and where the vast majority of initiatives for new banking
regulation is aimed at. On the other hand we find the financial activities that take place in the
offshore world. This duality may lead to the increased importance of shadow banking as a
means to extend and intermediate credit. Tackling the issue of OFC’s not only important for
pushing back tax avoidance, it is essential if we are to be able to properly regulate and supervise
global finance in the post-crisis world.
Part this overall goal to re-regulate finance we propose a set of measures aimed at
diminishing the levels of complexity in the cross-border funding structure of banks, financial
institutions and TNC’s. These levels of complexity are the result of tax avoidance, treaty
shopping and regulatory arbitrage. The effect of these –unnecessary- complex cross border
structures, however, are a regulatory mist. We need to address both the mist and the underlying
corporate geography.
First about the mist. Lehman Brothers should act as canary in the mine. The regulatory
structure in which US authorities are responsible for the oversight of US banks that employ a
vast amount of offshore legal entities to fund their operations should be questioned. As the rise
of shadow banking has shown, the capital flows running through these offshore entities
increased dramatically in the past decade. The shadow banking structure, which is transnational
in nature, cannot be dealt with outdated regulatory structures that remain organized at the
national scale. This means that Dutch authorities should take co-responsibility for the oversight
32
of entities of foreign banks that are active in the Netherlands. The activities of these entities
should be included in macro-prudential regulatory framework of DNB.
Secondly we need to address the overly complex cross border nature of the offshore
entities. This means tackling the underlying difference in the fiscal treatment of debt issuance.
This issue is being debated at the G-20, the EU commission and the OECD in the framework
of tax evasion and avoidance. Specifically for tax avoidance through debt issuance we propose
to increase the substance requirements for SPE’s in the Netherlands. The substance
requirements should include a higher capital adequacy ratio. SPE’s located in the Netherlands
should be required to maintain assets of no less than 2% of the total outstanding debt issued.
Third, in order to increase transparency, central banks and national statistical departments
should follow the example of the Netherlands and publish figures about SPE entities. The
figures on BFI’s in the Netherlands are vital to understand the geography and broader
development of TNC’s and banks. The OECD and the IMF should encourage member states to
provide data on SPE transactions to incorporate this information in their FDI statistics.
Finally, the OECD, the FSB, the G-20, and the EU commission should take note of the
concentration of OFI flows in a small group of countries. This uneven geography of OFI
activities shows that differences in regulation and tax regimes lie at the heart of how shadow
banking is spatially organized across jurisdictions. This should have consequences for the
analysis and policy measures. First off all the degree to which the behavior of banks and TNC’s
is shaped by fiscal considerations should be part and parcel of the approach towards shadow
banking. Secondly the discussion on tax evasion should be broadened to include the effect of
tax havens on the concentration of OFI transactions.

33
References Dixon, L. (2001). Financial flows via offshore financial centres as part of the international
financial system. Financial Stability Review, June 2001
Sinha, A. (2013). Regulation of Shadow Banking – Issues and challenges. BIS central bankers
speeches.
DNB (2012). Het schaduwbankwezen: een verkenning
DNB (2008). Nederland nog steeds aantrekkelijk voor bfi’s. Statistisch bulletin september
2008.
ECB (2012). Shadow banking in the euro area an overview. Occasional paper series, no
133/April 2012.
European Commission (2012). Non-bank financial institutions: assessment of their impact on
the stability of the financial system. Economic papers 427, November 2012.
OECD (2012).
Pozsar, Z. et al (2010). Shadow Banking. Federal Reserve Bank of New York Staff Reports
FSB (2012). Global Shadow Banking Monitoring Report 2012, 18 November 2012.
IMF (2000). fiscal termites
IMF (2007). Zorome Current rules encourage corporations to finance
Top Related