


Languages
Pages
Legal


Second Quarter 2000January - June
August 9, 2000

2
From mutual to public company
HelsinkiTelephone
HPY Holding
Freefloat
Freefloat
68,4%
100% 100%
1994 1997 1998 1999 2000
Incorporation IPO ofHTC
Transformationof legal form
Holding companylisting
Merger Renaming

3
Growth Continued During 2Q
Elisa Communications’ key figures
Revenue EUR 593m (EUR 489m), rising 21%
EBIT EUR 129m (EUR 50m), rising 158%
Pre-tax profit EUR 119m (EUR 46m), rising 161%
Earnings / share (EPS) rose 160% to EUR 0.52 (EUR 0.20)
Excluding the profit of sales of Comptel shares
EBIT rose 41% to EUR 71m
Pre-tax profit rose 34% to EUR 61m

4
Revenue Breakdown 1H/2000
285
241
66
0
50
100
150
200
250
300
Mobile Fixed Others

5
EBIT Breakdown 1H/2000
52
14
4
0
10
20
30
40
50
60
Mobile Fixed Others*
* incl. EUR 8m undivided group’s costs

6
Mobile Operations and m-business
Radiolinja Group revenue was EUR 301m, rising 30%
Radiolinjan subcriptions totalled 1,350,500, including 1,243,000 in Finland and 107,500 in Estonia. Radiolinja’s share of Finnish GSM subscriptions was app. 37%.
Radiolinja’s share of net additions was app. 45%
ARPU was EUR 40 / month (36), Q1/2000 EUR 40 / month, Q2/2000 EUR 41 / month
Churn (annualised) was 12.5% (14.2%)
Value added services accounted 10% of revenue
Radiolinja Group Jan-June
EBITDA, M€ 96% revenue 32Adj. EBITDA, M€ 124% revenue 41ARPU/month 238Churn, annualised 12,5Traffic, millions of min 812Min / connections / month 113

7
ARPU (EUR/month/subscription)
44
42
38 3840
41
30
35
40
45
50
1996 1997 1998 1999 1Q/00 2Q/00

8
Churn (annualised), %
87
9
13,6 13,7
11,6
0
2
4
6
8
10
12
14
16
1996 1997 1998 1999 1Q/00 2Q/00

9
Mobile OperationsHighlights
Radiolinja updated its corporate image and launched new services:
DJ Esko service package (WAP- type service based on SIM-technology, Internet-connection, plenty of value-added services)
Account balance reminder and account limit services
Text message directory services
Group messages via mobile phone and new mobile portal
Yahoo! Expansion via Yahoo! Sweden product launches
Testing services such as navigational system, network security, electronic payment and UMTS network
Radiolinja announced it applied for the third GSM license in Lithuania
Elisa shareholding in Radiolinja rose to 98.2%
DJ Esko

Fixed Line Network & e-Business Highlights
Internet-traffic volumes up 42%, share of total traffic at 39% (30%)
Total number of connections was 731.063 (722.646). ISDN channels exceeded 191,500 units (139,750 units ), up 37%
ADSL connections approximately 1,300 units
Comprehensive directory media: 0100100.com
Kolumbus focused on secure connection services for wireless networks

Other OperationsHighlights
Comptel growth remained strong: revenues up 50% to EUR 15.2m and operating profit up 79% to EUR 6.6m
The nation-wide distribution was concentrated on Mäkitorppa Group. Mäkitorppa’s revenues up 25% to EUR 43.4m, operating result up sharply, but still slightly in the red.
Mäkitorppa had 20 shops in Germany, new shops established in Düsseldorf and Bremen regions
Tele-shops got a new look and the new Elisa ShopIT chain was formed
Elisa founded Star Communications Oy, focusing on consulting and network design, with Jaakko Pöyry Oy taking a 30% shareholding.

Offenbach
Düsseldorf
Frankfurt
Hanau
Halle
Rostock
Mainz
Potsdam
Bremen
Hannover
Münster
Jena
Essen
Wuppertal
Bremerhaven
Saarbrücken
Leipzig
German Operations
The Group’s German operations transferred to Elisa Kommunikation GmbH. Significant change in the German operations.
Elisa Kommunikation GmbH becomes leading German city carrier -consolidator - the group has almost 30 subsidiaries and affiliates
Acquisition of TIMe start-up management GmbH including all its affiliates and subsidiaries
Ownership of Mäkitorppa GmbH transferred to Elisa Kommunikation GmbH
Berlin
13
German Operations (cont)
Elisa Kommunikation GmbH took a 100% holding in the national operator, Drillisch Festnetz GmbH in order to strengthen its voice and internet operations
The consolidated revenues of the German group are expected to reach nearly FIM 1 billion this year, and by the year end approximately 800 people will be working for the group
Heavy start-up investments generated an operating loss for Elisa Kommunikation GmbH totalling EUR 5.6m.

14
Elisa Group’s Income Statement
Elisa Communications Corporation
M€ 1-6 / 00 1-6 / 00 adj..* 1-6 / 99** Growth
Revenue 593 593 489 21 %
EBITDA 215 157 114 37 %
EBITDA margin 36 % 26 % 23 %
Depreciation 70 70 60
Goodwill depreciation 16 16 5
EBIT 129 71 50 41 %
EBIT margin 22 % 12 % 10 %
Pre Tax Profit 119 61 46 34 %
Net Profit*** 65 24 24 -2 %
EPS, EUR 0,52 0,19 0,20 -5 %
CEPS, EUR 1,22 0,89 0,74 20 %
Diluted no. of shares, mio 123,4 123,4 120,0
*Excl. Comptel’s sales profit (EUR 58m)** Comparable (without one-time items)***Excl. Holding minorities

15
Development of Revenue, EURm
491
594
375432
785
1070
0
200
400
600
800
1000
1200
1996 1997 1998 1999 1H/00

16
Pre Tax Profit, EURm
48
116
1932
80
205
0
50
100
150
200
250
1996 1997 1998 1999 1H/00

17
Fixed Asset Investments,EURm
109
11199
124
220 220
0
50
100
150
200
250
1996 1997 1998 1999 1H/00

18
Equity Ratio, %
53
60 60
5148
0
20
40
60
80
1996 1997 1998 1999 1H/00

19
Post-Fiscal Events
Elisa shareholding in KSP Yhtiöt Oyj up to 21.9%
Elisa divested Omnitele holdings and acquired its consultancy services related to broad band operations
Elisa Kommunikation GmbH acquired the Saarbrücken-based city operator, pulsaar GmbH (100%)
Partnership agreement with Micromedia - towards the most comprehensive directory (direct lines, e-mail addresses etc.)

20
Outlook for 2000
Growth prospects are better than the average growth in the sector. Revenues for the year are still expected to show about 20% growth.
EBITDA margin is expected to improve slightly
Despite heavy investments in Radiolinja and Datatie shares, and development of the German operations the management expects EBIT margin to remain at last year’s level
Development and organisation of German operations are proceeding as planned
Voice and value-added services will increase revenues of the mobile business while growth in subscriptions will slow
Subscription-based revenues (ARPU) are expected to show growth both in fixed line and mobile networks
The loss of Elisa Kommunikation GmbH is forecasted at over EUR 17m for the fiscal year

21
Appendix
22
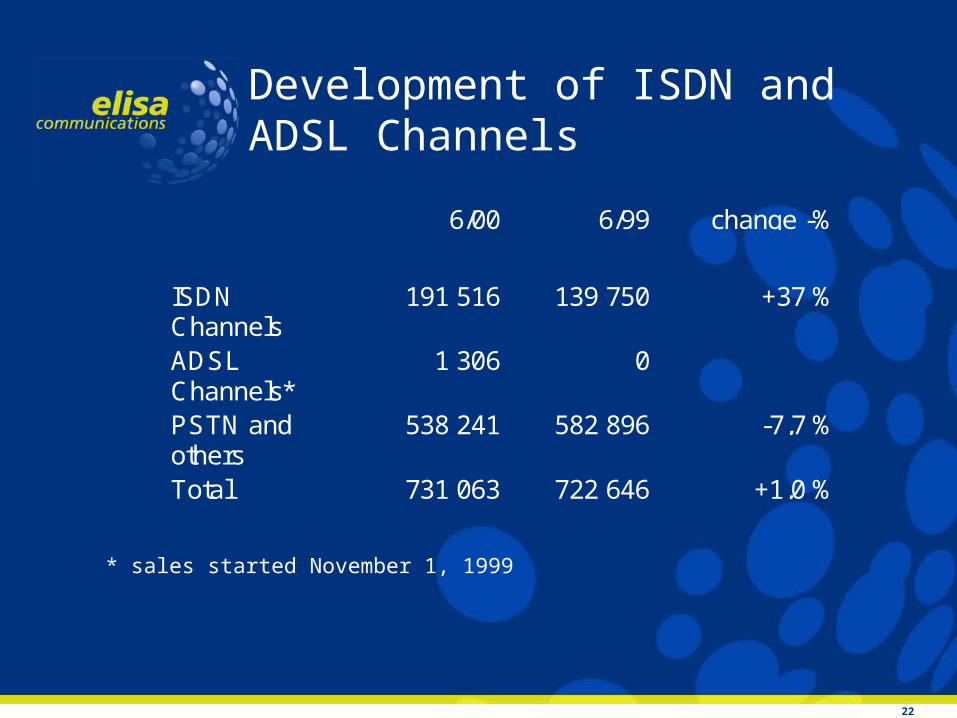
Development of ISDN and ADSL Channels
* sales started November 1, 1999
6/00 6/99 change -%
ISDNChannels
191 516 139 750 +37 %
ADSLChannels*
1 306 0
PSTN andothers
538 241 582 896 -7,7 %
Total 731 063 722 646 +1,0 %

23
Development by Quarters
171
200224
244 236256
266
313294 299
0
50
100
150
200
250
300
350
1Q/98 2Q/98 3Q/98 4Q/98 1Q/99 2Q/99 3Q/99 4Q/99 1Q/00 2Q/00
24
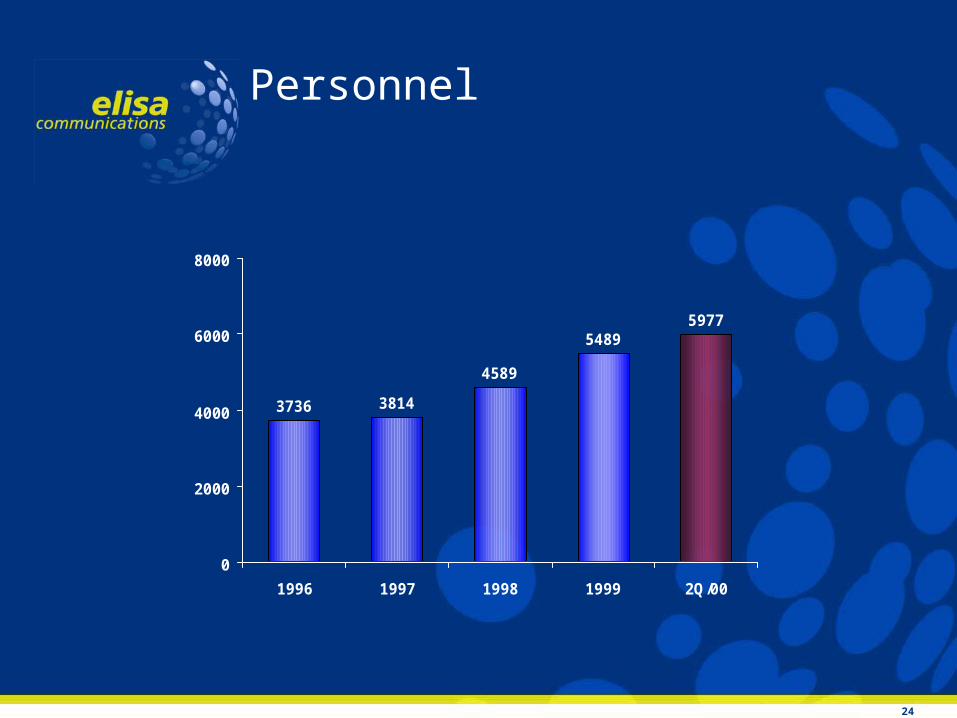
Personnel
3736 3814
4589
54895977
0
2000
4000
6000
8000
1996 1997 1998 1999 2Q/00

25
HTC Group’s Income Statement
Helsinki Telephone Corporation
M€ 1-6 / 00 1-6 / 00 adj.* 1-6 / 99 Growth
Revenue 594 594 491 21 %
EBITDA 215 157 121 30 %
EBITDA margin 36 % 27 % 25 %
Depreciation 70 70 60
Goodwill depreciation 19 19 8
EBIT 127 69 54 28 %
EBIT margin 21 % 12 % 11 %
Pre Tax Profit 116 58 48 21 %
Net Profit 62 21 24 -14 %
EPS, EUR 1,16 0,38 0,46 -16 %
CEPS, EUR 2,81 2,04 1,75 16 %
Diluted no. of shares, mio 53,4 53,4 52,1
*Excl. Comptel’s sales profit (EUR 58m)

26
Elisa Group Profit ModelJanuary 1 - June 30, 2000
FIMmHTC Profit 367,3
HPY Holding Profit 94,2Elimination of dividend -91,8 2,5
Realisation of group reserve 16,4
Minority share of HTC -125,8
Profit of HPY Holding Group 260,4
Top Related