


![14 Stall Parallel Operation [Kompatibilitätsmodus] · PDF filePiston Effect Axial Fans (none stall-free) Stall operation likely for none stall-free fans due to piston ... Stall &](https://static.fdocuments.in/doc/165x107/5a9dccd97f8b9abd0a8d46cf/14-stall-parallel-operation-kompatibilittsmodus-effect-axial-fans-none-stall-free.jpg)


Languages
Pages
Legal


School of Aerospace EngineeringComputational Analysis of Stall and Computational Analysis of Stall and
Separation Control in Separation Control in Centrifugal CompressorsCentrifugal Compressors
Presented By
Alexander SteinSchool of Aerospace EngineeringGeorgia Institute of Technology
Supported by the U.S. Army Research Office Under the Multidisciplinary University Research Initiative (MURI) on Intelligent Turbine Engines
2
School of Aerospace EngineeringOutline of PresentationOutline of Presentation
•Research objectives and motivation
•Background of compressor control
•Introduction of numerical tools
•Configurations and validation results•DLR high-speed centrifugal compressor (DLRCC)
•NASA Glenn low-speed centrifugal compressor (LSCC)
•Off-design results without control•Surge analysis
•Off-design results with air injection control•Steady jets
•Pulsed jets
•Conclusions and recommendations
3
School of Aerospace Engineering
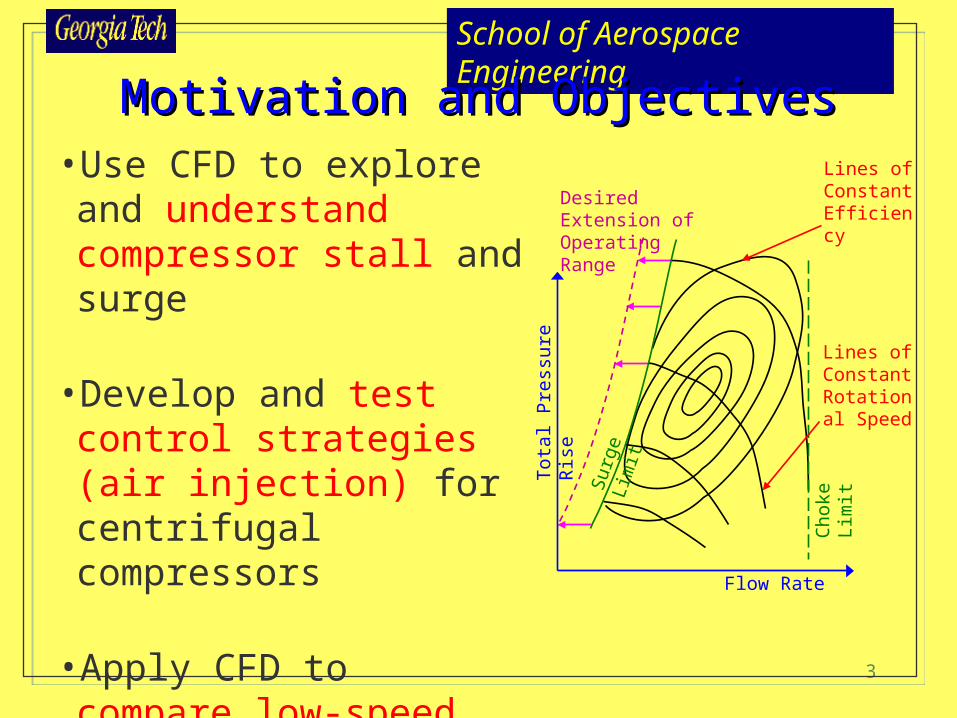
Motivation and ObjectivesMotivation and Objectives• Use CFD to explore and understand compressor stall and surge
• Develop and test control strategies (air injection) for centrifugal compressors
• Apply CFD to compare low-speed and high-speed configurations
Lines of ConstantRotational Speed
Lines of ConstantEfficiency
Cho
ke
Lim
it
Sur
ge L
imit
Flow Rate
Tot
al P
ress
ure
Ris
e
Desired Extension of Operating Range
4
School of Aerospace Engineering
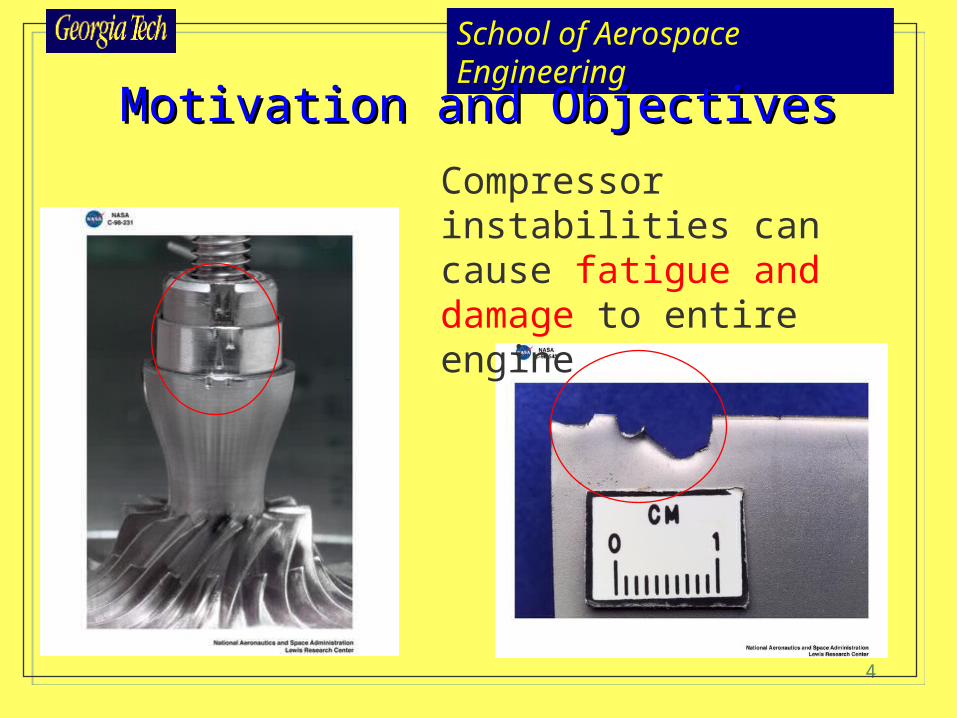
Motivation and ObjectivesMotivation and Objectives
Compressor instabilities can cause fatigue and damage to entire engine

5
School of Aerospace Engineering
Greitzer’s Phenomenological ModelGreitzer’s Phenomenological Model
PlenumVp
Throttle
Ac
Length Lc
Compressor
Helmholtz-Resonator Model
cc
p
ch AL
V
a2
U
L2
UB
Non-dimensional B-Parameter (Greitzer):
Assumptions:•Compressor modeled as actuator disk
•Fluid inertia contained in pipes•Spring-like properties confined to plenum
B < Bcritical => Rotating StallB > Bcritical => Surge
6
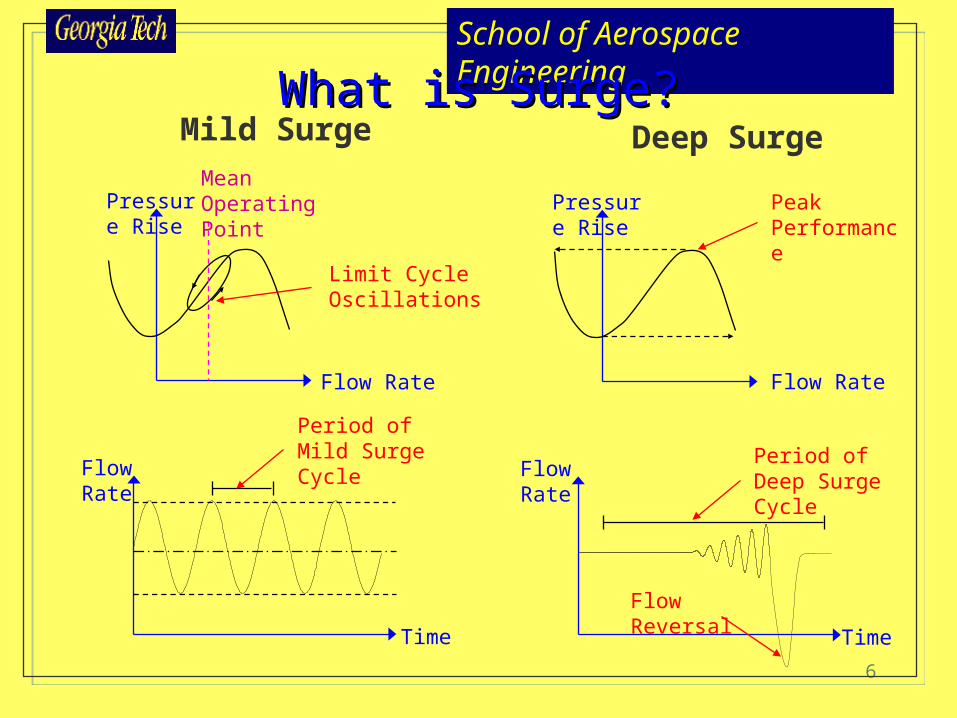
School of Aerospace EngineeringWhat is Surge?What is Surge?
Mild Surge Deep Surge
Time
Flow Rate
Period of Deep Surge Cycle
Flow Reversal
Pressure Rise
Flow Rate
MeanOperating Point
Limit CycleOscillations
Pressure Rise
Flow Rate
PeakPerformance
Time
Flow Rate
Period ofMild Surge Cycle

7
School of Aerospace Engineering
• Diffuser Bleed Valves•Pinsley, Greitzer, Epstein (MIT)•Prasad, Neumeier, Haddad (GT)
• Movable Plenum Wall•Gysling, Greitzer, Epstein (MIT)
• Guide Vanes•Dussourd (Ingersoll-Rand Research Inc.)
• Air Injection•Murray (CalTech)•Weigl, Paduano, Bright (NASA Glenn)•Fleeter, Lawless (Purdue)
How to Alleviate SurgeHow to Alleviate Surge
Bleed Valves
Movable Plenum Walls
Guide Vanes
Air-Injection
8
School of Aerospace Engineering
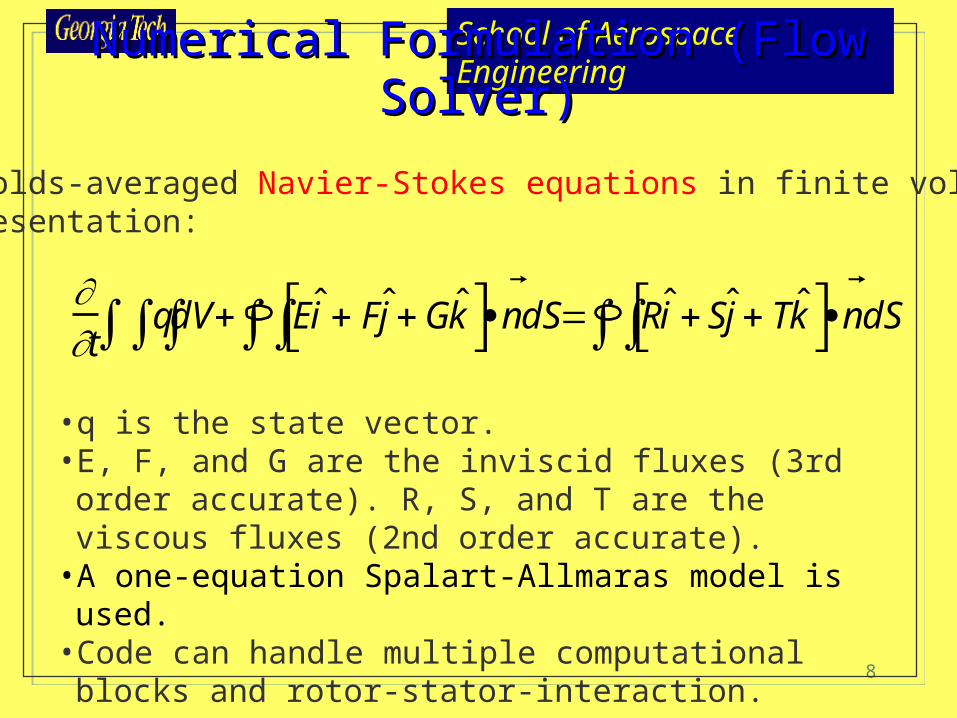
Numerical Formulation (Flow Solver)Numerical Formulation (Flow Solver)
t
qdV E ˆ i F ˆ j G ˆ k n dS R ˆ i S ˆ j T ˆ k
n dS
Reynolds-averaged Navier-Stokes equations in finite volumerepresentation:
• q is the state vector.• E, F, and G are the inviscid fluxes (3rd order accurate). R, S,
and T are the viscous fluxes (2nd order accurate).• A one-equation Spalart-Allmaras model is used.• Code can handle multiple computational blocks and rotor-
stator-interaction.
9
School of Aerospace Engineering
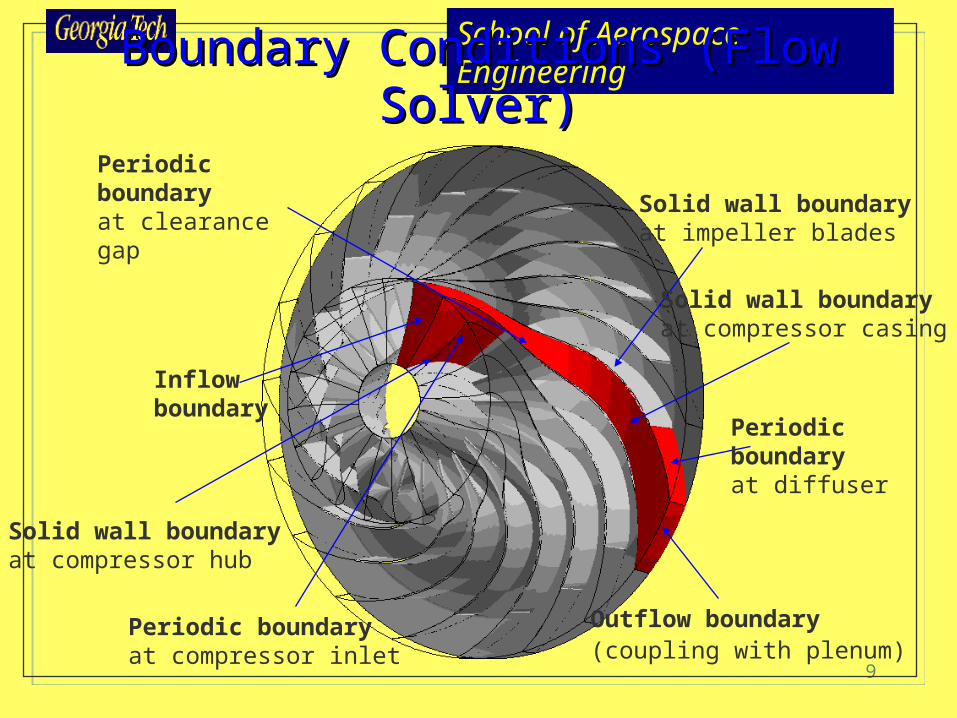
Boundary Conditions (Flow Solver)Boundary Conditions (Flow Solver)
Outflow boundary(coupling with plenum)
Periodic boundaryat compressor inlet
Solid wall boundaryat compressor casing
Periodic boundaryat diffuser
Solid wall boundaryat impeller blades
Periodic boundaryat clearance gap
Solid wall boundaryat compressor hub
Inflow boundary
10
School of Aerospace Engineering
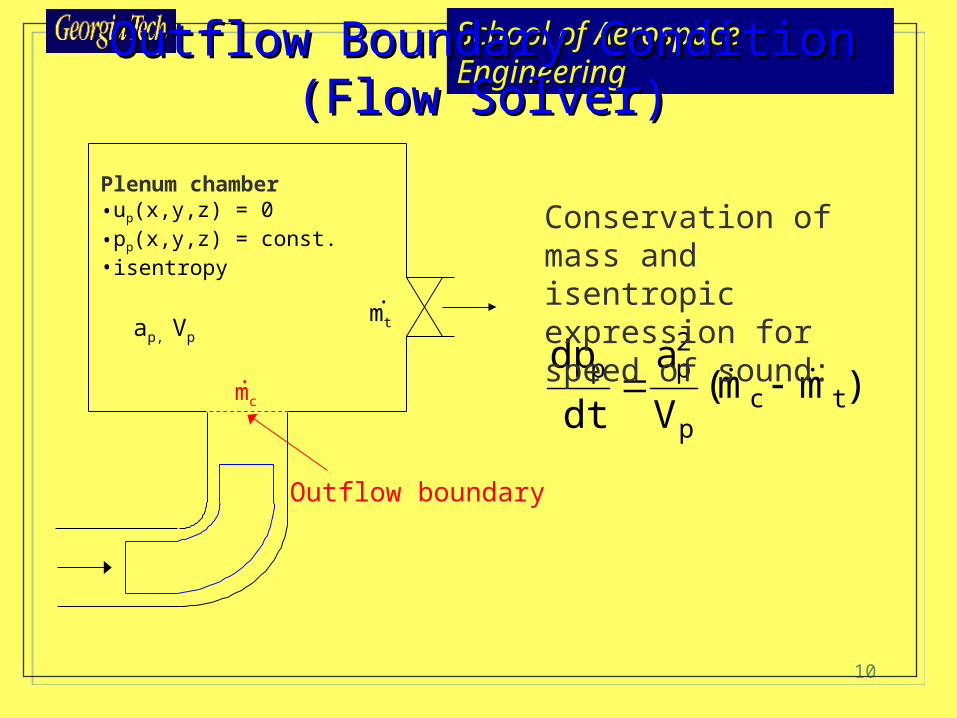
Outflow Boundary Condition (Flow Solver)Outflow Boundary Condition (Flow Solver)
Plenum chamber•up(x,y,z) = 0 •pp(x,y,z) = const.•isentropy
ap, Vp
mc
.
mt
.
Outflow boundary
)mm(V
a
dt
dptc
p
2pp
Conservation of mass and isentropic expression for speed of sound:

11
School of Aerospace Engineering
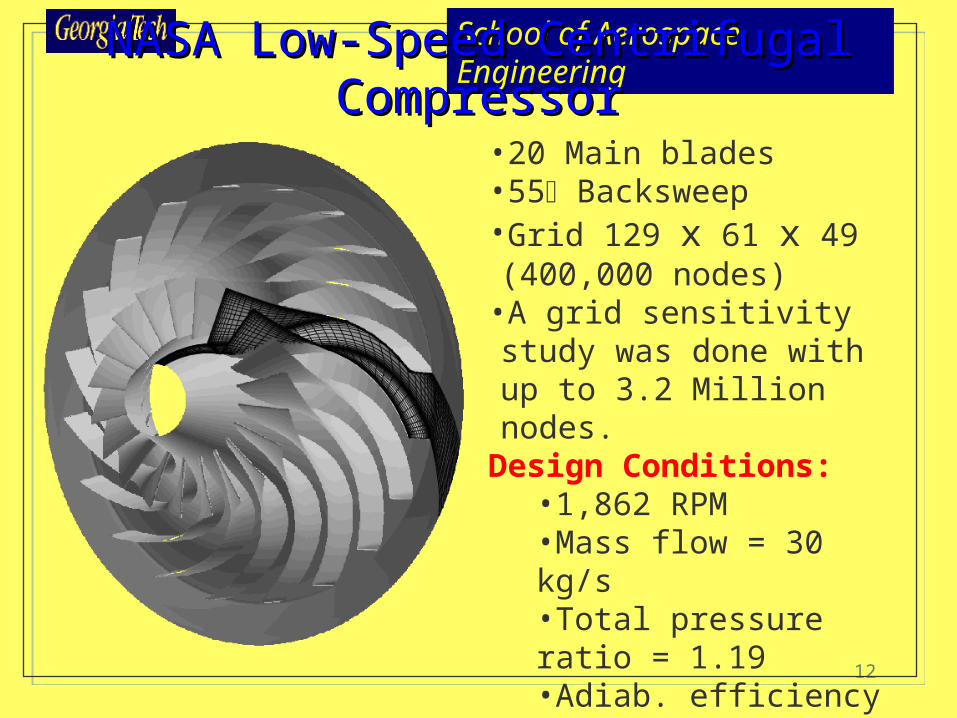
NASA Low-Speed Centrifugal CompressorNASA Low-Speed Centrifugal Compressor
•Designed and tested at NASA Glenn
•Mild pressure ratio•Ideal CFD test case
12
School of Aerospace Engineering
NASA Low-Speed Centrifugal CompressorNASA Low-Speed Centrifugal Compressor•20 Main blades•55 Backsweep•Grid 129 x 61 x 49 (400,000 nodes)
•A grid sensitivity study was done with up to 3.2 Million nodes.
Design Conditions:•1,862 RPM•Mass flow = 30 kg/s•Total pressure ratio = 1.19•Adiab. efficiency = 92.2%•Tip speed = 492 m/s•Inlet Mrel = 0.31

13
School of Aerospace Engineering
0.9
0.92
0.94
0.96
0.98
1
1.02
1.04
0 0.2 0.4 0.6 0.8 1
0.9
0.92
0.94
0.96
0.98
1
1.02
1.04
0 0.2 0.4 0.6 0.8 1
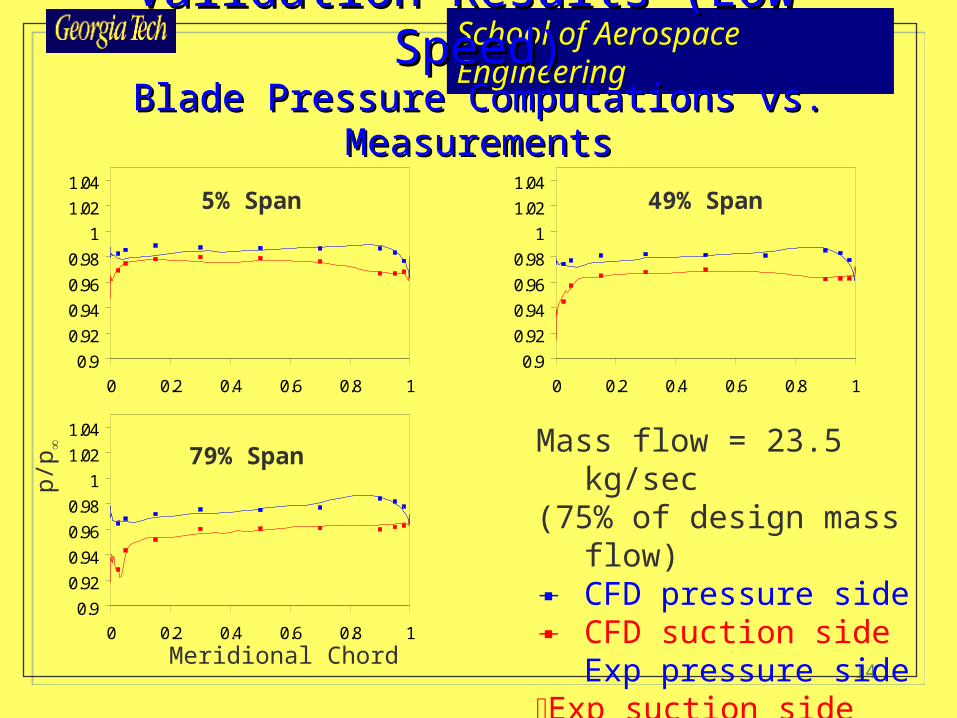
Validation Results (Low-Speed)Validation Results (Low-Speed)Blade Pressure Computations vs. MeasurementsBlade Pressure Computations vs. Measurements
p/p
Meridional Chord
5% Span 49% Span
0.9
0.92
0.94
0.96
0.98
1
1.02
1.04
0 0.2 0.4 0.6 0.8 1
79% Span Mass flow = 30 kg/sec (design) CFD pressure side CFD suction side Exp pressure sideExp suction side
14
School of Aerospace Engineering
Validation Results (Low-Speed)Validation Results (Low-Speed)Blade Pressure Computations vs. MeasurementsBlade Pressure Computations vs. Measurements
p/p
Meridional Chord
5% Span 49% Span
79% Span Mass flow = 23.5 kg/sec(75% of design mass flow) CFD pressure side CFD suction side Exp pressure sideExp suction side
0.9
0.92
0.94
0.96
0.98
1
1.02
1.04
0 0.2 0.4 0.6 0.8 1
0.9
0.92
0.94
0.96
0.98
1
1.02
1.04
0 0.2 0.4 0.6 0.8 1
0.9
0.92
0.94
0.96
0.98
1
1.02
1.04
0 0.2 0.4 0.6 0.8 1
15
School of Aerospace Engineering
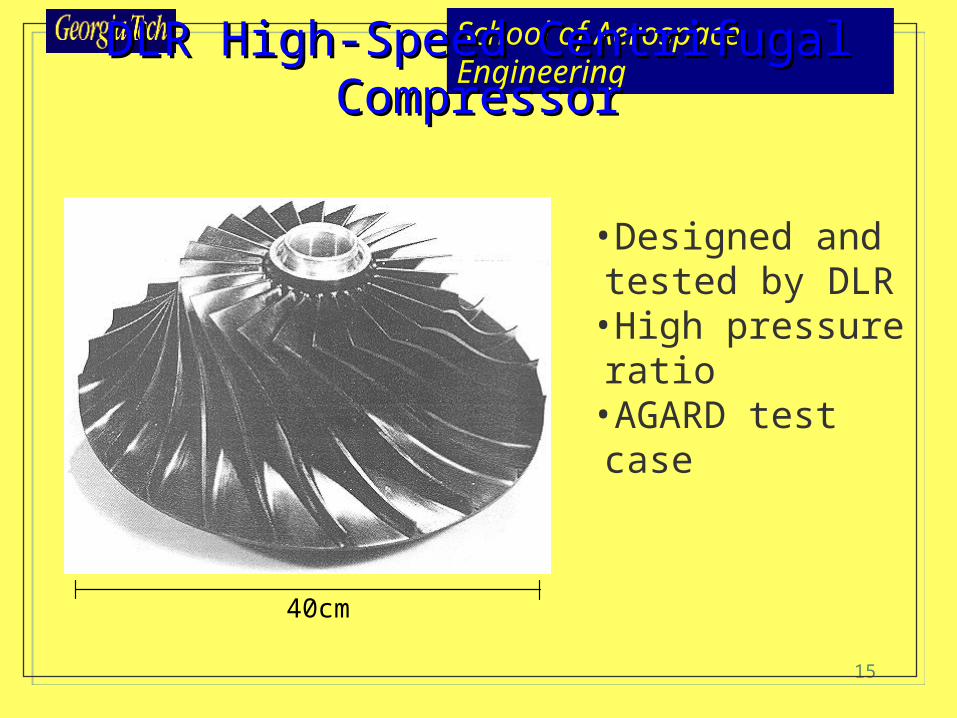
DLR High-Speed Centrifugal CompressorDLR High-Speed Centrifugal Compressor
•Designed and tested by DLR
•High pressure ratio•AGARD test case
40cm
16
School of Aerospace Engineering
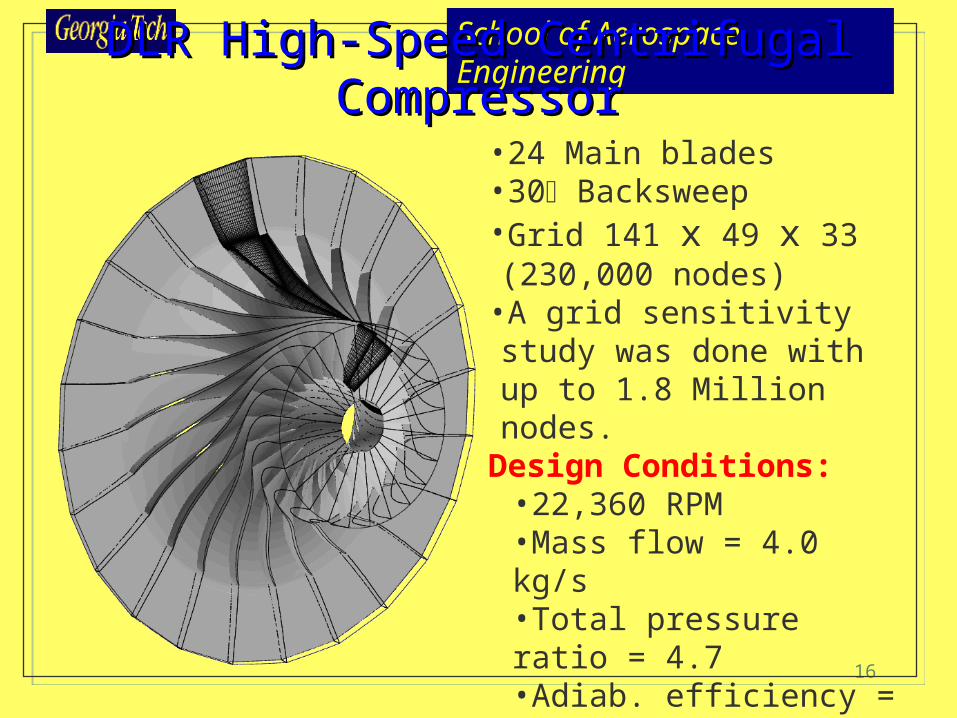
DLR High-Speed Centrifugal CompressorDLR High-Speed Centrifugal Compressor•24 Main blades•30 Backsweep•Grid 141 x 49 x 33 (230,000 nodes)
•A grid sensitivity study was done with up to 1.8 Million nodes.
Design Conditions:•22,360 RPM•Mass flow = 4.0 kg/s•Total pressure ratio = 4.7•Adiab. efficiency = 83%•Exit tip speed = 468 m/s•Inlet Mrel = 0.92

17
School of Aerospace EngineeringValidation Results (High-Speed) Validation Results (High-Speed)
Static Pressure Along ShroudStatic Pressure Along Shroud
Excellent agreement between CFD and experiment
0
0.5
1
1.5
2
2.5
3
0 0.2 0.4 0.6 0.8 1
Meridional Chord
Experiment
CFD
Loca
l Sta
tic P
ress
ure,
p/p
std
18
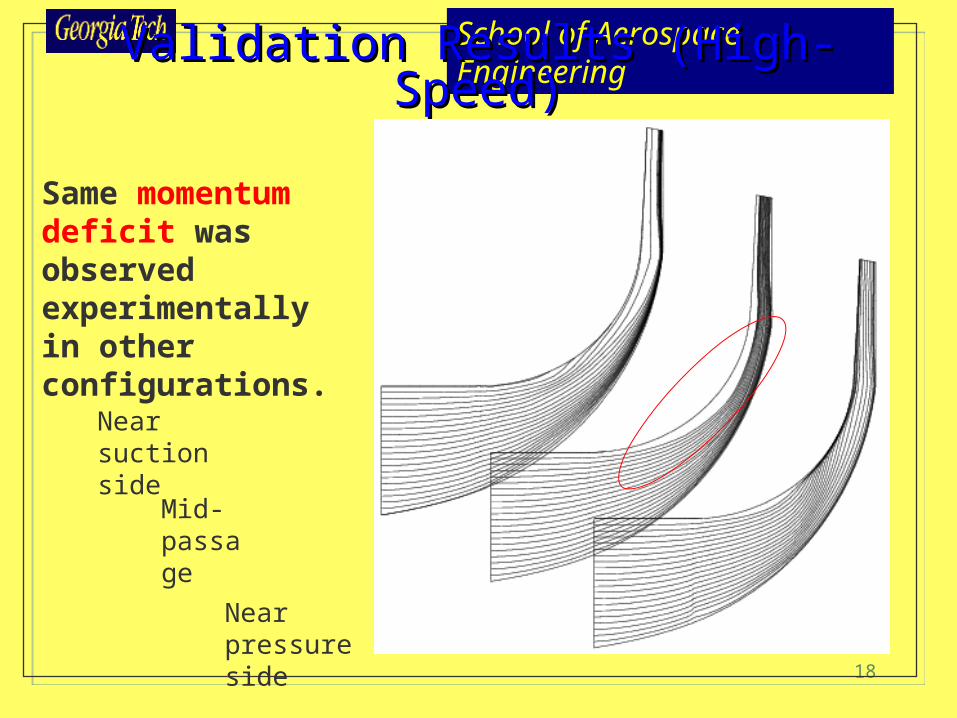
School of Aerospace EngineeringValidation Results (High-Speed)Validation Results (High-Speed)
Same momentum deficit was observed experimentally in other configurations.
Near suction side
Mid-passage
Near pressure side
19
School of Aerospace Engineering
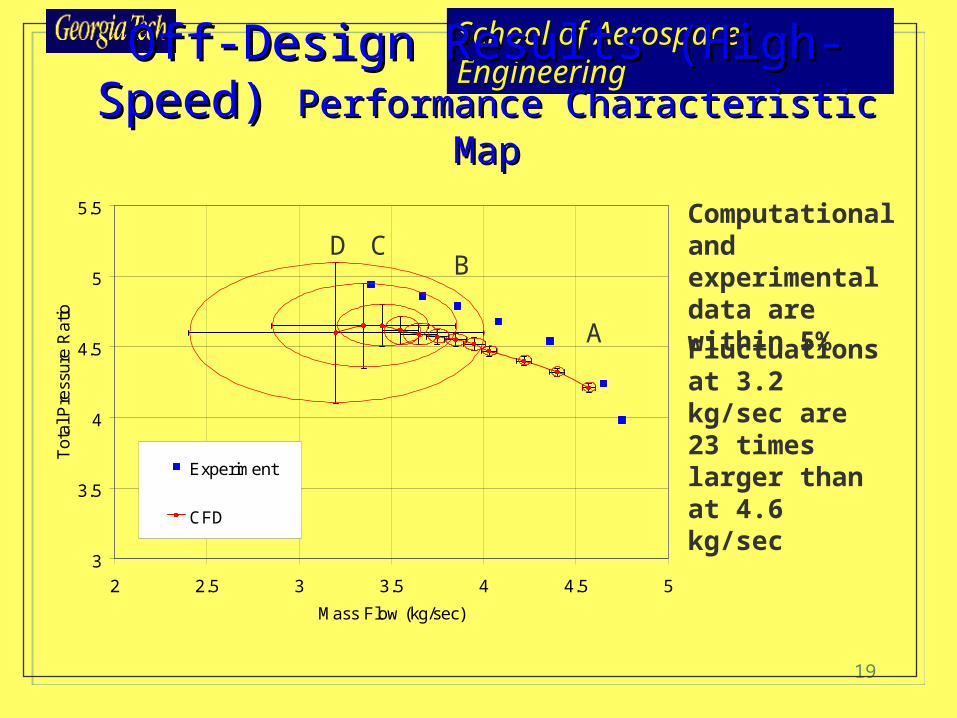
Off-Design Results (High-Speed) Off-Design Results (High-Speed) Performance Characteristic MapPerformance Characteristic Map
Computational and experimental data are within 5%
Fluctuations at 3.2 kg/sec are 23 times larger than at 4.6 kg/sec
3
3.5
4
4.5
5
5.5
2 2.5 3 3.5 4 4.5 5
Mass Flow (kg/sec)
Tot
al P
ress
ure
Rat
io
Experiment
CFD
A
BCD
20
School of Aerospace Engineering
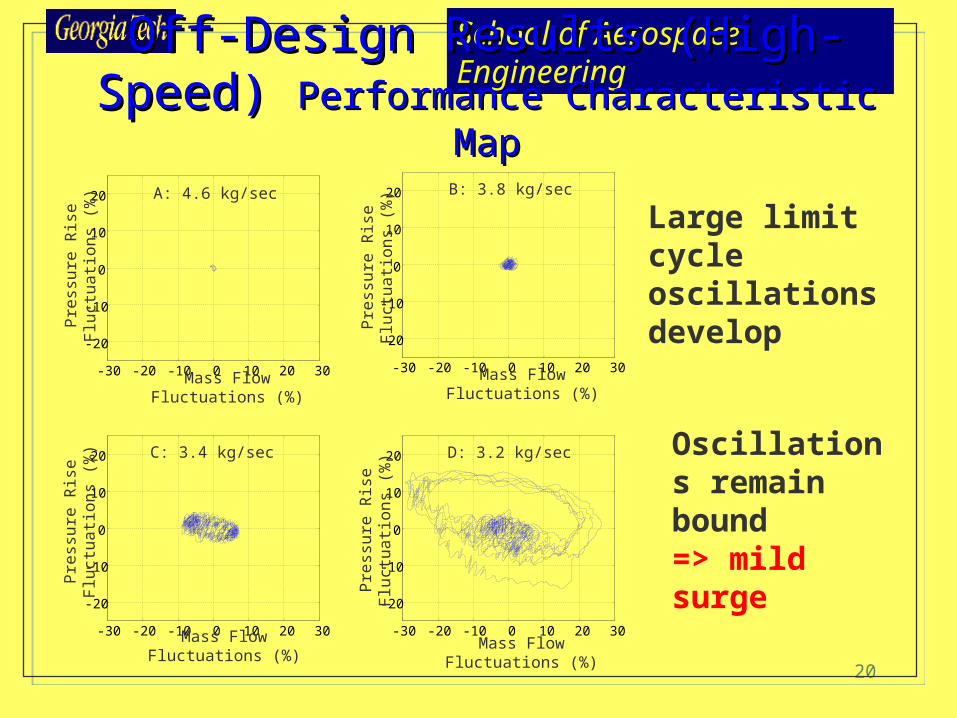
Off-Design Results (High-Speed) Off-Design Results (High-Speed) Performance Characteristic MapPerformance Characteristic Map
Large limit cycle oscillations develop
Oscillations remain bound=> mild surge
-30 -20 -10 0 10 20 30
-20
-10
0
10
20
Mass Flow Fluctuations (%)
A: 4.6 kg/sec
Pre
ssur
e R
ise
Flu
ctua
tion
s (%
)
-30 -20 -10 0 10 20 30
-20
-10
0
10
20
Mass Flow Fluctuations (%)
B: 3.8 kg/sec
Pre
ssur
e R
ise
Flu
ctua
tion
s (%
)
-30 -20 -10 0 10 20 30
-20
-10
0
10
20
Mass Flow Fluctuations (%)
D: 3.2 kg/sec
Pre
ssur
e R
ise
Flu
ctua
tion
s (%
)
-30 -20 -10 0 10 20 30
-20
-10
0
10
20
Mass Flow Fluctuations (%)
C: 3.4 kg/sec
Pre
ssur
e R
ise
Flu
ctua
tion
s (%
)
21
School of Aerospace Engineering
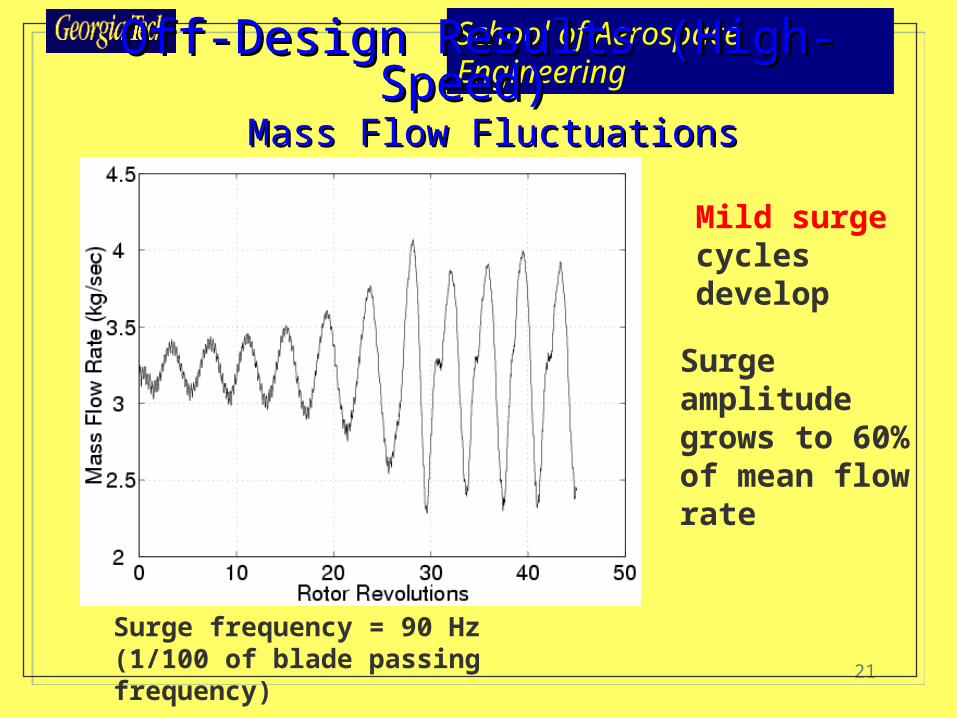
Mild surge cycles develop
Surge amplitude grows to 60% of mean flow rate
Surge frequency = 90 Hz (1/100 of blade passing frequency)
Off-Design Results (High-Speed) Off-Design Results (High-Speed) Mass Flow FluctuationsMass Flow Fluctuations

22
School of Aerospace EngineeringOff-Design Results (High-Speed)Off-Design Results (High-Speed)
Flowfield vectors show a large separation zone near the leading edge
Velocity vectors colored by Mrel
at mid-passage
23
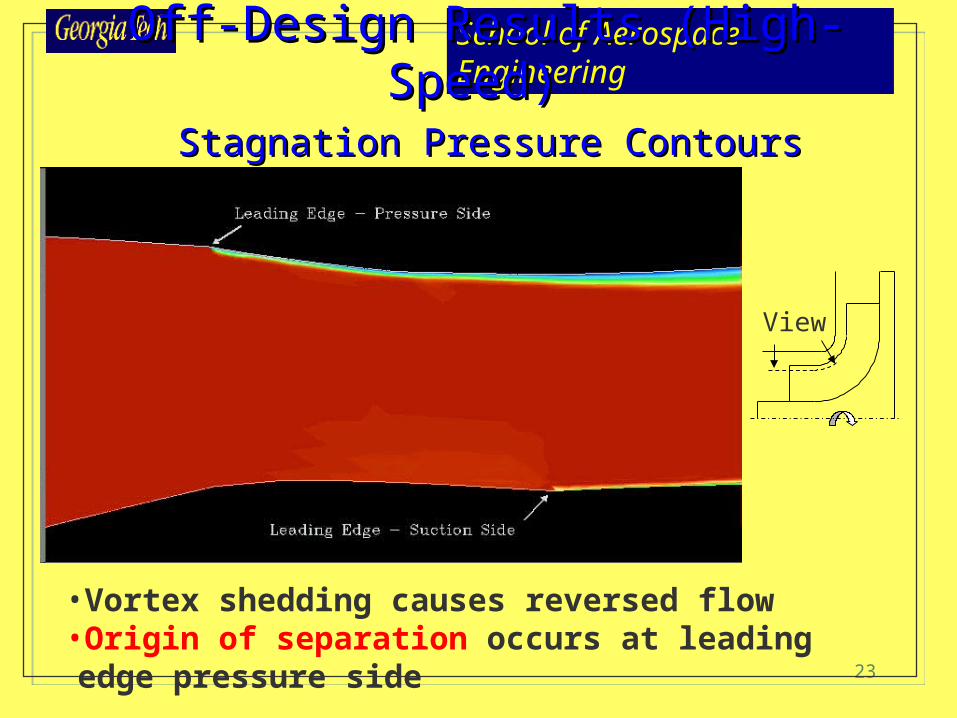
School of Aerospace EngineeringOff-Design Results (High-Speed) Off-Design Results (High-Speed)
Stagnation Pressure ContoursStagnation Pressure Contours
•Vortex shedding causes reversed flow•Origin of separation occurs at leading edge pressure side
View

24
School of Aerospace Engineering
Flowfield stalls but no surge occurs
This is in accordance with Greitzer’s B-Criterion:
sec/kg19m
sec/kg15m
sec/kg13m
criticalcc
p BAL
V
a2
UB
Off-Design Results (Low-Speed)Off-Design Results (Low-Speed) Velocity Vectors at Design SpeedVelocity Vectors at Design Speed

25
School of Aerospace EngineeringOff-Design Results (Low-Speed)Off-Design Results (Low-Speed)
Velocity vectors at 200% design speed at mid-passage

26
School of Aerospace EngineeringOff-Design Results (Low-Speed)Off-Design Results (Low-Speed)
Performance Characteristic MapPerformance Characteristic Map
1
1.2
1.4
1.6
1.8
2
2.2
10 20 30 40 50Mass Flow Rate (kg/s)
To
tal P
ress
ure
Ra
tio
Exp
CFD
200% Design Speed
Design Speed
Unsteady fluctuations are denoted by size of circles
Surge fluctuations at 200% design speed are 7 times larger than at 100% design speed
27
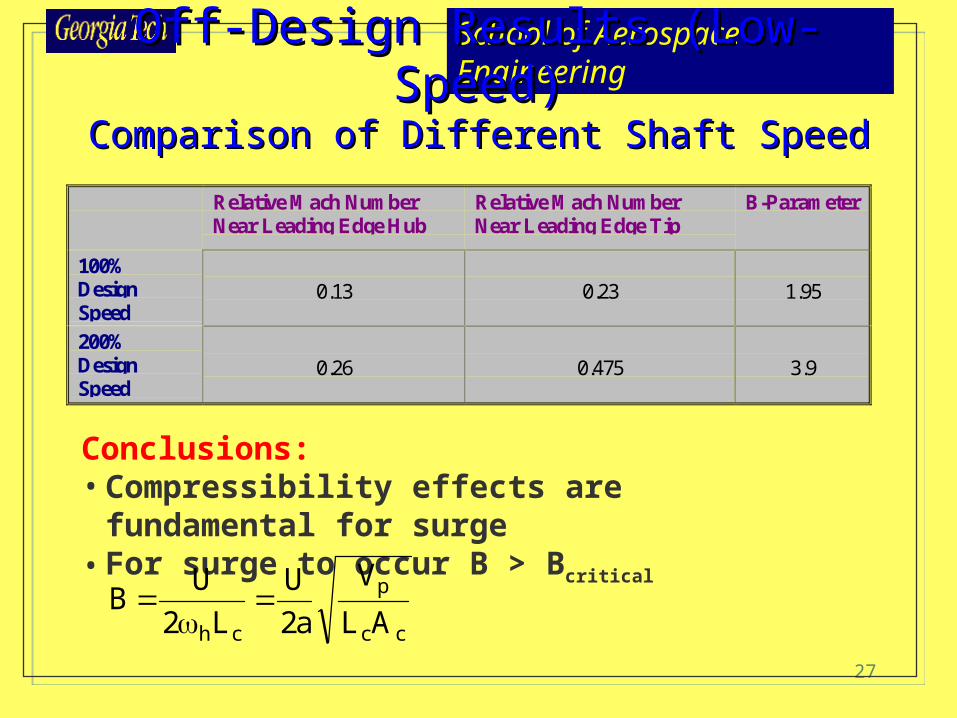
School of Aerospace EngineeringOff-Design Results (Low-Speed)Off-Design Results (Low-Speed)
Comparison of Different Shaft SpeedComparison of Different Shaft Speed
Relative Mach NumberNear Leading Edge Hub
Relative Mach NumberNear Leading Edge Tip
B-Parameter
100%DesignSpeed
0.13 0.23 1.95
200%DesignSpeed
0.26 0.475 3.9
Conclusions:• Compressibility effects are fundamental for surge• For surge to occur B > Bcritical
cc
p
ch AL
V
a2
U
L2
UB

28
School of Aerospace Engineering
Air Injection SetupAir Injection Setup
Systematic study: injection rate and yaw angle were identified as the most sensitive parameters.
Related work: Rolls Royce,Cal Tech, NASA Glenn /MIT,
0.04RInlet
Casing
5°
Rotation Axis
Impeller
RInlet
Yaw Angle
Main Flow
Injected Fluid Sheet
Compressor Face
Compressor Casing
29
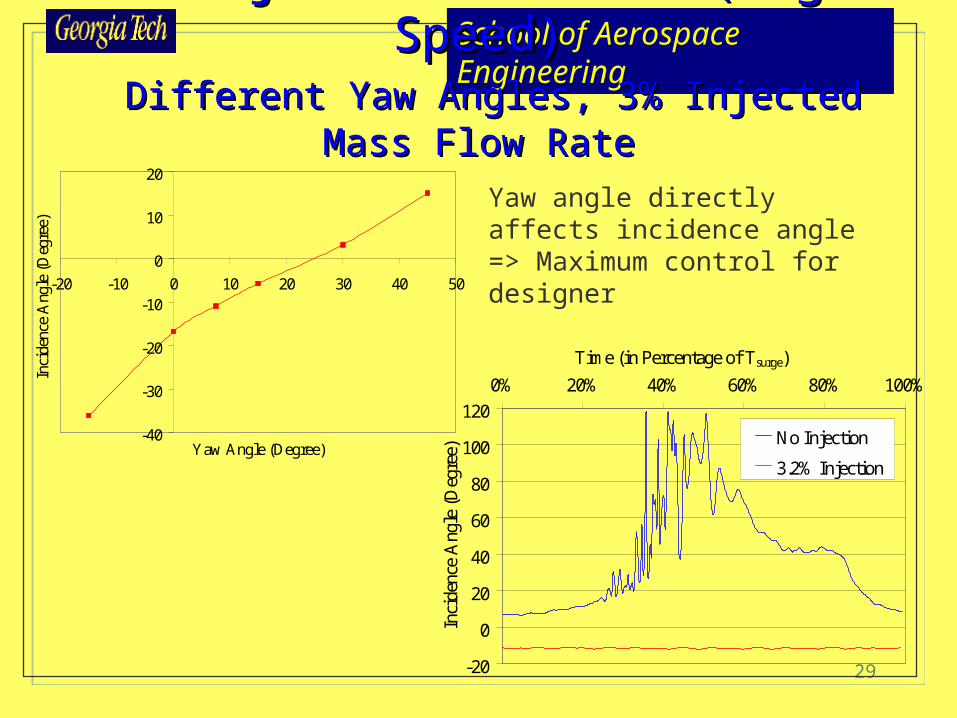
School of Aerospace EngineeringAir Injection Results (High-Speed)Air Injection Results (High-Speed)
Different Yaw Angles, 3% Injected Mass Flow RateDifferent Yaw Angles, 3% Injected Mass Flow Rate
-20
0
20
40
60
80
100
120
0% 20% 40% 60% 80% 100%
Time (in Percentage of Tsurge)
Inci
denc
e A
ngle
(D
egre
e)No Injection
3.2% Injection
Yaw angle directly affects incidence angle=> Maximum control for designer
-40
-30
-20
-10
0
10
20
-20 -10 0 10 20 30 40 50
Yaw Angle (Degree)
Inci
denc
e A
ngle
(D
egre
e)
30
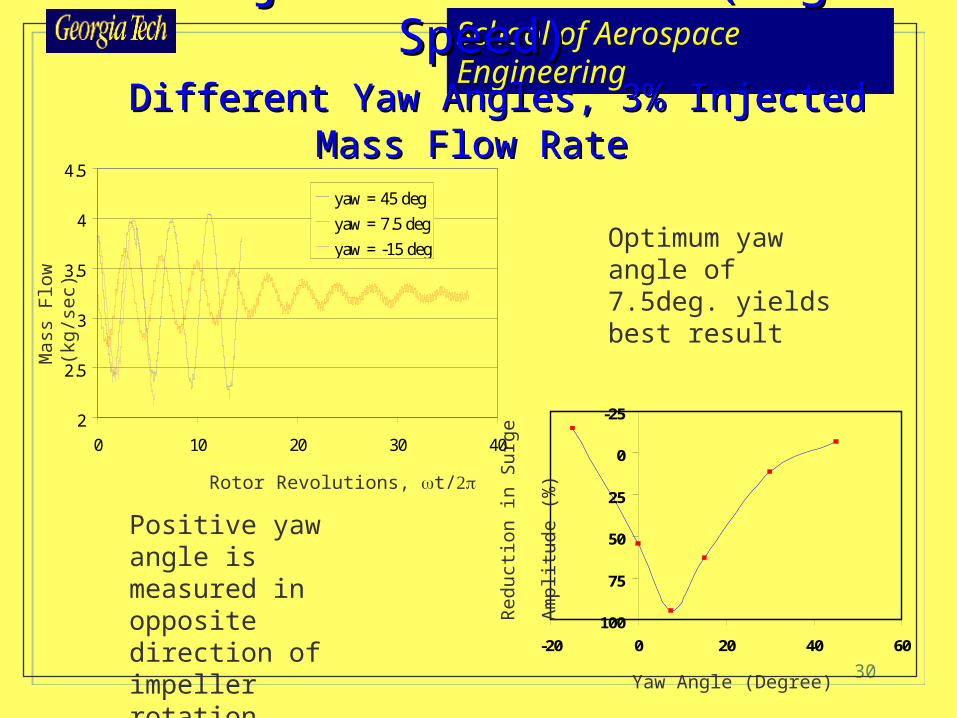
School of Aerospace EngineeringAir Injection Results (High-Speed)Air Injection Results (High-Speed)
Different Yaw Angles, 3% Injected Mass Flow RateDifferent Yaw Angles, 3% Injected Mass Flow Rate
Positive yaw angle is measured in opposite direction of impeller rotation
-25
0
25
50
75
100
-20 0 20 40 60
Yaw Angle (Degree)
Red
ucti
on in
Sur
ge
Am
plit
ude
(%)
2
2.5
3
3.5
4
4.5
0 10 20 30 40
yaw = 45 deg
yaw = 7.5 deg
yaw = -15 deg
Rotor Revolutions, t/
Mas
s F
low
(kg
/sec
)
Optimum yaw angle of 7.5deg. yields best result

31
School of Aerospace EngineeringAir Injection Results (High-Speed)Air Injection Results (High-Speed)
Leading edge separation is suppressed by injection
Velocity vectors colored by Mrel
at mid-passage
32
School of Aerospace Engineering
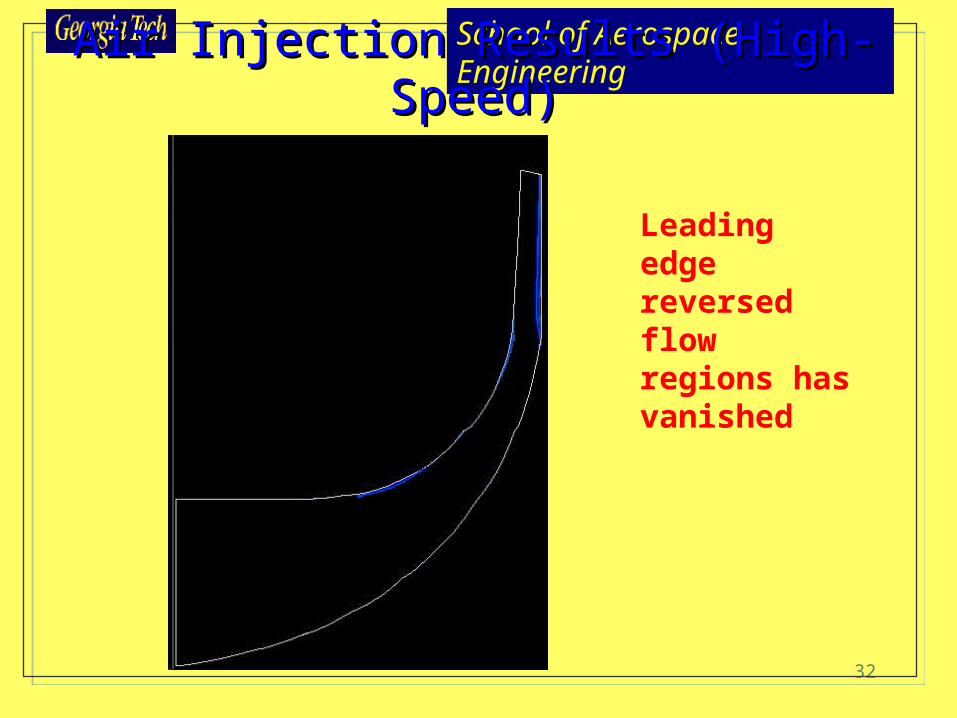
Air Injection Results (High-Speed)Air Injection Results (High-Speed)
Leading edge reversed flow regions has vanished
33
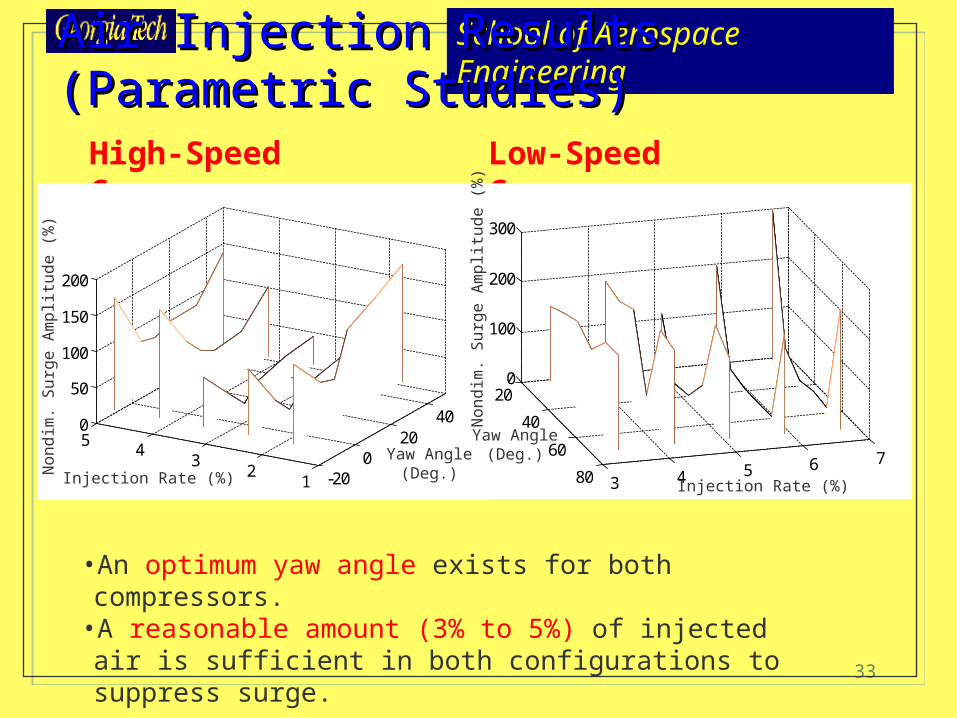
School of Aerospace EngineeringAir Injection Results (Parametric Studies)Air Injection Results (Parametric Studies)
High-Speed Compressor Low-Speed Compressor
•An optimum yaw angle exists for both compressors.•A reasonable amount (3% to 5%) of injected air is sufficient in both configurations to suppress surge.
-200
2040
12
34
50
50
100
150
200
Injection Rate (%)
Non
dim
. Sur
ge A
mpl
itud
e (%
)
20
40
60
80 3 4 5 6 7
0
100
200
300
Injection Rate (%)N
ondi
m. S
urge
Am
plit
ude
(%)
Yaw Angle(Deg.)Yaw Angle
(Deg.)
34
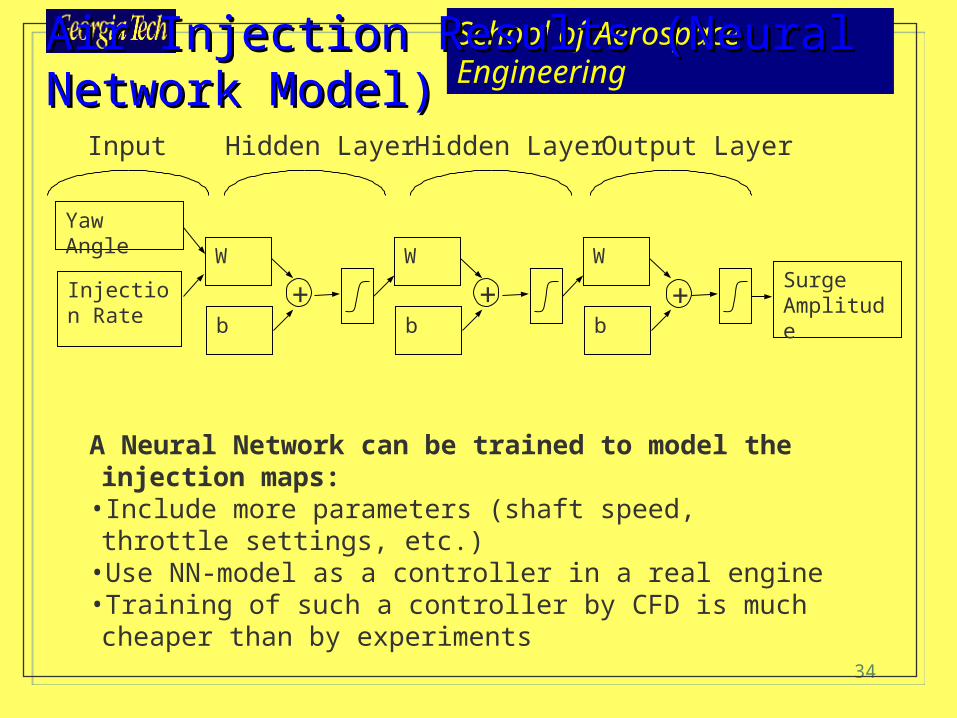
School of Aerospace EngineeringAir Injection Results (Neural Network Model)Air Injection Results (Neural Network Model)
A Neural Network can be trained to model the injection maps:•Include more parameters (shaft speed, throttle settings, etc.)•Use NN-model as a controller in a real engine•Training of such a controller by CFD is much cheaper than by experiments
Input Hidden Layer Hidden Layer Output Layer
Yaw Angle
Injection Rate
W
b
W
b
Surge Amplitude
W
b+++
35
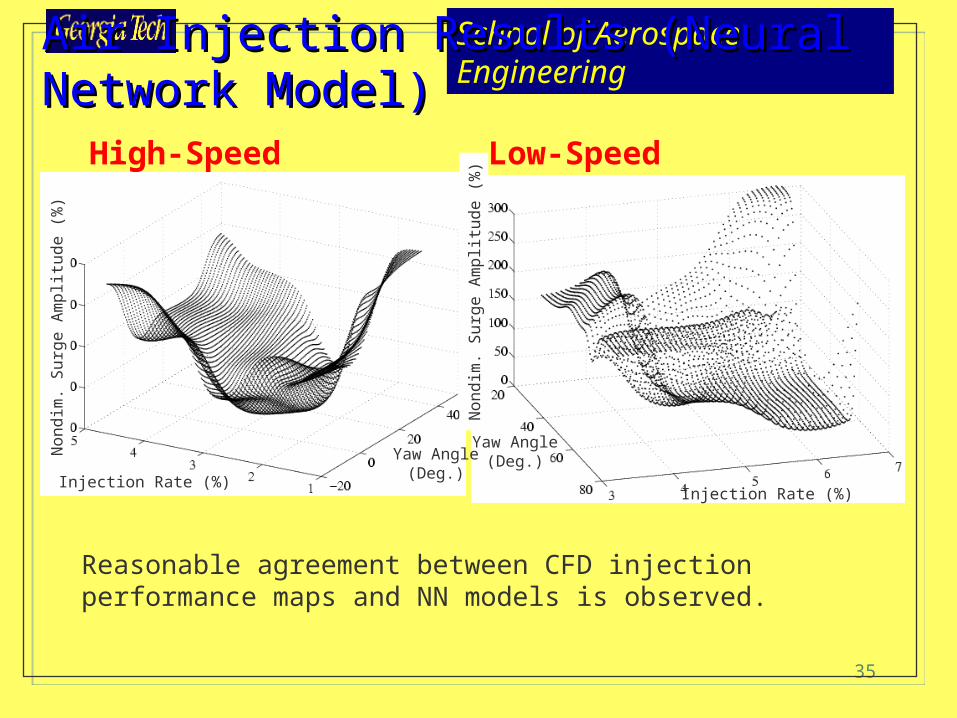
School of Aerospace EngineeringAir Injection Results (Neural Network Model)Air Injection Results (Neural Network Model)
High-Speed Compressor Low-Speed Compressor
Reasonable agreement between CFD injection performance maps and NN models is observed.
Injection Rate (%)
Non
dim
. Sur
ge A
mpl
itud
e (%
)
Yaw Angle(Deg.)
Injection Rate (%)N
ondi
m. S
urge
Am
plit
ude
(%)
Yaw Angle(Deg.)

36
School of Aerospace Engineering
0 10 20 30 40 50-100
-50
0
50
100
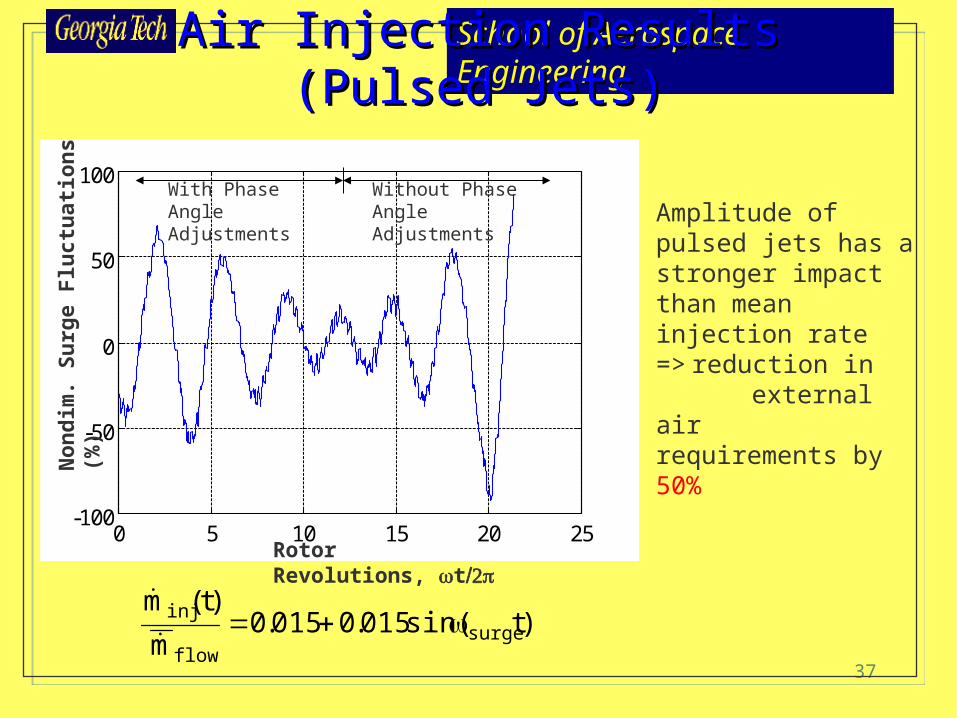
Air Injection Results (Pulsed Jets)Air Injection Results (Pulsed Jets)
Surge fluctuations decrease as long as the injection phase was lagged 180 deg. relative to the flow=> suggests feedback control
)tsin(007.0023.0m
)t(msurge
flow
inj
With Phase Angle Adjustments
Without Phase Angle Adjustments
Non
dim
. Su
rge
Flu
ctu
atio
ns
(%)
Rotor Revolutions, t
37
School of Aerospace Engineering
Amplitude of pulsed jets has a stronger impact than mean injection rate=> reduction in
external air requirements by 50%
)tsin(015.0015.0m
)t(msurge
flow
inj
0 5 10 15 20 25-100
-50
0
50
100
Air Injection Results (Pulsed Jets)Air Injection Results (Pulsed Jets)
With Phase Angle Adjustments
Without Phase Angle Adjustments
Non
dim
. Su
rge
Flu
ctu
atio
ns
(%)
Rotor Revolutions, t
38
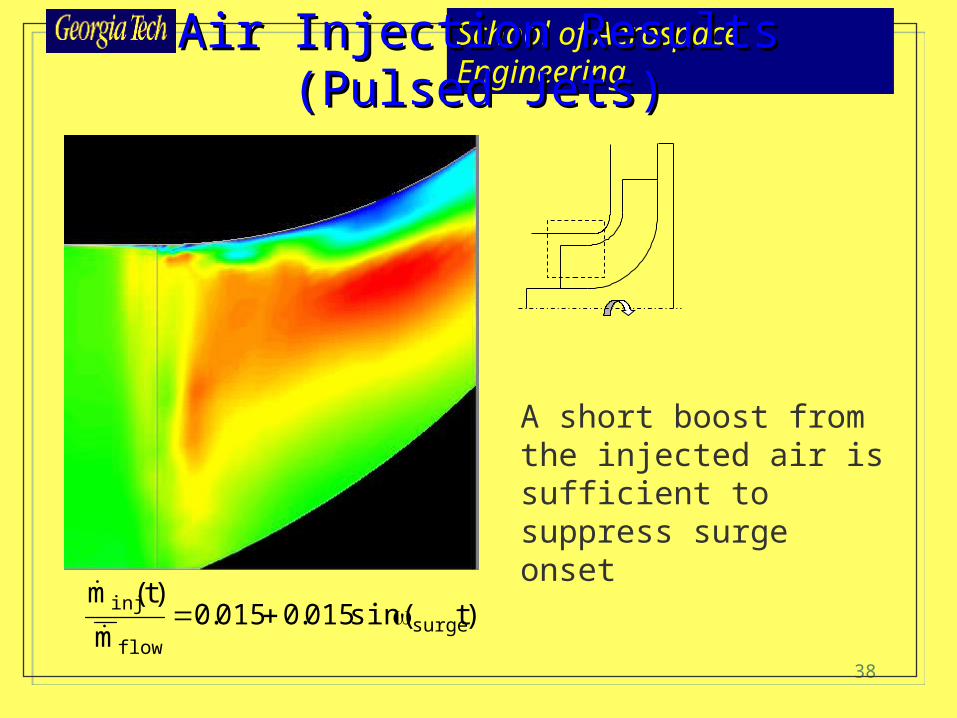
School of Aerospace EngineeringAir Injection Results (Pulsed Jets)Air Injection Results (Pulsed Jets)
A short boost from the injected air is sufficient to suppress surge onset
)tsin(015.0015.0m
)t(msurge
flow
inj
39
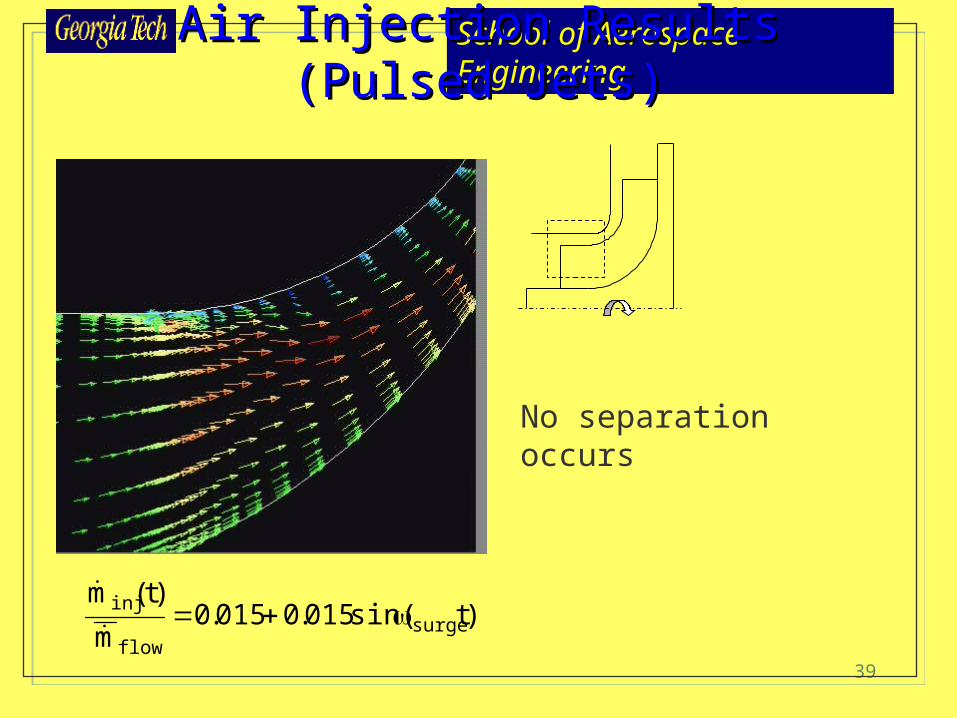
School of Aerospace EngineeringAir Injection Results (Pulsed Jets)Air Injection Results (Pulsed Jets)
No separation occurs
)tsin(015.0015.0m
)t(msurge
flow
inj

40
School of Aerospace Engineering
• Jets pulsed at higher frequencies are more effective than low-frequency jets (increased mixing, higher turbulent intensity)
• There is a practical limitation on the highest possible frequency
)t4sin(007.0023.0m
)t(msurge
flow
inj
0 5 10 15 20 25 30-15
-10
-5
0
5
10
15
Air Injection Results (Pulsed Jets)Air Injection Results (Pulsed Jets)N
ond
im. S
urg
e F
luct
uat
ion
s (%
)
Rotor Revolutions, t

41
School of Aerospace Engineering
1.5% injected mass is sufficient to suppress surge
)t4sin(015.0015.0m
)t(msurge
flow
inj
0 5 10 15 20-15
-10
-5
0
5
10
15
Non
dim
. Su
rge
Flu
ctu
atio
ns
(%)
Rotor Revolutions, t
Air Injection Results (Pulsed Jets)Air Injection Results (Pulsed Jets)
42
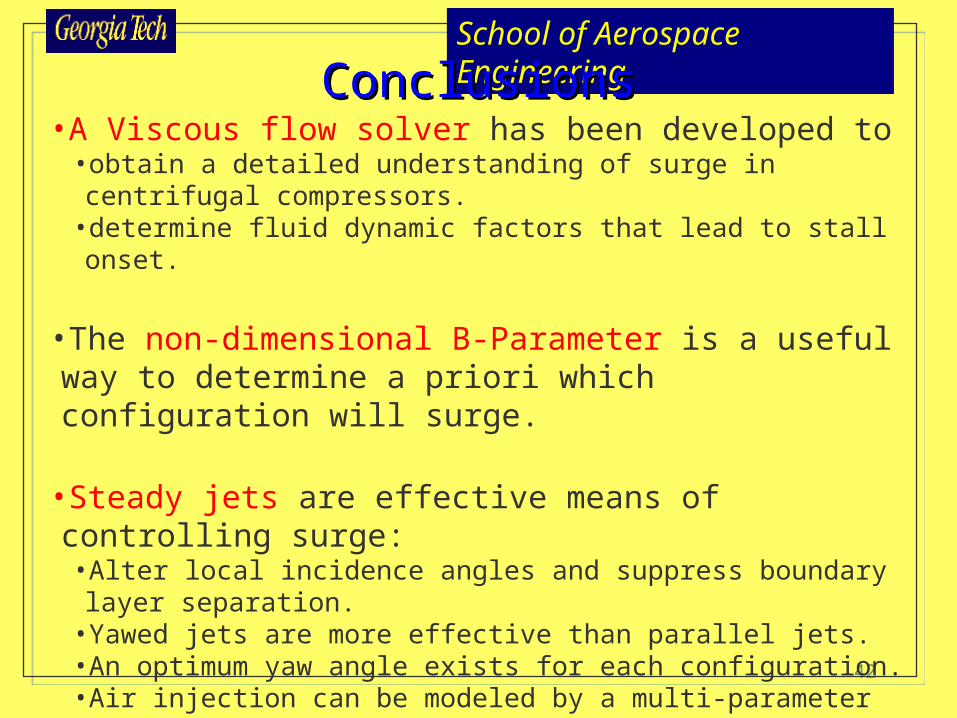
School of Aerospace EngineeringConclusionsConclusions
•A Viscous flow solver has been developed to •obtain a detailed understanding of surge in centrifugal compressors.•determine fluid dynamic factors that lead to stall onset.
•The non-dimensional B-Parameter is a useful way to determine a priori which configuration will surge.
•Steady jets are effective means of controlling surge:•Alter local incidence angles and suppress boundary layer separation.•Yawed jets are more effective than parallel jets.•An optimum yaw angle exists for each configuration.•Air injection can be modeled by a multi-parameter neural network.
•Pulsed jets yield additional performance enhancements:•Lead to a reduction in external air requirements.•Jets pulsed at higher frequencies perform better than low-frequency jets.
43
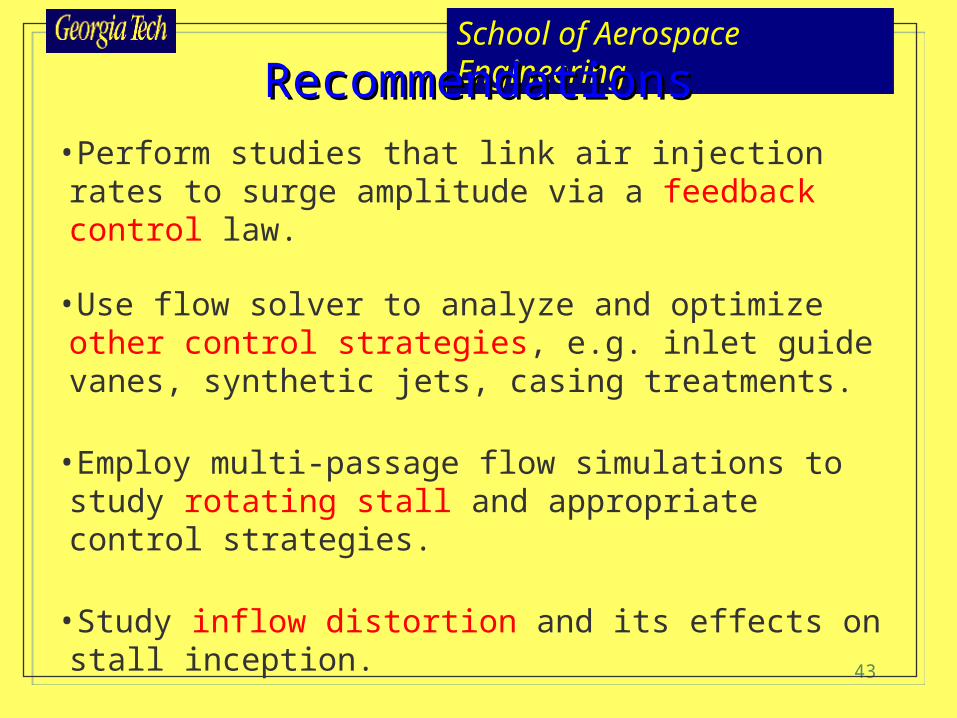
School of Aerospace EngineeringRecommendationsRecommendations
•Perform studies that link air injection rates to surge amplitude via a feedback control law.
•Use flow solver to analyze and optimize other control strategies, e.g. inlet guide vanes, synthetic jets, casing treatments.
•Employ multi-passage flow simulations to study rotating stall and appropriate control strategies.
•Study inflow distortion and its effects on stall inception.
•Improve turbulence modeling of current generation turbomachinery solvers. Analyze the feasibility of LES methods.

44
School of Aerospace Engineering
How to Control Surge (Active Control)How to Control Surge (Active Control)
Controller Unit
Bleed Air
PressureSensorsAir
Injection
45
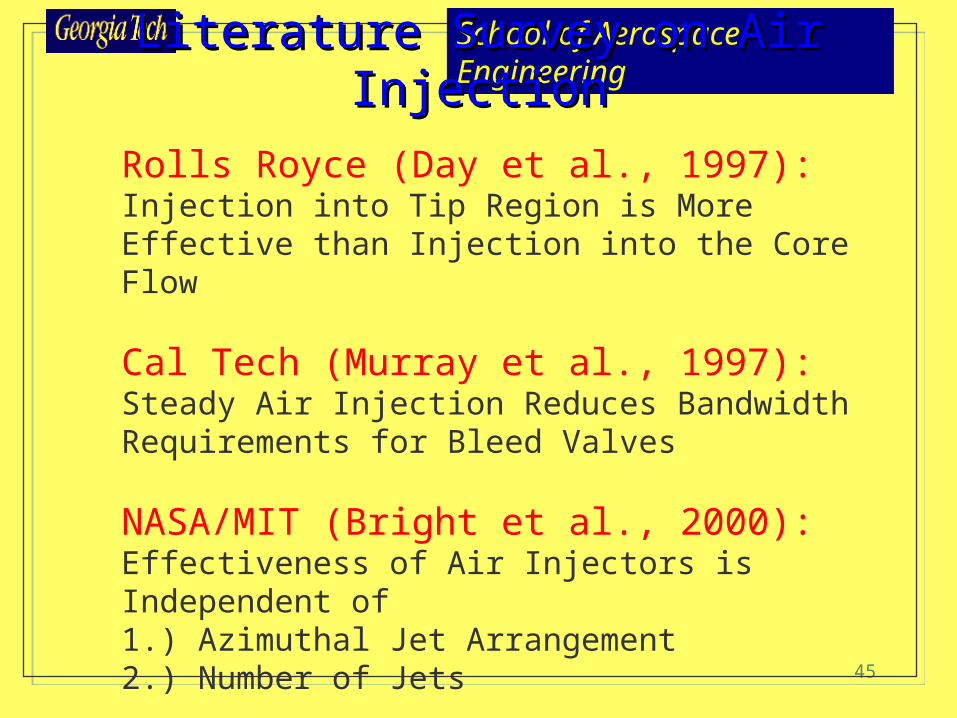
School of Aerospace EngineeringLiterature Survey on Air InjectionLiterature Survey on Air Injection
Rolls Royce (Day et al., 1997):Injection into Tip Region is More Effective than Injection into the Core Flow
Cal Tech (Murray et al., 1997):Steady Air Injection Reduces Bandwidth Requirements for Bleed Valves
NASA/MIT (Bright et al., 2000):Effectiveness of Air Injectors is Independent of 1.) Azimuthal Jet Arrangement2.) Number of Jets
46
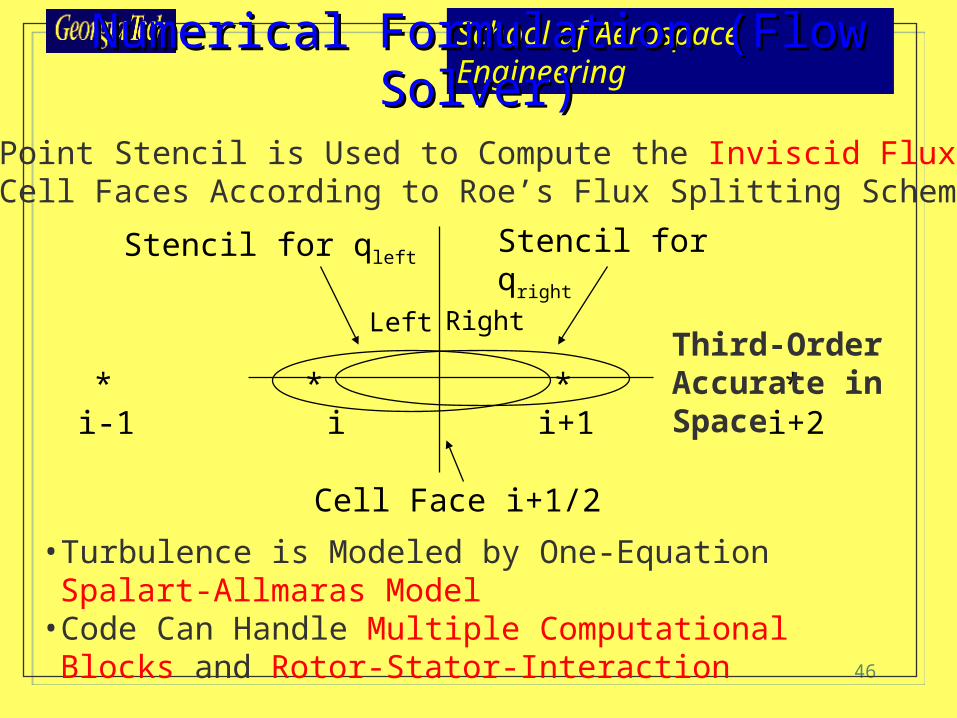
School of Aerospace EngineeringNumerical Formulation (Flow Solver)Numerical Formulation (Flow Solver)
* * * *i-1 i i+1 i+2
Cell Face i+1/2
Stencil for qleftStencil for qright
Left Right
A Four Point Stencil is Used to Compute the Inviscid Flux Termsat the Cell Faces According to Roe’s Flux Splitting Scheme::
Third-Order Accurate in Space
• Turbulence is Modeled by One-Equation Spalart-Allmaras Model• Code Can Handle Multiple Computational Blocks and Rotor-
Stator-Interaction
47
School of Aerospace Engineering
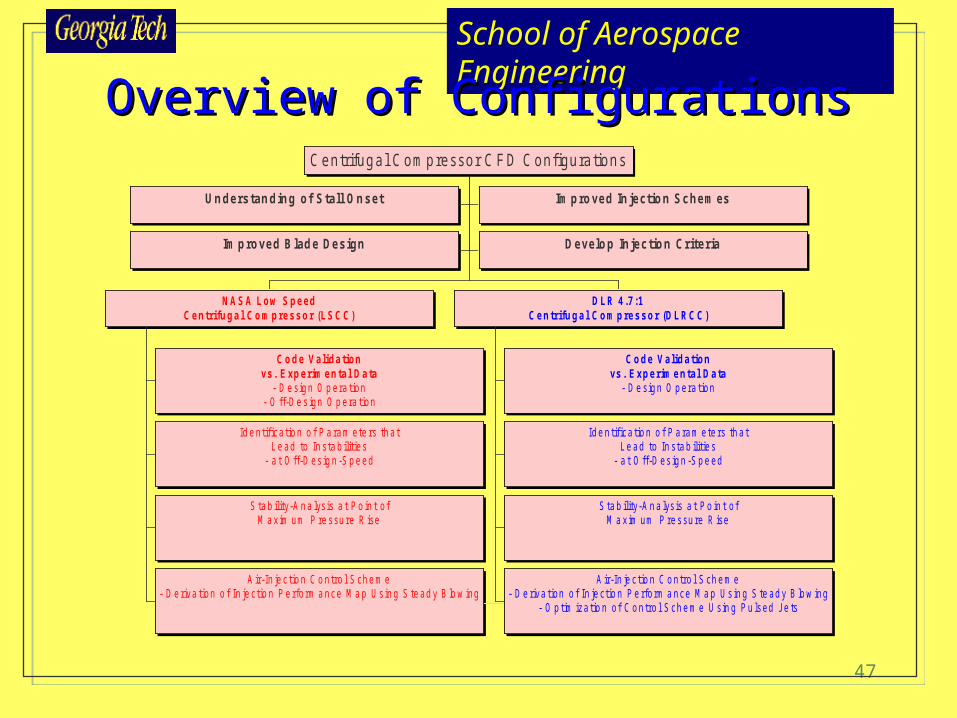
Overview of ConfigurationsOverview of ConfigurationsCentrifugal Compressor C FD Configurations
U n ders tan d in g of S tall O n set Im p ro ved In jectio n Schem es
Im p ro ved B lad e Des ign D evelo p In jec tio n Crite r ia
Code Validationvs. Experimental Data
- D e sig n O p era tion- O ff-De s ign O p era tion
Id e n tif ica tio n o f P a ram ete rs th a tL e ad to In sta b ilit ies
- a t O ff-D es ig n -S p e ed
S ta b ility-A n a lys is a t P o in t o fM a x im um P re ssu re R ise
A ir-In je c tio n C o ntro l S ch e m e- D e riva tion o f In je ctio n P e rfo rm a nce M a p Us in g S te ad y B lo w ing
NASA Low SpeedCentrifugal Compressor (LSCC)
Code Validationvs. Experimental Data
- D e sig n O p era tion
Id e n tif ica tio n o f P a ram ete rs th a tL e ad to In sta b ilit ies
- a t O ff-D es ig n -S p e ed
S ta b ility-A n a lys is a t P o in t o fM a x im um P re ssu re R ise
A ir-In je c tio n C o ntro l S ch e m e- D e riva tion o f In je ctio n P e rfo rm a nce M a p Us in g S te ad y B lo w ing
- O p tim iza tio n o f C o n tro l S ch e m e U sin g P u lsed Je ts
DLR 4.7:1Centrifugal Com pressor (DLRCC)

48
School of Aerospace EngineeringThe Present ApproachThe Present Approach
Air-injection contro l
G TTURBO3 DV isco u s f lo w so lve r
- S im u la te & a n a lyse f low f ie ld- Id en tify se p ara tion reg io ns
G TSYS3DE ig en m od e so lve r
- e va lu a te sys te m e ige n va lu es- a n a lyse sys te m s ta b ility
Experim entsW o rk a t M IT , C a lTe ch , N A S A L e w is- va lid a te f lo w so lve r- co rre la te in je c tio n re su lts
Understanding of stall onset Im proved injection schem es
Im proved blade design Develop injection criteria
The Tools
The Results
49
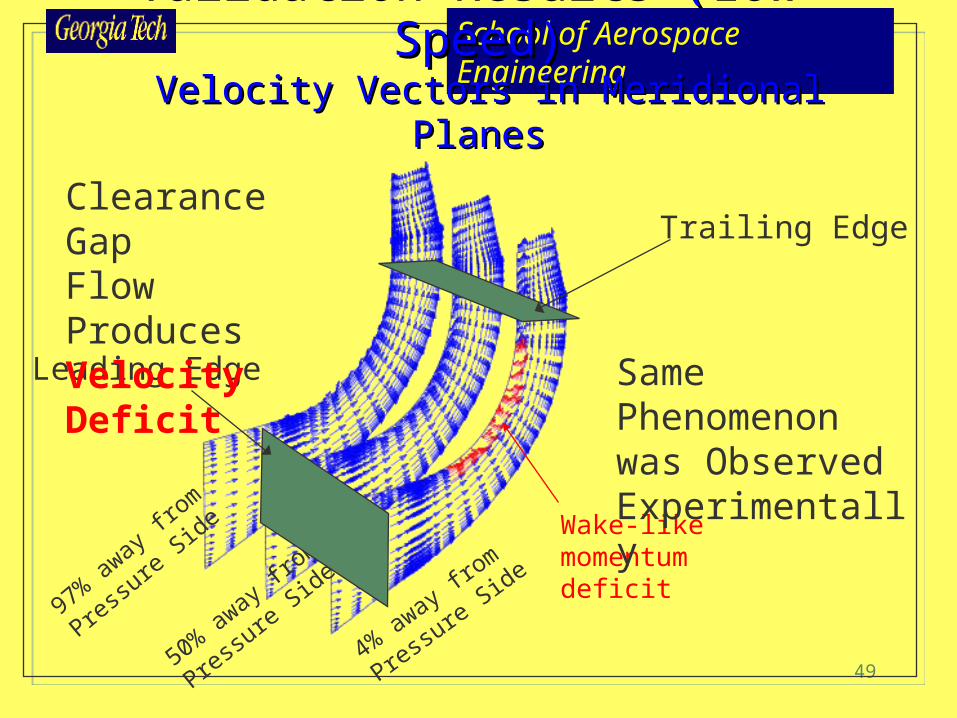
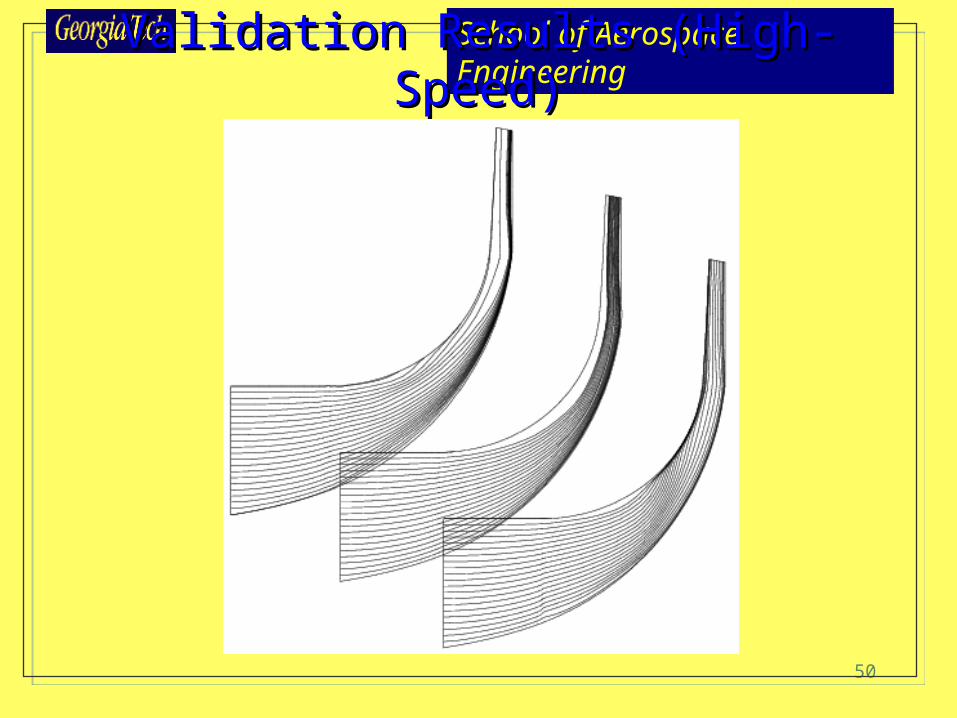
School of Aerospace EngineeringValidation Results (Low-Speed)Validation Results (Low-Speed)
Velocity Vectors in Meridional Planes Velocity Vectors in Meridional Planes
Wake-likemomentum deficit
4% away
from
Pressure
Side
50% away
from
Pressu
re Side97% aw
ay fr
om
Pressu
re Side
Leading Edge
Trailing EdgeClearance GapFlow ProducesVelocity Deficit
Same Phenomenonwas Observed Experimentally
50
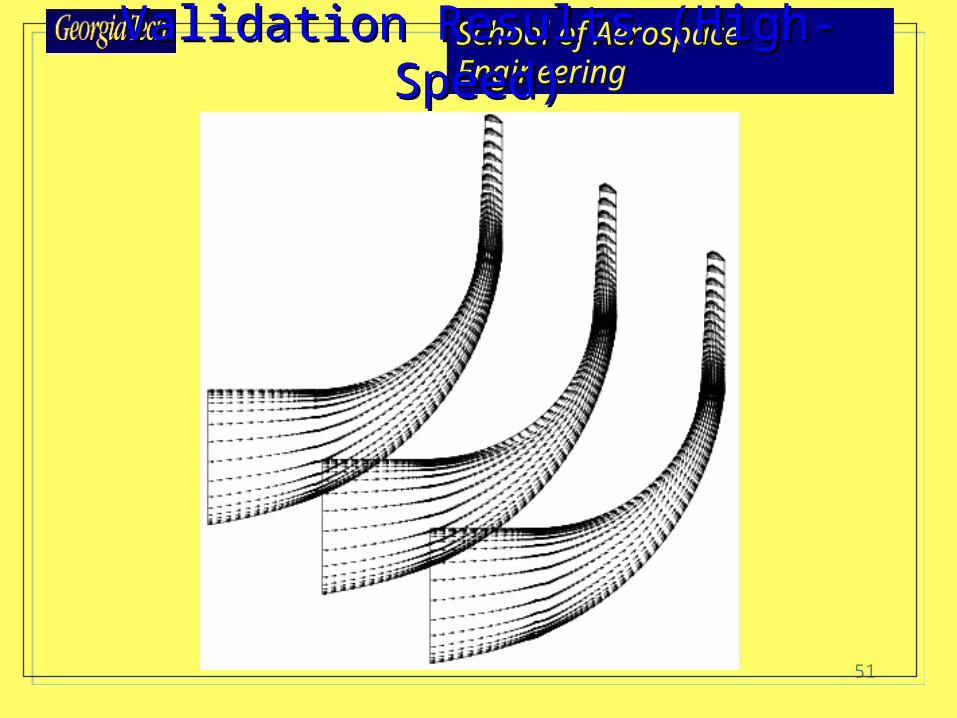
School of Aerospace EngineeringValidation Results (High-Speed)Validation Results (High-Speed)
51
School of Aerospace EngineeringValidation Results (High-Speed)Validation Results (High-Speed)

52
School of Aerospace EngineeringEigenmode Analysis (GTSYS3D)Eigenmode Analysis (GTSYS3D)
• Calculates eigenvalues/-vectors of the compression system matrix
• Based on small perturbation Euler model:q = q0 + q
• The resulting form is:d/dt(q) = Aq
where: - q is the state vector of small perturbations- A is the system matrix of size
5N1N2N3 x 5N1N2N3
53
School of Aerospace Engineering
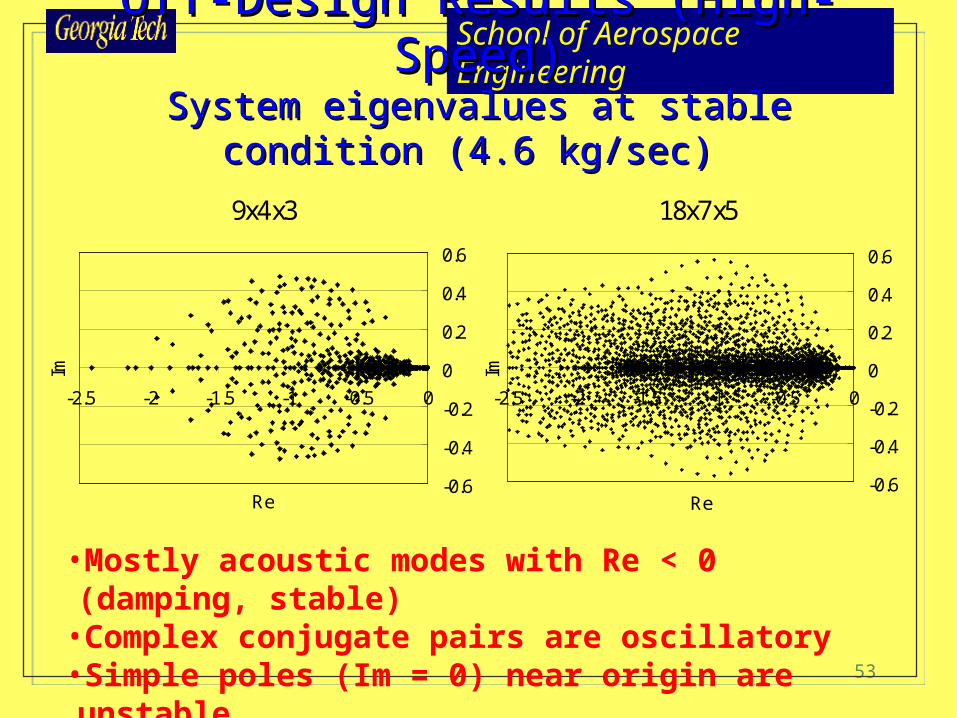
Off-Design Results (High-Speed)Off-Design Results (High-Speed)System eigenvalues at stable condition (4.6 kg/sec) System eigenvalues at stable condition (4.6 kg/sec)
-0.6
-0.4
-0.2
0
0.2
0.4
0.6
-2.5 -2 -1.5 -1 -0.5 0
Re
Im
9x4x3
-0.6
-0.4
-0.2
0
0.2
0.4
0.6
-2.5 -2 -1.5 -1 -0.5 0
ReIm
18x7x5
•Mostly acoustic modes with Re < 0 (damping, stable)•Complex conjugate pairs are oscillatory•Simple poles (Im = 0) near origin are unstable

54
School of Aerospace EngineeringOff-Design Results (High-Speed) Off-Design Results (High-Speed)
System eigenvalues during surge cycle System eigenvalues during surge cycle
-0.08
-0.04
0
0.04
0.08
-1 -0.5 0
ReIm
-0.08
-0.04
0
0.04
0.08
-1 -0.5 0
Re
Im
-0.08
-0.04
0
0.04
0.08
-1 -0.5 0
Re
Im
-0.08
-0.04
0
0.04
0.08
-1 -0.5 0
Re
Im
At beginning of surge cycle
After 25% of surge cycle
After 75% of surge cycle
After 50% of surge cycle
•Most acoustic (damping) modes have vanished
•Simple pole at origin destabilizes system
Top Related