


Languages
Pages
Legal


Project funded by the European Commission under the Seventh Framework Programme, Grant No 217512
www.coinvest.org
Intangible Assets and Their Contribution to Growth in Germany –
Main Findings From a Macro-, Sector- and Micro-Level Perspective
Dirk Crass, Georg Licht and Bettina PetersZEW Centre for European Economic Research, Mannheim
London Dissemination Conference, 23rd September 2010

Main Tasks of ZEW Within COINVEST
Collecting time series of intangible capital and exploring its contribu-tion to economic growth in Germany using growth accounting methods at the macro level● Focus on sensitivity analysis using alternative data sources
Collecting time series of intangible capital and performing growth accounting at the sector level
Assessing the impact of various (not all) types of intangible capital on productivity using German firm-level data

Structure
1. Intangibles and Their Contribution to Growth at the Macro Level
2. Intangibles and Their Contribution to Growth at the Sector Level
3. Impact of Intangibles on Productivity Growth at the Micro Level

Structure
1. Intangibles and Their Contribution to Growth at the Macro Level
2. Intangibles and Their Contribution to Growth at the Sector Level
3. Impact of Intangibles on Productivity Growth at the Micro Level

Intangible Assets: Benchmark Estimates
Computerized information ● Computer software: EU KLEMS
● Computerized databases: EU KLEMS (NACE K724)
Innovative property ● R&D, including social sciences and humanities: GERD (Eurostat)
● Mineral exploration: German national accounts
● Copyright and license costs (Creative Industries): German national accounts
● New product development costs in the financial industry: STAN (OECD)
● New architectural and engineering designs: EU KLEMS
Economic competencies ● Brand equity: EU KLEMS, SBS (Eurostat), World Magazine Trends,
● Firm-specific human capital: LCS 2004, CVTS 2005, EU KLEMS
● Organizational structure: Annual Survey of the European Management Consultancy Market, Structure of Earning Survey 2002 (Eurostat)

Intangible Assets: Sensitivity Analysis
Computerized information ● Computer software: EU KLEMS Nov2009 Release
● Computerized databases: Turnover tax statistics (72.4)
Innovative property ● R&D, including social sciences and humanities: ANBERD (Eurostat)
● Mineral exploration: Turnover tax statistics (45.12)
● Copyright and license costs: Turnover tax statistics (92.11)
● New product development costs in the financial industry: MIP
● New architectural and engineering designs: Turnover tax statistics (74.2)
Economic competencies ● Brand equity: ZAW, MIP, Turnover tax statistics (74.13)
● Firm-specific human capital: MIP, IW
● Organizational structure: Turnover tax statistics (74.14.1), Structure of earnings survey, EU KLEMS Nov2009

Advantage of Alternative Data Sources
Turnover Tax Statistics● Census from the data of the tax authorities that covers nearly all economic
sectors with high quality. It is not based on a sample survey such as the structural business statistics.
● Annual data since 1996 (before that on a biennial basis).
● Unlike SBS no structural break in the year 2000.
● Disaggregated data e.g. on market research (74.13.1) and public opinion polling (74.13.2) available.
● Used for: Computerized databases, mineral exploration, copyright and license costs, new architectural and engineering designs, brand equity, purchased organizational structure.

Advantage of Alternative Data Sources
MIP Mannheim Innovation Panel ● Part of Community Innovation Surveys
● Representative survey
● Annual survey in Germany (EU: 4/2 years), started in 1993
● Extrapolation of figures, based on appr. 5000-6000 firms per year
● Training
• Allows industry break-down for vocational training
• Only direct training costs. Indirect costs are estimated using the proportion of direct to indirect costs provided by IW (av. every 3 years)
● Question on innovation expenditure in the financial industry
● Covers internal and external marketing expenditures beyond advertising
● Used for: Brand equity, new product development costs in the financial industry, and firm-specific human capital

Advantage of Alternative Data Sources IW (Institute of the German Economy)
● Survey data (every three years)
● Direct and indirect training costs.
● Indirect costs: number of training hours * average wage
● Proportion of direct costs to total costs: on average 35%
● Indirect costs used for: Firm-specific human capital.
ZAW (Central Association of the German Advertising Industry)● Publicly available time series data since the mid eighties.
● Broad coverage of all advertising activities and media channels.
● Allows a distinction between net advertising expenditure (media revenues) and gross advertising expenditures (also exp. for the design/production of adv. content and material).
● Unlike SBS no structural break in the year 2000.
● Used for: Brand equity.

Intangible Investment by Category
0.0
5.0
10.0
15.0
20.0
25.0
30.0
35.0
40.0
45.0
1995 1996 1997 1998 1999 2000 2001 2002 2003 2004 2005 2006
Software
Databases
Scientific R&D
Mineral exploration
Copyright licenses
Financial services innovation
Architectural & engineeringdesign
Advertising
Market research
Firm-specific human capital
Organizational structure (p)
Organizational structure (oa)

Intangible Investment as Share of GDP in GermanyInvestment item 1995 1996 1997 1998 1999 2000 2001 2002 2003 2004 2005 2006
Computerized information 0,52 0,56 0,59 0,63 0,69 0,74 0,78 0,76 0,73 0,73 0,73 0,75
Computer Software 0,51 0,55 0,58 0,62 0,68 0,73 0,75 0,73 0,72 0,72 0,71 0,72
Computerized databases 0,01 0,01 0,01 0,01 0,01 0,02 0,02 0,03 0,01 0,01 0,01 0,02
Innovative property 2,90 2,90 2,92 3,15 3,21 3,16 3,09 3,01 3,00 2,89 2,94 2,94
R&D 1,45 1,45 1,51 1,54 1,67 1,73 1,72 1,72 1,76 1,74 1,72 1,77
Mineral exploration 0,00 0,00 0,00 0,01 0,00 0,00 0,00 0,00 0,00 0,00 0,01 0,00
Copyright and license costs 0,21 0,24 0,24 0,35 0,29 0,26 0,24 0,19 0,20 0,18 0,18 0,16
New product dev. costs in the financial industry 0,21 0,19 0,22 0,30 0,33 0,27 0,23 0,24 0,22 0,18 0,22 0,19
New architectural and engineering designs 1,03 1,02 0,96 0,95 0,92 0,90 0,90 0,86 0,82 0,79 0,81 0,82
Economic competencies 3,80 4,01 4,09 4,16 4,05 4,25 4,24 3,96 3,86 3,66 3,79 3,81
Advertising expenditure 1,02 1,03 1,04 1,06 1,08 1,11 1,03 0,95 0,92 0,91 0,91 0,90
Market research 0,10 0,10 0,08 0,07 0,07 0,06 0,06 0,06 0,07 0,08 0,07 0,07
Firm-specific human capital 1,38 1,57 1,62 1,59 1,29 1,34 1,41 1,33 1,36 1,18 1,28 1,29
Purchased organizational structure 0,49 0,52 0,58 0,67 0,84 0,95 0,96 0,85 0,75 0,74 0,79 0,83
Own account organizational structure 0,80 0,79 0,78 0,77 0,77 0,79 0,78 0,77 0,76 0,75 0,74 0,73
Total investment in intangibles 7,22 7,46 7,60 7,93 7,95 8,15 8,11 7,73 7,59 7,28 7,46 7,50
Notes: n.a.: f igure not available; n.y.: f igure not yet available.

Intangible Investment as Share of GDP in Germany
0.56 0.63 0.74 0.76 0.73
2.90 3.15 3.16 3.01 2.89
4.014.16 4.25
3.963.66
0.75
2.94
3.81
7.287.73
8.157.93
7.46 7.50
0.00
1.00
2.00
3.00
4.00
5.00
6.00
7.00
8.00
9.00
1995 1996 1997 1998 1999 2000 2001 2002 2003 2004 2005 2006
Economiccompetencies
Innovativeproperty
Computerizedinformation

Intangible Inv. as Share of GDP in Germany, 2004 – Comparison of Data Sources
0,72
0,01
1,74
0,00
0,18
0,18
0,79
0,91
0,08
1,18
0,74
0,75
0,67
1,69
0,00
0,20
0,70
0,87
0,41
0,15
1,34
0,50
0,47
0,02
-2 ,0 0 2 ,0 0
Computer Software
Computerized databases
R&D
Mineral exploration
Copyright and license costs
New product dev. costs in the financial industry
New architectural and engineering designs
Advertising expenditure
Market research
Firm-specific human capital
Purchased organizational structure
Own account organizational structure
ZEW
TCBE
Intangible Inv. as Share of GDP in Germany, 2004 – Comparison of Data Sources

Comparison of Data Sources: New Product Development Costs in the Financial Industry
0
2000
4000
6000
8000
10000
12000
14000
16000
18000
20000
1995 1996 1997 1998 1999 2000 2001 2002 2003 2004 2005 2006
TCBE ZEW

Comparison of Data Sources: Brand Equity
0
5000
10000
15000
20000
25000
30000
1994 1995 1996 1997 1998 1999 2000 2001 2002 2003 2004 2005 2006
TCBE ZEW

Decomposition of Aggregate Labour Productivity, 1997-2006
Excluding Intangibles Including IntangiblesAggregate value added 0.25 0.32 Average Labour productivity 0.45 0.72 Hours worked -0.20 -0.40
ContributionLab. Productivity 0.45 0.72Capital deepening 0.22 0.52
ICT 0.06 0.08Non-ICT 0.16 0.21Intangible 0.23
Labour quality 0.00 -0.01TFP 0.23 0.21

Structure
1. Intangibles and Their Contribution to Growth at the Macro Level
2. Intangibles and Their Contribution to Growth at the Sector Level
3. Impact of Intangibles on Productivity Growth at the Micro Level

Distribution of Intangible Investments Across Industries
50 504948
13 1314
12
32 3232
33
0
20000
40000
60000
80000
100000
120000
140000
160000
180000
1995 1996 1997 1998 1999 2000 2001 2002 2003 2004 2005 2006
Agriculture, Fishing & Mining ManufacturingElectricity, Gas & Water ConstructionTrade, Hotels & Rest., Transp. & Comm. Financial & Business ServicesBusiness Sector
Increasing trend until 2001 Decrease since 2001
Stable distribution across industries over time

Distribution of Economic Competences Across Industries
38 37 3835
1718
15
16
38
38
39
41
0
10000
20000
30000
40000
50000
60000
70000
80000
90000
100000
1995 1996 1997 1998 1999 2000 2001 2002 2003 2004 2005 2006
Agriculture, Fishing & Mining ManufacturingElectricity, Gas & Water ConstructionTrade, Hotels & Rest., Transp. & Comm. Financial & Business ServicesBusiness Sector

Distribution of Innovative Property Across Industries
71696968
222323
23
0
10000
20000
30000
40000
50000
60000
70000
80000
1995 1996 1997 1998 1999 2000 2001 2002 2003 2004 2005 2006
Agriculture, Fishing & Mining ManufacturingElectricity, Gas & Water ConstructionTrade, Hotels & Rest., Transp. & Comm. Financial & Business ServicesBusiness Sector
Concentrated in two industries
Increasing overall trend, but stable distribution across industries.

Distribution of Computerized Information Across Industries
313136
36
2522
25
26
28
31
40 36
0
2000
4000
6000
8000
10000
12000
14000
16000
18000
20000
1995 1996 1997 1998 1999 2000 2001 2002 2003 2004 2005 2006
Agriculture, Fishing & Mining ManufacturingElectricity, Gas & Water ConstructionTrade, Hotels & Rest., Transp. & Comm. Financial & Business ServicesBusSec
Increasing trend until 2001
Shift in distribution from manufac-turing towards business services

Distribution of Intangible Investments by Sector, 2004
50%
64%
37%
63%
77%67%
61%
40%
30%
56%14%
15%
14% 27%
10% 6% 6%
22%
8%19%
11%
0%
10%
20%
30%
40%
50%
60%
70%
80%
90%
100%
BusinessSector
AgMining(1.6 bn)
Manufr(81.2 bn)
Electricity,Gas&Water
(2.7 bn)
Construct.(3.7 bn)
Trade, Ht,Transp.
(21.0 bn)
FinBsSvc(50,8 bn)
Computerizedinformation
Innovativeproperty
Economiccompetences

Distribution of Intangible Investments by Sector, 2004
0%
10%
20%
30%
40%
50%
60%
70%
80%
90%
100%
Mfr RetHtTrn FinBsSvc
Computer Software
Computerized databases
R&D
Mineral exploration
Copyright and license costs
New product dev. costs in thefinancial industryNew architectural and engineeringdesignsAdvertising expenditure
Market research
Firm-specific human capital
Purchased organizational structure
Own account organizational structure
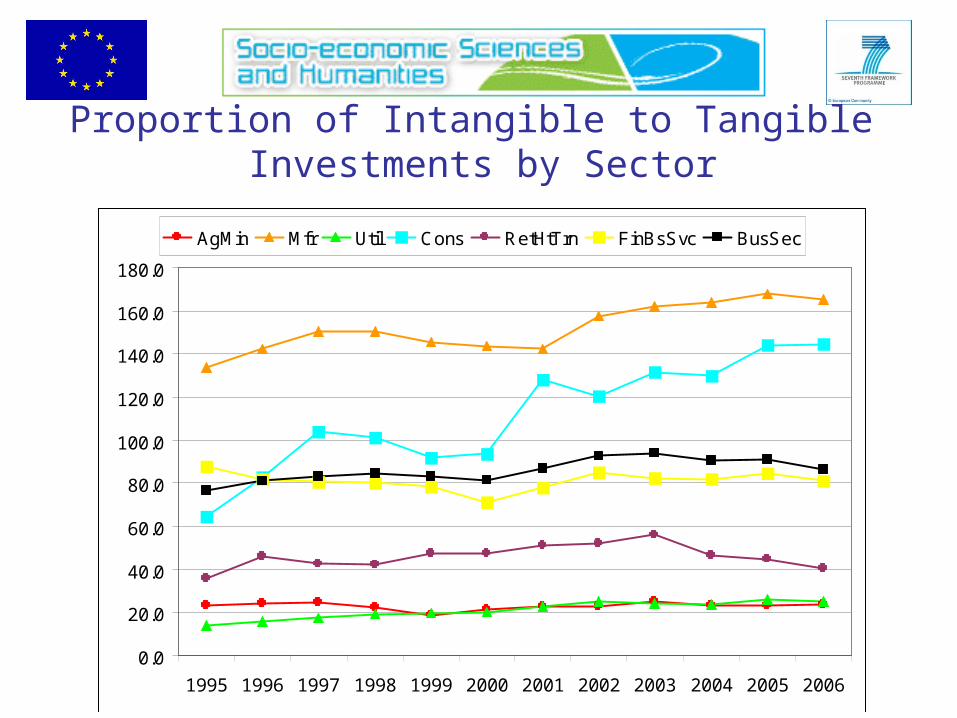
Proportion of Intangible to Tangible Investments by Sector
0.0
20.0
40.0
60.0
80.0
100.0
120.0
140.0
160.0
180.0
1995 1996 1997 1998 1999 2000 2001 2002 2003 2004 2005 2006
AgMin Mfr Util Cons RetHtTrn FinBsSvc BusSec

Intangible Investment by Sector as Share of Sector Value Added
0.0
2.0
4.0
6.0
8.0
10.0
12.0
14.0
16.0
18.0
1995 1996 1997 1998 1999 2000 2001 2002 2003 2004 2005 2006
AgMin Mfr Util Cons RetHtTrn FinBsSvc

Contributions to Labour Productivity at the Sector Level
1 2 3 4 5 6AgMin Mfr. Util. Cons. RetHtTm FinBsSvs
Gross output -0.44 2.94 2.69 -2.66 2.33 3.15Hours worked -3.00 -1.65 -3.69 -2.37 -0.02 3.66Lab. Productivity 2.56 4.59 6.38 -0.29 2.35 -0.51Capital deepening -0.06 0.21 1.44 -0.03 0.33 0.44
ICT 0.02 0.04 0.09 0.02 0.11 0.39Non-ICT -0.08 0.17 1.35 -0.05 0.22 0.05Intangible
Labour quality -0.22 0.07 0.04 0.08 -0.01 -0.03Intermediate input deepening1.21 3.34 4.07 0.09 1.21 -0.22TFP 1.62 0.97 0.83 -0.43 0.81 -0.70
Gross output -0.45 2.90 2.72 -2.65 2.33 3.21Hours worked -3.00 -1.65 -3.69 -2.37 -0.02 3.66Lab. Productivity 2.54 4.55 6.41 -0.28 2.35 -0.45Capital deepening 0.15 0.82 1.84 0.12 0.56 0.86
ICT 0.02 0.04 0.09 0.02 0.12 0.39Non-ICT -0.06 0.20 1.39 -0.05 0.23 0.06Intangible 0.19 0.58 0.36 0.16 0.21 0.41
Labour quality -0.22 0.07 0.04 0.08 -0.01 -0.03Intermediate input deepening1.04 3.10 3.90 0.08 1.16 -0.04TFP 1.57 0.56 0.63 -0.57 0.63 -1.24
Including Intangibles
Excluding Intangibles

Growth Accounting in Manufacturing and Fin.& Bus.Services by Period
1997-2000 2001-2003 2004-2006 1997-2000 2001-2003 2004-2006
Gross output 4.02 0.11 4.21 4.77 1.22 3.13
Hours worked -1.99 -0.86 -1.98 4.47 3.36 2.89
Lab. Productivity 6.01 0.97 6.20 0.30 -2.14 0.23
Capital deepening 1.37 0.50 0.41 1.93 0.33 -0.02
ICT 0.06 0.03 0.02 0.62 0.31 0.17
Non-ICT 0.30 0.12 0.14 0.23 -0.09 -0.03
Intangible 1.00 0.35 0.25 1.08 0.11 -0.17
Labour quality 0.02 0.20 0.02 -0.06 0.16 -0.19
Intermed. input deepening 4.10 0.81 4.05 0.37 -1.06 0.43
TFP 0.53 -0.55 1.72 -1.93 -1.57 0.01
Manufacturing Financial and Business Services

Decomposition of Lab.Prod. by Intangible Assets
AgMin Mfr. Util. Cons. RetHtTm FinBsSvs
Lab. Productivity 2.54 4.55 6.41 -0.28 2.35 -0.45
Capital deepening 0.15 0.82 1.84 0.12 0.56 0.86
ICT 0.02 0.04 0.09 0.02 0.12 0.39
Non-ICT -0.06 0.20 1.39 -0.05 0.23 0.06
Intangible 0.19 0.58 0.36 0.16 0.21 0.41
Computerized Information 0.01 0.04 0.09 0.01 0.05 0.06
Computer Software 0.01 0.04 0.09 0.01 0.05 0.06
Computerized databases 0.00 0.00 0.00 0.00 0.00 0.00Innovative property 0.07 0.39 0.06 0.04 0.04 0.21
R&D 0.02 0.29 0.01 0.00 0.01 0.05Mineral exploration 0.01 0.00 0.00 0.00 0.00 0.00Copyright and license costs 0.00 0.04 0.00 0.00 0.00 0.00New product dev. Costs in fin. Ind. 0.00 0.00 0.00 0.00 0.00 0.07New architectural and engin. designs 0.04 0.06 0.05 0.04 0.03 0.09
Economic competencies 0.11 0.15 0.21 0.11 0.13 0.15Advertising expenditure 0.03 0.02 0.03 0.01 0.02 0.00Market research 0.00 0.00 0.00 0.00 0.00 0.00Firm-specific human capital 0.01 0.05 0.09 0.05 0.06 0.04Purchased organizational structure 0.03 0.03 0.04 0.02 0.02 0.04Own account organizational structure 0.04 0.05 0.05 0.03 0.03 0.07
Labour quality -0.22 0.07 0.04 0.08 -0.01 -0.03Intermediate input deepening 1.04 3.10 3.90 0.08 1.16 -0.04TFP 1.57 0.56 0.63 -0.57 0.63 -1.24
Including Intangibles

Structure
1. Intangibles and Their Contribution to Growth at the Macro Level
2. Intangibles and Their Contribution to Growth at the Sector Level
3. Impact of Intangibles on Productivity Growth at the Micro Level

Motivation
At the micro level:
● Much evidence on productivity enhancing effects of R&D
● But only scarce evidence on the effect of other types of intangibles
investments at the firm level
Research question: Do all types of investments in intangible assets
enhance productivity at the firm-level?
Analysis based on panel data (MIP) for German companies from 2006-
2008 (5117 firms, 7552 observations).

Estimation Approach
Cobb-Douglas production function
● With Q: output, L: labour, K: physical capital, M: material, λ: exogenous technological change, u: error term
● RD: R&D capital, NI: non-R&D related innovation capital, TR: human capital, MKT: marketing
As log specification:
Estimation Methods: Pooled OLS, FE (fixed effects), FD (first difference estimation, i.e productivity growth)
31 2 4(1) t ituit it it it it it it itQ Ae L K M RD NI TR MKT e
1
2 3 4
(2) log( ) log( ) log( ) log( ) log( )
log( ) log( ) log( )it it it it it
it it it t it
Q a L K M RD
NI TR MKT u

Knowledge-related Intangible Input Factors R&D:
● log (R&D expenditure / employee)
Non-R&D related innovation: ● log (expenses for external knowledge, design, market introduction, training and
product preparation related to innovation / employee)
Marketing: ● log (marketing expenditure / employee)● Note: to avoid double accounting we correct for market expenditure for innovation
projects (based on industry average in prior wave)
Training: ● log (training / employee)● Note: to avoid double accounting we correct for training expenditure for innovation
projects (based on industry average in prior wave)
Organisational innovation: ● 4 dummies for whether the firm has introduced new practices, workplace
organisation, knowledge management and external relationships

Additional Explanatory Variables
Traditional input factors:● Labour : log (# employees)
Note: to avoid double counting we correct the total number of employees for R&D employees
● Physical capital: log (tangible assets / employee)Note: tangible assets are direct information from the survey
● Material: log (material expenses / employees)
Control variables:● East Germany: dummy whether firm is located in East Germany● Export intensity: exports / sales● Group: company is part of a group (0/1)● Time dummies● Industry dummies

Main Findings From Micro Work
We confirm strong positive productivity effects for R&D, marketing and training.
Effects of marketing are highest, even higher than those of R&D (in the short term).
Only weak evidence for positive productivity effects of non-R&D related innovation assets like design, licenses and product preparation.
Mixed productivity effects of firms increasing their organizational capital by introducing organisational innovations: ● positive effect for business practices
● but not for workplace organisation

Back-Up Slides

Structure
1. Intangibles and Their Contribution to Growth at the Macro Level
2. Intangibles and Their Contribution to Growth at the Sector Level
3. Impact of Intangibles on Productivity Growth at the Micro Level

Econometric results
FE(1) (2) (3) (4) (5)
Labor -0.023 *** -0.027 *** -0.036 *** -0.046 *** - -Capital 0.077 *** 0.073 *** 0.069 *** 0.080 *** 0.079 *** 0.085 ***Material 0.416 *** 0.414 *** 0.405 *** 0.44 *** 0.165 *** 0.151 ***R&D 0.013 *** 0.006 *** 0.016 *** 0.008 ** 0.007 *Non-R&D Innov. 0.004 *** 0.001 -0.001 0.000Training 0.00003 *** 0.00003 *** 0.00002 *** 0.00002 **Marketing 0.011 *** 0.007 * 0.012 *** 0.012 **Busin. Process 0.064 **Workplace orga -0.038Extern. rel. -0.005Knowl. manag. 0.013Controls yes yes yes yes yes yesTime D yes yes yes yes yes yesIndustry D yes yes yes yes no yesR2 0.695 0.698 0.705 0.746 0.17 0.137# Obs. 7552 7552 7552 2317 7552 2356
LevelPooled OLS

Econometric resultsProductivity
FE(5)
Labor - -Capital 0.079 *** 0.085 ***Material 0.165 *** 0.151 ***R&D 0.008 ** 0.007 *Non-R&D Innov. -0.001 0.000Training 0.00002 *** 0.00002 **Marketing 0.012 *** 0.012 **Busin. ProcessWorkplace orgaExtern. rel.Knowl. manag.Controls yes yesTime D yes yesIndustry D no yesR2 0.17 0.137# Obs. 7552 2356
Growth rateOLS(5)

Descriptive statisticsMean SD Median Min Max
Productivity 0.268 1.293 0.138 0.002 89.938Productivity growth 0.016 0.375 0.015 -5.118 3.040Employees 851 6091 42 0 399796Physical capital 0.143 0.692 0.025 0 41.063Material costs 0.152 1.156 0.051 0 89.794R&D expenditures 0.008 0.114 0.000 0 5.941Non-R&D innovation 0.005 0.024 0.000 0 1.050Training 0.001 0.001 0.000 0 0.048Marketing 0.002 0.009 0.000 0 0.485Busin. Process 0.364 0.483 0 0 1Workplace orga 0.354 0.480 0 0 1External rel. 0.246 0.434 0 0 1Knowl. manag. 0.289 0.453 0 0 1East Germany 0.323 0.468 0 0 1Group 0.367 0.482 0 0 1Export intensity 0.167 0.252 0.011 0 1.118

Intangible Investment by category (in % of total intang. investment)
0.0 5.0 10.0 15.0 20.0 25.0
Software
Databases
Scientific R&D
Mineral exploration
Copyright licenses
Financial services innovation
Architectural & engineering design
Advertising
Market research
Firm-specific human capital
Organizational structure (p)
Organizational structure (oa)
y1995
y2000
y2005
Top Related