


Languages
Pages
Legal

An-Najah National University Faculty of Graduate Studies
Prevalence of overweight and obesity and their associations with dietary habits among students from
An-Najah National University: A cross-sectional study
By Bassam Ali Abdel Raheem Abu Shanab
Supervisor Dr. Haleama Hasan Al -Sabbah
This thesis is Submitted in Partial Fulfillment of the Requirements for the Degree of Master in Public Health, Faculty of Graduate Studies, An- Najah National University, Nablus, Palestine.
2011
iii
Dedication
I dedicate this work especially to my family;
Wife, sons, daughters
Parents, bropthers, sisters
Nieces, nephews
And friends with love and respect
Bassam Ali Abu Shanab
iv
Acknowledgement
First of all, I would like to express my Special thanks and Sincere
gratitude to my family; wife, sons, daughters and also to my friends for
their encouragement, and support, to finish this study.
Sincere gratitude also goes to Dr. Haleama Al –Sabbah; my
supervisor, for her guidance, highly efforts, and useful suggestions and
advises in order to carry out this research study.
Appreciations and Sincere gratitude also goes to Dr. Ali Barakat,
and Dr. Hassan Abu Qaoud, who helped me with their knowledge and
experience to fulfill this thesis. I do highly appreciate the cooperation of
Mr. Sami Budair for his help in data collection. Many thanks and
appreciations are also expressed to Roaia Melhem, Yasmeen Eisa, Rasha
Dweekat, Moataz Kabha, Hadeel Mohtadi, Ahmed, Helal and Heba
Borini for their help in data collection. Many thanks to all the Students
who participated in this study
Finally, I would like to express my special thanks to An-Najah
National University Administration that gave me the chance to
accomplish this work.
v
:
Prevalence of overweight and obesity and their associations with dietary habits among students from
An-Najah National University: A cross-sectional study
:
.
Declaration
The work provided in this thesis, unless otherwise referenced, is the
researcher’s own work and has not been submitted elsewhere for any other
degree or qualification.
:
Student's name:
:
Signature:
:
Date:
vi
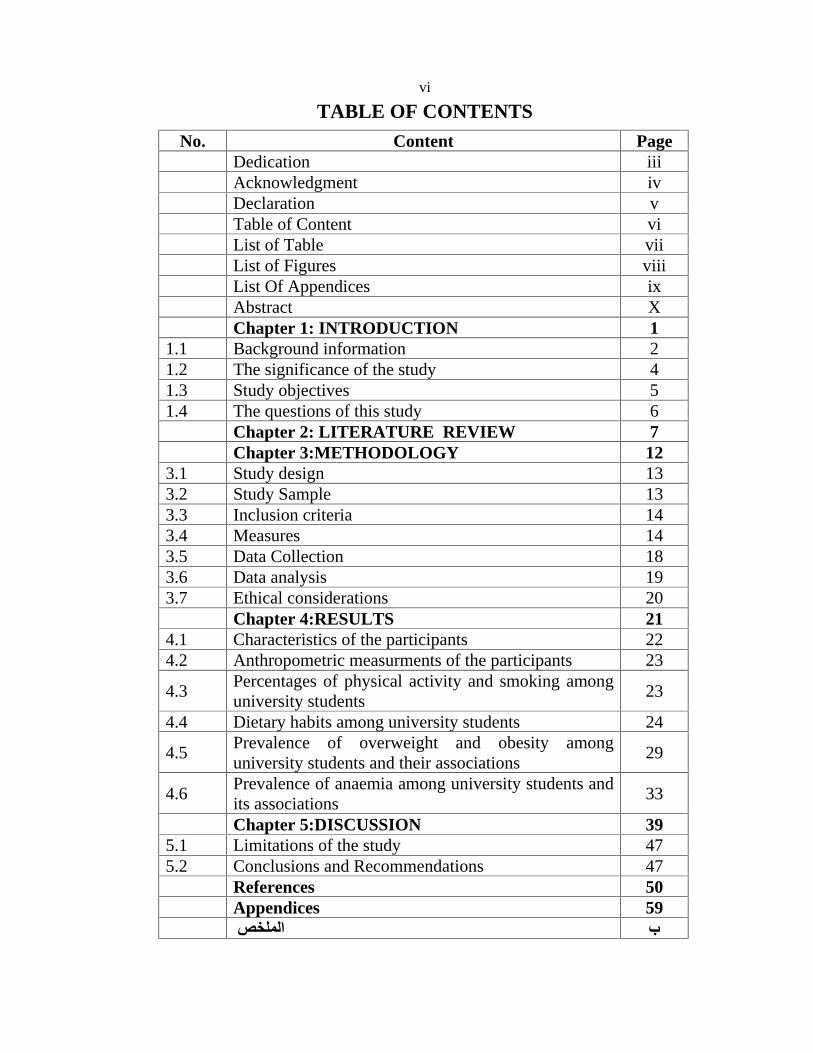
TABLE OF CONTENTS No. Content Page
Dedication iii
Acknowledgment iv
Declaration v
Table of Content vi
List of Table vii
List of Figures viii
List Of Appendices ix
Abstract X
Chapter 1: INTRODUCTION 1 1.1 Background information 2 1.2 The significance of the study 4 1.3 Study objectives 5 1.4 The questions of this study 6
Chapter 2: LITERATURE REVIEW 7
Chapter 3:METHODOLOGY 12 3.1 Study design 13 3.2 Study Sample 13 3.3 Inclusion criteria 14 3.4 Measures 14 3.5 Data Collection 18 3.6 Data analysis 19 3.7 Ethical considerations 20
Chapter 4:RESULTS 21 4.1 Characteristics of the participants 22 4.2 Anthropometric measurments of the participants 23
4.3 Percentages of physical activity and smoking among university students
23
4.4 Dietary habits among university students 24
4.5 Prevalence of overweight and obesity among university students and their associations
29
4.6 Prevalence of anaemia among university students and its associations
33
Chapter 5:DISCUSSION 39 5.1 Limitations of the study 47 5.2 Conclusions and Recommendations 47
References 50
Appendices 59
vii
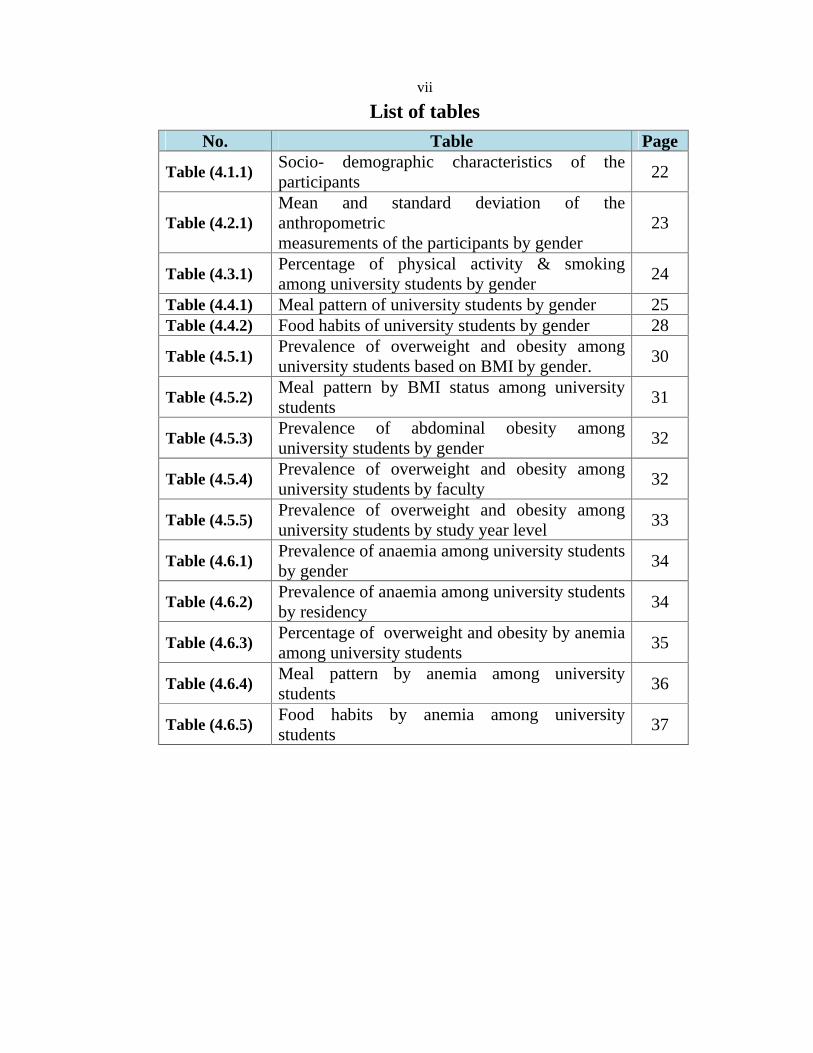
List of tables
No. Table Page
Table (4.1.1) Socio- demographic characteristics of the participants
22
Table (4.2.1) Mean and standard deviation of the anthropometric measurements of the participants by gender
23
Table (4.3.1) Percentage of physical activity & smoking among university students by gender
24
Table (4.4.1) Meal pattern of university students by gender 25 Table (4.4.2) Food habits of university students by gender 28
Table (4.5.1) Prevalence of overweight and obesity among university students based on BMI by gender.
30
Table (4.5.2) Meal pattern by BMI status among university students
31
Table (4.5.3) Prevalence of abdominal obesity among university students by gender
32
Table (4.5.4) Prevalence of overweight and obesity among university students by faculty
32
Table (4.5.5) Prevalence of overweight and obesity among university students by study year level
33
Table (4.6.1) Prevalence of anaemia among university students by gender
34
Table (4.6.2) Prevalence of anaemia among university students by residency
34
Table (4.6.3) Percentage of overweight and obesity by anemia among university students
35
Table (4.6.4) Meal pattern by anemia among university students
36
Table (4.6.5) Food habits by anemia among university students
37

viii
List of Figures
No. Figure Page Figure (1) Variables influencing overweight and obesity 17
Figure (2) Conceptual framework for the causes of overweight & obesity
18
ix
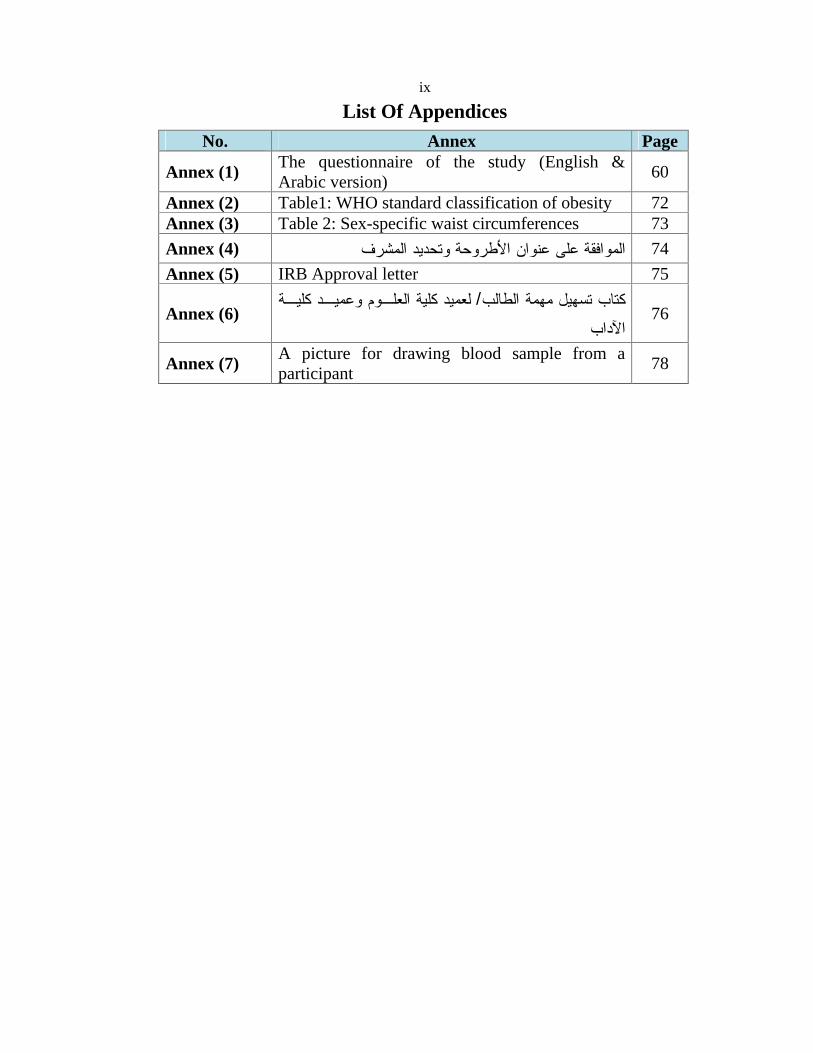
List Of Appendices No. Annex Page
Annex (1) The questionnaire of the study (English & Arabic version)
60
Annex (2) Table1: WHO standard classification of obesity 72 Annex (3) Table 2: Sex-specific waist circumferences 73
Annex (4)
74
Annex (5) IRB Approval letter 75
Annex (6) /
76
Annex (7) A picture for drawing blood sample from a participant
78
x
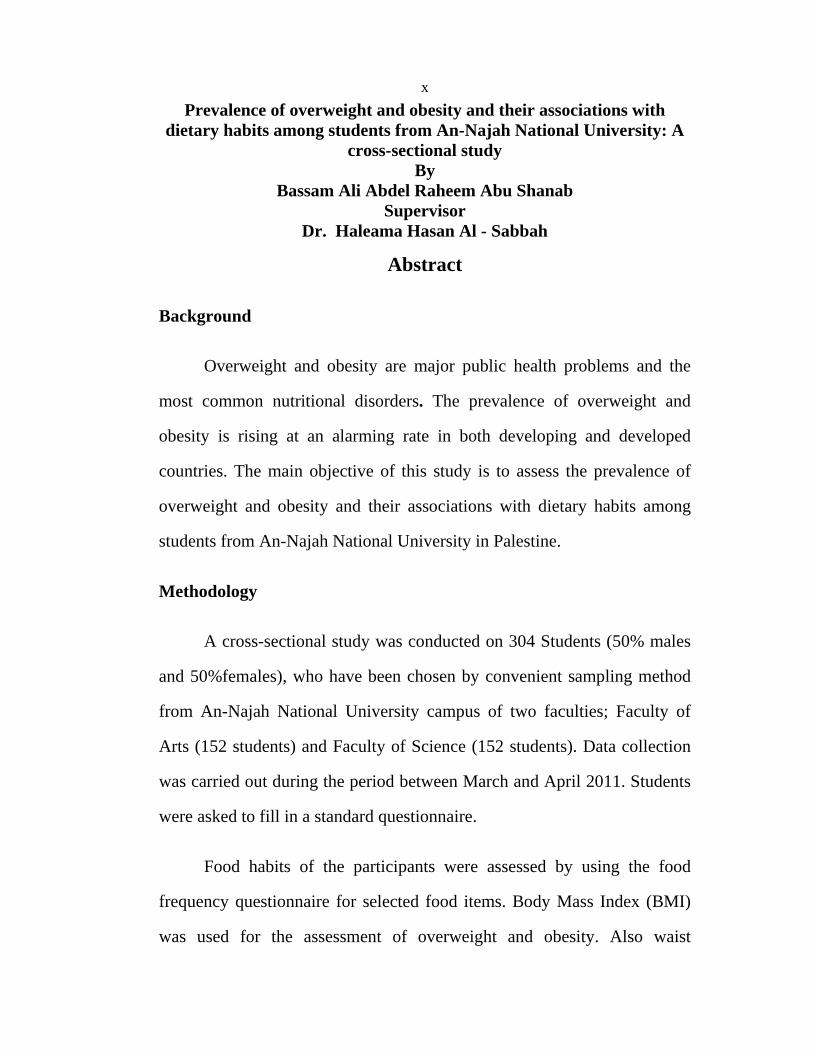
Prevalence of overweight and obesity and their associations with dietary habits among students from An-Najah National University: A
cross-sectional study By
Bassam Ali Abdel Raheem Abu Shanab Supervisor
Dr. Haleama Hasan Al - Sabbah
Abstract
Background
Overweight and obesity are major public health problems and the
most common nutritional disorders. The prevalence of overweight and
obesity is rising at an alarming rate in both developing and developed
countries. The main objective of this study is to assess the prevalence of
overweight and obesity and their associations with dietary habits among
students from An-Najah National University in Palestine.
Methodology
A cross-sectional study was conducted on 304 Students (50% males
and 50%females), who have been chosen by convenient sampling method
from An-Najah National University campus of two faculties; Faculty of
Arts (152 students) and Faculty of Science (152 students). Data collection
was carried out during the period between March and April 2011. Students
were asked to fill in a standard questionnaire.
Food habits of the participants were assessed by using the food
frequency questionnaire for selected food items. Body Mass Index (BMI)
was used for the assessment of overweight and obesity. Also waist
xi
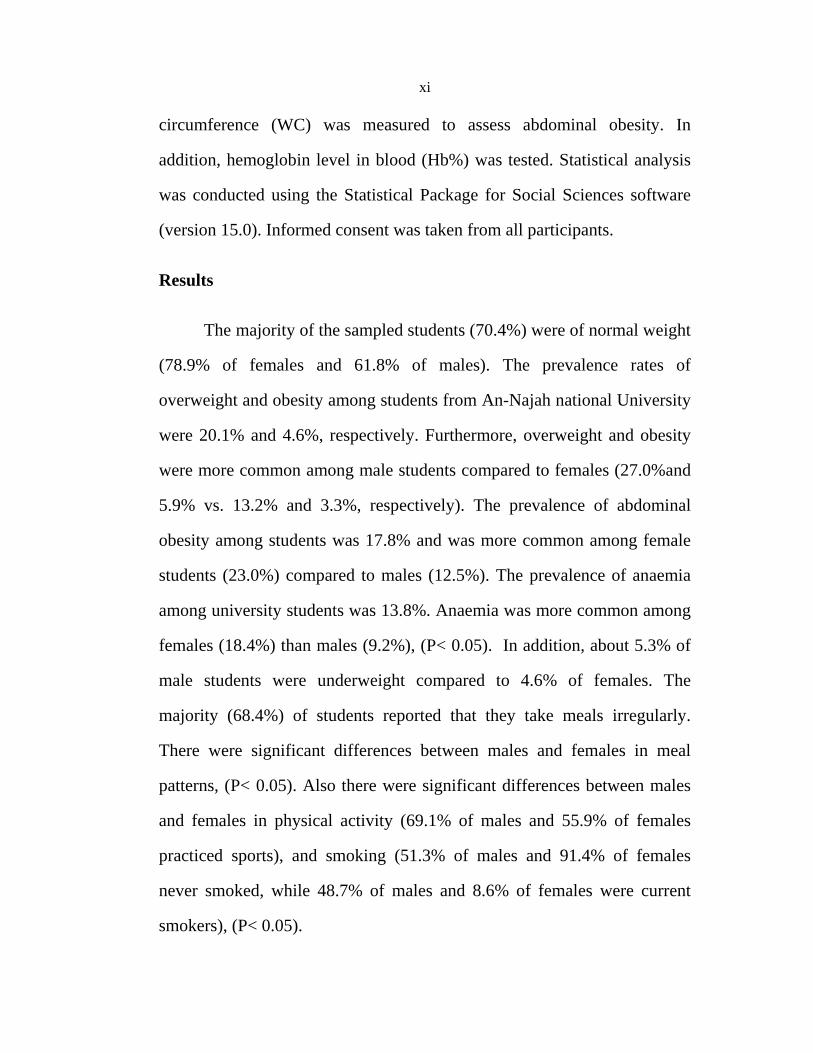
circumference (WC) was measured to assess abdominal obesity. In
addition, hemoglobin level in blood (Hb%) was tested. Statistical analysis
was conducted using the Statistical Package for Social Sciences software
(version 15.0). Informed consent was taken from all participants.
Results
The majority of the sampled students (70.4%) were of normal weight
(78.9% of females and 61.8% of males). The prevalence rates of
overweight and obesity among students from An-Najah national University
were 20.1% and 4.6%, respectively. Furthermore, overweight and obesity
were more common among male students compared to females (27.0%and
5.9% vs. 13.2% and 3.3%, respectively). The prevalence of abdominal
obesity among students was 17.8% and was more common among female
students (23.0%) compared to males (12.5%). The prevalence of anaemia
among university students was 13.8%. Anaemia was more common among
females (18.4%) than males (9.2%), (P< 0.05). In addition, about 5.3% of
male students were underweight compared to 4.6% of females. The
majority (68.4%) of students reported that they take meals irregularly.
There were significant differences between males and females in meal
patterns, (P< 0.05). Also there were significant differences between males
and females in physical activity (69.1% of males and 55.9% of females
practiced sports), and smoking (51.3% of males and 91.4% of females
never smoked, while 48.7% of males and 8.6% of females were current
smokers), (P< 0.05).
xii
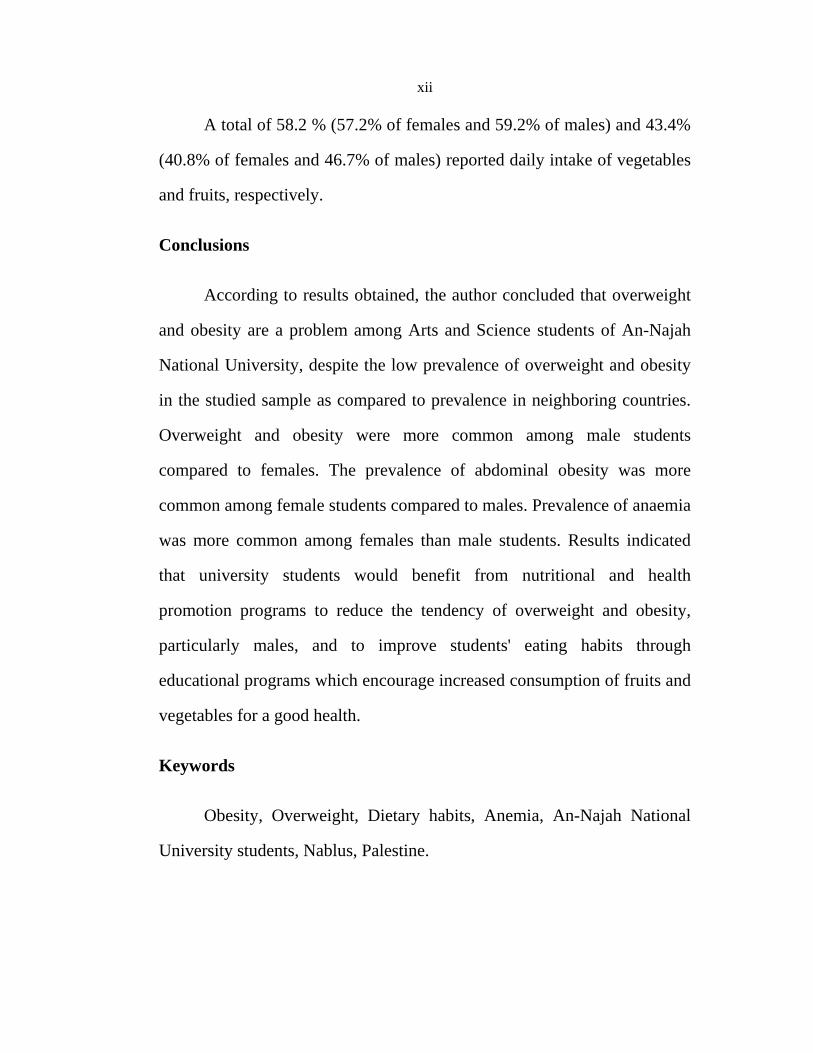
A total of 58.2 % (57.2% of females and 59.2% of males) and 43.4%
(40.8% of females and 46.7% of males) reported daily intake of vegetables
and fruits, respectively.
Conclusions
According to results obtained, the author concluded that overweight
and obesity are a problem among Arts and Science students of An-Najah
National University, despite the low prevalence of overweight and obesity
in the studied sample as compared to prevalence in neighboring countries.
Overweight and obesity were more common among male students
compared to females. The prevalence of abdominal obesity was more
common among female students compared to males. Prevalence of anaemia
was more common among females than male students. Results indicated
that university students would benefit from nutritional and health
promotion programs to reduce the tendency of overweight and obesity,
particularly males, and to improve students' eating habits through
educational programs which encourage increased consumption of fruits and
vegetables for a good health.
Keywords
Obesity, Overweight, Dietary habits, Anemia, An-Najah National
University students, Nablus, Palestine.

1
Chapter 1
Introduction
2
Chapter 1
Introduction
1.1 Introduction
Obesity is a medical condition in which excess body fat has
accumulated to the extent that it may have an adverse effect on health,
leading to reduced life expectancy and/or increased health problems [1].
Obesity is a leading but preventable cause of death worldwide, with
increasing prevalence in adults and children, and it is one of the most
serious public health problems of the 21st century [2]. Some contributing
factors are said to include a global shift in diet towards increased calories,
fat, salt, and sugar intake, a trend towards decreased physical activity due
to the sedentary nature of modern work, transportation, and increasing
urbanization [3].
Dietary habits are the major aspects of people's lifestyles that
influence health, morbidity, and mortality for a range of conditions [4].
Overweight and obesity are major public health problems and the most
common nutritional disorders [5], therefore, both overall and abdominal
obesity are associated with non-communicable chronic diseases such as
type 2 diabetes, cardiovascular and cerebrovascular diseases, digestive
disorders, and cancer [6]. As obesity is one of the major health challenges
worldwide, it is rapidly reaching epidemic proportions [7, 8]. Disorders
related to obesity are a growing epidemic in both developing and developed
countries [9- 11].
3
The World Health Organization (WHO) classifies adults as
overweight when Body Mass Index (BMI) is 25 -29.9 kg/m2, obese when
BMI is >30 kg/m2, and have abdominal obesity when waist circumference
(WC) > 94 cm for men and >80 cm for women, and Waist –to-Hip Ratio
(WHR) of > 0.90 in men and > 0.85 in women [12]. Overweight is
generally defined as having more body fat than is optimally healthy [13,
14]. The estimates in 2005 showed that more than 1 billion people
worldwide were overweight and more than 300 million were obese.
Prevalence is expected to increase further in almost all countries, with 1.5
billion people expected to be overweight in 2015 [15].
Several studies indicated that causes of obesity are multifactorial
[16-18]. These factors may include biological and non-biological factors
such as heredity, age, sex, occupation, socio-economic level, physical
inactivity, eating habits and physiological factors [9, 10, 16-18].
Complications are either directly caused by obesity or indirectly through
mechanisms sharing a common cause such as poor diet or a sedentary
lifestyle. The strength of the association between obesity and specific
conditions varies. One of the strongest is the link with Type 2 diabetes.
Obesity is responsible for a large proportion of the total burden of chronic
diseases, 65% of the obesity and overweight in the European region is
associated with growing rates of chronic diseases such as heart disease,
diabetes and cancers [8- 19]. The condition is thus affecting longevity, and
in particular trends in childhood obesity are widely expected to lead to
shorter life expectancy for today’s children [8- 19]. In the United States,
4
obesity is estimated to cause an excess 111,909 to 365,000 deaths per year
[20] while 1 million (7.7%) of deaths in the European Union are attributed
to excess weight [21-22]. On average, obesity reduces life expectancy by
six to seven years [21, 23]. A BMI of 30–35 reduces life expectancy by two
to four years, while severe obesity (BMI > 40) reduces life expectancy by
10 years [23-24].
1-2 Significance of this study
In Palestine, an increased prevalence of excessive weight is noted
among all age groups in both genders. It is important to note that there has
been a nutritional transition in food choices during the past years from the
typical Mediterranean diet into the western fast food pattern. Therefore,
obesity is responsible for a large proportion of the total burden of diseases,
such as heart disease, diabetes and cancers [8- 19].
Several international and regional studies indicated that factors
causing obesity are multi-factorial [16-18]. Data from the occupied
Palestinian territory, (based on one study that was done in a rural
community in Ramallah, are for adults aged 30-65 years and are not
necessarily an indication of the national data) indicated that the prevalence
of obesity and overweight in men was 58.7% and in women was 71.3%
[25]. Recently, few studies have been conducted to assess the associations
with overweight among Palestinian schoolchildren [26, 27], whereas there
were no studies conducted to assess the prevalence of overweight and
5
obesity and their associations with dietary habits among university
students.
To the best of my knowledge, this is the first study to be conducted
in Palestine regarding prevalence of obesity, overweight and their
associations with dietary habits among university students.
1.3 Study objectives
1.3.1 Main Objective
To assess the prevalence of overweight and obesity and their
associations with dietary habits among students from An-Najah National
University, Palestine
1.3.2 Specific objectives:
1- To assess the prevalence of overweight and obesity among An-Najah
University students.
2- To describe the university students' lifestyle including: food habits, meal
pattern, smoking, and physical inactivity.
3- To examine the associations between overweight and obesity by meal
pattern among An-Najah University students.
4- To assess the prevalence of anaemia among university students and
identify the differences between students living in dorms and students
living with their families.
6
5- To examine the association between anemia and each of overweight,
obesity among university students.
6- To assess the association between anemia and dietary habits among
University students.
1.4 The questions of this study
The study aimed at answering the following questions:
1. What are the present proportions of overweight and obesity among Arts
and Science students at An-Najah National University, Nablus,
Palestine?
2. Are there significant relationships at the level = 0.05 between
overweight and obesity and lifestyle factors including: food habits, meal
pattern, physical activity and smoking?
3. What are the present proportions of anemia among the studied sample of
university students at An-Najah National University –Nablus- Palestine?
4. Are there significant relationships at the level = 0.05 between
overweight and obesity and anemia among the studied sample of
university students?
5. Are there significant relationships at the level = 0.05 between dietary
habits and anemia among the studied sample of university students?

7
Chapter 2
Literature Review
8
Chapter 2
Literature Review
In the United States, obesity was not considered as an issue of
interest in the mid-1980s, but since then, it has become more common in
2003-2004, approximately 32.2 percent of the US adult populations were
obese [28]. Almost one third of the adult Canadians are at increased risk of
disability, disease, and premature death due to obesity [29]. Obesity is
relatively common in Europe, especially in southern and eastern countries,
and studies from repeated surveys suggested that the prevalence of obesity
has been increasing in recent years [30, 31].
In the Arab countries, some studies are available (Jordan, Kuwait,
Saudi Arabia and Lebanon) regarding the determinants of obesity
particularly among university students. These studies plus others from
developed countries, draw an alarming picture of prevalent obesity, which
in turn could be an indicator for an increase in the occurrence of other
chronic diseases in the region [32 ].The factors associated with obesity
were age, sex, marital status, smoking, physical activity, parental obesity,
dietary habits and socio-cultural factors [33-35].
In a study conducted in Jordan in 2009, the prevalence rates of
overweight and obesity among Jordan University students (aged 17-28
years) were 28.5% and 10.2%, respectively [36]. Another study in Jordan
[37], conducted on 233 females aged 20-25 years from the Jordan Northern
Badia, showed that prevalences of overweight and obesity were 27.0%and
6.9%, respectively. Factors that were found to be significantly (P<0.05)
9
associated with BMI among the Badia young females included educational
status, marital status, work status, smoking status and chronic diseases [37].
A study conducted on Kuwait University students in 1999 regarding
the prevalence of obesity, the Grade 1 (when BMI is 30.0-34.9 kg/m2) and
Grade 2 obesity (when BMI is 35.0-39.9 kg/m2) were found to be 32.0%
and 8.9%, respectively [38]. In 2008, the prevalence of overweight and
obesity among students of the Lebanese American University was higher
among male students compared to females (37.5% and 12.5% vs. 13.6%
and 3.2%, respectively) [39].
A study conducted on university students (aged 17 - 38 years), in
Bahrain, the proportions of obesity were 11.8% in males and 7.6% in
females [40]. In Saudi Arabia, a study conducted on Saudis of both
genders, the overweight was significantly more prevalent in males (42.4%)
compared to 31.8% of females [41]. Several regional and international
studies investigated the associations of overweight and obesity with the
lifestyle (meal pattern, physical activity and smoking) and anemia, among
university students. A study was conducted in California State University,
Chico, in 2004 to assess the diet, exercise habits and perceived barriers to
following a healthy lifestyle of 471 college students [42] Sixty percent of
the participants were females (aged 18-21) and 31% had BMIs > 25. The
study found that breakfast was the most commonly missed meal and 63%
of students snacked one to two times per day. About 58% of participants
ate vegetables and 64% ate whole or canned fruit less than once per day.
10
The most common barrier to exercise was “lack of time.” Forty percent of
men compared with 20% of women had a BMI greater than 25 [42].
A study carried out in Kuwait to explore the factors associated with
overweight and obesity in a sample of 515 Kuwaiti college men revealed
that 38·5 and 11·1% of the students were overweight and obese,
respectively. The factors that were found to be significantly associated with
overweight and obesity among men included age, marital status, exercising
and dieting [43].
Regarding the associations of Iron Deficiency Anemia with
overweight and obesity, iron deficiency anemia was common in overweight
and obese students: A recent study in Saudi Arabia, conducted on 310
female students aged (18 - 23 years) at the Faculty of Medicine of King
Abdul-Aziz University, indicated that 23.9% of students had iron
deficiency anemia, [44]. There was a significant correlation between iron
deficiency and iron deficiency anemia with inadequate meat intake and
impaired exercise capacity [44].
A study in Bahrain in 2005, conducted on school children (2594
students aged 6-18 years) indicated that prevalence of overweight and
obesity was high (girls 25.5%, boys 21.4%); 50% of girls and 36% of boys
skipped breakfast meal regularly; students reported low levels of physical
activity and indulged in a sedentary life style; prevalence of anemia was
higher among girls (31.7%) compared to boys (22.7%), [45]. Furthermore,
a study in Israel in 2001, assessed whether overweight children and
11
adolescents, who often have poor dietary habits, are at increased risk of
iron deficiency. The study was conducted on 321 children and adolescents
followed in two endocrine centers between 1999 and 2001.The study
indicated that iron levels below 8 micromole/l (45 mcg/dl) were noted in
38.8% of obese children and 12.1% of overweight children, compared with
4.4% of normal-weight group (P<0.001), [ 46].
In Palestine, there is a lack of data about obesogenic factors (factors
tending to cause obesity) which are important in defining and
understanding high risk factors which should be targeted for future
modifications in public health interventions. Also, there were no studies
conducted to assess the prevalence of obesity among university students.
Therefore, this study was conducted to assess the prevalence of overweight,
obesity and their associations with dietary habits among students from An-
Najah National University in Palestine.

12
Chapter 3
Methodology
13
Chapter 3
Methodology
3.1 Study Design
A cross-sectional study was conducted on a sample of 304 BA and
BSC students admitted to the Faculty of Arts and the Faculty of Science at
An-Najah National University (Nablus, Palestine) between 2006 and 2010.
3.2 Study Sample
A sample of 304 students was chosen from An-Najah National
University campus of two faculties (Faculty of Arts and Faculty of science
in a ratio of 1:1). Number of participants from each faculty was 152 (76
males + 76 females). Enrollment and recruitment of the study subjects have
been done through weekly meetings with the faculty students explaining to
them the aim and objective of the study. Those who agreed to participate
and met the study inclusion criteria were asked to fill in and sign a consent
form and invited for anthropometric measurements and blood drawings
through a fixed appointment. The sample size was estimated as follows:
2
2
2
)1(* pPzn (1)
N
nn
n1
1
* (2)
The researcher assumed that the proportion of obesity in each
faculty, P = 7% (0.07), and (half-width of confidence interval) is 4%
14
(0.04) with confidence coefficient of 95% ( 2/Z = 1.96). The calculated
sample size using formula (1) was 157 from each faculty. After correction
for finite population size based on formula (2) and taking into consideration
that the population size (N) was 2500 in each faculty, the sample size was
148 from each faculty. The actual number of participants in the study was
slightly larger than that calculated (304 students: 152 from each faculty)
chosen by convenient sampling method and distributed as follows:
1st year: 38 students (19males + 19 females).
2nd year: 38 students (19males + 19 females).
3rd year: 38 students (19males + 19 females).
4th year: 38 students (19males + 19 females).
3.3 Inclusion and Exclusion Criteria
The study included students who were still studying at both faculties
(Faculty of Arts and Faculty of science) at An-Najah National University
while excluded blind students who couldn’t fill in the questionnaire.
3.4 Main Measures
Obesity: Obesity is a medical condition in which excess body fat has
accumulated to the extent that it may have an adverse effect on health,
leading to reduced life expectancy and/or increased health problems [1].
Overweight: Overweight is generally defined as having more body fat than
is optimally healthy [47].
15
Body Mass Index (BMI): It is defined as the weight in kilograms divided
by the square of the height in meters (kg/m2). A value of BMI < 18.5 kg/m2
was classified as underweight, 18.5– 24.9 kg/m2 was classified as normal
weight, 25.0–29.9 kg/m2 was classified as pre-obese (overweight), and
BMI > 30 was classified as obese, [48,49].
Waist circumference (WC): Is a convenient and simple measure which is
unrelated to height, correlates closely with BMI and the ratio of waist-to-
hip circumference, and is an approximate index of intra-abdominal fat mass
and total body fat. Furthermore, changes in waist circumference reflect
changes in risk factors for cardiovascular disease and other forms of
chronic diseases, even though the risks seem to vary in different
populations. There is an increased risk of metabolic complications for men
with a waist circumference 102 cm, and women with a waist
circumference 88 cm. [50]. Recently, waist circumference has been used
in its own right as an indicator of risk associated with excess abdominal fat
[51]. In this study, waist circumference was measured at a level midway
between the lowest rib and the iliac crest, by a measuring tape.
Hemoglobin ( Hb): Hemoglobin in the blood transports oxygen from the
lungs to the rest of the body (i.e. the tissues) where it releases the oxygen
for cell use, and collects carbon dioxide to bring it back to the lungs.
Normal results vary, but in general are: Hb level for males: 13.8 to 17.2
gm/dL, for females: 12.1 to 15.1 gm/dL, [52, and 53].
16
Iron deficiency anemia (IDA): is a common anemia (a decrease in number
of red blood cells (RBCs) or less than the normal quantity of hemoglobin in
the blood ) [54] that occurs when iron loss occurs (often from intestinal
bleeding or menses), and/or the dietary intake or absorption of iron is
insufficient. In iron deficiency, hemoglobin, which contains iron, cannot be
formed [55].
The study Questionnaire:
A questionnaire which was previously used [56] was modified, and
contained 29 questions (dietary habits, smoking and physical activity,
height, weight, WC, Hb%, etc) tested on ten students by a pilot study to
determine its acceptability and ease of use by the study participants. The
pilot study was carried out in order to identify potential problems and to
revise the methods and logistics of data collection before starting the actual
fieldwork. The selected tools were appropriate for the collection of the
needed information. Questions were understood and answered correctly.
The sequence of the questions was logical, the wording clear, and
translations accurate. Accordingly, the questionnaire was valid and reliable
for the study purposes.
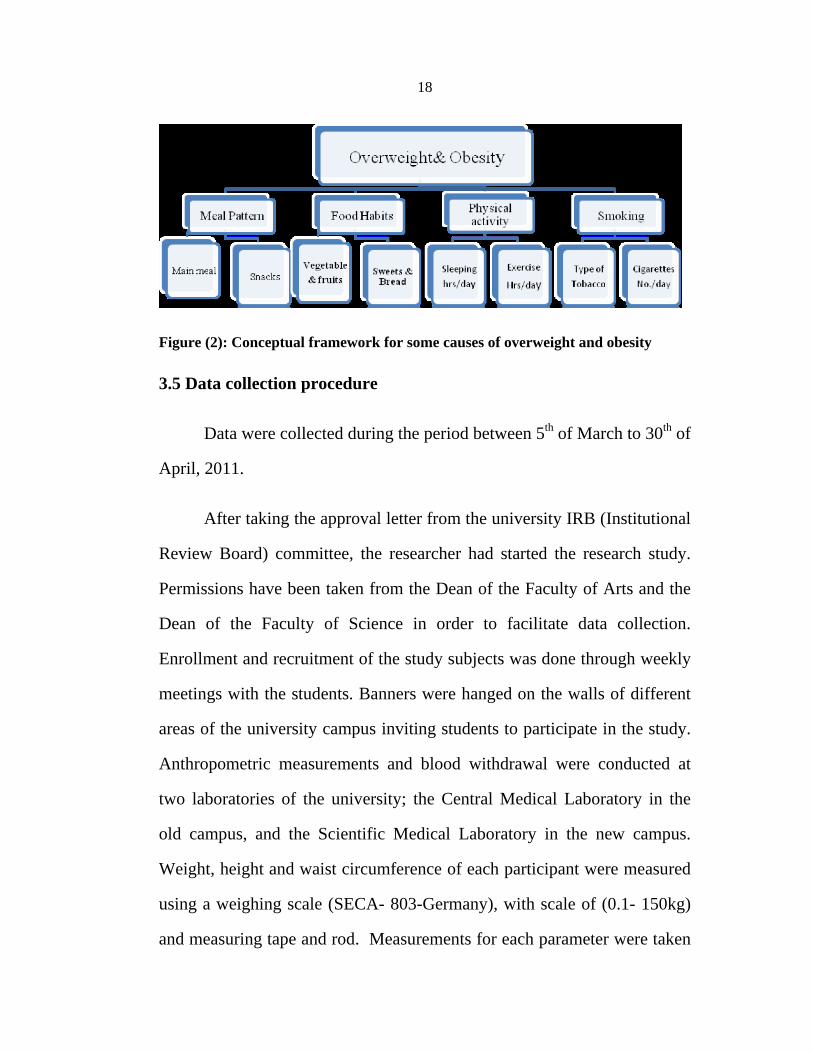
In this study, the factors assumed to be associated with obesity were
dietary habits, smoking, physical activity, and socio- demographic factors
(Figure 1).

17
Figure (1): Variables influencing Overweight & Obesity
Socio-demographic variables:
Gender: (Male, Female)
Age: (18--20 years, 21--23years, 24-31 years)
Social status: (Single, Married, engaged, others)
Residency: (City, Village, Camp, student's residence).
Family monthly income: (1000-3000 NIS, 3200-7000 NIS, 8000-
12000 NIS).
Studying year level (1st yr, 2nd yr, 3rd yr, 4rth yr)
Faculty: (Faculty of Science and Faculty of Arts)
Independent variables: Food habits, physical activity, meal pattern and
smoking.
Dependent variables: Overweight, obesity and anemia.
18
Figure (2): Conceptual framework for some causes of overweight and obesity
3.5 Data collection procedure
Data were collected during the period between 5th of March to 30th of
April, 2011.
After taking the approval letter from the university IRB (Institutional
Review Board) committee, the researcher had started the research study.
Permissions have been taken from the Dean of the Faculty of Arts and the
Dean of the Faculty of Science in order to facilitate data collection.
Enrollment and recruitment of the study subjects was done through weekly
meetings with the students. Banners were hanged on the walls of different
areas of the university campus inviting students to participate in the study.
Anthropometric measurements and blood withdrawal were conducted at
two laboratories of the university; the Central Medical Laboratory in the
old campus, and the Scientific Medical Laboratory in the new campus.
Weight, height and waist circumference of each participant were measured
using a weighing scale (SECA- 803-Germany), with scale of (0.1- 150kg)
and measuring tape and rod. Measurements for each parameter were taken
19
in three occasions at the same time, the closest two measurements were
averaged and recorded in the individual’s questionnaire while the third
measurement was excluded. The weighing scale was calibrated at the
beginning of every session of measurement. Participants were weighed in
their light clothing without shoes (after the removal of their coats,
handbags, mobile phones and other personal accessories). Weight was
measured to the nearest 100g. Height and waist circumferences were
measured to the nearest 0.5 cm. With the footwear removed, standing
straight and looking forward, the participant’s height was recorded at the
point when the arm of the measuring rod rested on the head. The BMI was
calculated as the weight in kilograms divided by the height in square
meters (kg/m2). BMI was based on the World Health Organization (WHO)
BMI cut-offs; (BMI < 18.5 kg/m2 is classified as underweight, 18.5– 24.9
kg/m2 is classified as normal weight, 25.0–29.9 kg/m2 is classified as pre-
obese (overweight), and > 30 is classified as obese. In addition,
hemoglobin level in blood was tested by auto-analysis device (CBC
method) for each participant by a well qualified laboratory technician to
assess the prevalence of anemia. The result considered normal when
hemoglobin level for males ranged between 13.8 to 17.2 gm/dL and for
females between 12.1 to 15.1 gm/dL [53].
3.6 Data Analysis
Statistical analysis was performed using the Statistical Package for
Social Sciences (SPSS) version 15. Quantitative variables (continuous)
20
were analyzed using students't-test, while chi-square and Fisher's exact
tests were conducted for qualitative variables (categorical). All reported P-
values were made and compared to a significance level of 5%; differences
were considered statistically significant at P < 0.05.
3.7 Ethical considerations
Approval letter from the university IRB committee was taken before
starting this study. All participants in this study were asked to sign a
consent form. In addition, students were given a note that the participants
can withdraw from the study without giving reasons. All data were
recorded and stored in a locked cabinet. Questionnaires were anonymous
(no name was written) and only identified by codes. Permissions to collect
data from the target faculties have been taken from each faculty Dean.

21
Chapter 4
Results
22
Chapter 4
Results
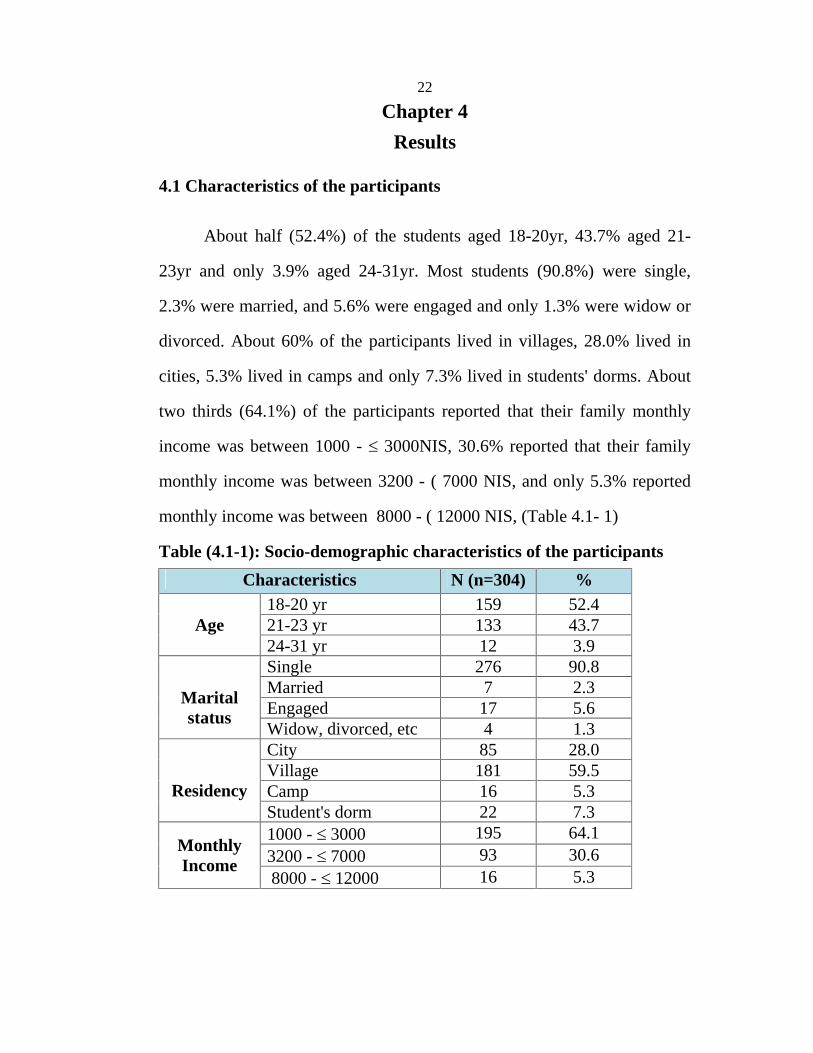
4.1 Characteristics of the participants
About half (52.4%) of the students aged 18-20yr, 43.7% aged 21-
23yr and only 3.9% aged 24-31yr. Most students (90.8%) were single,
2.3% were married, and 5.6% were engaged and only 1.3% were widow or
divorced. About 60% of the participants lived in villages, 28.0% lived in
cities, 5.3% lived in camps and only 7.3% lived in students' dorms. About
two thirds (64.1%) of the participants reported that their family monthly
income was between 1000 -
3000NIS, 30.6% reported that their family
monthly income was between 3200 - ( 7000 NIS, and only 5.3% reported
monthly income was between 8000 - ( 12000 NIS, (Table 4.1- 1)
Table (4.1-1): Socio-demographic characteristics of the participants
Characteristics N (n=304) % 18-20 yr 159 52.4 21-23 yr 133 43.7 Age 24-31 yr 12 3.9 Single 276 90.8 Married 7 2.3 Engaged 17 5.6
Marital status
Widow, divorced, etc 4 1.3 City 85 28.0 Village 181 59.5 Camp 16 5.3
Residency Student's dorm 22 7.3 1000 - 3000 195 64.1 3200 - 7000 93 30.6 Monthly
Income 8000 - 12000 16 5.3

23
4.2 Anthropometric measurements of the participants
Table 4.2-1 shows the mean and standard deviation of the
anthropometric measurements of the participants by gender. The mean
weight for male students was 73.1kg compared to 59.9 kg for females. The
mean height was 176.2cm for male students and 162.4cm for females.
However, the BMI mean was 23.5 (kg/m2) for male students and 21.5
(kg/m2) for females.
The mean of waist circumference for male students was 81.4cm and
74.6 cm for females. Findings showed significant differences (p<0.01)
between males and females in the means of all variables (Table 4.2-1).
Table (4.2-1): Mean and standard deviation of the anthropometric measurements of the participants by gender
Mean SD
Variable Male Female *P- Value
Weight in kg 73.1 13.1 59.9 8.7 0.001 Height in cm 176.2 6.7 162.4 5.6 0.001 BMI in kg/m2 23.5 0.7 21.5 0.5 0.009 WC in cm 81.4 9.3 74.6 8.1 0.001
*T-Test
4.3 Percentages of physical activity and smoking among university
students
About two thirds (62.5%) of the participants were practicing
different kinds of sports while 37.5 % of them were not. Furthermore,
71.4% of the participants never smoked; in contrast 28.6% of them were
active smokers. There were significant differences between males and
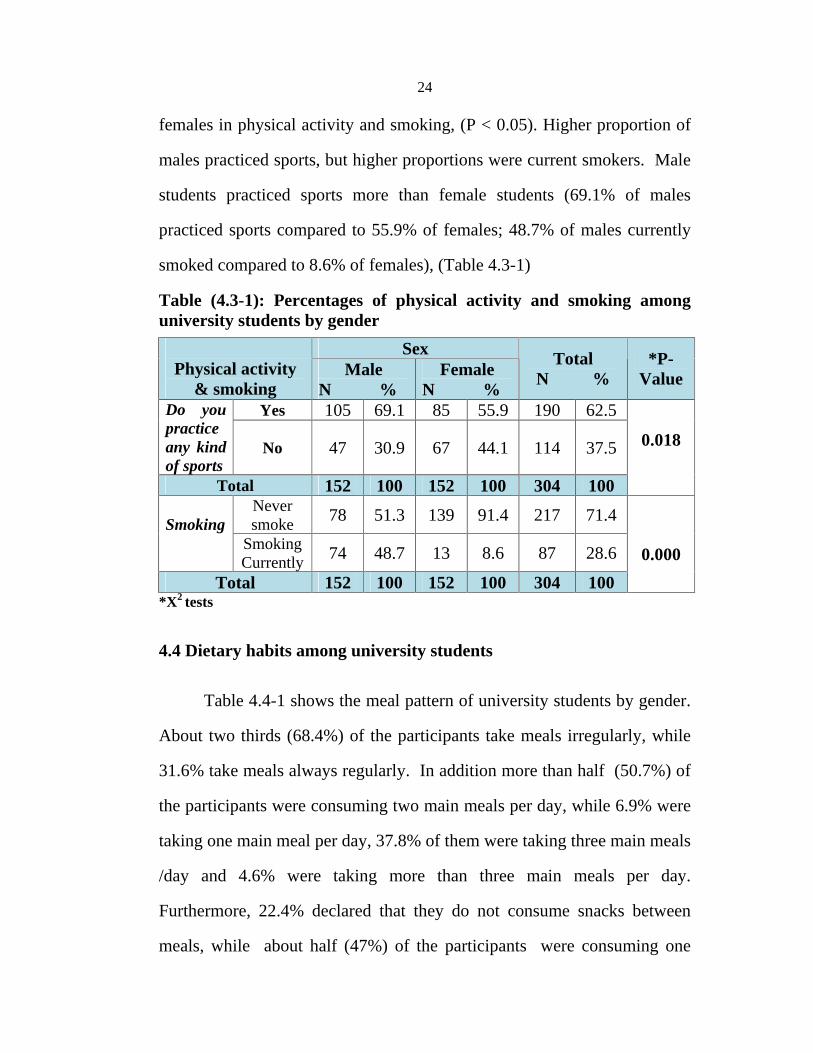
24
females in physical activity and smoking, (P < 0.05). Higher proportion of
males practiced sports, but higher proportions were current smokers. Male
students practiced sports more than female students (69.1% of males
practiced sports compared to 55.9% of females; 48.7% of males currently
smoked compared to 8.6% of females), (Table 4.3-1)
Table (4.3-1): Percentages of physical activity and smoking among university students by gender
*X2 tests
4.4 Dietary habits among university students
Table 4.4-1 shows the meal pattern of university students by gender.
About two thirds (68.4%) of the participants take meals irregularly, while
31.6% take meals always regularly. In addition more than half (50.7%) of
the participants were consuming two main meals per day, while 6.9% were
taking one main meal per day, 37.8% of them were taking three main meals
/day and 4.6% were taking more than three main meals per day.
Furthermore, 22.4% declared that they do not consume snacks between
meals, while about half (47%) of the participants were consuming one
Sex
Physical activity & smoking
Male N %
Female N %
Total N %
*P-Value
Yes 105 69.1 85 55.9 190 62.5 Do you practice any kind of sports
No 47 30.9 67 44.1 114 37.5
Total 152 100 152 100 304 100
0.018
Never smoke 78 51.3 139 91.4 217 71.4
Smoking
Smoking Currently
74 48.7 13 8.6 87 28.6
Total 152 100 152 100 304 100
0.000
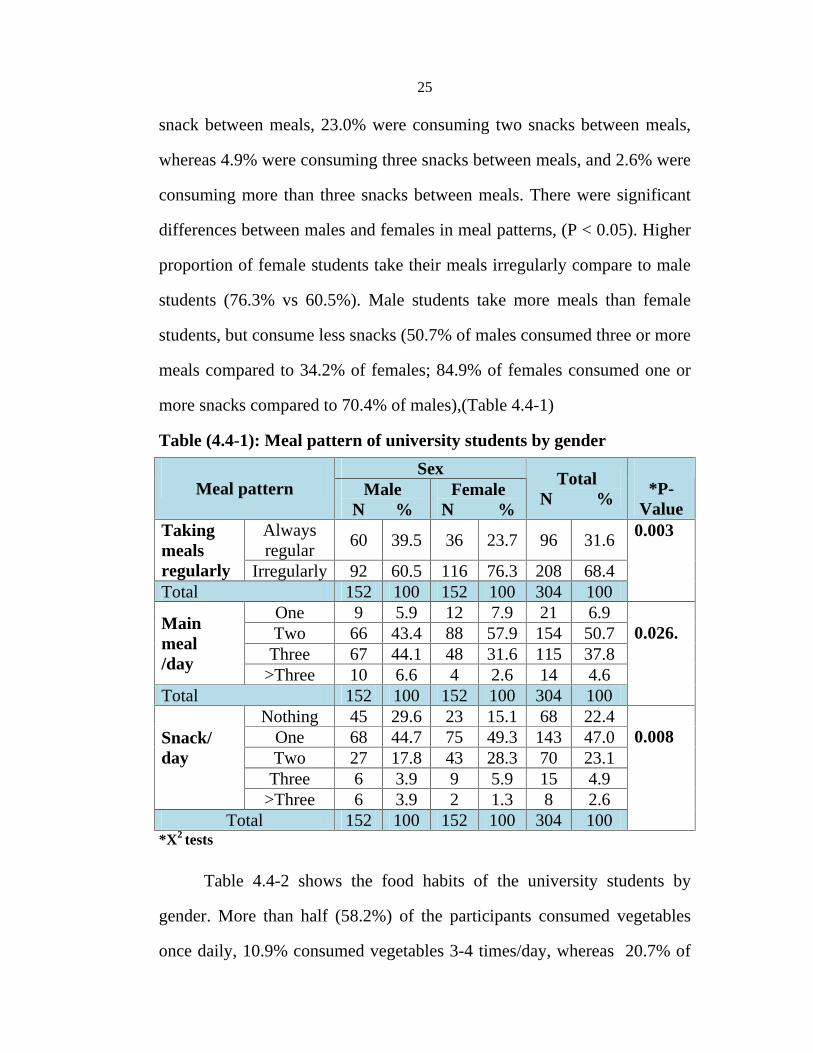
25
snack between meals, 23.0% were consuming two snacks between meals,
whereas 4.9% were consuming three snacks between meals, and 2.6% were
consuming more than three snacks between meals. There were significant
differences between males and females in meal patterns, (P < 0.05). Higher
proportion of female students take their meals irregularly compare to male
students (76.3% vs 60.5%). Male students take more meals than female
students, but consume less snacks (50.7% of males consumed three or more
meals compared to 34.2% of females; 84.9% of females consumed one or
more snacks compared to 70.4% of males),(Table 4.4-1)
Table (4.4-1): Meal pattern of university students by gender
Sex
Meal pattern Male N %
Female N %
Total N %
*P-Value
Always regular
60 39.5
36 23.7
96 31.6 Taking meals regularly Irregularly
92 60.5
116 76.3
208 68.4 Total 152 100 152 100 304 100
0.003
One 9 5.9 12 7.9 21 6.9 Two 66 43.4
88 57.9
154 50.7 Three 67 44.1
48 31.6
115 37.8
Main meal /day
>Three 10 6.6 4 2.6 14 4.6 Total 152 100 152 100 304 100
0.026.
Nothing 45 29.6
23 15.1
68 22.4 One 68 44.7
75 49.3
143 47.0 Two 27 17.8
43 28.3
70 23.1 Three 6 3.9 9 5.9 15 4.9
Snack/ day
>Three 6 3.9 2 1.3 8 2.6 Total 152 100 152 100 304 100
0.008
*X2 tests
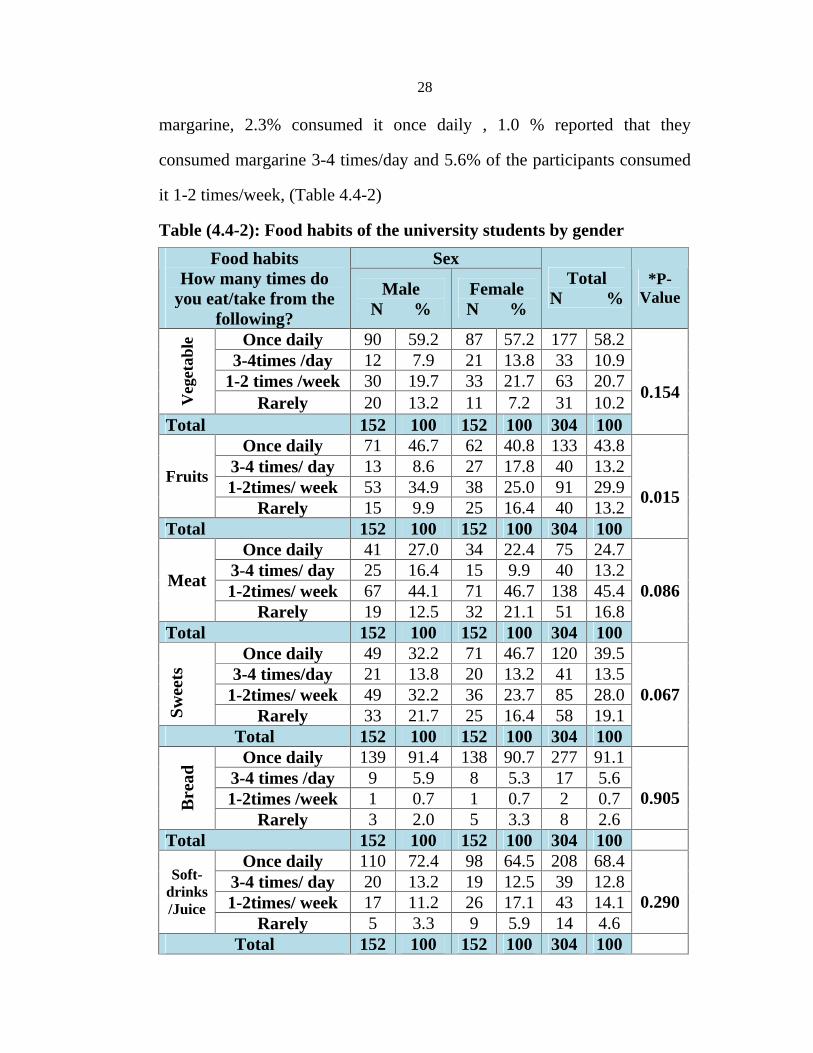
Table 4.4-2 shows the food habits of the university students by
gender. More than half (58.2%) of the participants consumed vegetables
once daily, 10.9% consumed vegetables 3-4 times/day, whereas 20.7% of
26
the participants consumed vegetables 1-2 times/week, and 10.2% rarely
consumed vegetables. About 13.2% of the participants consumed fruits 3-4
times/day, while 43.8% consumed fruits once daily, 29.9% consumed fruits
1-2 times/week and 13.2% rarely consumed fruits. However there was
significant difference between males and females in fruit consumption (P
<0.05). Female students consumed more fruits than male students (58.6%
of females consumed fruits once or 3-4 times/day compared to 55.3% of
males).
About one fifth (16.8%) of the participants rarely consumed meats,
less than half (45.4%) consumed meats one or two times/week, while
24.7% consumed meats once daily, and 13.2% of the participants
consumed meats 3-4 times/day.
More than one third (39.5%) of the participants consumed sweets
once daily, 13.5% consumed sweets 3-4 times/day, 28.0% consumed
sweets 1-2 times/week, and 19.1% of the participants rarely consumed
sweets.
About 5.6% of the participants consumed bread 3-4 times/day, while
most of the participants (91.1%) consumed bread once daily (the highest
consumption among the food habits variables), whereas 0.7% consumed
bread 1-2 times/week and 2.6% of the participants rarely consumed bread.
About two thirds (68.4%) of the participants take soft- drinks/Juice once
daily, while 12.8% take soft- drinks/Juice 3-4 times/day, 14.1% of the
27
participants take soft- drinks/Juice 1-2 times/week and 4.6% of them rarely
take soft- drinks/Juice.
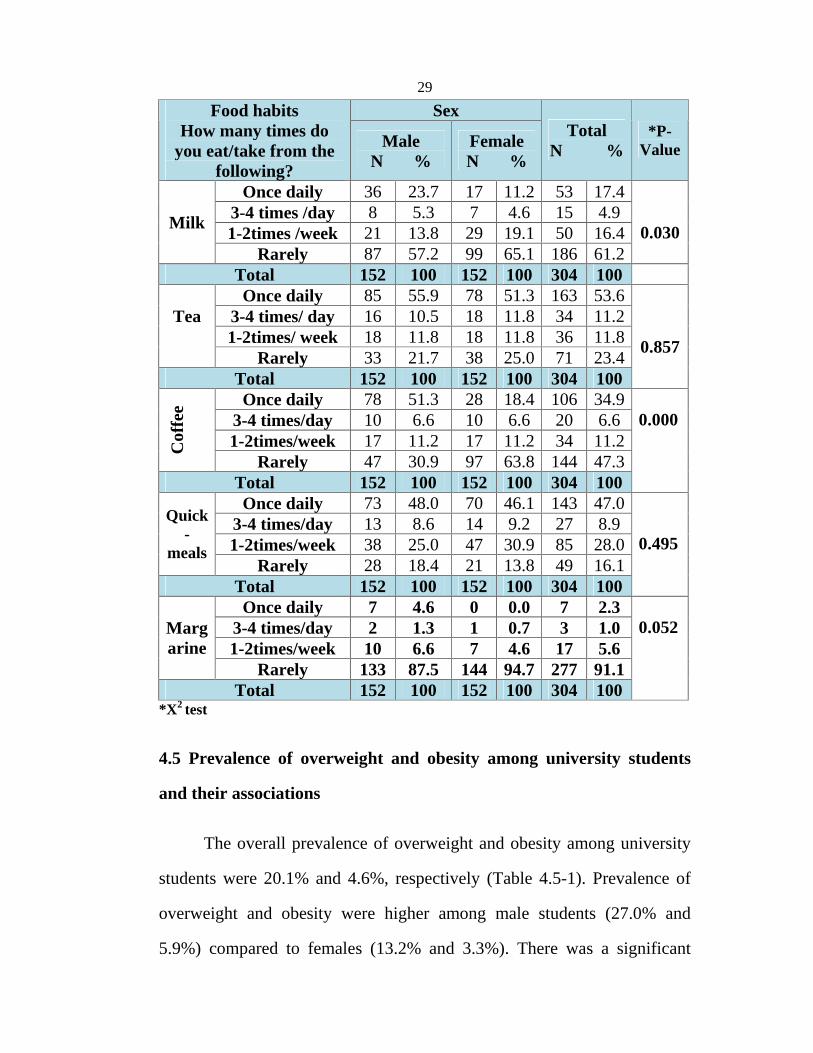
About 61% of the participants consumed milk rarely, while 17.4% of
them consumed milk once daily, only 4.9% consumed milk 3-4 times/day
and 16.4% of them consumed milk 1-2 times/week. However there was
significant difference between males and females in consuming milk in
favor of males, (p <0.05). Male students consumed more milk than female
students (25% of males consumed milk once or 3-4 times/day compared to
15.8% of females).
More than half (53.6%) of the participants consumed tea as once
daily, while,11.2% consumed tea 3-4 times/day, whereas 11.8% of the
participants consumed tea1-2 times/week, and 23.4% of them rarely
consumed tea. 6.6% of the participants were consuming coffee 3-4
times/day, 47.4% of them rarely consumed coffee,34.9% consumed coffee
once daily and 11.2% consumed coffee 1-2 times/week. However there was
a significant differences between males and females in consuming coffee in
favor of males, (P <0.05).
Male students consumed more coffee than female students (57.9% of
males consumed coffee once or 3-4 times/day compared to 25% of
females). 8.9% of the participants consumed quick- meals 3-4 times /day,
47.0% of them consumed quick- meals once daily, whereas 28.0%
consumed quick- meals 1-2 times/week and 16.1% rarely consumed quick-
meals. Most of the participants (91.1%) reported that they rarely consume
28
margarine, 2.3% consumed it once daily , 1.0 % reported that they
consumed margarine 3-4 times/day and 5.6% of the participants consumed
it 1-2 times/week, (Table 4.4-2)
Table (4.4-2): Food habits of the university students by gender
Sex Food habits How many times do
you eat/take from the following?
Male N %
Female N %
Total N %
*P-Value
Once daily 90 59.2 87 57.2
177 58.2
3-4times /day 12 7.9 21 13.8
33 10.9
1-2 times /week 30 19.7 33 21.7
63 20.7
V
eget
able
Rarely 20 13.2 11 7.2 31 10.2
Total 152 100 152 100 304 100
0.154
Once daily 71 46.7 62 40.8
133 43.8
3-4 times/ day 13 8.6 27 17.8
40 13.2
1-2times/ week 53 34.9 38 25.0
91 29.9
Fruits
Rarely 15 9.9 25 16.4
40 13.2
Total 152 100 152 100 304 100
0.015
Once daily 41 27.0 34 22.4
75 24.7
3-4 times/ day 25 16.4 15 9.9 40 13.2
1-2times/ week 67 44.1 71 46.7
138 45.4
Meat
Rarely 19 12.5 32 21.1
51 16.8
Total 152 100 152 100 304 100
0.086
Once daily 49 32.2 71 46.7
120 39.5
3-4 times/day 21 13.8 20 13.2
41 13.5
1-2times/ week 49 32.2 36 23.7
85 28.0
Sw
eets
Rarely 33 21.7 25 16.4
58 19.1
Total 152 100 152 100 304 100
0.067
Once daily 139 91.4 138 90.7
277 91.1
3-4 times /day 9 5.9 8 5.3 17 5.6 1-2times /week 1 0.7 1 0.7 2 0.7 B
read
Rarely 3 2.0 5 3.3 8 2.6 0.905
Total 152 100 152 100 304 100 Once daily 110 72.4 98 64.5
208 68.4
3-4 times/ day 20 13.2 19 12.5
39 12.8
1-2times/ week 17 11.2 26 17.1
43 14.1
Soft- drinks/Juice
Rarely 5 3.3 9 5.9 14 4.6 0.290
Total 152 100 152 100 304 100
29
Sex Food habits How many times do
you eat/take from the following?
Male N %
Female N %
Total N %
*P-
Value
Once daily 36 23.7 17 11.2
53 17.4
3-4 times /day 8 5.3 7 4.6 15 4.9 1-2times /week 21 13.8 29 19.1
50 16.4
Milk
Rarely 87 57.2 99 65.1
186 61.2
0.030
Total 152 100 152 100 304 100 Once daily 85 55.9 78 51.3
163 53.6
3-4 times/ day 16 10.5 18 11.8
34 11.2
1-2times/ week 18 11.8 18 11.8
36 11.8
Tea
Rarely 33 21.7 38 25.0
71 23.4
Total 152 100 152 100 304 100
0.857
Once daily 78 51.3 28 18.4
106 34.9
3-4 times/day 10 6.6 10 6.6 20 6.6 1-2times/week 17 11.2 17 11.2
34 11.2
C
offe
e
Rarely 47 30.9 97 63.8
144 47.3
Total 152 100 152 100 304 100
0.000
Once daily 73 48.0 70 46.1
143 47.0
3-4 times/day 13 8.6 14 9.2 27 8.9 1-2times/week 38 25.0 47 30.9
85 28.0
Quick-
meals
Rarely 28 18.4 21 13.8
49 16.1
Total 152 100 152 100 304 100
0.495
Once daily 7 4.6 0 0.0 7 2.3 3-4 times/day 2 1.3 1 0.7 3 1.0 1-2times/week 10 6.6 7 4.6 17 5.6
Margarine
Rarely 133 87.5 144 94.7
277 91.1
Total 152 100 152 100 304 100
0.052
*X2 test
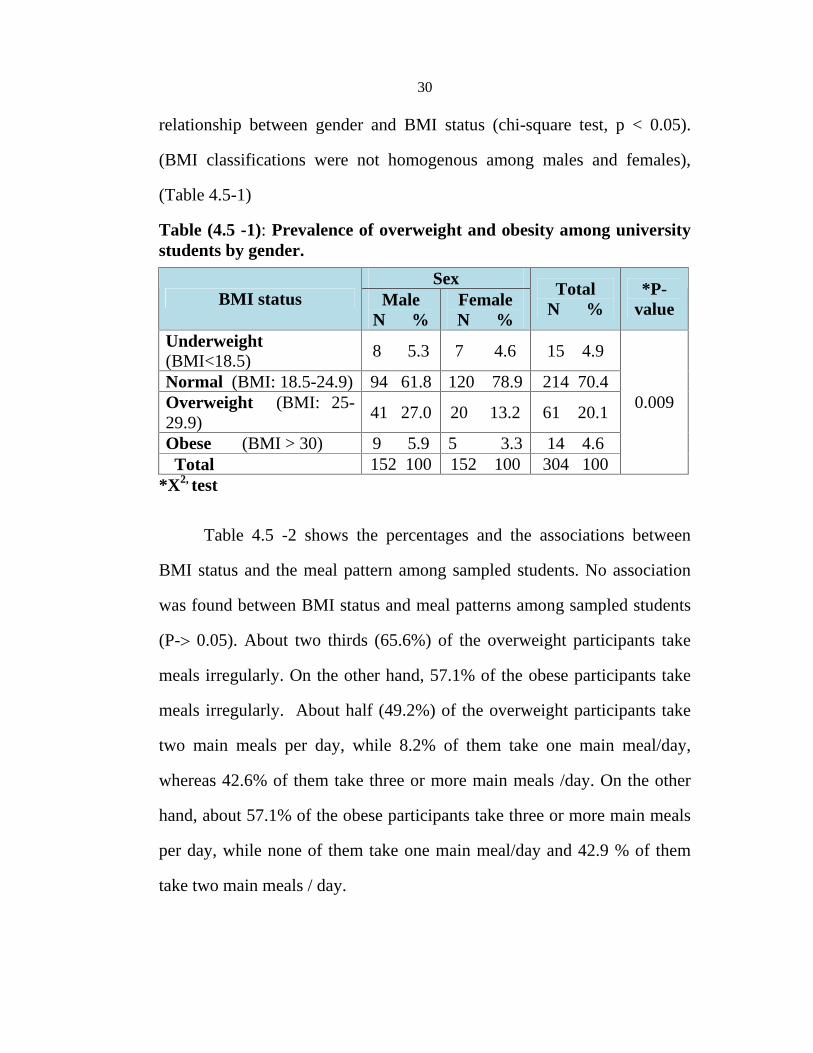
4.5 Prevalence of overweight and obesity among university students
and their associations
The overall prevalence of overweight and obesity among university
students were 20.1% and 4.6%, respectively (Table 4.5-1). Prevalence of
overweight and obesity were higher among male students (27.0% and
5.9%) compared to females (13.2% and 3.3%). There was a significant
30
relationship between gender and BMI status (chi-square test, p < 0.05).
(BMI classifications were not homogenous among males and females),
(Table 4.5-1)
Table (4.5 -1): Prevalence of overweight and obesity among university students by gender.
Sex BMI status Male
N % Female N %
Total N %
*P-value
Underweight (BMI<18.5) 8 5.3 7 4.6 15 4.9
Normal (BMI: 18.5-24.9) 94 61.8
120 78.9
214 70.4 Overweight (BMI: 25-29.9)
41 27.0
20 13.2 61 20.1
Obese (BMI > 30) 9 5.9 5 3.3
14 4.6 Total 152 100
152 100 304 100
0.009
*X2, test
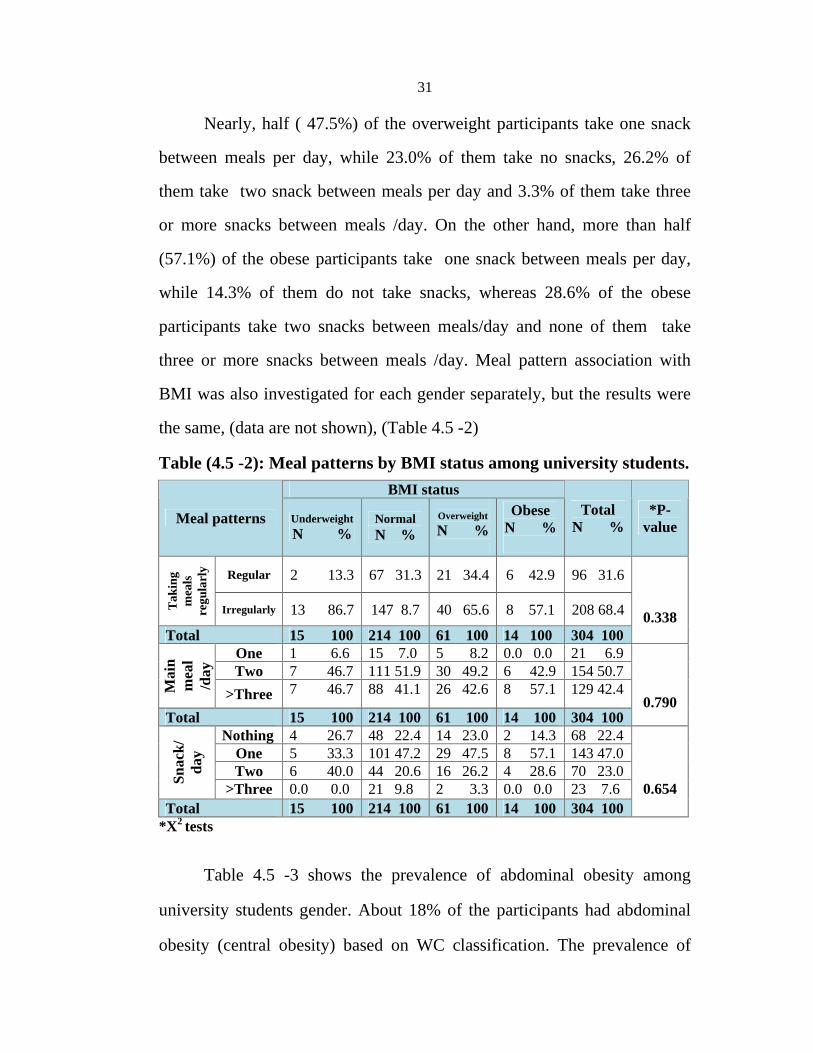
Table 4.5 -2 shows the percentages and the associations between
BMI status and the meal pattern among sampled students. No association
was found between BMI status and meal patterns among sampled students
(P-
0.05). About two thirds (65.6%) of the overweight participants take
meals irregularly. On the other hand, 57.1% of the obese participants take
meals irregularly. About half (49.2%) of the overweight participants take
two main meals per day, while 8.2% of them take one main meal/day,
whereas 42.6% of them take three or more main meals /day. On the other
hand, about 57.1% of the obese participants take three or more main meals
per day, while none of them take one main meal/day and 42.9 % of them
take two main meals / day.
31
Nearly, half ( 47.5%) of the overweight participants take one snack
between meals per day, while 23.0% of them take no snacks, 26.2% of
them take two snack between meals per day and 3.3% of them take three
or more snacks between meals /day. On the other hand, more than half
(57.1%) of the obese participants take one snack between meals per day,
while 14.3% of them do not take snacks, whereas 28.6% of the obese
participants take two snacks between meals/day and none of them take
three or more snacks between meals /day. Meal pattern association with
BMI was also investigated for each gender separately, but the results were
the same, (data are not shown), (Table 4.5 -2)
Table (4.5 -2): Meal patterns by BMI status among university students.
BMI status
Meal patterns Underweight
N % Normal N %
Overweight
N %
Obese N %
Total N %
*P-value
Regular 2 13.3
67 31.3
21 34.4
6 42.9 96 31.6
T
akin
g m
eals
re
gula
rly
Irregularly 13 86.7
147 8.7 40 65.6
8 57.1 208 68.4
Total 15 100 214 100 61 100 14 100 304 100 0.338
One 1 6.6 15 7.0 5 8.2 0.0 0.0 21 6.9 Two 7 46.7 111 51.9 30 49.2 6 42.9 154 50.7
Mai
n m
eal
/day
>Three 7 46.7 88 41.1 26 42.6 8 57.1 129 42.4
Total 15 100 214 100 61 100 14 100 304 100 0.790
Nothing 4 26.7 48 22.4 14 23.0 2 14.3 68 22.4 One 5 33.3 101 47.2 29 47.5 8 57.1 143 47.0 Two 6 40.0 44 20.6 16 26.2 4 28.6 70 23.0 Sn
ack/
da
y
>Three
0.0 0.0 21 9.8 2 3.3 0.0 0.0 23 7.6 Total 15 100 214 100 61 100 14 100 304 100
0.654
*X2 tests
Table 4.5 -3 shows the prevalence of abdominal obesity among
university students gender. About 18% of the participants had abdominal
obesity (central obesity) based on WC classification. The prevalence of
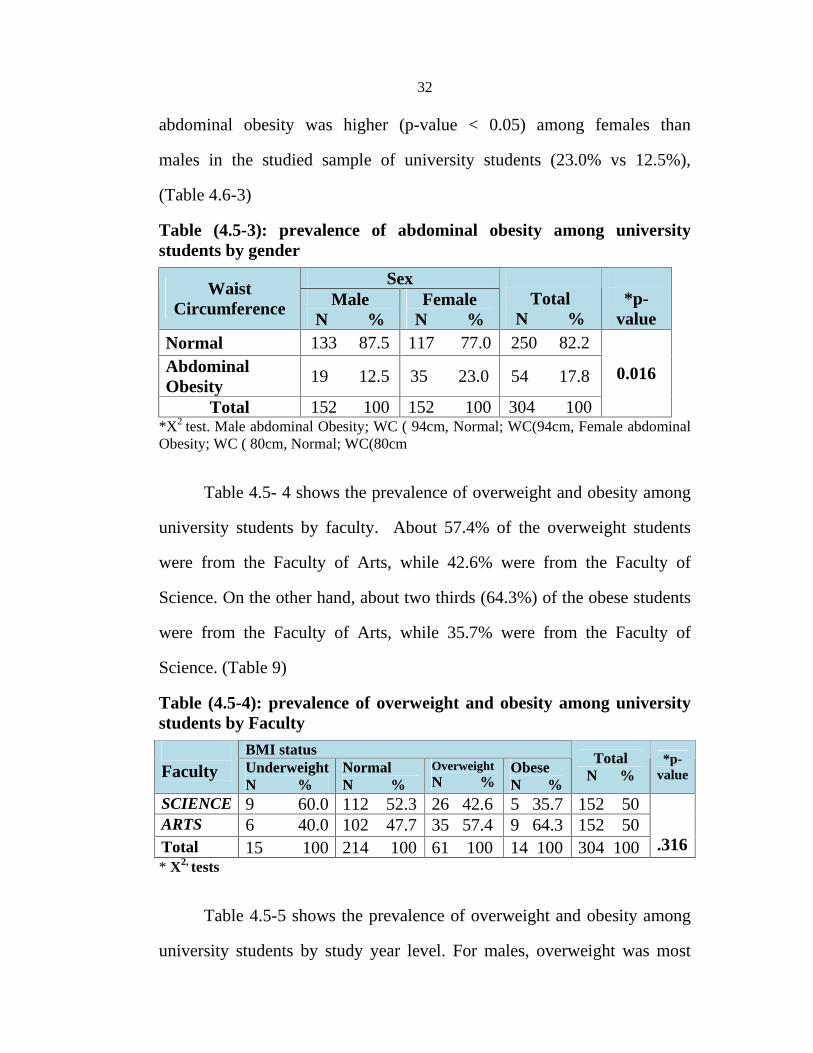
32
abdominal obesity was higher (p-value < 0.05) among females than
males in the studied sample of university students (23.0% vs 12.5%),
(Table 4.6-3)
Table (4.5-3): prevalence of abdominal obesity among university students by gender
Sex Waist Circumference Male
N % Female
N %
Total N %
*p-value
Normal 133 87.5 117 77.0
250 82.2 Abdominal Obesity
19 12.5 35 23.0 54 17.8
Total 152 100 152 100
304 100
0.016
*X2 test. Male abdominal Obesity; WC ( 94cm, Normal; WC(94cm, Female abdominal Obesity; WC ( 80cm, Normal; WC(80cm
Table 4.5- 4 shows the prevalence of overweight and obesity among
university students by faculty. About 57.4% of the overweight students
were from the Faculty of Arts, while 42.6% were from the Faculty of
Science. On the other hand, about two thirds (64.3%) of the obese students
were from the Faculty of Arts, while 35.7% were from the Faculty of
Science. (Table 9)
Table (4.5-4): prevalence of overweight and obesity among university students by Faculty
BMI status
Faculty Underweight
N % Normal N %
Overweight N %
Obese N %
Total N %
*p-value
SCIENCE
9 60.0
112 52.3
26 42.6 5 35.7
152 50 ARTS 6 40.0
102 47.7
35 57.4 9 64.3
152 50 Total 15 100
214 100
61 100 14 100
304 100 .316
* X2, tests
Table 4.5-5 shows the prevalence of overweight and obesity among
university students by study year level. For males, overweight was most
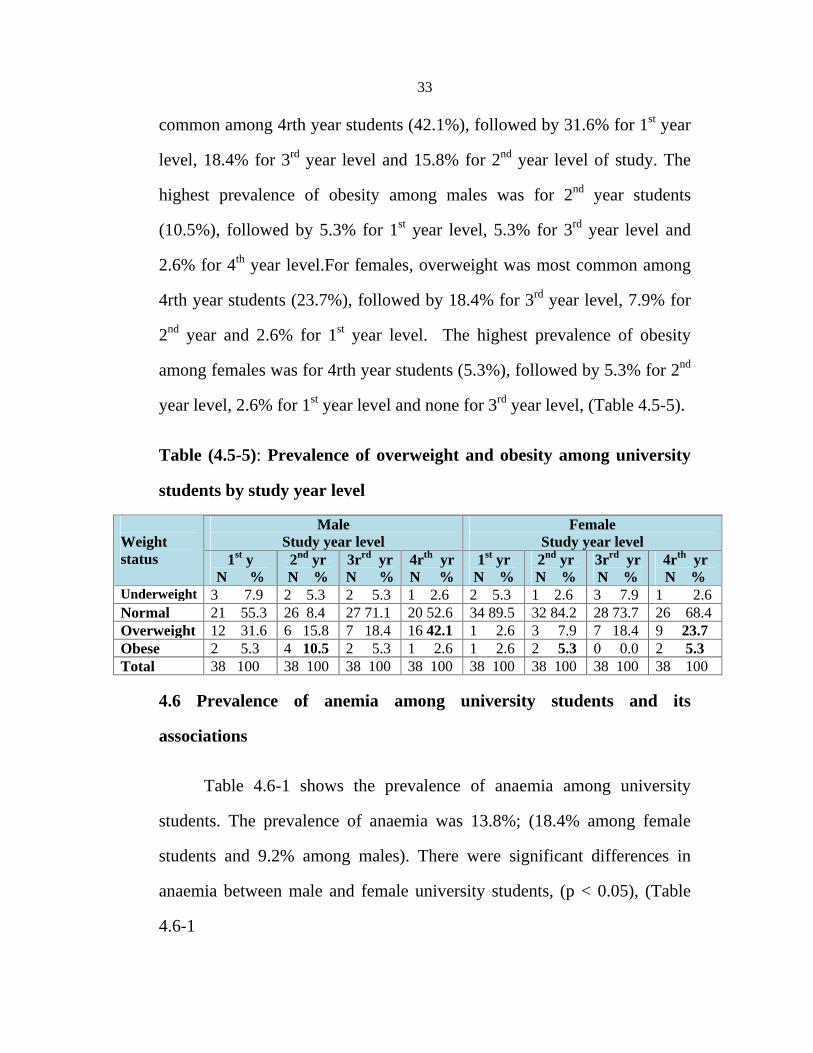
33
common among 4rth year students (42.1%), followed by 31.6% for 1st year
level, 18.4% for 3rd year level and 15.8% for 2nd year level of study. The
highest prevalence of obesity among males was for 2nd year students
(10.5%), followed by 5.3% for 1st year level, 5.3% for 3rd year level and
2.6% for 4th year level.For females, overweight was most common among
4rth year students (23.7%), followed by 18.4% for 3rd year level, 7.9% for
2nd year and 2.6% for 1st year level. The highest prevalence of obesity
among females was for 4rth year students (5.3%), followed by 5.3% for 2nd
year level, 2.6% for 1st year level and none for 3rd year level, (Table 4.5-5).
Table (4.5-5): Prevalence of overweight and obesity among university
students by study year level
Male Study year level
Female Study year level
Weight status 1st y
N % 2nd yr N %
3rrd yr
N %
4rth yr N %
1st yr N %
2nd yr N %
3rrd yr
N % 4rth yr N %
Underweight 3 7.9 2 5.3 2 5.3 1 2.6 2 5.3 1 2.6 3 7.9 1 2.6 Normal 21 55.3 26 8.4 27 71.1 20 52.6 34 89.5 32 84.2 28 73.7 26 68.4 Overweight 12 31.6 6 15.8 7 18.4 16 42.1 1 2.6 3 7.9 7 18.4 9 23.7 Obese 2 5.3 4 10.5 2 5.3 1 2.6 1 2.6 2 5.3 0 0.0 2 5.3 Total 38 100 38 100 38 100 38 100 38 100 38 100 38 100 38 100
4.6 Prevalence of anemia among university students and its
associations
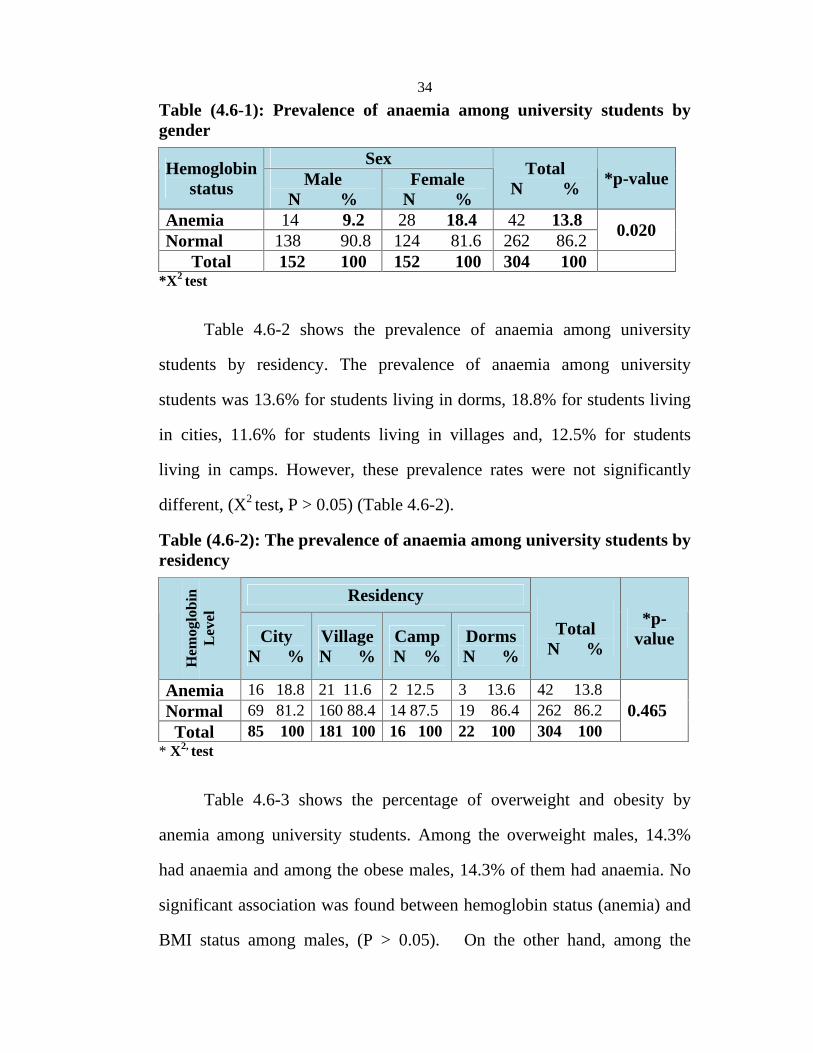
Table 4.6-1 shows the prevalence of anaemia among university
students. The prevalence of anaemia was 13.8%; (18.4% among female
students and 9.2% among males). There were significant differences in
anaemia between male and female university students, (p < 0.05), (Table
4.6-1
34
Table (4.6-1): Prevalence of anaemia among university students by gender
Sex Hemoglobin status Male
N % Female
N %
Total N % *p-value
Anemia
14 9.2 28 18.4 42 13.8
Normal 138 90.8 124 81.6 262 86.2 0.020
Total 152 100 152 100 304 100 *X2 test
Table 4.6-2 shows the prevalence of anaemia among university
students by residency. The prevalence of anaemia among university
students was 13.6% for students living in dorms, 18.8% for students living
in cities, 11.6% for students living in villages and, 12.5% for students
living in camps. However, these prevalence rates were not significantly
different, (X2 test, P > 0.05) (Table 4.6-2).
Table (4.6-2): The prevalence of anaemia among university students by residency
Residency
Hem
oglo
bin
L
evel
City N %
Village
N %
Camp N %
Dorms N %
Total N %
*p-value
Anemia 16 18.8
21 11.6 2 12.5 3 13.6 42 13.8 Normal 69 81.2
160 88.4
14 87.5 19 86.4 262 86.2 Total 85 100
181 100
16 100 22 100 304 100 0.465
* X2, test
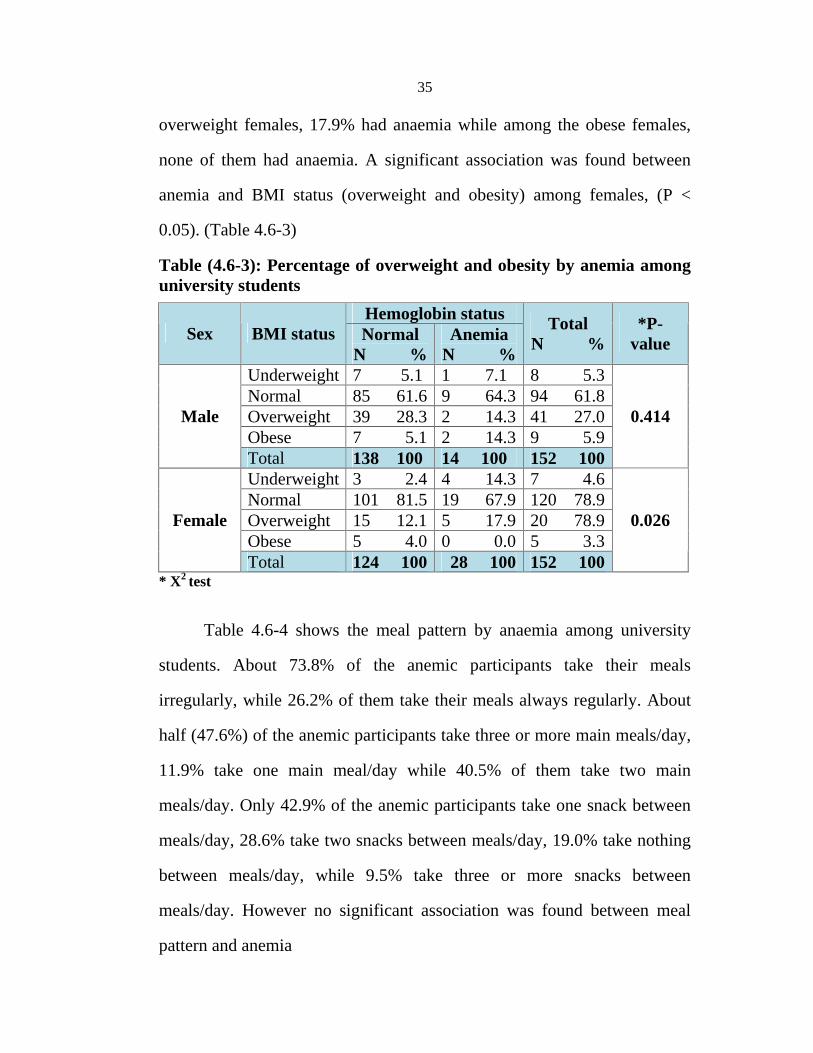
Table 4.6-3 shows the percentage of overweight and obesity by
anemia among university students. Among the overweight males, 14.3%
had anaemia and among the obese males, 14.3% of them had anaemia. No
significant association was found between hemoglobin status (anemia) and
BMI status among males, (P > 0.05). On the other hand, among the
35
overweight females, 17.9% had anaemia while among the obese females,
none of them had anaemia. A significant association was found between
anemia and BMI status (overweight and obesity) among females, (P <
0.05). (Table 4.6-3)
Table (4.6-3): Percentage of overweight and obesity by anemia among university students
Hemoglobin status Sex BMI status Normal
N %
Anemia N %
Total N %
*P-value
Underweight
7 5.1 1 7.1 8 5.3
Normal 85 61.6
9 64.3
94 61.8
Overweight 39 28.3
2 14.3
41 27.0
Obese 7 5.1
2 14.3
9 5.9
Male
Total 138 100 14 100 152 100
0.414
Underweight
3 2.4
4 14.3
7 4.6
Normal 101 81.5
19 67.9
120 78.9
Overweight 15 12.1
5 17.9
20 78.9
Obese 5 4.0
0 0.0
5 3.3
Female
Total 124 100
28 100
152 100
0.026
* X2 test
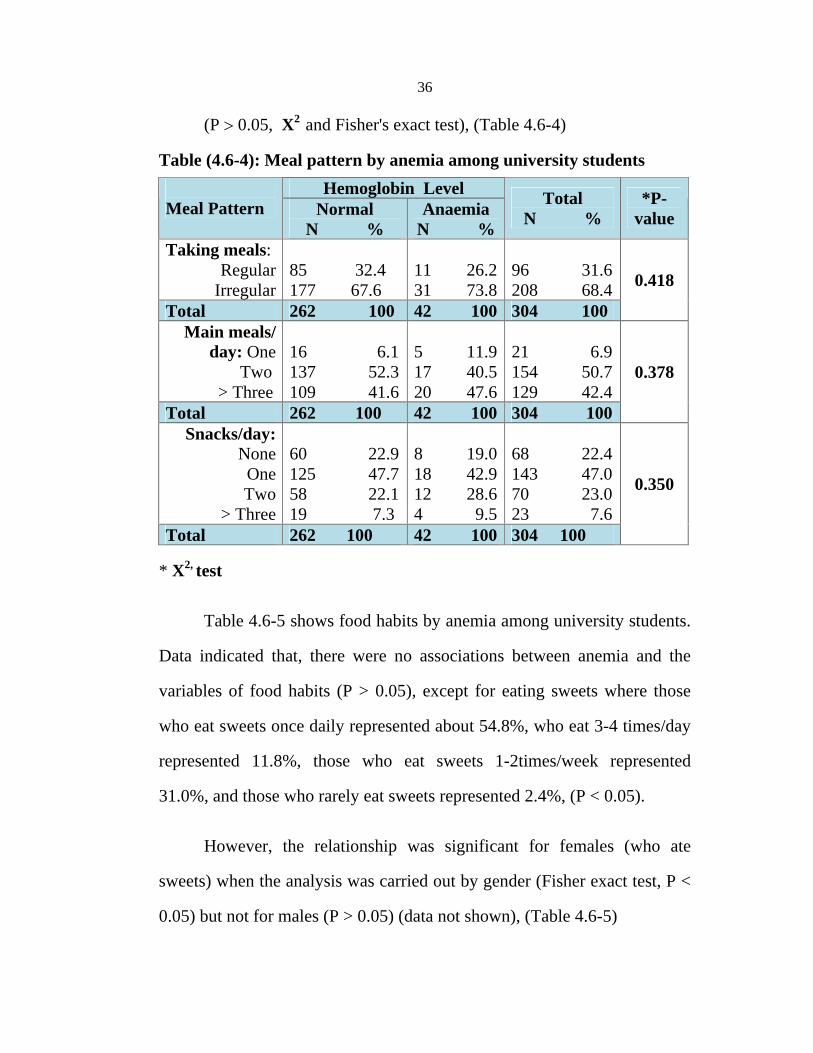
Table 4.6-4 shows the meal pattern by anaemia among university
students. About 73.8% of the anemic participants take their meals
irregularly, while 26.2% of them take their meals always regularly. About
half (47.6%) of the anemic participants take three or more main meals/day,
11.9% take one main meal/day while 40.5% of them take two main
meals/day. Only 42.9% of the anemic participants take one snack between
meals/day, 28.6% take two snacks between meals/day, 19.0% take nothing
between meals/day, while 9.5% take three or more snacks between
meals/day. However no significant association was found between meal
pattern and anemia
36
(P 0.05, X2 and Fisher's exact test), (Table 4.6-4)
Table (4.6-4): Meal pattern by anemia among university students
Hemoglobin Level
Meal Pattern Normal
N % Anaemia
N %
Total N %
*P-value
Taking meals:
Regular Irregular
85 32.4 177 67.6
11 26.2
31 73.8
96 31.6 208 68.4
Total 262 100 42 100
304 100
0.418
Main meals/ day: One
Two > Three
16 6.1 137 52.3 109 41.6
5 11.9
17 40.5
20 47.6
21 6.9 154 50.7 129 42.4
Total 262 100 42 100
304 100
0.378
Snacks/day: None
One
Two
> Three
60 22.9 125 47.7 58 22.1 19 7.3
8 19.0
18 42.9
12 28.6
4 9.5
68 22.4 143 47.0 70 23.0 23 7.6
Total 262 100 42 100
304 100
0.350
* X2, test
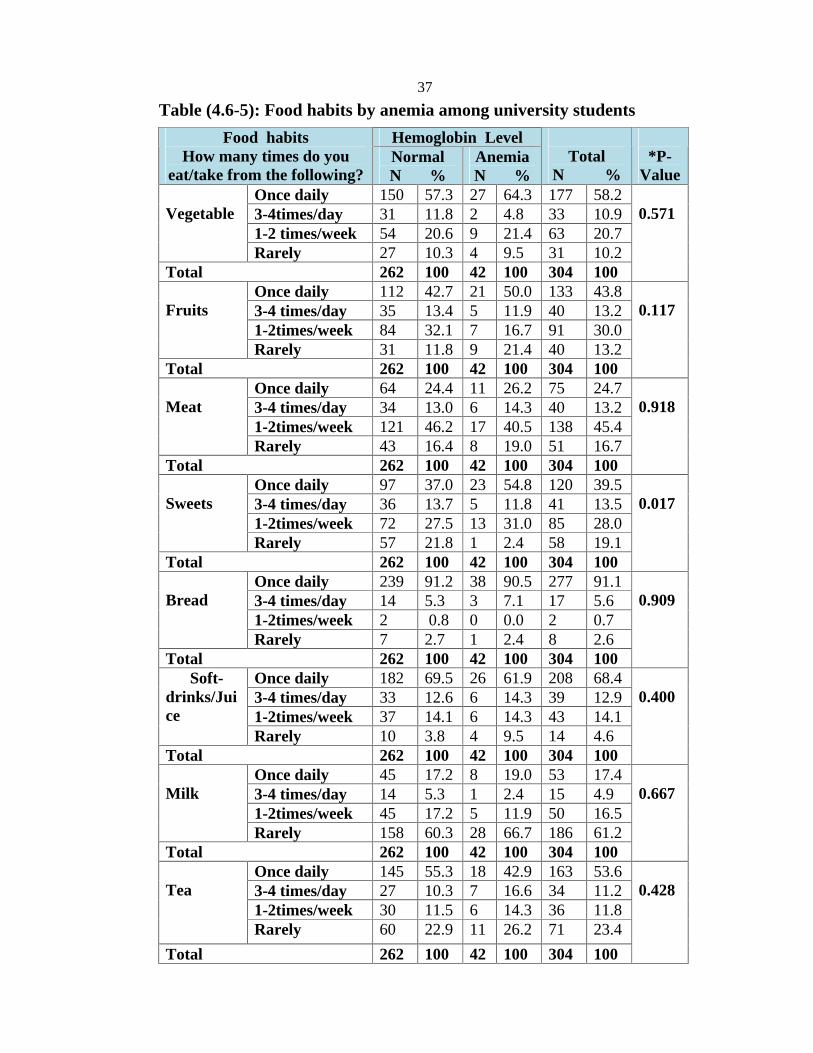
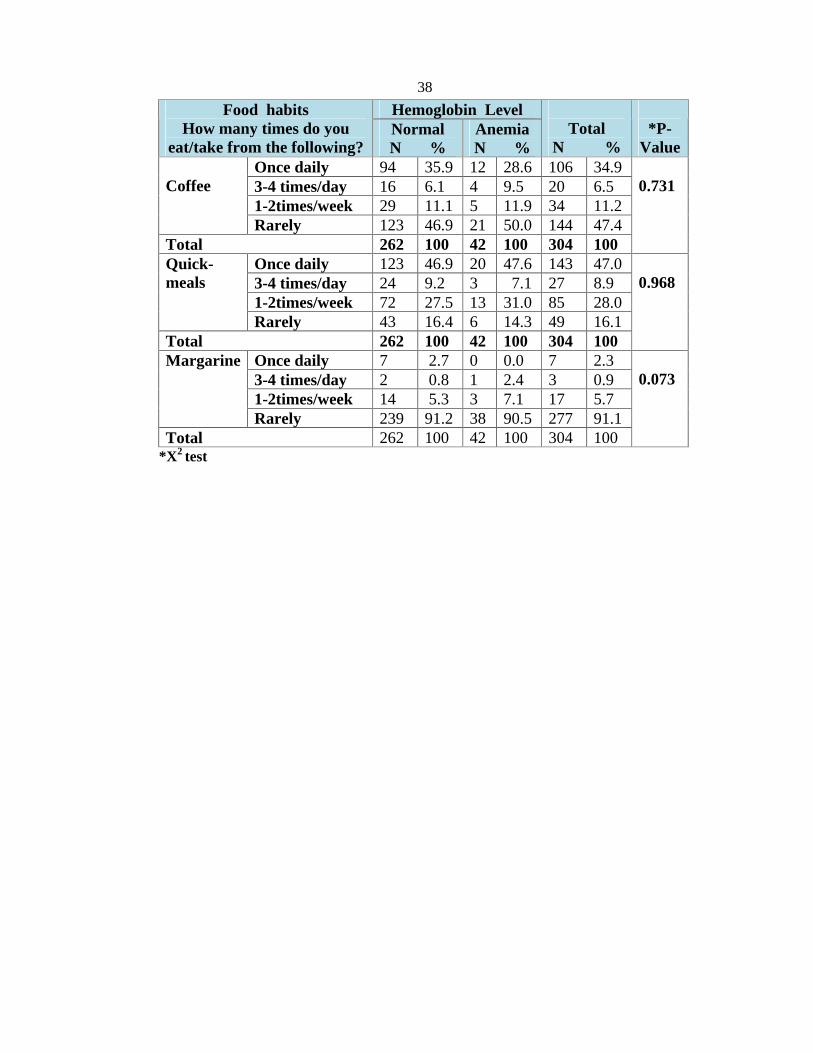
Table 4.6-5 shows food habits by anemia among university students.
Data indicated that, there were no associations between anemia and the
variables of food habits (P > 0.05), except for eating sweets where those
who eat sweets once daily represented about 54.8%, who eat 3-4 times/day
represented 11.8%, those who eat sweets 1-2times/week represented
31.0%, and those who rarely eat sweets represented 2.4%, (P < 0.05).
However, the relationship was significant for females (who ate
sweets) when the analysis was carried out by gender (Fisher exact test, P <
0.05) but not for males (P > 0.05) (data not shown), (Table 4.6-5)
37
Table (4.6-5): Food habits by anemia among university students
Hemoglobin Level Food habits How many times do you
eat/take from the following? Normal N %
Anemia N %
Total
N %
*P-
Value
Once daily 150 57.3 27 64.3 177 58.2 3-4times/day 31 11.8 2 4.8 33 10.9 1-2 times/week 54 20.6 9 21.4 63 20.7
Vegetable
Rarely 27 10.3 4 9.5 31 10.2 Total 262 100 42 100 304 100
0.571
Once daily 112 42.7 21 50.0 133 43.8 3-4 times/day 35 13.4 5 11.9 40
13.2 1-2times/week 84 32.1 7 16.7 91 30.0
Fruits
Rarely 31 11.8 9 21.4 40 13.2 Total 262 100 42 100 304 100
0.117
Once daily 64 24.4 11 26.2 75 24.7 3-4 times/day 34 13.0 6 14.3 40 13.2 1-2times/week 121 46.2 17 40.5 138 45.4
Meat
Rarely 43 16.4 8 19.0 51 16.7 Total 262 100 42 100 304 100
0.918
Once daily 97 37.0 23 54.8 120
39.5 3-4 times/day 36 13.7 5 11.8 41
13.5 1-2times/week 72 27.5 13 31.0 85 28.0
Sweets
Rarely 57 21.8 1 2.4 58 19.1 Total 262 100 42 100 304 100
0.017
Once daily 239 91.2 38 90.5 277
91.1 3-4 times/day 14 5.3 3 7.1 17 5.6 1-2times/week 2 0.8 0 0.0 2 0.7
Bread
Rarely 7 2.7 1 2.4 8 2.6 Total 262 100 42 100 304 100
0.909
Once daily 182 69.5 26 61.9 208 68.4 3-4 times/day 33 12.6 6 14.3 39 12.9 1-2times/week 37 14.1 6 14.3 43 14.1
Soft- drinks/Juice
Rarely 10 3.8 4 9.5 14 4.6 Total 262 100 42 100 304 100
0.400
Once daily 45 17.2 8 19.0 53 17.4 3-4 times/day 14 5.3 1 2.4 15 4.9 1-2times/week 45 17.2 5 11.9 50
16.5
Milk
Rarely 158 60.3 28 66.7 186 61.2 Total 262 100 42 100 304 100
0.667
Once daily 145 55.3 18 42.9 163 53.6 3-4 times/day 27 10.3 7 16.6 34 11.2 1-2times/week 30 11.5 6 14.3 36 11.8
Tea
Rarely 60 22.9 11 26.2 71 23.4
Total 262 100 42 100 304 100
0.428
38
Hemoglobin Level Food habits How many times do you
eat/take from the following? Normal N %
Anemia N %
Total
N %
*P-
Value
Once daily 94 35.9 12 28.6 106
34.9
3-4 times/day 16 6.1 4 9.5 20 6.5 1-2times/week 29 11.1 5 11.9 34 11.2
Coffee
Rarely 123 46.9 21 50.0 144 47.4 Total 262 100 42 100 304 100
0.731
Once daily 123 46.9 20 47.6 143 47.0 3-4 times/day 24 9.2 3 7.1 27 8.9 1-2times/week 72 27.5 13 31.0 85 28.0
Quick-meals
Rarely 43 16.4 6 14.3 49 16.1 Total 262 100 42 100 304 100
0.968
Once daily 7 2.7 0 0.0 7 2.3 3-4 times/day 2 0.8 1 2.4 3 0.9 1-2times/week 14 5.3 3 7.1 17 5.7
Margarine
Rarely 239 91.2 38 90.5 277 91.1 Total 262 100 42 100 304 100
0.073
*X2 test

39
Chapter 5
The Discussion
40
Chapter 5
The Discussion
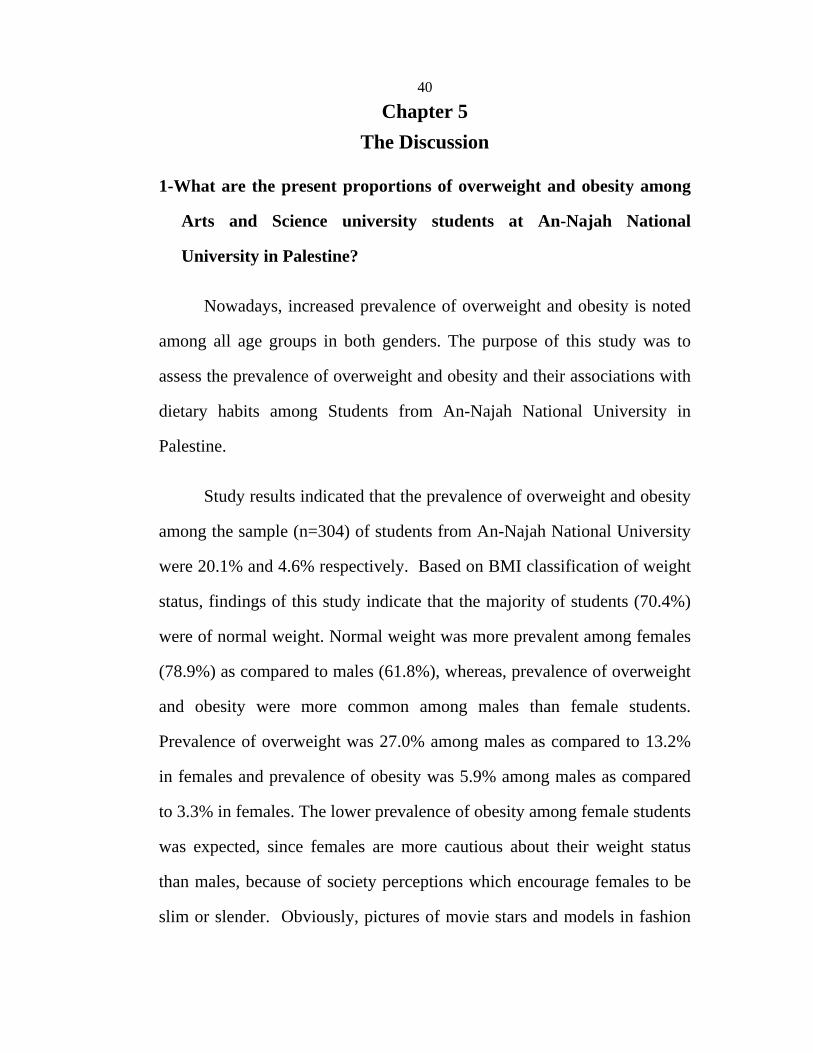
1-What are the present proportions of overweight and obesity among
Arts and Science university students at An-Najah National
University in Palestine?
Nowadays, increased prevalence of overweight and obesity is noted
among all age groups in both genders. The purpose of this study was to
assess the prevalence of overweight and obesity and their associations with
dietary habits among Students from An-Najah National University in
Palestine.
Study results indicated that the prevalence of overweight and obesity
among the sample (n=304) of students from An-Najah National University
were 20.1% and 4.6% respectively. Based on BMI classification of weight
status, findings of this study indicate that the majority of students (70.4%)
were of normal weight. Normal weight was more prevalent among females
(78.9%) as compared to males (61.8%), whereas, prevalence of overweight
and obesity were more common among males than female students.
Prevalence of overweight was 27.0% among males as compared to 13.2%
in females and prevalence of obesity was 5.9% among males as compared
to 3.3% in females. The lower prevalence of obesity among female students
was expected, since females are more cautious about their weight status
than males, because of society perceptions which encourage females to be
slim or slender. Obviously, pictures of movie stars and models in fashion
41
magazines and mass media have a strong impact on girls' body shape and
image perception [57].
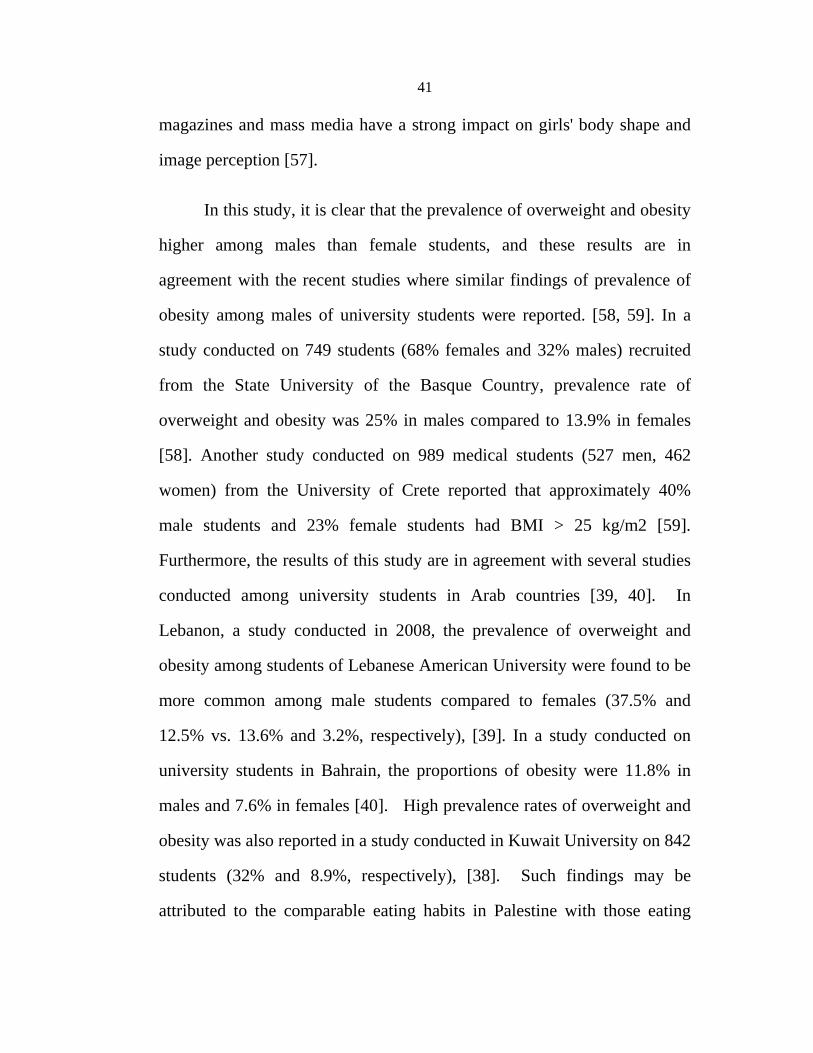
In this study, it is clear that the prevalence of overweight and obesity
higher among males than female students, and these results are in
agreement with the recent studies where similar findings of prevalence of
obesity among males of university students were reported. [58, 59]. In a
study conducted on 749 students (68% females and 32% males) recruited
from the State University of the Basque Country, prevalence rate of
overweight and obesity was 25% in males compared to 13.9% in females
[58]. Another study conducted on 989 medical students (527 men, 462
women) from the University of Crete reported that approximately 40%
male students and 23% female students had BMI > 25 kg/m2 [59].
Furthermore, the results of this study are in agreement with several studies
conducted among university students in Arab countries [39, 40]. In
Lebanon, a study conducted in 2008, the prevalence of overweight and
obesity among students of Lebanese American University were found to be
more common among male students compared to females (37.5% and
12.5% vs. 13.6% and 3.2%, respectively), [39]. In a study conducted on
university students in Bahrain, the proportions of obesity were 11.8% in
males and 7.6% in females [40]. High prevalence rates of overweight and
obesity was also reported in a study conducted in Kuwait University on 842
students (32% and 8.9%, respectively), [38]. Such findings may be
attributed to the comparable eating habits in Palestine with those eating
42
habits in the neighboring countries, or to the comparable genetic
constitution of neighboring communities.
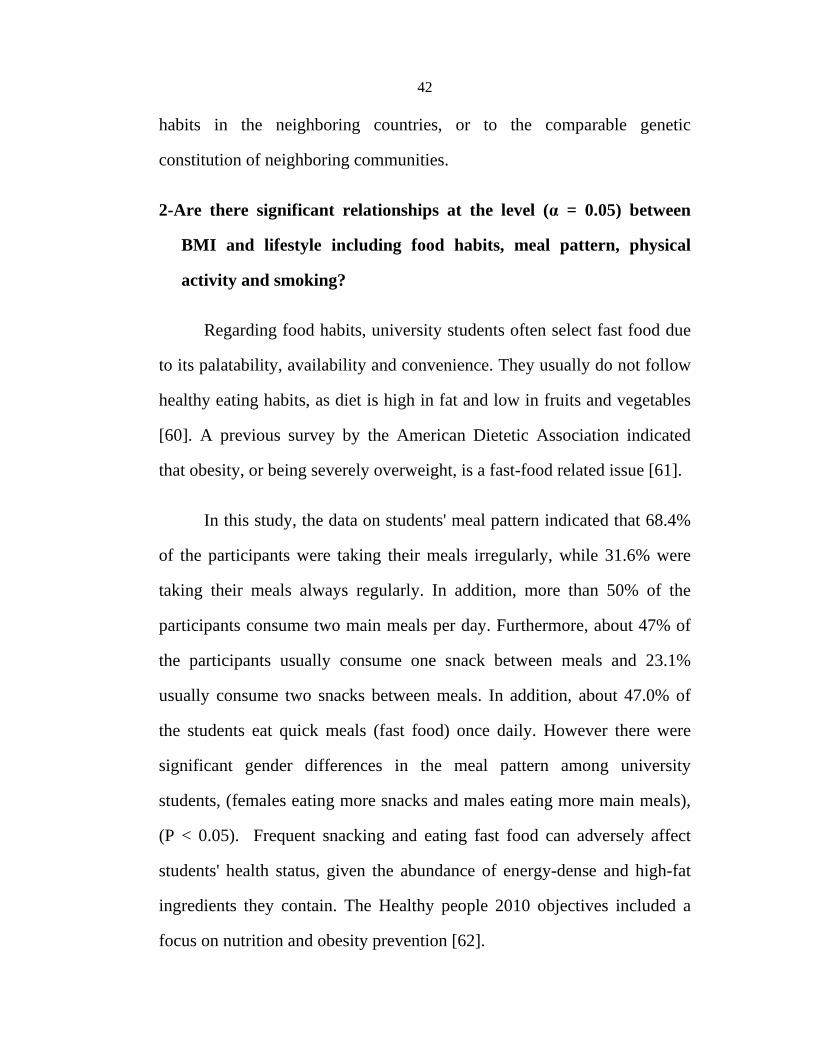
2-Are there significant relationships at the level ( = 0.05) between
BMI and lifestyle including food habits, meal pattern, physical
activity and smoking?
Regarding food habits, university students often select fast food due
to its palatability, availability and convenience. They usually do not follow
healthy eating habits, as diet is high in fat and low in fruits and vegetables
[60]. A previous survey by the American Dietetic Association indicated
that obesity, or being severely overweight, is a fast-food related issue [61].
In this study, the data on students' meal pattern indicated that 68.4%
of the participants were taking their meals irregularly, while 31.6% were
taking their meals always regularly. In addition, more than 50% of the
participants consume two main meals per day. Furthermore, about 47% of
the participants usually consume one snack between meals and 23.1%
usually consume two snacks between meals. In addition, about 47.0% of
the students eat quick meals (fast food) once daily. However there were
significant gender differences in the meal pattern among university
students, (females eating more snacks and males eating more main meals),
(P < 0.05). Frequent snacking and eating fast food can adversely affect
students' health status, given the abundance of energy-dense and high-fat
ingredients they contain. The Healthy people 2010 objectives included a
focus on nutrition and obesity prevention [62].
43
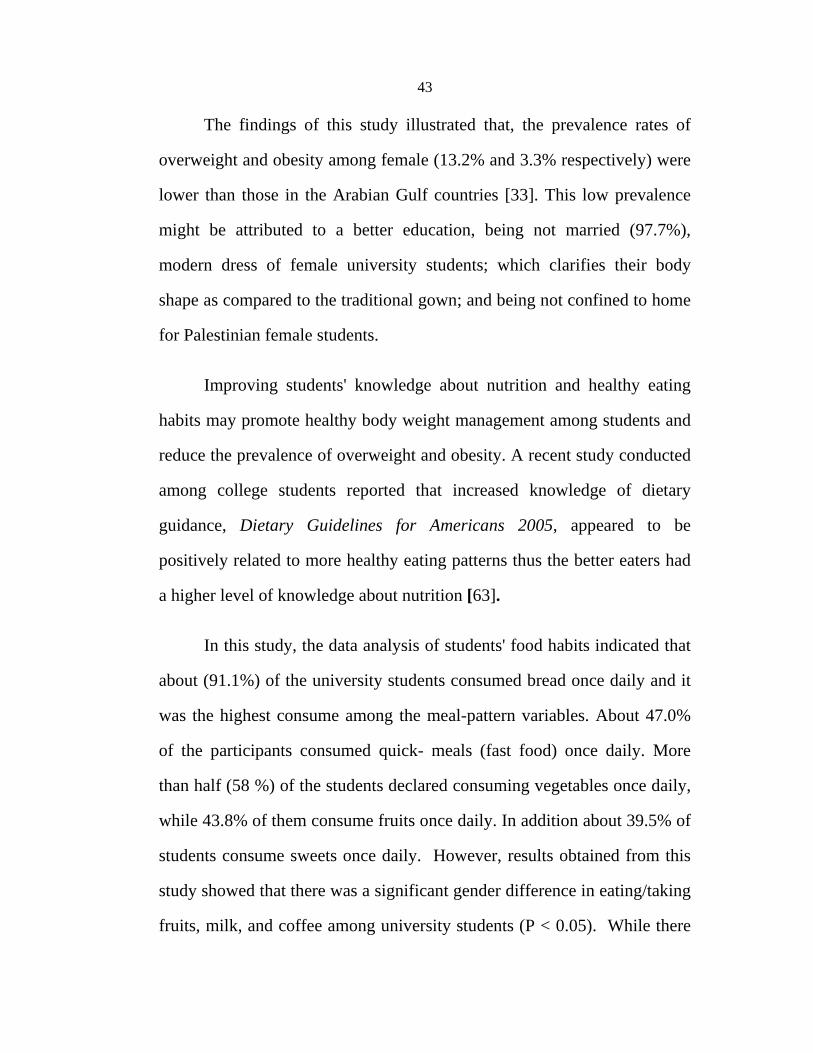
The findings of this study illustrated that, the prevalence rates of
overweight and obesity among female (13.2% and 3.3% respectively) were
lower than those in the Arabian Gulf countries [33]. This low prevalence
might be attributed to a better education, being not married (97.7%),
modern dress of female university students; which clarifies their body
shape as compared to the traditional gown; and being not confined to home
for Palestinian female students.
Improving students' knowledge about nutrition and healthy eating
habits may promote healthy body weight management among students and
reduce the prevalence of overweight and obesity. A recent study conducted
among college students reported that increased knowledge of dietary
guidance, Dietary Guidelines for Americans 2005, appeared to be
positively related to more healthy eating patterns thus the better eaters had
a higher level of knowledge about nutrition [63].
In this study, the data analysis of students' food habits indicated that
about (91.1%) of the university students consumed bread once daily and it
was the highest consume among the meal-pattern variables. About 47.0%
of the participants consumed quick- meals (fast food) once daily. More
than half (58 %) of the students declared consuming vegetables once daily,
while 43.8% of them consume fruits once daily. In addition about 39.5% of
students consume sweets once daily. However, results obtained from this
study showed that there was a significant gender difference in eating/taking
fruits, milk, and coffee among university students (P < 0.05). While there
44
were no significant gender differences in eating/taking vegetables, meat,
bread, soft- drinks/juice, tea, Margarine and quick-meals, (P > 0.05).
Therefore, developing gender adapted nutrition education programs that
promote healthy eating habits for university students should be encouraged.
Regarding physical activity and smoking, the findings indicated that
37.5 % of the university students were not practicing physical activity, and
71.4% of the subjects never smoked. Therefore, smoking was not common
in the studied sample of university students, in agreement with findings of
other studies in the region. For example, a study conducted on 2443
students from 13 public and private schools in Greater Beirut reported that
the prevalence rate of cigarette smoking was 2.5% [64]. However, results
of this study indicated a significant gender difference in physical activity
and smoking among university students, (P < 0.05). Several studies had
shown inverse relationship between level of physical activity and
overweight and obesity [36, 65]. It is well known that physical activity
plays a protective role against obesity, controlling the storage, distribution
and utilization of calories, leads to an elevation in daily energy expenditure,
promotes fat oxidation in order to increase muscle mass and decrease fat
mass [65]. In general, it is well known that, low levels of physical activity,
sedentary habits, high protein and sugar intakes, low fiber consumption,
and frequent snacking contribute to the high prevalence of overweight and
obesity.
45
3. What are the present proportions of anemia among the studied
sample of university students at An-Najah National University,
Nablus, Palestine?
Iron deficiency anemia could be attributed to low intake of iron
and/or poor bioavailability of iron in the diet of students. The prevalence of
anaemia among the studied sample of university students was 13.8%.
Anaemia was more common in females (18.4%) compared to male students
(9.2%). These findings are in agreement with other studies in the region
[66, 67]. A cross-sectional study investigated the prevalence of iron
deficiency anemia in school children aged 6 to 18 years, in the district of
Salfeet in the West Bank area of Palestine and found that the prevalence of
iron deficiency among females was 30.5%, and among males was (21.6%),
[66].
In 2005, a study conducted on Schoolchildren aged 12 and 13 yrs
(males: 504; females: 510) from nine primary schools, to assess the iron
deficiency among schoolchildren of different socio-economic status in
urban Turkey. The iron deficiency prevalence was 20.8% among girls and
17.5% among boys [67].
4. Is there a significant relationship at the level ( = 0.05) between BMI
and anemia among the studied sample of university students?
Among the overweight male students, 14.3% had anaemia and among
the obese males 14.3% had anaemia. No significant association was found
between hemoglobin status (anemia) and BMI status among males, (P >
46
0.05). On the other hand, among the overweight female students, 17.9 %
had anaemia while among the obese females, none of them had anaemia. A
significant association was found between anemia and BMI status
(overweight and obesity) among females, (P < 0.05).
These results are in agreement with a study which confirmed that
overweight children and adolescents exhibited lower iron levels [68]. A
cross-sectional study conducted in 2004, found that overweight children
and adolescents exhibited lower iron levels; of those with iron deficiency
anemia, more than 50% had a body mass index (BMI) greater than the 97th
percentile [68].
5. Are there significant relationships at the level ( = 0.05) between
anemia and dietary habits among the studied sample of university
students?
The findings of this study indicated that there were no significant
relationships between anemia and dietary habits except for sweets
consumption (for females only). This may be attributed to insufficient
intestinal absorption of iron, menses, and bleeding—etc, as anemia was
more common among females than males.
Such results suggest that iron supplement and food iron fortification
are required in order to overcome the prevalence of anemia (particularly
among females), this simple but common health problem.
47
5.1 Limitations of this study
The results of this study are limited by the use of a sample of
students from just one university which may not be a representative of all
university students in Palestine. This research study is limited to An-Najah
National University - Nablus, and it is also limited to the university
students of two faculties; Faculty of Science and Faculty of Arts; therefore,
samples from other faculties and from different universities may provide a
more inclusive picture of university students in Palestine.
The sampling methodology of this study was done by convenient
sampling method.
5.2 Conclusions and Recommendations
Conclusions
According to results obtained, the author concluded that overweight
and obesity are a problem among An-Najah National University students,
despite the low prevalence of overweight and obesity in the studied sample
as compared to prevalence in neighboring countries. Overweight and
obesity were more common among male students compared to females.
Prevalence of anaemia was more common among females than male
students. The prevalence of abdominal obesity measured as waist
circumference (17.8%) was significantly higher than overall obesity
measured as BMI (4.6%) among university students and it was more
common among female students compared to males. The consumption of
48
food which is considered important to prevent chronic diseases such as
fruits and vegetables is relatively low. This may be due to lack of
nutritional awareness among university students, Therefore educational
programs which encourage increased consumption of fruits and vegetables
and increased physical activity are recommended for a good health as well
as preventive strategy for university students.
Recommendations
1-Further research is needed to investigate the prevalence of factors
associated with overweight and obesity among larger samples
representing all Palestinian university students.
2- Awareness among university students should be increased, through
health promotion, health education and nutritional programs that
encourage increase in consumption of fruits and vegetables which is
recommended for a good health, and targeting the impact of overweight
and obesity on morbidity and mortality.
3- Daily physical activity for university students should be encouraged in
all university educational centers and faculties, as it plays a protective
role against obesity, as well as its importance in the regulatory system
controlling the storage, distribution and utilization of calories in order to
increase muscle mass and decrease fat mass. Therefore dietary and
exercise counseling are required as preventive strategies for university
students.
49
4- Obesity represents a health problem to university students, as they have
been experiencing a nutritional transition in food choices during the past
years from the typical Mediterranean diet into the western fast food
pattern. Therefore, it is important to pay attention to what university
canteens offer for university students, in order to follow a balanced diet,
to maintain physical fitness, and body mass index within the normal
range.
5-Policy makers must address the problem of overweight and obesity and
focus on prevention strategies especially among university students.
Furthermore, public demand for health and nutritional information
should be taken into consideration when implementing strategies aimed
at improving the nutritional well-being of individual.
6-Iron supplement and food iron fortification are required in order to
overcome prevalence of anemia, this simple but common health
problem.
Competing interests
The author declares that he has no competing interests.
50
References
1- Haslam DW., James WP., 2005. "Obesity". Lancet 366 (9492): 1197–
209.
2- Barness LA ., Opitz JM., Gilbert-Barness E., 2007. "Obesity: genetic,
molecular, and environmental aspects". Am. J. Med. Genet. A 143A
(24): 3016–34.
3- Maqboul S., 2009 .The Influence of Socio- Demographic factors on the
level of Obesity and Health-Awareness among Physically Disabled in
Nablus Governorate, thesis, An-Najah National University; pg. 8.
4- Christensen L., Pettijohn L., 2001. Mood and carbohydrate cravings.
Appetite, 36:137-145.
5-Yanowski S Z., and Yanowski J A., 2002. Obesity. N. Engl. J. Med.,
346: 591-602.
6- Manson J., Willett W., and Stampfer M., 1995. Body weight and
mortality among women. N Engl J Med., 333: 677-85.
7- James WFT., 1992. Epidemiology of obesity. International Journal of
Obesity; 16(2 suppl):23–6
8- World Health Organization. 2009, Global Health Risks: mortality and
burden of disease attributable to selected major risks, European
Health Report.
51
9- Jensen MK., Chiuve SE., Rimm EB., 2008. Obesity, behavioral lifestyle
factors, and risk of acute coronary events. Circulation; 117:3062-9.
10- Majed B., Moreau T., Asselain B., 2009. Overweight, obesity and
breast cancer prognosis: optimal body size indicator cut-points. Breast
Cancer Res Treat; 115:193-203.
11- Moon HG., Ju YT., Jeong CY., 2008. Visceral obesity may affect
oncologic outcome in patients with colorectal cancer. Ann Surg
Oncol; 15:1918-22.
12- World Health Organization (WHO) 1999. Definition, Diagnosis and
Classification of Diabetes Mellitus and Its Complications. Part 1:
Diagnosis and Classification of Diabetes Mellitus. Provisional Report
of a WHO Consultation. Geneva.
13- Flegal K M., Carroll M D., Johnson C L., 2002. "Prevalence and
Trends in Obesity among US Adults, 1999-2000". JAMA 288 (14):
1723–1727.
14- World Health Organization, 2003, Obesity and overweight, retrieved
2009-04 27.
15- World Health Organization. 2005. Preventing chronic diseases: a vital
investment.
16- Al-Kandari YY., 2006. Prevalence of obesity in Kuwait and its relation
to sociocultural variables. Obes. Rev., 7: 147-154.
52
17- Al-Tawil NG., Abdulla MM., and Abdul-Ameer A.J., 2007. Prevalence
of and factors associated with overweight and obesity among a group
of Iraqi women. East. Mediterr. Health J., 13:420-429.
18- Fouad M F., Rastam S., Ward K D., and Maziak W., 2006. Prevalence
of obesity and its associated factors in Aleppo, Syria.Prev.Control,
2:85-94.
19- WHO Regional Office for Europe. 2007. The challenge of obesity in
the WHO European Region and the strategies for response /edited by
Francesco Branca, Haik Nikogo2007sian and Tim Lobstein. ISBN
9789289014083.
20- Haslam DW., James WP., 2005. "Obesity". Lancet 366 (9492): 1197–
209.
21- Constantine T., Vojtech H., Arnaud B., Nick F., Martin F., Elisabeth
M V., Dragan M., Maximo Ms., April 2008. "Management of Obesity
in Adults: European Clinical Practice Guidelines". The European
Journal of Obesity 1: 106.
22- Fried M., Hainer V., Basdevant A., April 2007. "Inter-disciplinary
European guidelines on surgery of severe obesity". Int J Obes (Lond)
31 (4): 569–77.
23- Whitlock G., Lewington S., Sherliker P., (March 2009). "Body-mass
index and cause-specific mortality in 900 000 adults: collaborative
analyses of 57 prospective studies". Lancet 373 (9669): 1083–96.
53
24- Peeters A., Barendregt JJ., Willekens F., Mackenbach JP., Al Mamun
A., Bonneux L., January 2003. "Obesity in adulthood and its
consequences for life expectancy: A life-table analysis" (PDF). Ann.
Intern. Med. 138 (1): 24–32.
25- Husseini A., Abu Rmeileh N., M E., Mikki N., Tarik M R., Abu Ghosh
H., Bar ghuthi N., Khalili M., Bjertness E., Holmboe-Ottesen G.,
Jervell J., March 2009. Health in the occupied Palestinian territory,
the lancet; page; 39-41.
26- Al Sabbah H.,* Vereecken C.,* Abdeen Z., Coats E., & Maes L., *
2008. Associations of overweight and of weight dissatisfaction among
Palestinian adolescents: findings from the national study of Palestinian
schoolchildren (HBSC-WBG2004), J Hum Nutr Diet.
27- AL Sabbah H., 2009. Weight Control Behaviors among Overweigh
Study Normal Weight and Underweight Adolescents in Palestine:
Findings from the National of Palestinian Schoolchildren (HBSC-
WBG2004), International Journal of Eating Disorders.
28- Ogden C L., Carroll M D., Curtin L R., McDowell M A., Tabak C J.,
and Flegal K M., 2006. Prevalence of overweight and obesity in the
United States, 1999-2004. JAMA, 295(13): 1549-55.
29- Birmingham CL., Mller J L., Palepu A., Spinelli J I., and Anis A H.,
1999. The cost of obesity in Canada. CMAJ, I60 (4):483-8.
54
30- Seidell J C., 1995. Obesity in Europe; Scaling an epidemic. Int. J.
Obes. Relat. Metab. Disord, 19: 1-4.
31- Rossner S., 2002. Obesity: the disease of the twenty-first century. Int J
Obese., 6(4): S2-S4.
32- El-Hazmi M A., and Warsy A S., 2000. Prevalence of overweight and
obesity in diabetic and non-diabetic Saudis. East Mediterr. Hlth. J., 6:
276 - 282.
33- Al-Mahroos F., and Al-Roomi K.,1999.Overweight and obesity in the
Arabian Peninsula: an overview, The Journal of the Royal Society for
the Promotion of Health, 119: 251.
34- El-Qudah J M., Al-Widyan O K., Alboqai A A., Suleiman and Quasem
J.M., 2008. Fat soluble vitamins (A, E and K) intake among a sample
of Jordanian university students. World Applied Sci. J., 5: 252-257.
35- Yahia N., Achkar A., Abdallah A., and Rizk S., 2008. Eating habits and
obesity among Lebanese University students. Nutr. J., 7: 32-33.
36- Alboqai O K., Yasein N., El-Qudah J M., Bataineh M F., Suleiman A.,
Obeidat B A., 2009. Prevalence of and factors associated with
overweight and obesity among Jordan University Students. Journal of
Biological Sciences 9 (7): 738-745.
37- Tukan S., Ahmad M., and Takruri R., 2006. Obesity and Overweight in
Young Adult Females of Northern Badia of Jordan. Mal J Nutr 12(2):
157-166.
55
38- AI-Isa AN., 1999. Obesity among Kuwait University students: an
explorative Study. The Journal of the Royal Society for the
Promotion of HealthVol. 119, no. 4, 223-227.
39- Yahia., 2008. Eating habits and obesity among Lebanese university
students. Nutrition Journal, 7:32.
40- Al-Ansari M.,Al Mannai M., Musaiger A., 2000. Body weight of
university students in Bahrain. Bahrain Medical Bulletin, Vol.22,
No.3.
41- Arafa MR., 2005 Obesity in Saudi Arabia. Saudi Med J.; 26(5):824-9.
42- Silliman K., 2004. A Survey of Dietary and Exercise Habits and
Perceived Barriers to Following a Healthy Lifestyle in a College
Population. Californian Journal of Health Promotion, Volume 2,
Issue 2,10-19.
43- Al-Isa A N., 1999. Dietary and socio-economic factors associated with
obesity among Kuwaiti college men. British Journal of Nutrition, 82:
369-374.
44- Al-Sayes F., 2011. Prevalence of iron deficiency and iron deficiency
anemia among females at university stage. Journal of Medical
Laboratory and Diagnosis Vol. 2(1) pp. 5-11.
45- Nadia M G., 2005. Assessment of nutritional status of school children
in Bahrain. School Nutrition from 6_18.pdf.
56
46- Pinhas-Hamiel O., Newfield RS., Koren I., Agmon A., Lilos P., Phillip
MSO., 2003.Greater prevalence of iron deficiency in overweight and
obese children and adolescents. Int J Obes Relat Metab
Disord.;27(3):416.
47- Kershaw EE., Flier JS., (2004). Adipose tissue as an endocrine organ.
J. Clin. Endocrinol. Metab. 89 (6): 2548–56.
48- WHO expert consultation, 2004. Appropriate body-mass index for
Asian populations and its implications for policy and intervention
strategies. The Lancet; 157-163.
49- WHO 2000. Obesity: preventing and managing the global epidemic.
Report of a WHO Consultation, WHO Technical Report Series 894.
Geneva: World Health Organization.
50- WHO report 1997, The Global Challenge of Obesity and the
International Obesity Task Force, Table2
51-Wiley., 2000. Encyclopedia of food science and technology, Volume,
1 Page 1-6).
52- Maton A ., (1993). Human Biology and Health. Englewood Cliffs, New
Jersey, USA: Prentice Hall. ISBN 0-13-981176-1.
53-Zuckerman K., 2007. Approach to the anemias. In: Goldman L,
Ausiello D, eds. Cecil Medicine. 23rd ed. Philadelphia, Pa: Saunders
Elsevier; chap 162.
57
54- merriam-webster dictionary --> anemia Retrieved on May 25, 2009
en.wikipedia.org/wiki/Anemia
55- Brady PG., (2007). "Iron deficiency anemia: a call for". South. Med. J.
100 (10): 966–7).
56- Al-sabbah H H., 2000. Diabetes self- management in Rural Palestinian
community. Thesis; Page; 119- 138.
57- Field AE., Cheung L., Wolf AM., Herzog DB., Gortmaker SL.,
ColditzGA., 1999: Exposure to the mass media and weight concerns
among girls. Pediatrics, 103(3):E36.
58- Arroyo I M., Rocandio AM., Ansotegui A L., Pasual AE., Salces B I.,
Rebato O E., 2006: Diet quality, overweight and obesity in universities
students. Nutr Hosp, 21(6):673-679.
59- Bertsias G., Mammas I., Linardakis M., Kafatos A., 2003: Overweight
and obesity in relation to cardiovascular disease risk factors among
medical students in Crete, Greece. BMC Public Health, 3:3.
60- Galore SR., Walker C., Chandler A., 1993: Brief Communication:
Dietary habits of first-year medical students as determined by
computer software analysis of three-day food records. J Am Coll Nutr,
12:517-520.
61- Wells H F., and Jean C B., March 2008.Dietary Assessment of Major
Trends in U.S. Food Consumption, 1970-2005. Economic
Information Bulletin No. 33. Economic Research Service, U.S. Dept.
of Agriculture.
58
62- Healthy People 2010. Conference, Washington, DC: US Government
Printing Office; 2000.
63- Kolodinsky J., Harvey-Berino JR., Berlin L., Johnson RK., Reynolds
TW., 2007: Knowledge of current dietary guidelines and food choice
by college students: better eaters have higher knowledge of dietary
guidance. J Am Diet Assoc, 107:1409-1413.
64- Tamim H., Al-Sahab B., Akkary G., Ghanem M., Tamim N., El
Roueiheb Z., Kanj M., Afifi R., 2007: Cigarette and nargileh smoking
practices among school students in Beirut, Lebanon. Am J Health
Behav, 31(1):56-63.
65- Macdonald A., 2008. Personality and Individual Differences
Volume 44, Issue 4, Pages 921-931.
66- Odeh M., 2006. Prevalence of Iron Deficiency Anemia among School
Children in Salfeet District. Unpublished Thesis. An-Najah
National University.
67- Manios Y., 2005. Prevalence of iron deficiency among schoolchildren
of different socio-economic status in urban Turkey. European
Journal of Clinical Nutrition; 59, 64–71.
68- Karen G., Nead J S., effrey H J M., Peggy Auinger K., and Weitzman
M., 2004.Overweight Children and Adolescents: A Risk Group for
Iron Deficiency. Pediatrics; 114; 104
59
Appendices
Annex 1: The Questionnaire of the study (English &
Arabic version)
Annex 2: Table1: WHO standard classification of obesity
Annex 3: Table 2: Sex-specific waist circumferences
Annex-4: :
Annex-5: IRB Approval letter.
Annex-6: /
Annex-7: A picture for drawing blood sample from a
participant.
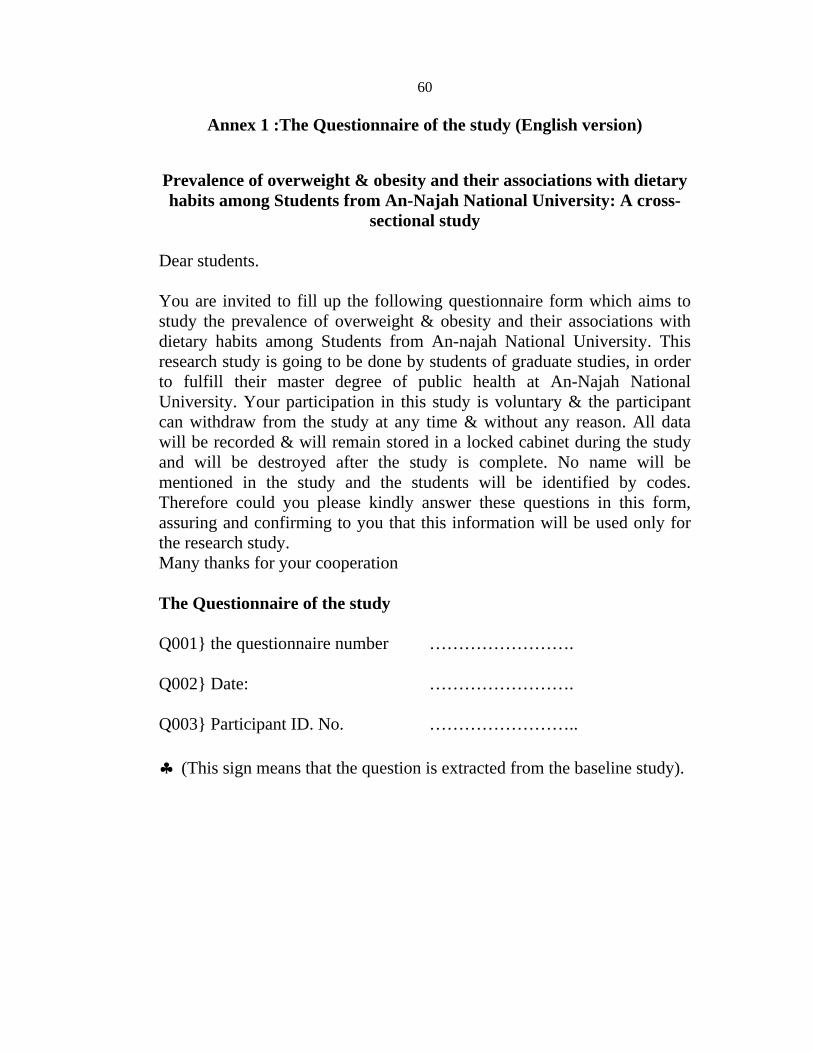
60
Annex 1 :The Questionnaire of the study (English version)
Prevalence of overweight & obesity and their associations with dietary habits among Students from An-Najah National University: A cross-
sectional study
Dear students.
You are invited to fill up the following questionnaire form which aims to study the prevalence of overweight & obesity and their associations with dietary habits among Students from An-najah National University. This research study is going to be done by students of graduate studies, in order to fulfill their master degree of public health at An-Najah National University. Your participation in this study is voluntary & the participant can withdraw from the study at any time & without any reason. All data will be recorded & will remain stored in a locked cabinet during the study and will be destroyed after the study is complete. No name will be mentioned in the study and the students will be identified by codes. Therefore could you please kindly answer these questions in this form, assuring and confirming to you that this information will be used only for the research study. Many thanks for your cooperation
The Questionnaire of the study
Q001} the questionnaire number …………………….
Q002} Date: …………………….
Q003} Participant ID. No. ……………………..
(This sign means that the question is extracted from the baseline study).
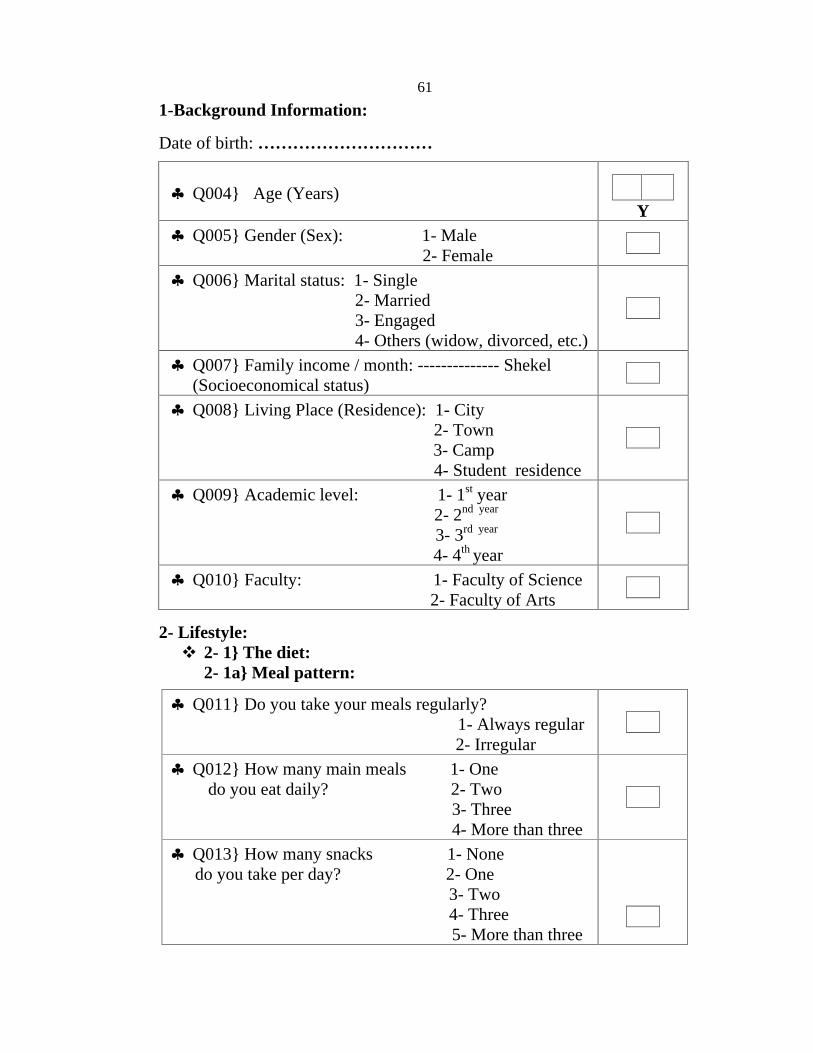
61
1-Background Information:
Date of birth: …………………………
Y
Q004} Age (Years)
Q005} Gender (Sex): 1- Male 2- Female
Q006} Marital status: 1- Single 2- Married 3- Engaged 4- Others (widow, divorced, etc.)
Q007} Family income / month: -------------- Shekel (Socioeconomical status)
Q008} Living Place (Residence): 1- City 2- Town 3- Camp
4- Student residence
Q009} Academic level: 1- 1st year 2- 2nd year
3- 3rd year
4- 4th year
Q010} Faculty: 1- Faculty of Science 2- Faculty of Arts
2- Lifestyle:
2- 1} The diet: 2- 1a} Meal pattern:
Q011} Do you take your meals regularly? 1- Always regular
2- Irregular
Q012} How many main meals 1- One do you eat daily? 2- Two
3- Three 4- More than three
Q013} How many snacks 1- None do you take per day? 2- One 3- Two 4- Three
5- More than three
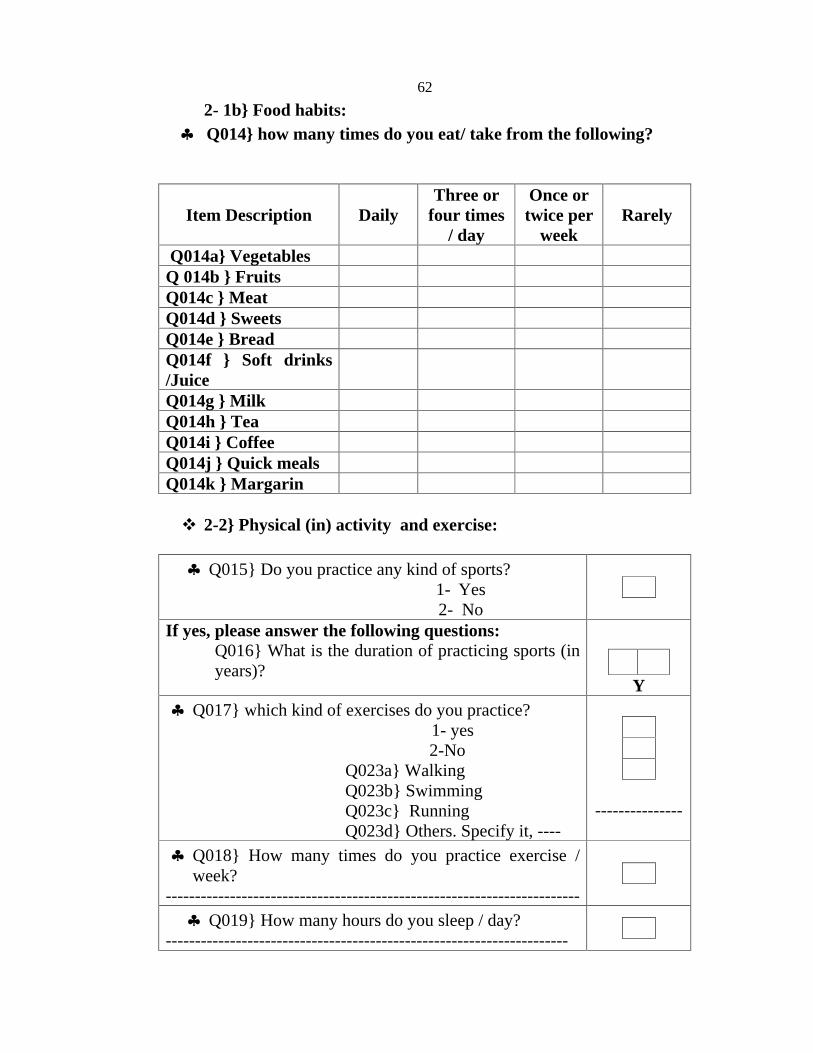
62
2- 1b} Food habits:
Q014} how many times do you eat/ take from the following?
Rarely Once or twice per
week
Three or four times
/ dayDaily Item Description
Q014a} Vegetables
Q 014b } Fruits
Q014c } Meat
Q014d } Sweets
Q014e } Bread
Q014f } Soft drinks /Juice
Q014g } Milk
Q014h } Tea
Q014i } Coffee
Q014j } Quick meals
Q014k } Margarin
2-2} Physical (in) activity and exercise:
Q015} Do you practice any kind of sports? 1- Yes
2- No
Y
If yes, please answer the following questions: Q016} What is the duration of practicing sports (in years)?
---------------
Q017} which kind of exercises do you practice? 1- yes
2-No Q023a} Walking Q023b} Swimming Q023c} Running Q023d} Others. Specify it, ----
Q018} How many times do you practice exercise / week?
-----------------------------------------------------------------------
Q019} How many hours do you sleep / day? ---------------------------------------------------------------------
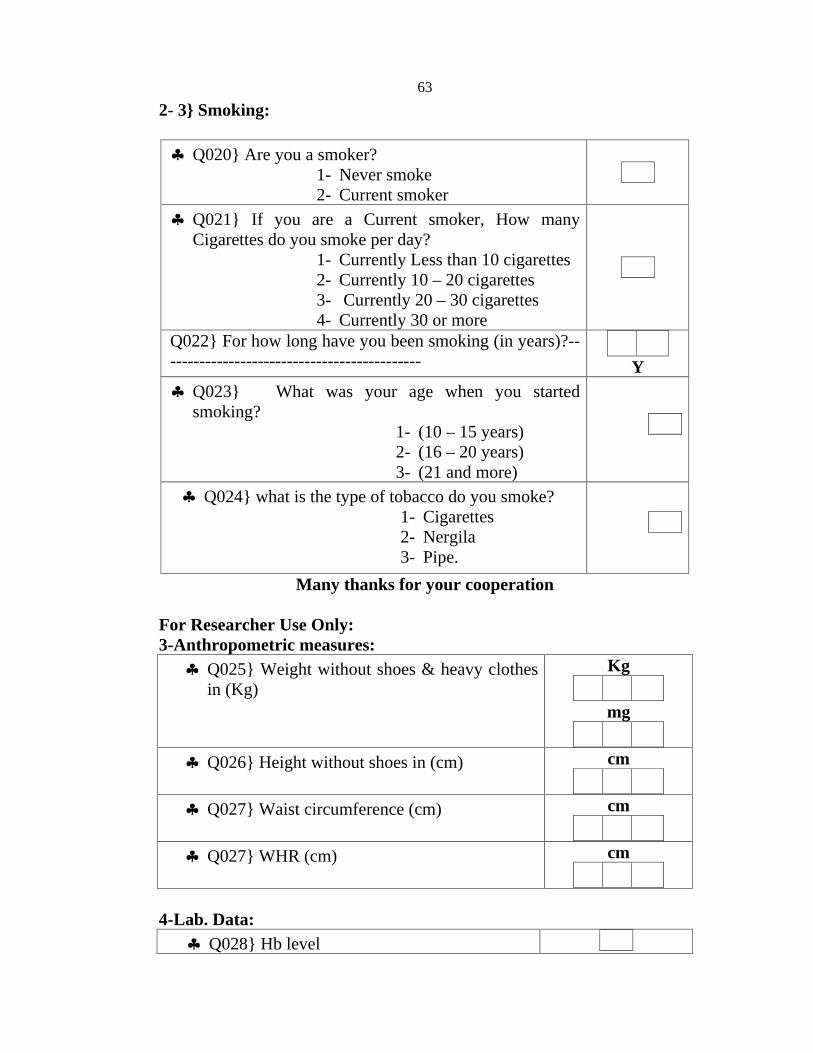
63
2- 3} Smoking:
Q020} Are you a smoker?
1- Never smoke 2- Current smoker
Q021} If you are a Current smoker, How many Cigarettes do you smoke per day?
1- Currently Less than 10 cigarettes 2- Currently 10 – 20 cigarettes 3- Currently 20 – 30 cigarettes 4- Currently 30 or more
Y
Q022} For how long have you been smoking (in years)?---------------------------------------------
Q023} What was your age when you started smoking?
1- (10 – 15 years) 2- (16 – 20 years) 3- (21 and more)
Q024} what is the type of tobacco do you smoke? 1- Cigarettes 2- Nergila 3- Pipe.
Many thanks for your cooperation
For Researcher Use Only: 3-Anthropometric measures:
Kg
mg
Q025} Weight without shoes & heavy clothes in (Kg)
cm
Q026} Height without shoes in (cm)
cm
Q027} Waist circumference (cm)
cm
Q027} WHR (cm)
4-Lab. Data:
Q028} Hb level
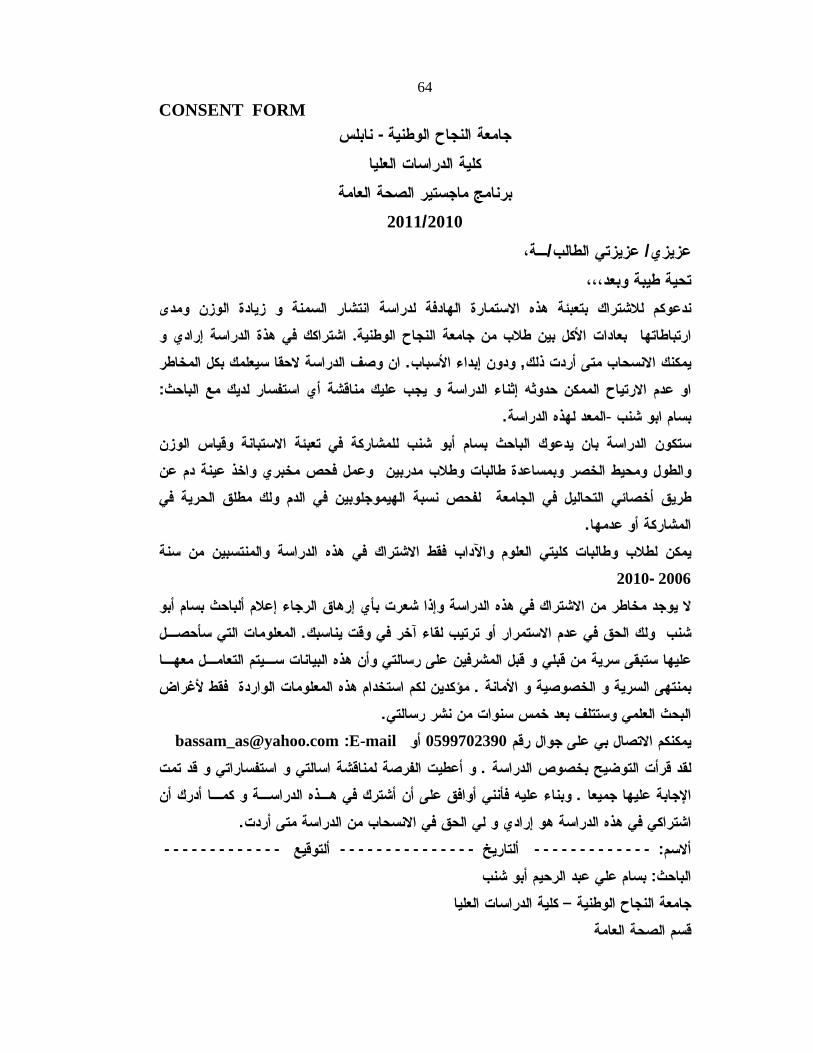
64
CONSENT FORM -
2010/2011
//
.
,.
:
-.
.
2006-2010
.
.
.
0599702390E-mail :[email protected]
.
.
.
:- - - - - - - - - - - - -- - - - - - - - - - - - - - -- - - - - - - - - - - - -
:
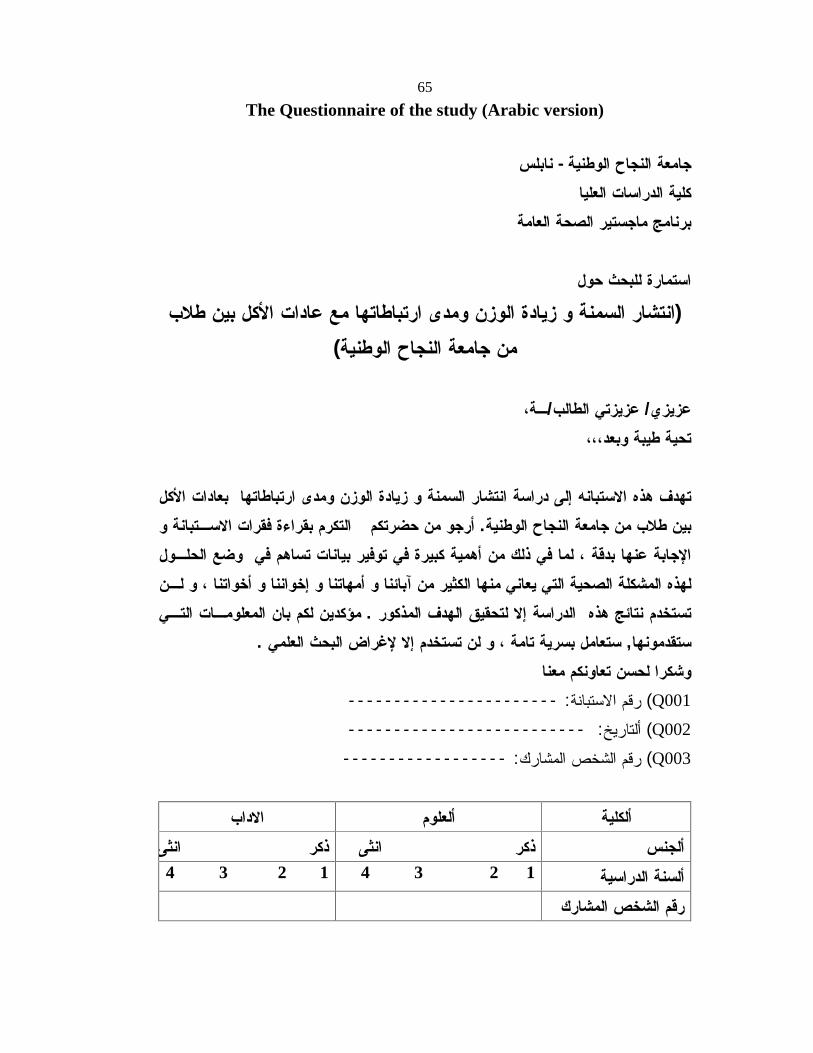
65
The Questionnaire of the study (Arabic version)
-
)
(
//
.
.
,.
Q001(:- - - - - - - - - - - - - - - - - - - - - - -
Q002(:- - - - - - - - - - - - - - - - - - - - - - - - - -
Q003(:- - - - - - - - - - - - - - - - - -
1234 1234
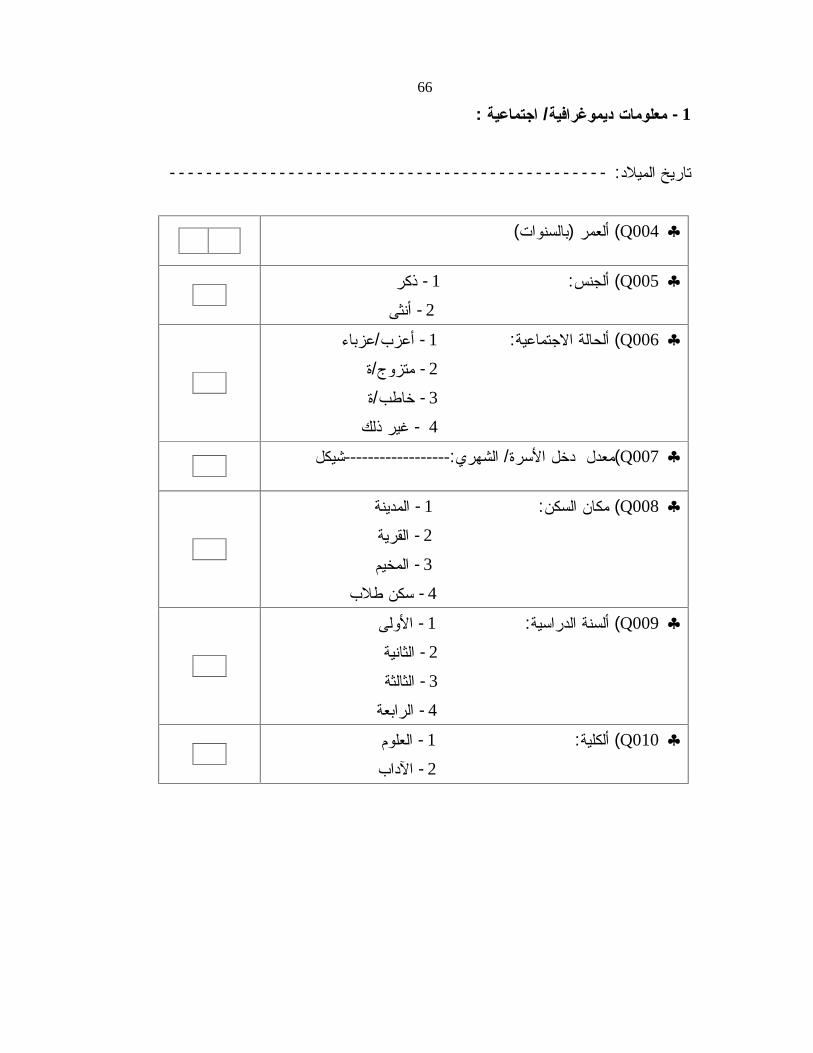
66
1-/:
:- - - - - - - - - - - - - - - - - - - - - - - - - - - - - - - - - - - - - - - - - - - - - - - -
Q004()(
Q005(:1-
2-
Q006(:1-/
2-/
3-/
4-
Q007(/:------------------
Q008(:1-
2-
3-
4-
Q009(:1-
2-
3-
4-
Q010(:1-
2-
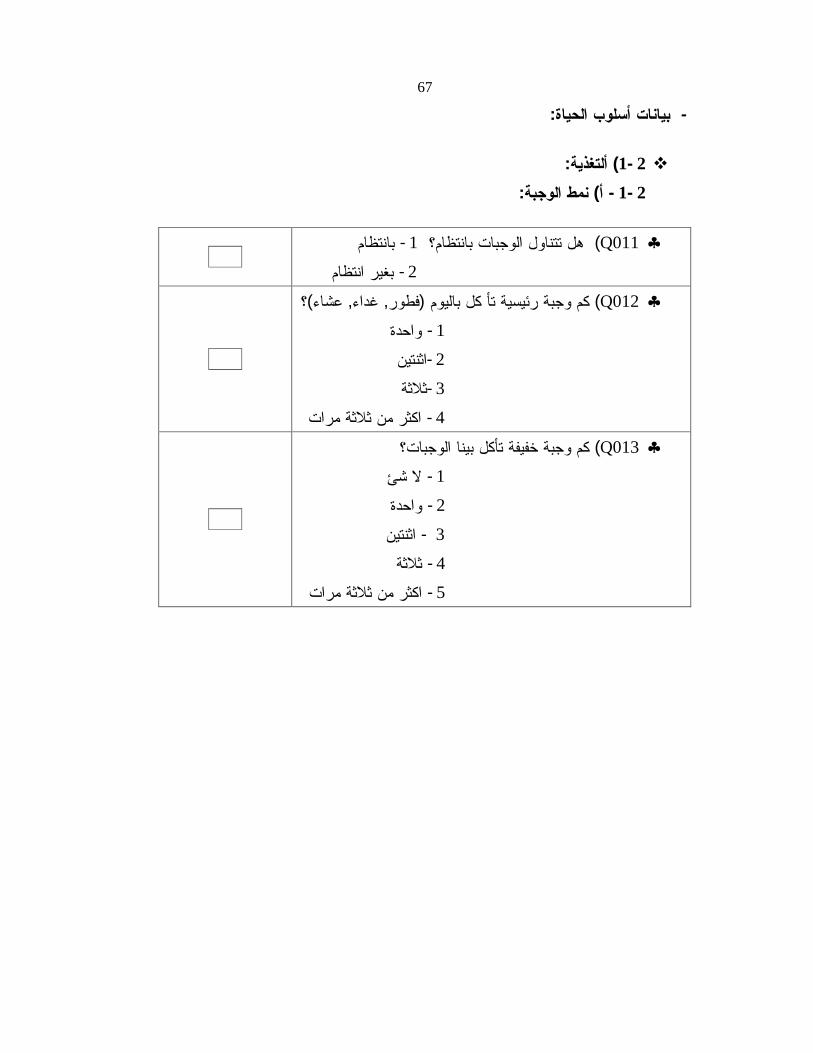
67
-:
2-1(:
2-1-(:
Q011(1-
2-
Q012(),,(
1-
2-
3-
4-
Q013(
1-
2-
3-
4-
5-
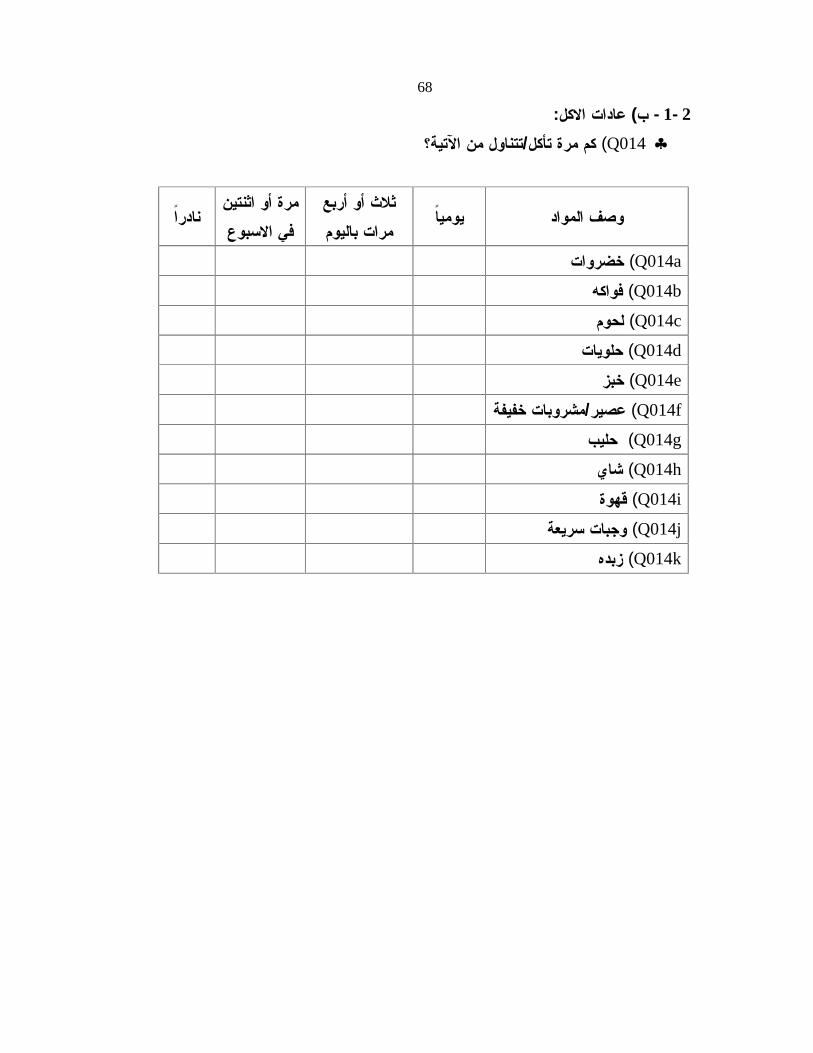
68
2-1-(:
Q014(/
Q014a(
Q014b(
Q014c(
Q014d(
Q014e(
Q014f(/
Q014g(
Q014h(
Q014i(
Q014j(
Q014k(
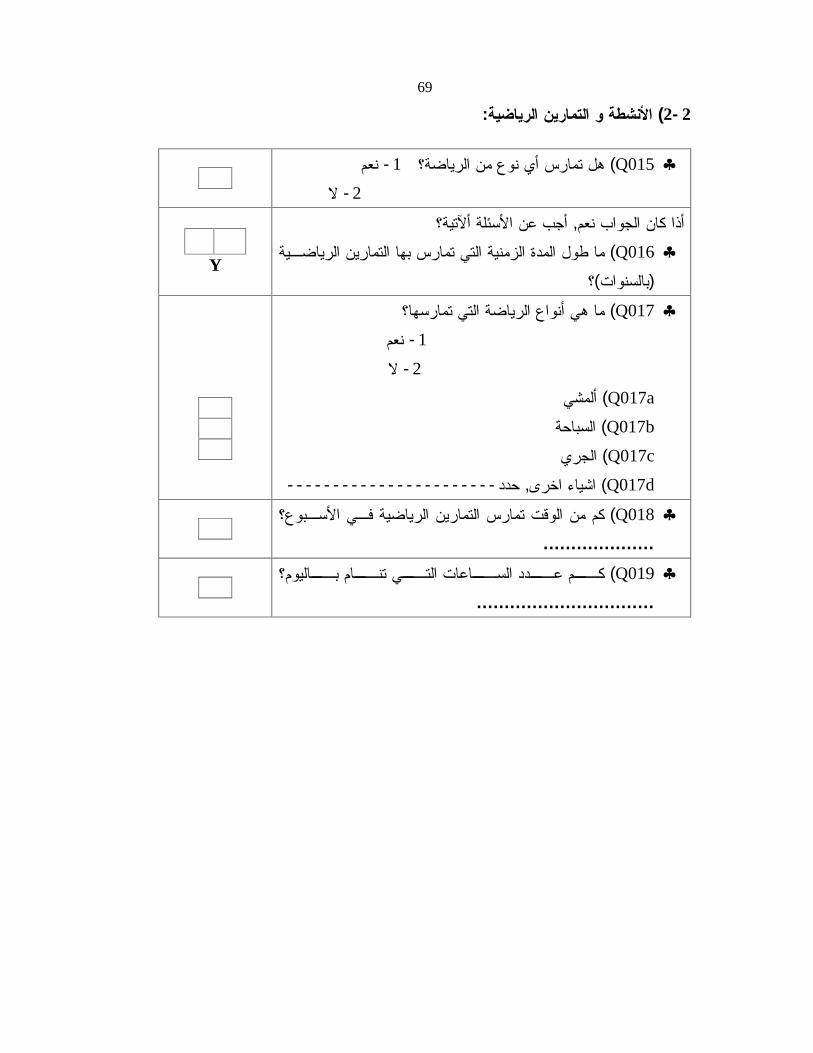
69
2-2(:
Q015(1-
2-
,
Q016(
)(
Y
Q017(
1-
2-
Q017a(
Q017b(
Q017c(
Q017d(,- - - - - - - - - - - - - - - - - - - - - - -
Q018(
....................
Q019(
................................
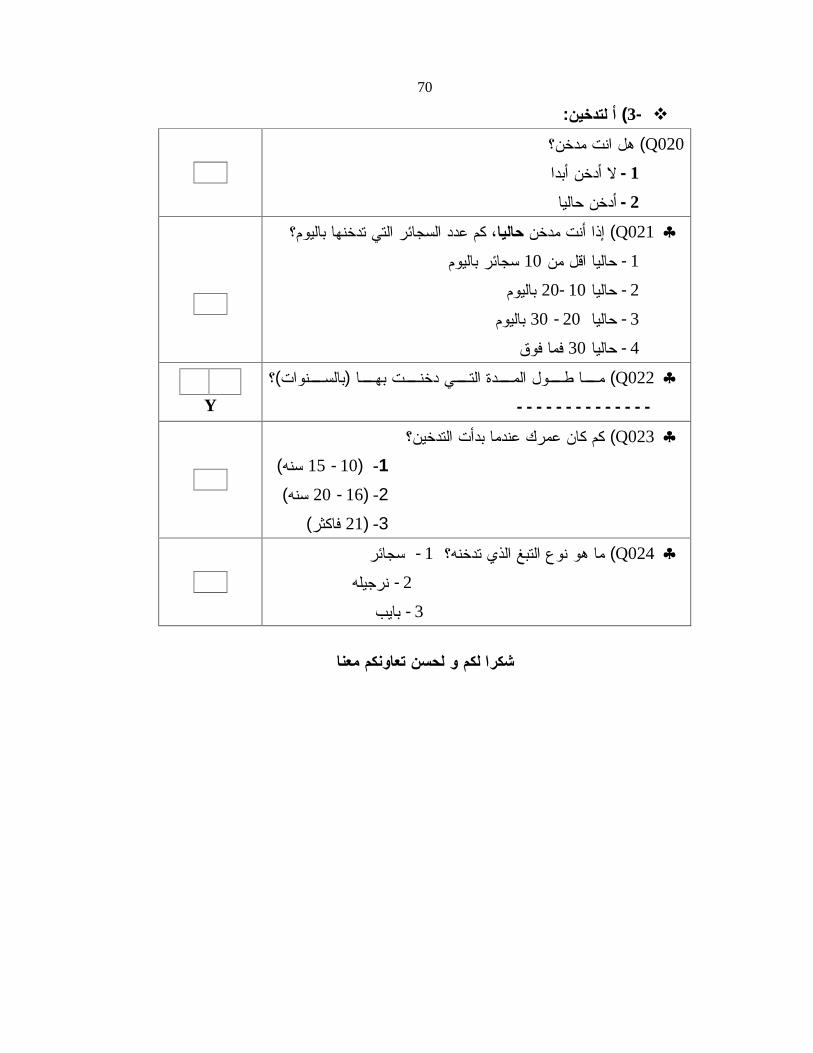
70
-3(:
Q020(
1-
2-
Q021(
1- 10
2- 10-20
3- 20-30
4- 30
Q022()(
- - - - - - - - - - - - - - Y
Q023(
1- )10-15(
2- )16-20(
3- )21(
Q024(1-
2-
3-
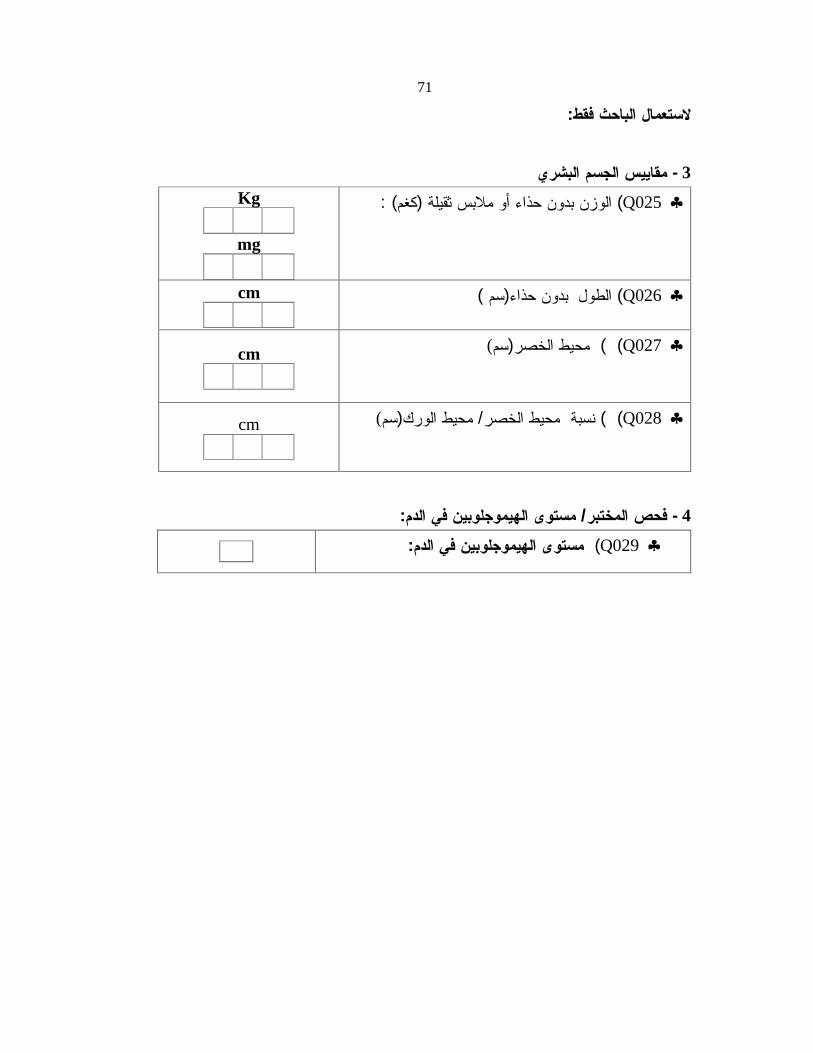
71
:
3-
Q025(): ( Kg
mg
Q026(
)(
cm
Q027( () (
cm
Q028( (/) (
cm
4-/:
Q029(:
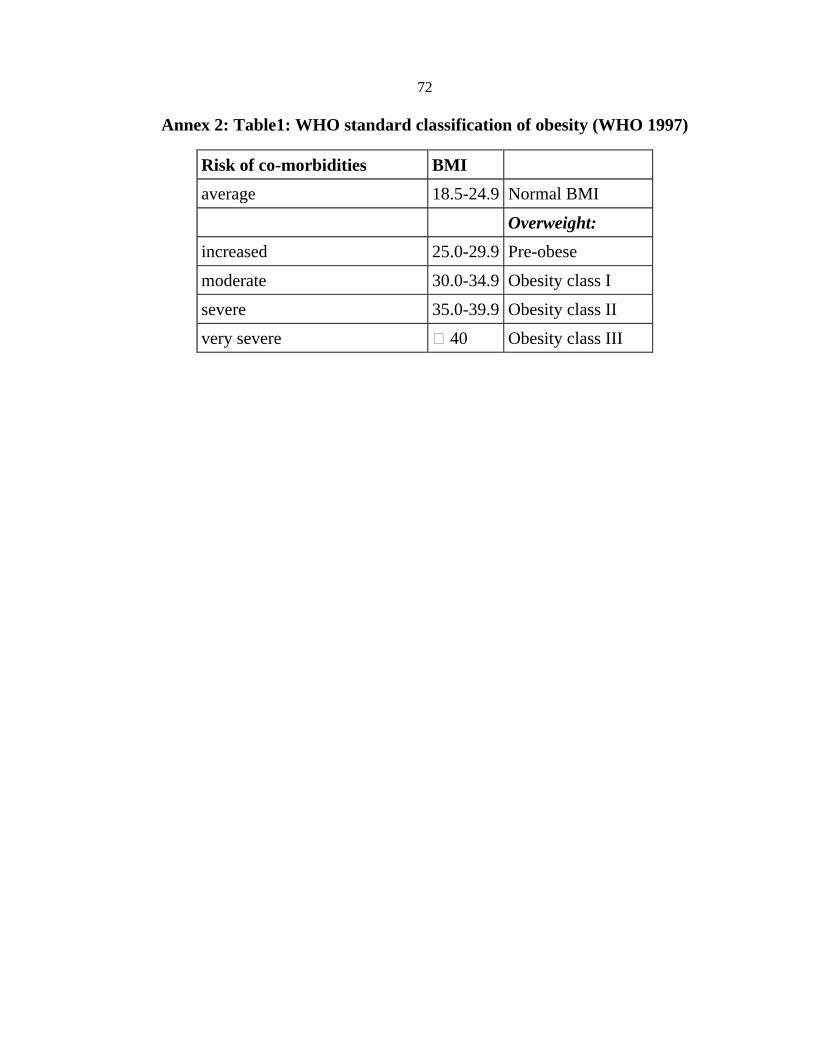
72
Annex 2: Table1: WHO standard classification of obesity (WHO 1997)
BMI Risk of co-morbidities
Normal BMI 18.5-24.9
average
Overweight:
Pre-obese 25.0-29.9
increased
Obesity class I 30.0-34.9
moderate
Obesity class II 35.0-39.9
severe
Obesity class III 40 very severe
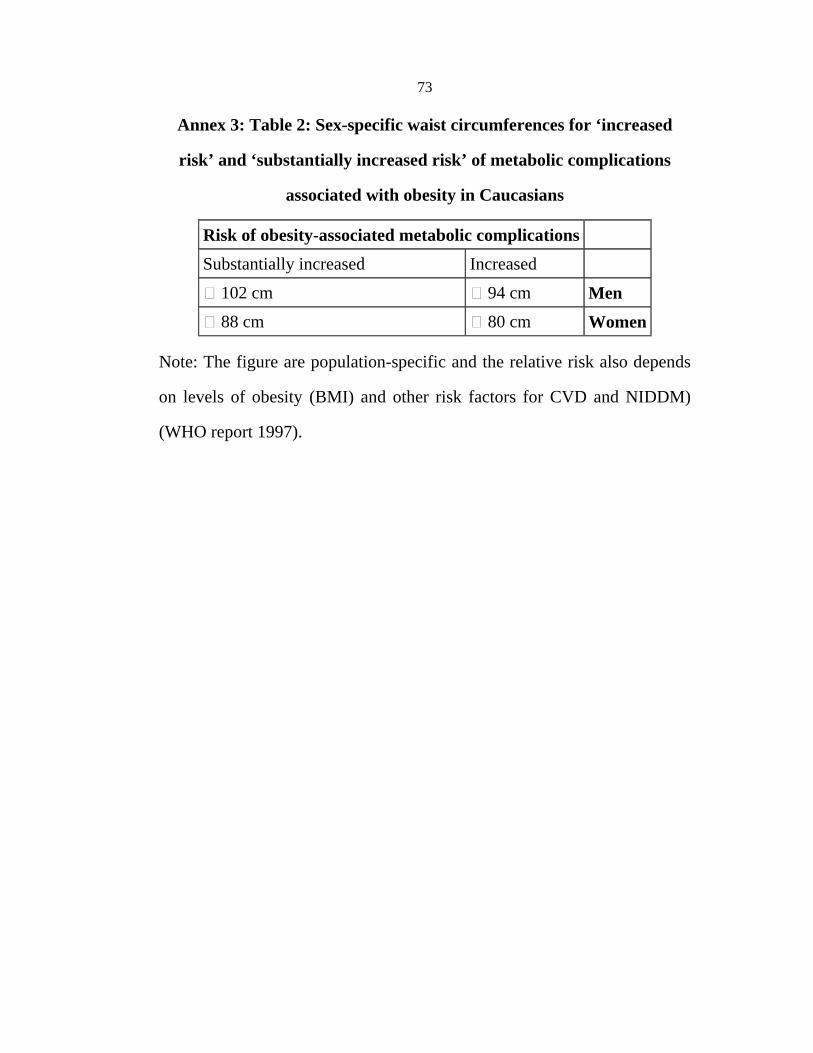
73
Annex 3: Table 2: Sex-specific waist circumferences for ‘increased
risk’ and ‘substantially increased risk’ of metabolic complications
associated with obesity in Caucasians
Risk of obesity-associated metabolic complications
Increased Substantially increased
Men 94 cm 102 cm
Women
80 cm 88 cm
Note: The figure are population-specific and the relative risk also depends
on levels of obesity (BMI) and other risk factors for CVD and NIDDM)
(WHO report 1997).
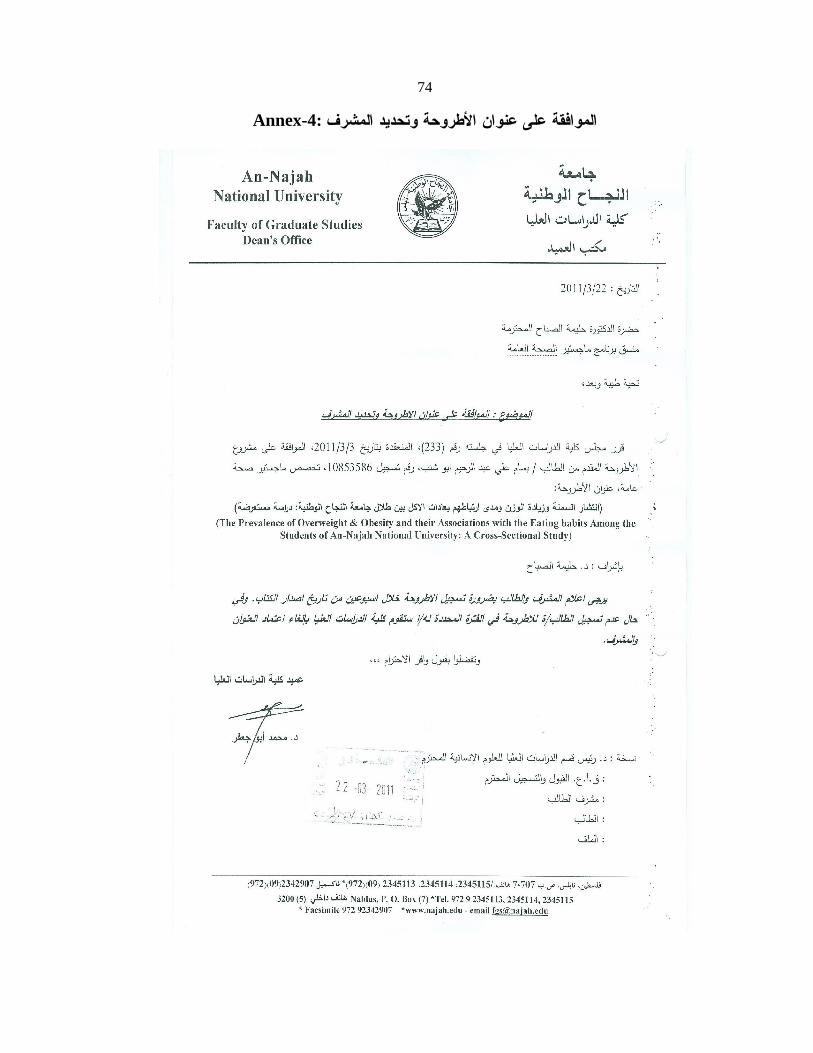
74
Annex-4:
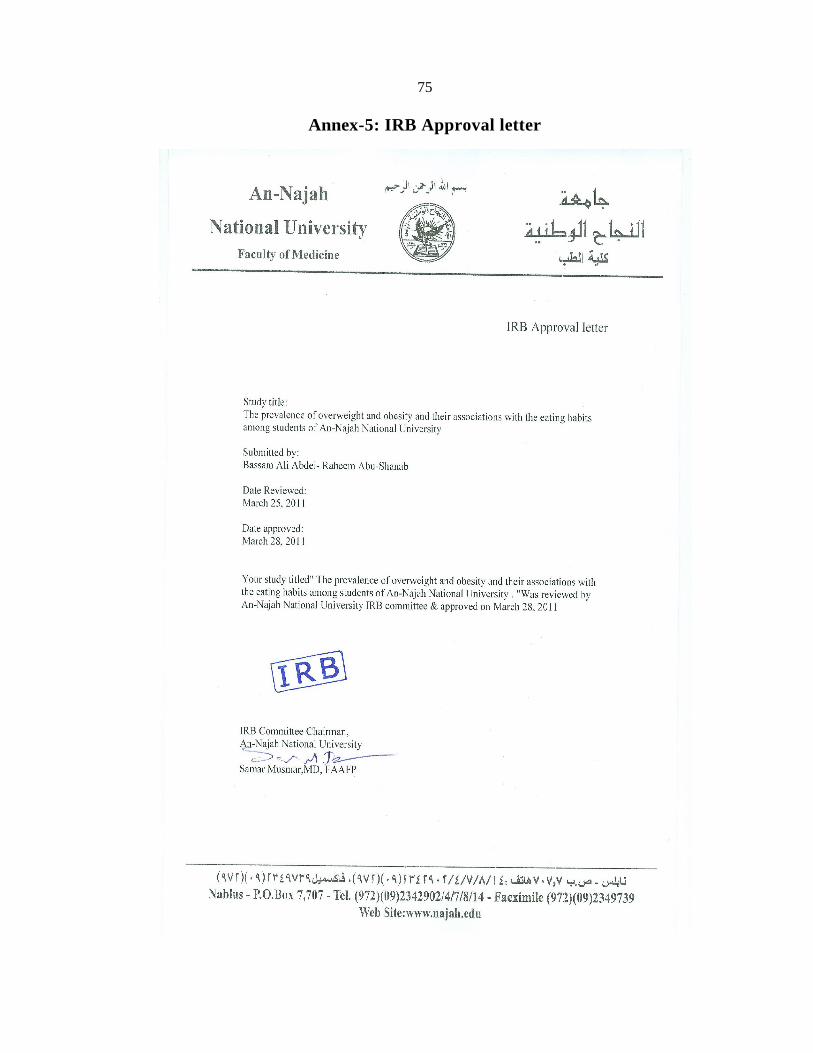
75
Annex-5: IRB Approval letter
76
Annex-6 /
77
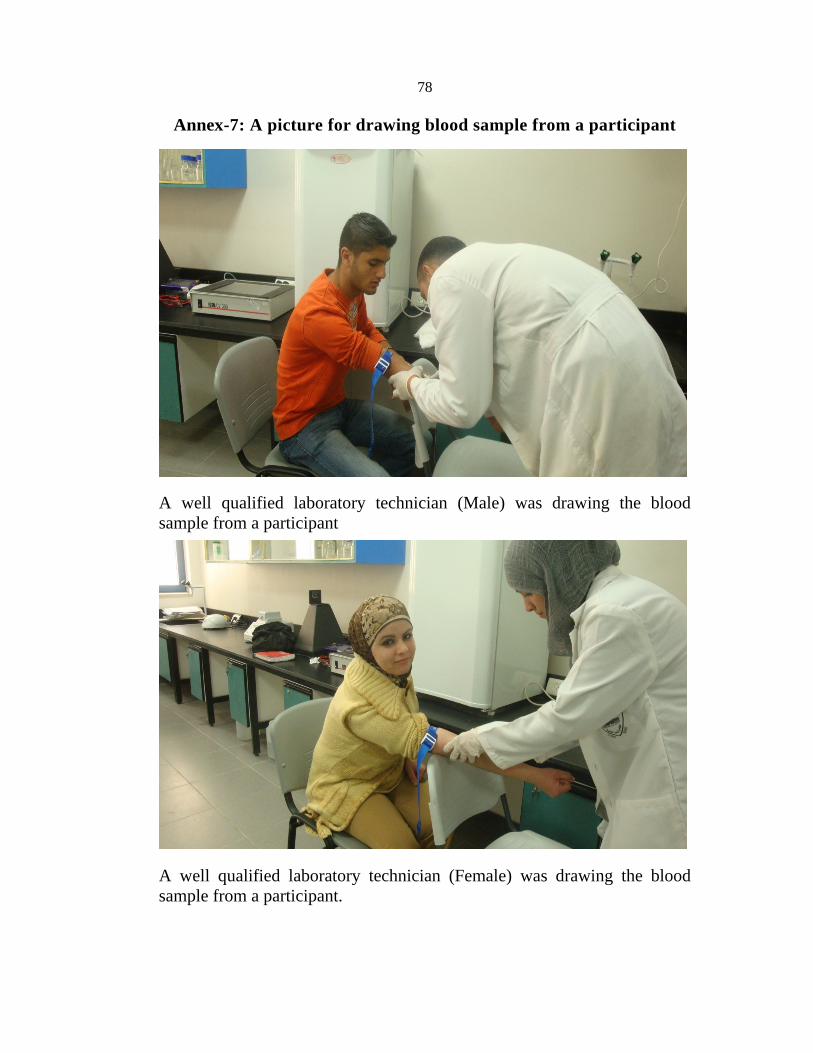
78
Annex-7: A picture for drawing blood sample from a participant
A well qualified laboratory technician (Male) was drawing the blood sample from a participant
A well qualified laboratory technician (Female) was drawing the blood sample from a participant.
:
.
2011
:
.
.
.
304)5050(
)(
:)152()152.(
2011.
.
..
.
.
(SPSS, V-15.)
.
)70.4()78.9
61.8(
)(20.14.6.
)27.05.9
13.23.3.()
(17.8%)23.0(
)12.5.(
13.8.)18.4()9.2.(
5.3
4.6.)68.4(
.
)69.1
55.930.944.1
.51.3
91.448.78.6
.(
58.2)57.259.2(43.4)40.8
46.7(.
.
)(
.
)(
..

This document was created with Win2PDF available at http://www.win2pdf.com.The unregistered version of Win2PDF is for evaluation or non-commercial use only.This page will not be added after purchasing Win2PDF.
Top Related