Prevalence of and Risk Factors for Childhood Overweight and Obesity

Faculty of Bioscience Engineering
Academic year 2014 – 2015
Prevalence of Obesity and Overweight among
School Children in Moshi Municipality,
Kilimanjaro, Tanzania
Josephine Thadeus Kimario
Promoter: Prof. dr. Bruno Lapauw
Master’s dissertation submitted in partial fulfilment of the requirements
for the degree of Master of Science in Nutrition and Rural Development,
Main subject Human Nutrition, Major Public Health Nutrition


i
Certification and Declaration
I, Josephine Thadeus Kimario, declare that this report is a result of my original work and has
not been presented to any other examination body in here and elsewhere. Acknowledgement
for other information sources used in this report has been properly referenced according to
methods that are accepted by Ghent University. Only author and promoter of this report deserve
the right to give permission for consulting and copying parts of this work for personal use. For
any other use is obliged by Copyright laws. Particularly when using results from this master’s
dissertation it is mandatory to specify the sources after having obtained a written permission.
Ghent University, June, 2015
Promoter
Prof. dr. Bruno Lapauw
Email: [email protected]
Author
Josephine Thadeus Kimario
Email: [email protected]
ii
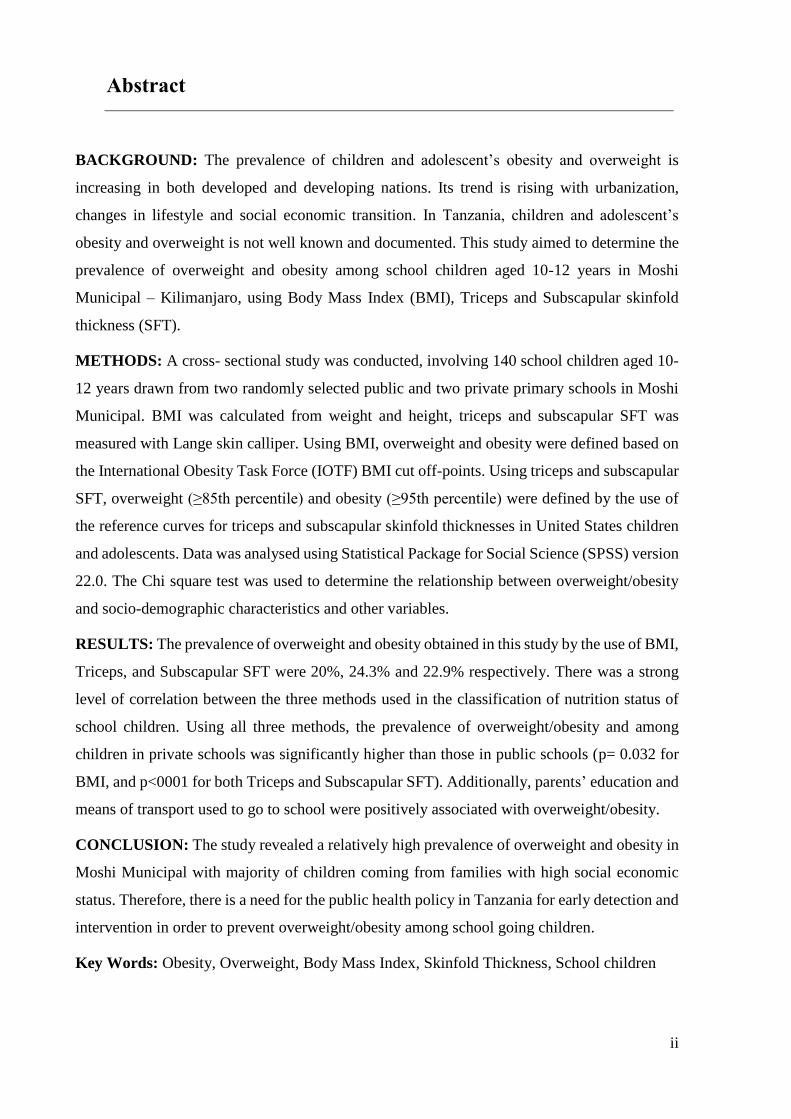
BACKGROUND: The prevalence of children and adolescent’s obesity and overweight is
increasing in both developed and developing nations. Its trend is rising with urbanization,
changes in lifestyle and social economic transition. In Tanzania, children and adolescent’s
obesity and overweight is not well known and documented. This study aimed to determine the
prevalence of overweight and obesity among school children aged 10-12 years in Moshi
Municipal – Kilimanjaro, using Body Mass Index (BMI), Triceps and Subscapular skinfold
thickness (SFT).
METHODS: A cross- sectional study was conducted, involving 140 school children aged 10-
12 years drawn from two randomly selected public and two private primary schools in Moshi
Municipal. BMI was calculated from weight and height, triceps and subscapular SFT was
measured with Lange skin calliper. Using BMI, overweight and obesity were defined based on
the International Obesity Task Force (IOTF) BMI cut off-points. Using triceps and subscapular
SFT, overweight (≥85th percentile) and obesity (≥95th percentile) were defined by the use of
the reference curves for triceps and subscapular skinfold thicknesses in United States children
and adolescents. Data was analysed using Statistical Package for Social Science (SPSS) version
22.0. The Chi square test was used to determine the relationship between overweight/obesity
and socio-demographic characteristics and other variables.
RESULTS: The prevalence of overweight and obesity obtained in this study by the use of BMI,
Triceps, and Subscapular SFT were 20%, 24.3% and 22.9% respectively. There was a strong
level of correlation between the three methods used in the classification of nutrition status of
school children. Using all three methods, the prevalence of overweight/obesity and among
children in private schools was significantly higher than those in public schools (p= 0.032 for
BMI, and p<0001 for both Triceps and Subscapular SFT). Additionally, parents’ education and
means of transport used to go to school were positively associated with overweight/obesity.
CONCLUSION: The study revealed a relatively high prevalence of overweight and obesity in
Moshi Municipal with majority of children coming from families with high social economic
status. Therefore, there is a need for the public health policy in Tanzania for early detection and
intervention in order to prevent overweight/obesity among school going children.
Key Words: Obesity, Overweight, Body Mass Index, Skinfold Thickness, School children
Abstract

iii
Acknowledgement
I express my deepest gratitude to my promoter Prof. dr. Bruno Lapauw for his support and
guidance during this research. I appreciate all the time and effort that he spent coaching me on
how to be a better researcher and writer.
I am eternally grateful to my course coordinators Ir. Anne-Marie Remaut-DeWinter and Marian
Mareen, for the support and endless advice throughout my studies. Also to all the professors
and other staff in the course of Human Nutrition and Rural Development for their guidance and
support.
Furthermore, I am thankful to Vlaamse Interuniversitaire Raad- University Development
Cooperation (VLIR-UOS) for providing the scholarship to do this master’s degree.
Finally, I am indebted to my beloved husband Anicet Vincent, my family members and friends
for their greatest dedication and encouragement during my studies in Belgium.
iv
Table of contents
CERTIFICATION AND DECLARATION ........................................................................... I
ABSTRACT ............................................................................................................................. II
ACKNOWLEDGEMENT ..................................................................................................... III
TABLE OF CONTENTS....................................................................................................... IV
LIST OF TABLES ............................................................................................................... VII
LIST OF FIGURES ............................................................................................................. VII
LIST OF ABBREVIATIONS ............................................................................................ VIII
CHAPTER 1: INTRODUCTION ........................................................................................... 1
1.1 Background ........................................................................................................... 1
1.2 Rationale of the study ........................................................................................... 2
1.3 Objectives ............................................................................................................. 3
1.3.1 Main objective ...................................................................................................... 3
1.3.2 Specific objectives ................................................................................................. 3
1.4 Research Questions ............................................................................................... 3
CHAPTER 2: LITERATURE REVIEW ............................................................................... 4
2.1 Prevalence of Childhood Overweight and Obesity .............................................. 4
2.2 Factors Contributing to Child Overweight and Obesity ....................................... 6
2.2.1 Behaviour factors .................................................................................................. 6
2.2.1.1 Dietary behaviour ........................................................................................... 6
2.2.1.2 Physical activity ............................................................................................. 7
2.2.1.3 Sedentary behaviour ....................................................................................... 8
2.2.1.4 Parenting style and Family socio-demographic characteristics ..................... 9
2.2.2 Environmental factors ........................................................................................ 10
2.2.3 Genetic factors .................................................................................................... 11
2.3 Assessment of Adult and Childhood Obesity ..................................................... 12
2.4 Consequences of Obesity .................................................................................... 13
2.4.1 Social effects ....................................................................................................... 13
2.4.2 Health effects ...................................................................................................... 13

v
2.4.3 Economic effects .................................................................................................. 14
2.5 Strategies towards School Children Obesity Prevention..................................... 15
CHAPTER 3: METHODOLOGY ........................................................................................ 17
3.1 Study Area ........................................................................................................... 17
3.2 Study Design ....................................................................................................... 17
3.3 Study Population ................................................................................................. 17
3.4 Sampling Technique ............................................................................................ 17
3.5 Data Collection .................................................................................................... 18
3.5.1 Anthropometric Measurements ........................................................................... 18
3.5.2 Questionnaires .................................................................................................... 18
3.6 Data Analysis ...................................................................................................... 19
3.7 Ethical Considerations ......................................................................................... 20
CHAPTER 4: RESULTS ....................................................................................................... 21
4.1 Demographic characteristics of study participants .............................................. 21
4.2 Prevalence of overweight and obesity among school children ........................... 23
4.3 Correlation between BMI and skinfold thickness measures in assessing Obesity
and overweight .................................................................................................... 25
4.4 Relationship between social demographic factors and weight status of school
children ................................................................................................................ 26
4.5 Physical activity and means of transport used to go to school ............................ 29
4.6 Relationship between obesity status of school children and physical activity and
means of transport used to and from school ........................................................ 30
4.7 School children sedentary behaviour and home/school chores activities ........... 32
4.8 Relationship between sedentary activity and home/school chores activities and
obesity status of the school children ................................................................... 34
4.9 School children dietary practices and behaviour ................................................. 36
4.10 Relationship between dietary practices and behaviour and obesity status of school
children ................................................................................................................ 36
CHAPTER 5: DISCUSSION ................................................................................................. 39
5.1 Prevalence of obesity and overweight among school children ........................... 39
5.2 Correlation between BMI and skinfold thickness measures in assessing Obesity
and overweight .................................................................................................... 41
5.3 Physical activity/sedentary activity and Obesity/overweight of school children 42
5.4 Dietary practices and school children obesity/overweight. ................................. 43
5.5 Strengths and Limitations of the study ................................................................ 44

vi
CHAPTER 6: CONCLUSION AND RECOMMENDATIONS ........................................ 45
REFERENCES ....................................................................................................................... 47
APPENDICES ........................................................................................................................ A1
Appendix 1 Demographic data and Physical Activity questionnaire .................................... A1
Appendix 2 Permission to conduct a study .......................................................................... A8
Appendix 3 Informed Consent Form ..................................................................................... A9
Appendix 4 Internation cutoff points for body mass index for overweight and obesity by Sex
between 2 and 18 years,defined to pass through the BMI of 25 and 30kg/m2 at age
of 18 years ......................................................................................................... A10
Appendix 5 Internation cutoff points for body mass index for thinness grades 1,2 and 3 by sex
for exact age between 2 and 18 years,defined to pass through the BMI of 16, 17,
and 18.5 at age of 18 years ............................................................................... A11
Appendix 6 Smoothed percentiles for Subscapular skinfold for age (mm): boys aged 1.50 –
19.99years ......................................................................................................... A12
Appendix 7 Smoothed percentiles for Triceps skinfold for age (mm): boys aged 1.50 –
19.99years ......................................................................................................... A13
Appendix 8 Smoothed percentiles for Subscapular Skinfolds for age (mm): girls aged 1.50 -
19.99years ......................................................................................................... A14
Appendix 9 Smoothed percentiles for Triceps skinfolds for age (mm): girls aged 1.50 – 19.99
years .................................................................................................................. A15

vii
List of Tables
Table 4-1 Demographic characteristics of study participants .......................................................... 21
Table 4-2 Descriptive statistics of age and anthropometric measurements of the school children . 22
Table 4-3 Comparison of BMI, Triceps SFT and Subscapular SFT between girls and boys .......... 22
Table 4-4 Medium BMI, Triceps and Subscapular according to type of school ............................. 23
Table 4-5 Nutritional status classification of school children aged 10-12 years using BMI, Triceps
SFT and Subscapular SFT ............................................................................................... 24
Table 4-6 Correlation between BMI and skinfold thickness ........................................................... 25
Table 4-7 Relationship between obesity status and social demographic characteristics ................. 28
Table 4-8 Comparison of Parents education and occupation between private and public primary
school .............................................................................................................................. 29
Table 4-9 School children physical activity and means of transport used to go to school .............. 30
Table 4-10 Relationship between type of school and means of transport used to go to school ........ 30
Table 4-11 Relationship between obesity status of school children and physical activity and mode
of transport used to go to school .................................................................................. 31
Table 4-12 School children sedentary behaviour and home/school chores activities ....................... 32
Table 4-13 Comparison length of time spend for physical activity, sedentary activity, screening and
home/house chores between Overweight/Obesity and Normal/Underweight children .. 33
Table 4-14 Relationship between sedentary activity and home/school chores activities and obesity
status of school children .................................................................................................. 35
Table 4-15 School children dietary practices and behaviour ............................................................. 36
Table 4-16 Relationship between dietary practices and behaviour and obesity status of school
children ............................................................................................................................ 37
Table 4-17 Adjusted relationship between type of school and school children overweight/Obesity 38
Figure 2-1 Infant and young child overweight trends from 1990 to 2015, by World Bank income
group ................................................................................................................................. 5
Figure 2-2 Conceptual Framework ................................................................................................... 11
Figure 4-1 Weight status using BMI, Triceps SFT and Subscapular SFT ........................................ 25
Figure 4-2 Relationship between BMI, Triceps and Subscapular SFT in assessing
overweight/obesity .......................................................................................................... 26
List of Figures

viii
List of Abbreviations
BIA
Bioelectrical Impedance
BMI Body Mass Index
HRQoL Health-related quality of life
IOTF International Obesity Task Force
YPAQ Youth Physical Activity Questionnaire
SFT Skinfold Thickness
SPSS Statistical Package for Social Science
WHO World Health Organization

1
1.1 Background
Childhood obesity and overweight is a health problem that needs effective approaches. Its
prevalence is becoming a threat to public health worldwide affecting both developed and
developing nations (Y. Wang & Lobstein, 2006). Obesity and overweight represent a
rapidly growing risk to the health of the people in an increasing number of countries (WHO,
2000). For many developing countries, obesity and its consequence have become a challenge
similar to hunger and under nutrition (Keding et al., 2013). Children and adolescent obesity is
progressively being observed with the improved technology which is associated with varying
lifestyle of families with increased purchasing power, luxurious living, increasing hours of
inactivity due to television, video games, and computers, which seems to substitute the outdoor
games and other social activities (Abdul-Rasoul, 2012; Singh & Sharma, 2005). The trend of
obesity and overweight is rising with urbanization, changes in lifestyle and social economic
transition. Social transition is considered to be among the causes of obesity and overweight in
which residing in cities provides more access to more fast foods and the emergence of people
with high economic income that can afford the fast foods, that is foods with high glycaemic
index ( Mosha & S Fungo, 2010; Y. Wang & Lobstein, 2006). In fast growing cities like Moshi-
Tanzania, children are more exposed to city culture with sedentary life style and high intake of
denser foods, soft drinks and less nutritious foods.
Recently there is an increasing prevalence of childhood obesity (5-19years) due to rapidly
changing of dietary practices and a sedentary lifestyle in developing countries (Gupta et al.,
2012). Prevalence of childhood overweight and obesity worldwide has increased from 4.2% in
1990 to 6.7% in 2010 (De Onis et al., 2010).The trend is anticipated to reach 9.1% in 2020. The
estimated prevalence of childhood overweight and obesity in Africa in 2010 was 8.5% and is
expected to reach 12.7% in 2020.
Physical and psychological health of the child is highly affected by overweight and obesity, its
mechanism is not well understood and it’s believed to be disorder of multiple causes. The
prevalence of obesity has risen due to environmental factors, lifestyle preferences and cultural
environment. It’s assumed to be as result of increasing caloric and fat intake. Overweight and
obesity are the result of caloric imbalance, too few calories expended for the amount of calories
Chapter 1: Introduction

2
consumed (Dehghan et al., 2005). Excessive sugar intake through soft drinks, overconsumption
of calories and reduced physical activity play a major role in increasing the rate of obesity all
over the world. According to experimental and observational studies, both diet and physical
activity have a positive effect on decreasing obesity. The parents have an important role in
controlling the diet and physical activity of their children as a means of controlling their weight
(Dehghan et al., 2005)
In clinical and epidemiologic studies, BMI and SFT are widely used to measure adiposity. The
85th and 95th percentiles of BMI and SFT are frequently used to define overweight and obesity
respectively (Luis B Sardinha, Going, Teixeira, & Lohman, 1999). The BMI has become the
standard reliable indicator of overweight and obesity meanwhile yet it is incomplete. BMI relies
on body weight alone, and it does not measure fat directly, therefore misclassifies athletic
adolescences as obese by using BMI. It is much preferred as it is easy and quick to perform,
however, without consideration of the complex factors that influence obesity. World Health
Organization (de Onis & Habicht, 1996) recommended body mass index (BMI) and triceps and
subscapular SFT as the anthropometric methods to assess the weight status of children and
adolescents.
1.2 Rationale of the study
Prevalence of children and adolescent’s obesity and overweight in Tanzania is not well known
by the health specialist and the policy makers, as there is no enough data that documents the
problem. Few studies have been done in a few areas such as Dar es Salaam, Dodoma, Njombe
and Morogoro but they cannot be used to generalize the whole country. To develop control
strategies, the prevalence and causes of these problems should be well documented. Children
are a priority group for intervention strategies for prevention of obesity because more potential
interventions strategies for children are available compared to adults. This is due to difficulties
in reducing excessive weight in adult once it becomes customary. Furthermore, overweight and
obesity in children have significant influence on both physical and psychological health.
In Kilimanjaro there is no study that has been done concerning overweight and obesity among
school children. This study aims at determining the prevalence of overweight and obesity
among school children aged 10-12 years in Moshi municipal using BMI cut off points for
defining child overweight and obesity published by IOTF in 2000 (Cole, Bellizzi, Flegal, &
Dietz, 2000). These were obtained from sex-specific curves that document through a BMI of
25 kg/m2 and 30 kg/m2 by age 18 years, for overweight and obesity respectively. The study also

3
used Triceps and Subscapular SFT to determine the nutrition status of the children in the study
area. Reference curves for triceps and subscapular skinfold thickness in United States children
and adolescents were used to classify children as overweight (≥85th percentile) or obese (≥95th
percentile) (Addo & Himes, 2010b). This was developed using the same national samples as
those that was included in the reference curves for BMI in the Centres for Disease Control and
Prevention 2000 Growth Charts.
1.3 Objectives
1.3.1 Main objective
To determine the prevalence of overweight and obesity among school children aged 10-12 years
in Moshi Municipality - Kilimanjaro
1.3.2 Specific objectives
1. To assess nutritional status of school children aged 10-12 years in Moshi-Kilimanjaro
using skinfold thickness (SFT) and Body mass index (BMI);
2. To assess how the level of physical activity/sedentary behaviour is linked to
overweight and obesity of school children (10-12years) in Moshi-Kilimanjaro;
3. To assess how obesity and overweight differ in public and private primary school
children in Moshi Municipal.
1.4 Research Questions
1. Is there a relationship in determination of overweight and obesity in school children by
using skinfold thickness (SFT) and Body mass index (BMI)?
2. Is the prevalence of overweight and obesity among private school children different
from that of public school children?
3. Does physical activity/sedentary behaviour associate with overweight and obesity?

4
Chapter 2: Literature Review
2.1 Prevalence of Childhood Overweight and Obesity
The prevalence of childhood overweight/obesity has significantly increased in recent years, this
has been documented in developed countries whereas data from the developing coutries are
scarce (Muthuri et al., 2014). For the few developing countries where studies have been done
the prevalence is also increasing. Prevalence of obesity and overweight for both adult and
children has increased significantly in the past three decades. There is a great disparities across
countries in the levels and trends with distinct county patterns (Ng et al., 2014). People in all
socio-economic groups, in both developed and developing countries, irrespective of age, sex or
ethnicity are affected by obesity. Worldwide childhood obesity estimates projected that over 22
million children under the age of 5years are severely overweight, and one in 10 children is obese
(Kosti & Panagiotakos, 2006).
Recently there has been an increasing prevalence of childhood obesity (5-19years) due to
rapidly changing of dietary practices and a sedentary lifestyle in developing countries: 41.8%
in Mexico, 22.1% in Brazil, 22.0% in India, and 19.3% in Argentina. Secular trends indicate
increasing prevalence rates in these countries: 4.1 to 13.9% in Brazil during 1974 –1997, 12.2
to 15.6% in Thailand in 1991–1993, and 9.8 to 11.7% in India in 2006 –2009 (Gupta et al.,
2012). Prevalence of childhood overweight and obesity worldwide increased from 4.2% in 1990
to 6.7% in 2010. The trend is anticipated to reach 9.1% in 2020. The estimated prevalence of
childhood overweight and obesity in Africa in 2010 was 8.5% and is expected to reach 12.7%
in 2020 (De Onis et al., 2010).
Globally, in 2013 the prevalence of overweight and obesity in children in developed countries
was 23·8% for boys and 22·6% for girls. However in developing counties the prevalence was
12.9% and 13.4% for boys and girls respectively (Ng et al., 2014). A systematic review
investigating the evidence of overweight/obesity transition occurring in school-aged children
and youth in Sub Saharan Africa found the average of overweight/obesity and obesity to be
10.6% and 2.5% respectively (Muthuri et al., 2014). The prevalence of obesity/overweight was
higher in children living in urban and those of higher social economic status compared to those
of lower socioeconomic status and living in rural areas.

5
In European region about 20% of children and adolescents are overweight of which a third of
these are obese (Branca et al., 2007). In 2007 the childhood obesity was 10 times higher than
that of 1970 in European region, predicting high adult epidemic that will creat future health
challenge for the coming generation. The overweight prevalence rate in many of the Eastern
Europe countries has increased over the time period of 2002 to 2010 (Ahluwalia et al., 2015).
One of the study done in Tanzania that used the IOTF cut-off points to classified the school
children aged 7-14 years as obese or overweight in Kinondoni District, Dar-es-salaam found
the prevalence of overweight and obesity to be 10.2% and 4.5% respectively (Mwaikambo,
2012). Another study conducted in 2010 to determine prevalence of overweight and obesity
among children aged 6-12 years in Dodoma and Kinondoni municipalities reported prevalence
of obesity among children aged 6 - 9 years in Dodoma and Kinondoni to be 5.6% and 6.3%
respectively. Likewise, 4.2% of children aged 6-9 years in Dodoma were overweight while
8.6% in Kinondoni municipality were overweight. For children aged 10-12 years, 3.9% in
Dodoma were obese compared to 5.8% in Kinondoni whereas 4.9% of the children of the same
age in Dodoma were overweight compared to 5.8% in Kinondoni. (Mosha & S Fungo, 2010).
The study categorized children as overweight or obese based on WHO cut-offs and body fat
mass measurements by using bioelectrical impedance (BIA).
Alwan (2011) found a sharp rise in overweight among infants and young children in lower-
middle-income countries but higher prevalence in the upper middle-income (Alwan, 2011).
Figure 2-1 below shows the trend of infant and children overweight trend as from 1990 to 2015.
Figure 2-1 Infant and young child overweight trends from 1990 to 2015, by World
Bank income group
Source : (Alwan, 2011)

6
2.2 Factors Contributing to Child Overweight and Obesity
Generally, childhood obesity is believed to be caused by a wide range of interrelating factors
operating at multiple levels. This includes; the school environment, sociocultural factors, family
and individual behaviour and factors related to macro-level policy influences (Mohammadpour-
Ahranjaniet al., 2014).
2.2.1 Behaviour factors
Behaviour is believed to be one of the factor that cause person to become overweight or obese. It
comprises the following;
2.2.1.1 Dietary behaviour
This include consumption of fast food or drinks, frequency of fast food consumption, taste,
quick access and peer influence, large portion size, unhealthy food, eating away from home,
and regular drinking of sugar-rich beverages (Patterson et al., 2012). Skipping of breakfast,
consumption of less than three meals per day, low intake (low serving per day) of fruits,
vegetables, milk and milk products. All these revealed to be predictors of overweight and
obesity among school children (Amin et al., 2008; Antonogeorgos et al., 2012). Childhood
obesity in countries with limited resources and food availability is favoured by good socio-
economic status of their parents while still insufficient nutrition education is available (Kouéta
et al., 2010). Eating behaviour of the children is influenced by the availability of food, peers,
siblings and parent’s behaviour and child-feeding practices. (Birch & Fisher, 1998).
Fruits and vegetables intake has shown to be associated with overweight and obesity in children
and adolescents. This indicates that sufficient fruits and vegetables intake can help maintain
healthy weight status (Bes-Rastrollo et al, 2006). A recommended levels of fruits and
vegetables consumption has suggested to help reduce obesity, this is due to their bulk and low
energy density that are believed to reduce energy-dense food consumption as they are low in
fat, calories, and added sugar while having high concentrations of nutrients and fibres (Rolls et
tal., 2004). Fruits and vegetables have high amount of water and fibre content that may help
feel full and increase satiety at a meal while consuming fewer calorie hence being considered
as a good substitutes for foods. Children aged 10-12 years that consume breakfast daily was
found to be have lower chance of being overweight/obese (Antonogeorgos et al., 2012; Manios
et al., 2014). Breakfast, fruits and vegetables are to be emphasized in promoting a healthy diet
and weight status.

7
2.2.1.2 Physical activity
Obesity is mainly explained by a prolonged positive energy imbalance due to increased energy
intake and decreased spending. Physical activity determine number of calories that are spent or
stored in the body as fat. It maintain healthy weight status because of its potentially major
impact on body composition, metabolism, and increasing energy expenditure (Nowicka &
Flodmark, 2007). Physical activity not only has benefits that are associated with obesity but
also reduces risk for cardiovascular diseases and diabetes, reduces blood pressure, depression
and osteoporosis, improves the level of high density lipoprotein cholesterol and control of blood
glucose in overweight people. It further reduces systemic inflammation and blood coagulation,
reduces the risk for colon cancer and breast cancer among women, and promote autonomic tone
and improve cardiac and endothelial function (Warburton et al., 2006; Nowicka & Flodmark,
2007).This reveal that effective physical activity prevents both primary and secondary chronic
diseases and premature death.
Sports has been considered as the lowest physical activity practiced by children. Outdoor play
and sports in children has been substituted by video games, televisions, computers, and mobile
devices which make a child to be physically inactive thereby increasing the risk of becoming
overweight/obese (Kelishadi et al., 2003). Shortage of safe spaces for children to play and
perform sports, lack of parents’ time and family low income are the factors that influence
childhood obesity (Yamamoto-Kimura et al., 2012).
It has been noticed that the diet and the level of physical activity of children is highly affected
by what they do at school, home, as well as in the community. In helping obese child or
adolescent in weight management it is not required to suggest structured exercise programs,
more emphasis will be on how to live an active lifestyle such as reducing sedentary behaviour,
encouraging everyday activities and sports, emphasizing the importance of physical education
class at school, increasing the variety of activities and encouraging spontaneous play and
hobbies (Nowicka & Flodmark, 2007). Physical activity of children and adolescents varies with
age, type of exercise and setting. In order to maintain or improve children’s and adolescent’s
health (5-17 years old), a minimum of 60 minutes of regular, moderate-intensity physical
activity is recommended by World Health Organization recommends (WHO, 2010). Physical
activities should be done on daily basis at family and school settings and it also include the
community activities, which includes play, games, sports, physical education, and recreation.

8
In a systematic review of the evidence base for health and physical activity in school-age
children by Strong and colleagues recommended 60 minutes or more of physical activity, which
can be achieved collectively in school during physical education class, as well as before and
after school hours (Strong et al., 2005), this suggested that unsupervised activities can be the
best option in making the children more active. A greater amount of physical activity would be
necessary to attain health benefits effects and behaviour outcome in daily environments.
Unstructured play proved positive effects on child development, through improving physical
fitness, for optimal development of all tissues and organs (Nowicka & Flodmark, 2007).
Children develop movement skills and feel safer through playing which can improves their self-
esteem. They learn social skills when playing with others, thereby expanding their cognitive
skills. On the other hand a planned, structured, and repetitive exercise (aerobic, strength training
or both), has been found to reduce the body fat percentage in overweight and obese children
and adolescents (Kelley & Kelley, 2013).
2.2.1.3 Sedentary behaviour
Any activity which is measured by an energy expenditure ≤ 1.5 metabolic equivalents and a
sitting or reclining posture is termed as sedentary activity. It include TV viewing, playing video
game, computer use collectively called “screen time”, driving automobiles, and reading,
excessive sitting–lying down, or a combination of both (Cart, 2012). All these indicate lack of
physical activity. It has been evidenced by various studies that decreasing sedentary time is
associated with lower health risk in children and youth. To overcome this, screening time should
be restricted to not more than 2 hours per day, more than 2 hours is associated with reduced
physical and psychosocial health, and can lead to higher BMI. Also sedentary time can be
reduced by limiting motorized transport, time spent indoors and prolonged sitting time
(Tremblay et al., 2011).
Significant association between screen time and obesity in children aged 6- 12 years has been
observed, where children who spent less than two hours per day on screen time were at less risk
of becoming overweight or obese, compared with those who spent more than three hours per
day (Li et al., 2015). This association was also observed in the study which was assessing the
prevalence and risk factors of overweight among 5- to 11 year old schoolchildren in Narbonne,
France. (Padilla et al., 2011). High level of sedentary activities more than four hours per day

9
together with a limited exercises has also found to lead to overweight and obesity among school
children in urban cities in Bangladesh (Bhuiyan et al., 2013).
Sleep deprivation plays a main part in obesity in children. Sleeping less than 10 hours per night
(short sleep duration) are the risk factors for overweight and obesity in children. (Padilla et al.,
2011); (Owens et al., 2014). Short sleep duration is associated with television viewing,
computer use and late bedtime (de Jong et al., 2012) and increased food intake (Chaput &
Tremblay, 2012). To attain optimal health, school aged children should sleep at least ten hours
per day. In order to attain high demand of physical, emotional and sexual development, the
sleeping time of children and adolescents should be increased (Koss et al., 2015).
The physical activity and walking to school duration are significantly correlated with body mass
index. Rural children have high prevalence of obesity and overweight than the urban children
because of lower physical activity and less time spent walking to school (Itoi et al., 2012).
Frequently walking or cycling to school makes children more active than the using school
buses or private cars (van Sluijs et al., 2009). Participating in home and school chore is another
way that makes a child/adolescent active (Laxmaiah et al., 2007). The prevalence of overweight
and obesity was found significantly lower to those children who participate in household chores
for more than three hours per day.
2.2.1.4 Parenting style and Family socio-demographic characteristics
Parenting style and family socio-demographic characteristics has an effect on the children’s
healthy behaviour (Berge et al., 2010; Berge et al., 2010; Chen & Kennedy, 2004; Halliday
et al., 2013). Poor family functioning is linked with increased risk of overweight and obesity in
children and adolescents (Halliday et al., 2013). This includes poor communication, poor
behaviour control, and high levels of family conflicts, low family hierarchy values and
unstructured parenting. Children spend long hours away from home hence learning some of
their behaviour outside home. Directives from the parents may boost or limit children’s
consumption of several food which may affects the development of food preference together
with the modification of energy intake (Birch & Fisher, 1998). A study of Verloigne et al.,
(2012) found that lenient parenting style was associated with the risk factors for children
overweight and obesity, such as less breakfast and more soft drink consumption.
Relationship between cultural and socio-economic characteristics of the parents and the
children’s obesity and overweight has been shown by some studies. Some showed that the

10
children with parents with higher education level (university degrees and high school diplomas)
and with more highly qualified occupations had a lower likelihood of being overweight/obese
than of children with lower education and less qualified occupation (Albertini et al., 2008; Posso
et al., 2014). Contrary one of the systematic review which was reviewing the evidence of
overweight/obesity transition among school-aged children and youth in Sub Saharan Africa
(Laxmaiah et al., 2007; Muthuri et al., 2014) found the higher prevalence of overweight and
obesity in children of higher social economic status compared to those of lower socioeconomic
status. Another study in the United States, revealed that adults with low and medium income
and less qualified occupation were more at risk of obesity and overweight, where this led to a
large risk to their children due to their influence on the family diet and lifestyle (Drewnowski
& Darmon, 2005). This is because the lower cost of refined grains, added sugars, and added
fats compared to that of more nutrient dense, fish, lean meats, fresh vegetables, and fruit
whereby the people with low income and less qualified occupation cannot afford.
Rising income in low income countries, is connected with increasing rates of overweight among
infants and young children whereas in high-income countries, higher prevalence is found more
among people with lower socioeconomic status (Alkali et al., 2015; De Silva et al., 2015; Y.
Wang, 2001).
Family size seemed to have an association with children’s overweight and obesity. It was
observed that children with higher children BMI was related with small family size (Gulliford
et al., 2001).
2.2.2 Environmental factors
Children are the vulnerable group highly influenced by surrounding environment and by other
children. The current environment in homes, schools, and neighbourhoods tend to discourage a
healthy lifestyle (Penney et al., 2014). The external food environments and access to fast food
restaurants, food stores, supermarkets, in schools, or recreation and sports sites, are
characterized by energy dense, nutrient-poor food items which may play a part in increasing
weight status of an individual (Bodor et al., 2010). The consumption of food rich in fat, sugar
and energy may be influenced by the environment where the food are present and consumed by
peer and the family (Birch & Fisher, 1998; Penney et al., 2014).
World health organization (WHO, 2008) reported that several environmental factors including
low air quality, pollution, and high density traffic, lack of parks, sidewalks, violence and
11
absence of recreational facilities due to increased urbanization might discourage participation
in physical activity in both adult and children thus increasing the rate obesity and overweight.
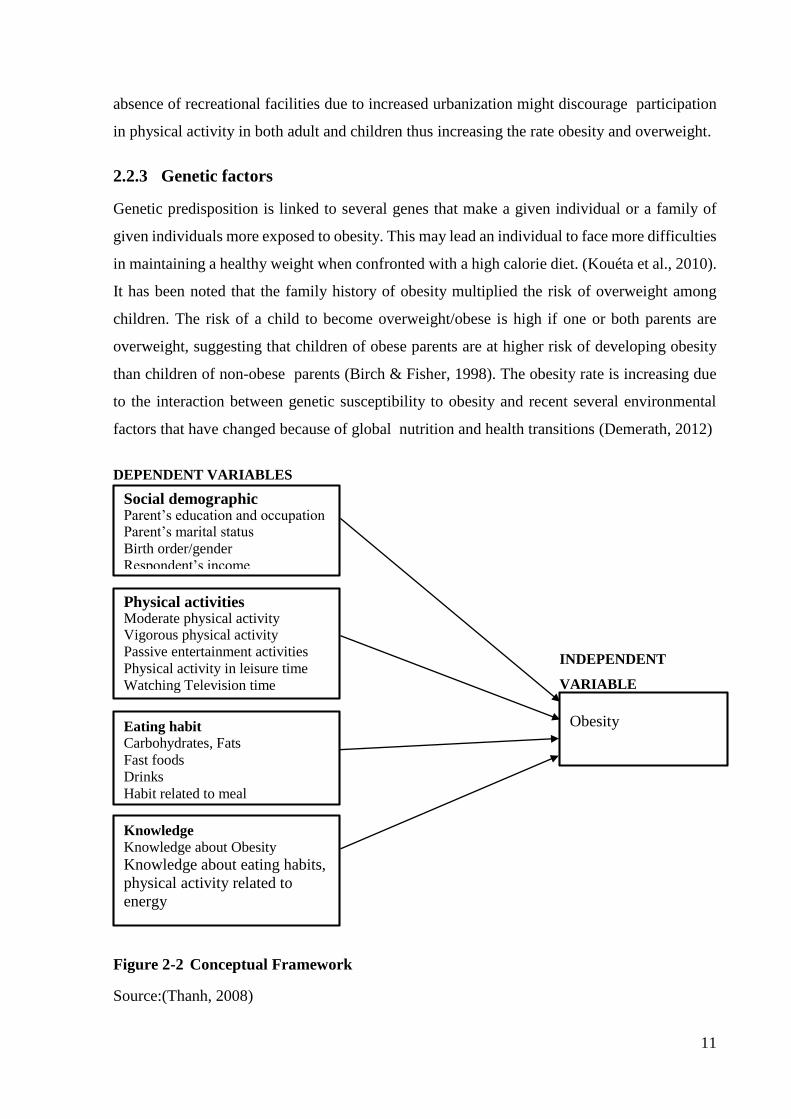
2.2.3 Genetic factors
Genetic predisposition is linked to several genes that make a given individual or a family of
given individuals more exposed to obesity. This may lead an individual to face more difficulties
in maintaining a healthy weight when confronted with a high calorie diet. (Kouéta et al., 2010).
It has been noted that the family history of obesity multiplied the risk of overweight among
children. The risk of a child to become overweight/obese is high if one or both parents are
overweight, suggesting that children of obese parents are at higher risk of developing obesity
than children of non-obese parents (Birch & Fisher, 1998). The obesity rate is increasing due
to the interaction between genetic susceptibility to obesity and recent several environmental
factors that have changed because of global nutrition and health transitions (Demerath, 2012)
DEPENDENT VARIABLES
INDEPENDENT
VARIABLE
Figure 2-2 Conceptual Framework
Source:(Thanh, 2008)
Social demographic Parent’s education and occupation Parent’s marital status
Birth order/gender
Respondent’s income
Physical activities Moderate physical activity Vigorous physical activity
Passive entertainment activities
Physical activity in leisure time
Watching Television time
Eating habit
Carbohydrates, Fats
Fast foods
Drinks
Habit related to meal
Knowledge
Knowledge about Obesity
Knowledge about eating habits,
physical activity related to
energy
Obesity

12
2.3 Assessment of Adult and Childhood Obesity
Obesity and overweight in adult are often determined using the BMI. Adults are classified as
obese or overweight by a variety of cut-off values. The World Health Organization has
published specific BMI criteria for overweight and obesity in adults. A BMI value of 25-29.9
kg/m² indicates overweight whereas a BMI value of 30 kg/m² and above indicates obesity. The
classes of obesity is further classified into class I (BMI 30-34.9 kg/m²), class II (BMI 35-39.9
kg/m²) and BMI > 40 kg/m² as class III (WHO, 2000) The intra-abdominal fat is estimated
through waist circumference and the waist hip circumference ratio, these are regularly used to
predict the health risk of obesity in adults.
It is difficult to measure obesity in children and adolescents by using only BMI. This is largely
because they are growing as there is an increase in weight for height, sexual maturation and the
changing body composition. BMI in children changes consequently with age as it rises during
infancy, falls during the preschool years and rises again during adolescences and early
adulthood (WHO, 2000). If the child has a high weight before the age of six, the child has all
the risks of being obese in adulthood (Kramoh et al., 2012). Also BMI changes in children
differs between boys and girls, in this case Age- and sex specific reference curves are used to
assess fatness in children and adolescents (Cole et al., 2000). IOTF cut-off points for classifying
children as obese or overweight were obtained from sex-specific curves that determined that a
BMI of 25kg/m2 and 30kg/m2 by age 18years, for overweight and obesity, respectively
BMI measures excess weight instead of excess body fat (Freedman et al., 2007). Its pattern
reflect actual changes in body weight and early in life it is an indicator of later development
(Rolland-Cachera, 1993). Various methods have been a to assess adiposity in children including
absolute weight, weight for height percentiles, percent of ideal body weight, body mass index
and skinfold thickness (Sarria et al., 1998). World Health Organization (de Onis & Habicht,
1996) recommended BMI and Triceps and Subscapular SFT as the anthropometric methods to
assess the weight status of adolescents.
The best estimators of body density in the children and adolescents studied were a combination
of BMI and SFT. SFT are used as a good predator of total body fat (adiposity) in children and
adolescences which provides a good estimate of obesity and body fat distribution, (Nooyens et
al., 2007);Ahmad et al., 2013; Rolland-Cachera, 1993).

13
The most common sites that are used are subscapular and triceps SFT measurements. The
triceps SFT measures percentage fat while subscapular SFT determines the internal body fat
(Rolland-Cachera, 1993). BMI during adolescence is predictive of BMI at adult age but it
cannot differentiate between lean and fat body mass, in this case SFT is suggested to be a better
predictor of body fatness and obesity (Himes et al., 1980; Nooyens et al., 2007). BMI is more
recommended measure for accessing overweight and obesity status, but the percentiles and z
scores of subscapular and of SFT will allow better assessment of adiposity (Addo & Himes,
2010a; Ahmad et al., 2013). It has been suggested that in monitoring the school children growth
skinfold measurements should be preferred in addition to BMI (Lobstein et al., 2015). SFT
measurements are fast, non-invasive, easy and requires simple training so that a precision can
be attained.
2.4 Consequences of Obesity
2.4.1 Social effects
Obesity and overweight are substituting more traditional complications such as under nutrition
and infectious diseases as the utmost significant causes of ill-health (WHO, 2000). Obese
children and adolescents are highly socially and psychologically affected. They experience
discrimination and poor self-esteem, which can continue into adulthood. Obese children are
seen to be taller and viewed more matured compared to non-overweight peers thus affecting
their socialization (Dietz, 1998). Additionally, physical, emotional, social and school
functioning of children and adolescents is affected by obesity (Riazi et al., 2010). This revealed
that obese children and adolescents have inferior health-related quality of life (HRQoL) scores
on all dimensions compared to the healthy controls. This was also witnessed in adult where
HRQoL was found to be low in obese and overweight adult (Döring et al., 2015). Likewise
recently study of Finistrella et al., (2015) determined that obese preadolescence and
adolescence were found to be at higher risk of developing eating disorders and social problems
as compared to normal weight peers.
2.4.2 Health effects
Overweight and obese children can possibly become obese during adulthood (Samuelson,
2004). Overweight and obesity in children and adolescents may lead to intermediate and long
term health risks (Must, 1996). Obesity could also lead to various co-morbidities comprising
coronary heart disease, hypertension and stroke, certain types of cancer, type 2 diabetes

14
mellitus, gallbladder disease, dyslipidaemia, osteoarthritis and gout, and pulmonary diseases,
including sleep apnoea, hyperlipidaemia and abnormal glucose tolerance (WHO, 2000;
Samuelson, 2004; Dietz, 1998).
The risk of adult overweight in adult was shown to be two times higher for those who were
overweight during childhood stage compared to those who were not overweight, this has been
demonstrated in a long term follow-up studies that included children and adolescents (Guo et
al., 2002; Must, 1996) In a study of Kesztyüs et al., (2014) meant at studying the associations
between HRQoL, frequency of illness, and weight in primary school children in southern
German reported that the obese children especially the central obese had extra sick days and
numbers of visiting a physician than non-obese.
2.4.3 Economic effects
Obesity-related health problem adversely impacts health outcomes including quality of life,
disability and mortality which end up by increasing healthcare utilization (Lehnert et al., 2013).
Being overweight or obese has economic significances (Branca et al., 2007). It includes the
costs of health services, these includes higher medical costs associated with obesity related
diseases including hospitalization, drugs, radiological or laboratory tests, and long term care
including nursing homes. The economic costs from the excess morbidity and mortality due to
obesity-related diseases is not only on the health-care costs alone but also through decreases in
workforce productivity (Y. C. Wang et al., 2011).
There are indirect costs that are associated with obesity. Obesity has a negative effect on
workforce productivity and costs, it includes absenteeism and disability days. The missing
working days for obese workers seems to be more as compared to non-obese workers (Trogdon
et al., 2008). Employers pay higher life insurance for workers’ compensation for employees
who are obese than for employees who are not obese. Studies done in WHO European Region
shows that, the health care costs of obesity account for 2–4% of national health expenditure,
this included the significant indirect costs that are earned from lost productivity due to work
absences as a result of health problems and premature death (Branca et al., 2007). The evidence
has shown that obesity has a negative impacts on individuals, healthcare systems, employers,
and the economy in general (Lehnert et al., 2013).

15
2.5 Strategies towards School Children Obesity Prevention
Children are considered as the priority group for intervention strategies for prevention of
obesity because more potential interventions strategies are available compared to adults. It
would be more advantageous to initiate prevention and treatment of obesity in early stage of
life as a successful prevention and treatment of obesity in childhood could reduce the adult
incidence of various disease (Dehghan et al., 2005). There seems to be no easy-going solution
to combat school children overweight and obesity, to maximize its success a range of strategies
has to be considered. Both school and home environment has to be well-thought-out when
planning interventions to prevent children’s overweight and obesity. This is because these
settings has an influences on eating and physical behaviour of children (Control & Prevention,
2011; Golan, 2006). Interventions directing build environment, physical activity and diet may
combat obesity/overweight. The following were found to be promising policies and strategies
by various studies;
Incorporating nutrition education lessons (healthy eating), physical activity into school
curriculum as the best way of preventing and treating school children obesity (Waters
et al., 2011; Katz et al., 2008). Randomized controlled trials studies that concentrated
on physical activity or nutrition in school seemed to produce promising results (Hung
et al., 2015). On the other hand, changed school food environments and cultural
practices, through improving nutritional quality of the food supply in schools, examples
reducing higher denser foods/snacks/drinks in vending machines and increasing
availability of fruits and vegetables proved positive. (Kaphingst & French, 2006; Waters
et al., 2011).
Parent support through promoting healthy eating by encouraging children to eat more
nutritious food, promoting physical activity through training their children to participate
in various home activities and spend less time in screen based activities (Koplan et al.,
2005; Verloigne et al., 2012; Waters et al., 2011).
Encouraging sleep and fighting against sedentary lifestyle can be of great advantages
in lessen the prevalence of overweight and obesity to children (Padilla et al. 2011; de
Jong et al. 2012). This can be done successfully by the parents through improving their
parenting skills and providing knowledge and structural timetable to their children

16
Obesity is a complex condition that covers many factors, including environmental, behavioural,
psychosocial, inherited, and metabolic factors, thereby making it difficult to be resolved
(Waters et al., 2011). Long term sustainable impacts must be attained by the Childhood obesity
prevention research through incorporate effective interventions within health, education and
care systems.

17
Chapter 3: Methodology
3.1 Study Area
The study was conducted in Moshi Municipal, in Kilimanjaro region located in the North
Eastern part of Tanzania Mainland. Kilimanjaro rsegion is divided into seven administrative
districts: - Moshi Municipal Council, others are the district council including Moshi, Hai, Siha,
Rombo, Mwanga and Same. The region covers an area of 13,209 km-2 or 1.4% of the area of
the entire Tanzania Mainland. Moshi Municipal Council (study area) has a population of
184,292 according to the 2012 census. It is among the fast growing urban centres of the country
and most populated among others. The municipal has a total of 48 Primary schools, whereby
35 of them are public owned and the rest 13 are private schools (Moshi Municipal Investment
Profile, 2013).
3.2 Study Design
A cross sectional study was carried out in two public and two private primary schools in Moshi
municipal, Kilimanjaro using multiple methods of data collection.
3.3 Study Population
Study population were the children aged 10-12 years who attended public and private primary
schools in Moshi municipal, Kilimanjaro. This age group was selected because they are more
likely to be able to understand and respond accurately to questions than younger children (for
a better communication).
3.4 Sampling Technique
A stratified random sampling was used to select two public schools (St Anne and Moshi Airport
primary school) and two private schools (Kiboriloni and Soweto primary school) as the
representatives of other schools in the municipal. The school children aged 10-12 years in each
school selected were stratified according to gender then simple random sampling was applied
to get 140 children to participate in the study. This approach is of benefit as it improves the
representativeness of the sample by reducing sampling errors.

18
3.5 Data Collection
3.5.1 Anthropometric Measurements
Body height was measured to the nearest 0.1cm, using stadiometer and weight to the nearest
0.1 kilogram using a standard weighing scale with child wearing light clothes and with no shoes.
Also children’s triceps and subscapular SFT was measured to the nearest 0.5 mm using a Lange
skin calliper. Three measurements were taken at each site and recorded. Both measurements
were taken on subjects' right side in accordance with standard procedures (Lohman et al.,
1988). BMI was calculated as 'body weight in kilograms divided by height in meters squared
(kg/m2). The cut-off points recommended in identifying the age and gender-specific cut-off
points for the BMI with the age ranging from 1 to 18 years for the diagnosis of overweight and
obesity was used (Cole et al., 2000). Cut offs to define thinness in children and adolescents,
based on body mass index at age 18 years was also used (Cole et al., 2007). Reference curves
for triceps and subscapular skinfold thicknesses in the United States children and adolescents
was used to classify children as overweight (≥85th percentile) or obese (≥95th percentile)(Addo
& Himes, 2010b). The children whose skinfold thickness was above the upper limit of normal
were considered to be obese, however children that corresponded to ≤10th percentile were
identified as underweight (Schneider et al., 2007).
3.5.2 Questionnaires
Structured questionnaire was used for data collection. Social demographic information such as
age, sex, type of school, parent’s education and occupation, number of people in the household
were collected. Anthropometric measurements were included in this questionnaire and all the
measurements were done as explained above in section 3.5.1. Information regarding physical
activity and sedentary behaviour and some questions regarding dietary behaviour were
collected using the same questionnaire. Some questions from the Youth Physical Activity
Questionnaire (YPAQ) were included in this questionnaire. This questionnaire (YPAQ) has
been validated (Crocker et al., 1997) where the PAQ-C has been supported as a cost efficient
method of evaluating general levels of children's physical activity during the school age. The
physical activities that are accustomed and match with the objectives of this study were included
in this questionnaire.

19
3.6 Data Analysis
A number of statistical tests were conducted to analyse the results of this study, using Statistical
Package for Social Science (SPSS) version 22.0. Data was entered in Microsoft Excel
spreadsheet (Microsoft Office Excel) where BMI was calculated from the height and weight
measurements of each school children. The data was then imported into a Statistical spreadsheet
(Statistical data analysis software system, version 22.0) and analysed. Descriptive analyses
were conducted in reporting distributions of study variables of interest.
Normality of distribution of each continuous variables was checked using Kolmogorov-
Smirnov testing, histogram, box plot and QQ plots. Variables were expressed as mean ±
standard deviation for normal distributed data whereas for non-normally distributed data the
median, 1st, 3rd quartile were recorded. To compare the means and median differences as a
function of socio-demographic variables, Independent Student t-tests and Mann-Whitney U-
tests were used respectively.
Chi square (χ2) test was used to determine if there were differences in prevalence of overweight
and obesity as a function of socio-demographic variables and other variables. For all statistical
tests, the level of significance was set at p = 0.05.
All the association of the variables was done by comparing two groups. The overweight
children were combined with obese children (overweight/ obese) and those of normal weight
were combined with the underweight ones (normal weight/underweight). The underweight
children were combined with normal weight ones because they were not seen to be
malnourished/ skinned as they were not far from the normal weight borderline.
For the control of the confounders a step wise logistic regression analysis was conducted
assigning BMI, Triceps and Subscapular SFT as the dependent variables. While the type of
school as an independent variable of interest, together with other factors that had statistical
significant association (considered as confounders) with school children overweight/ obesity
were included in the model ( father’s education, mother’s education and mode of transport used
to go to school).The odd ratios, p-values and 95% confidence intervals were recorded.

20
3.7 Ethical Considerations
Permission to conduct the study was obtained from the Municipal Director of Moshi
Municipality. The list of primary schools present in Moshi used for sampling was obtained from
the District Education Officer.
A written informed consent to take anthropometric measurements and interview children was
given to school head teachers. Each respondent gave verbal consent before participating in the
study. All the respondents were aware of their rights to refuse to answer any question, ask
questions at any point, confidentiality and anonymity, know how the data will be used as well
as being clear about data ownership and copyright issues.

21
Chapter 4: Results
4.1 Demographic characteristics of study participants
Participants and parents demographic information is provided table 4-1. A total of 140 school
children participated, where (n=68; 48.6%) were boys and (n=72; 51.6%) were girls. All of
them were included in the analysis of all variables. Two private schools and two public primary
schools were involved, (n= 69; 49.3%) children from a private school and (n=71; 50.7%) from
public school. Majority of the school children were from the families with more than 6 people
(n=62; 44.3%). All children knew their parent’s education and occupation.
Table 4-1 Demographic characteristics of study participants
Characteristics Number Percentage
Sex
Boys 68 48.6
Girls 72 51.6
Type of school
Private 69 49.3
Public 71 50.7
Number of people living in a household
2 -3 17 12.2
4 24 17.1
5 37 26.4
+6 62 44.3
Father’s education
Primary education 58 41.4
Secondary education 32 22.9
Post-secondary/college 50 35.7
Mother’s education
Primary education 73 52.1
Secondary education 27 19.3
Post-secondary/college 40 28.6
Father’s occupation
Formally employed 55 39.3
Self-employed 67 47.9
Unemployed 18 12.9
Mother’s education
Formally employed 43 30.7
Self-employed 69 49.3
House wife 28 20.0
Table 4-2 shows the age, height, weight, BMI, average triceps SFT and average subscapular
SFT of the school children. The age range was 10-12 years, with a mean of 11.1 ± 0.8 years.
The mean weight and height were 37.6 ± 9.1 kilograms and 1.4 ± 0.9 meters respectively. The

22
mean BMI was 17.9 ± 3.1 kg/m² while the mean Triceps and Subscapular SFT was 13.8 ± 7.3
millimetres and 9.7 ± 35.4 millimetres respectively.
Table 4-2 Descriptive statistics of age and anthropometric measurements of the
school children
Variable Range Min** Max *** Mean ± SD
Age in years 2.0 11.0 12.0 11.1 ± 0.8
Weight in kilograms 46.0 21.5 67.5 37.6 ± 9.1
Height in meters 0.4 1.2 1.6 1.4 ± 0.9
Body mass index kg/m²) 16.1 13.2 29.4 17.9 ± 3.1
Average Triceps SFT in mm* 31.1 3.8 35.0 13.8 ± 7.3
Average Subscapular SFT in mm* 25.3 4.00 29.3 9.7 ± 35.4
* Mean of three measurements, **Minimum, ***Maximum
Mann Whitney test was used to compare the median of BMI, Triceps SFT and Subscapular SFT
between girls and boys. The median BMI for the girls (17.3 kg/m²) was higher than that of the
boys (16.7kg/m²), however this difference was not statistically significant.
The medium triceps values were 14.08 mm for girls and 10.5 mm for boys, whereas the medium
subscapular values were 9.17 mm for girls and 7.0 mm for boys. There was statistical significant
different in triceps SFT (p=0.009) and subscapular SFT (p=0.001) between boys and girls,
where girls showed higher Triceps and Subscapular SFT values as shown in table 4-3 below.
The median BMI, Triceps and Subscapular SFT according to type of schools (Table 4-4) were
found to be significantly (p< 0.001) higher for the sample of private school children compared
to their public school counterpart.
Table 4-3 Comparison of BMI, Triceps SFT and Subscapular SFT between girls and
boys
Variables
Gender p-
value* Girls ( n=72) Boys (n=68)
Min
***
Max
****
Median
(1st,3rd
quartile)
Min
***
Max
****
Median
(1st,3rd
quartile)
BMI (kg/m2) 13.3 29.4 17.3
(15.8,20.3)
13.6 26.5 16.8
(15.5,18.9)
0.186
Average Triceps SFT
(mm)**
4.0 31.0 14.1(9.5,20.5) 3.8 35.0 10.5
(6.7,15.8)
0.009
Average Subscapular
SFT(mm)**
4.0 29.3 9.2(6.7,14.1) 4.0 22.5 7.0
(5.3,9.1)
0.001
* Mann Whitney test, ** Means of three measurements, ***Minimum, ****Maximum

23
Table 4-4 Medium BMI, Triceps and Subscapular SFT according to type of school
Variables Type of school
Private Public
p value** Median
(1st, 3rd quartile)
Median
(1st, 3rd quartile)
BMI (kg/m²) 18.4 (16.5, 20.7) 16.1 (15.3, 18.2) <0.001
Average Triceps SFT (mm)* 15.2 (11.6, 22.9) 9.5 (6.0, 13.0) <0.001
Average Subscapular SFT(mm)* 9.7 (7.5, 15.0) 6.3 (5.2,8.3) <0.001
* Means of three measurements ** Mann Whitney test
4.2 Prevalence of overweight and obesity among school children
BMI, Triceps and Subscapular SFT were used to access the prevalence of overweight and
obesity among school children as shown in table 4-5. Based on BMI, the prevalence of obesity
was (n=4; 2.9%) while that of overweight was (n=24; 17.1%). With triceps SFT method the
prevalence of obesity was (n=16; 11.4%) and that of overweight was (n=18; 12.9%).
Subscapular gave a prevalence of obesity of (n=14; 10.0%) while that of overweight was (n=18;
12.9%). The prevalence of overweight and obesity using all BMI, Triceps and Subscapular SFT
cut-offs was not found to be significantly different between girls and boys. Higher obesity
prevalence was detected with the use of Triceps SFT (n=16; 11.4%) followed by Subscapular
(n=14; 10.0%) and lower with the use of BMI (n=4; 2.9%). On the other hand, high prevalence
of overweight were recorded using BMI (n=24; 17.1%) however both Triceps and Subscapular
SFT detected the same number of school children (n=18; 12.9%) as overweight. There was no
great variation in number of school children that was identified as obese using Triceps SFT and
Subscapular SFT.
Using all methods used (BMI, Triceps and Subscapular SFT), the prevalence of overweight and
obesity among children attending private primary school was found to be significantly higher
than those who attended public primary school (BMI p=0.032, Triceps SFT p= <0.001 and
subscapular SFT p=0.001).

24
Table 4-5 Nutritional status classification of school children aged 10-12 years using BMI, Triceps SFT and Subscapular SFT
Method used All (N=140)
Sex Type of school
Girls
(N=72)
n (%)
Boys
(N=68)
n (%)
p-value*
Private
(N=69)
n (%)
Public
(N=71)
n (%)
p-value*
BMI category
Obesity 4 (2.9) 2 (2.8) 2 (2.9)
0.438
3 (4.3) 1 (1.4)
0.032 Overweight 24 (17.1) 16 (22.2) 16 (11.8) 17 (24.6) 7 (9.9)
Normal weight 100 (71.4) 48 (66.7) 52 (76.5) 46 (66.7) 54 (76.1)
Underweight 12 (8.6) 6 (8.3) 6 (8.8) 3 (4.3) 9 (12.7)
TRICEPS SFT category
Obesity 16 (11.4) 9 (12.5) 7 (10.3)
0.884
13 (18.8) 3 (4.2)
<0.001
Overweight 18 (12.9) 10 (13.9) 8 (11.8) 13 (18.8) 5 (7.0)
Normal weight 9 (64.3) 44 (61.1) 46 (67.6) 41 (59.4) 49 (69.0)
Underweight 16 (11.4) 9 (12.5) 7 (10.3) 2 (2.9) 14 (19.7)
SUBSCAPULAR SFT category
Obesity 14 (10.0) 6 (8.3) 8 (11.8)
0.239
13 (18.8) 1(1.4)
0.001
Overweight 18 (12.9) 12 (16.7) 6 (8.8) 12 (17.4) 6(8.5)
Normal weight 106 (75.7) 52 (72.2) 54 (79.4) 44 (63.8) 62 (87.3)
Underweight 2 (1.4) 2 (2.8) 0 (0.0) 0 (0.0) 2 (2.8)
* Chi square (χ2) test

25
Figure 4-1 Weight status using BMI, Triceps SFT and Subscapular SFT
4.3 Correlation between BMI and skinfold thickness measures in assessing
Obesity and overweight
Pearson correlation (r) shows a positive relationship between BMI and both SFT measurements
(Triceps and Subscapular) in the assessment of overweight and obesity among school children.
As shown in table 4-6 below, the relationship between BMI and triceps SFT showed high level
of correlation (p≤0.001; r=0.853), the association between BMI and subscapular SFT was
weaker than that of BMI and Triceps SFT (p≤0.001; r=0.55). Stronger correlation was also
detected between Triceps SFT and Subscapular SFT (p≤0.001; r=0.893).
Table 4-6 Correlation between BMI and skinfold thickness
Method used BMI
r (p-value)
Triceps SFT
r (p-value)
BMI - -
Triceps SFT 0.853(≤0.001) -
Subscapular SFT 0.55 (≤0.001) 0.893 (≤0.001)
r correlation coefficient, Correlation is significant at the 0.05 level
There was an overlap in the classification of school children as overweight /obese between the
methods as shown in figure 4-2 below. A total of 43 school children were classified as
overweight/obese using combination of either three, two or by using only one method.
Combination of BMI, Triceps SFT and Subscapular SFT) classified (n=23; 57.5%) as
overweight /obese. BMI and Triceps SFT classified (n=3; 7.5%) school children as overweight
/obese. Triceps and subscapular found (n=5; 12.5%), while none of the school children that was
0,0
10,0
20,0
30,0
40,0
50,0
60,0
70,0
80,0
pre
va
len
ce (
%)
Weight Status
BMI
TRICEPS SFT
SUBSCUPULAR SFT

26
classified as overweight or obese using a combination of BMI and Subscapular SFT. The school
children that were classified as overweight/obese by only one method were; (n=2; 5%) using
BMI, (n=4; 10%) using Triceps SFT and (n=3; 7.5%) by subscapular SFT.
Figure 4-2 Relationship between BMI, Triceps and Subscapular SFT in assessing
overweight/obesity
4.4 Relationship between social demographic factors and weight status of
school children
Using all the assessment methods (BMI and SFT) as shown in Table 4-7 below, no significant
relationship was found between overweight /obesity and gender (p=0.128 for BMI, p=0.550 for
Triceps SFT and p= 0.534 for Subscapular SFT). Although the percentage of overweight /obese
girls was greater than that of the overweight/obese boys, this difference was not significant.
However, children who attended private schools showed higher prevalence of overweight
/obesity than children in public schools. This relationship was found to be statistically

27
significant using all the methods used in classifying overweight and obesity (BMI, p=0.009,
p<0.001 for both Triceps and Subscapular SFT). Children belonging to educated parents show
higher rates of overweight and obesity, this was statistically significant using both triceps and
subscapular SFT. Parents’ occupation shows no significant differences between the two groups.
The children from household of less than six people showed higher prevalence rate of
overweight/obesity than those from households with six or more people. This relationship was
not found to be statistically significant using BMI and Triceps SFT but was statistically
significant using Subscapular SFT (p=0.036).
There were differences in parent’s education and occupation between private and public
primary school (p<0.001) as shown in table 4- 8. A higher number of the children whose father
(78.3%) and mother (72.5%) has secondary/post-secondary/college education were in private
primary schools compared to those who were in public primary school. There was a significant
difference between overweight/obese and normal/underweight children with respect to their
father’s education (except for those children that were assessed using BMI), where the
prevalence of overweight/obesity was highest among children whose father had higher level of
education. The significant difference was likewise observed in mother’s education where the
prevalence of overweight /obesity was higher in children whose mother had higher level of
education. There was no significant difference in overweight /obesity prevalence rates based on
both parent’s occupation as shown in table 4-7. A higher percentage of children (56.5%) whose
father are formally employed in private or government sectors were in private schools. Whereas
high percentage (63.8%) of those whose mother are either self-employed business/or
unemployed were in private primary schools. Therefore, father’s and mother’s education has a
relationship with obesity/overweigh status but mother’s/father’s occupation has no relationship.

28
Table 4-7 Relationship between obesity status and social demographic characteristics
Variables
BMI Triceps SFT Subscapular SFT
Overweight
/Obese
n (%)
Normal
/Underweight
n (%)
Overweight/
Obese
n (%)
Normal
/Underweight
n (%)
Overweight
/Obese
n (%)
Normal
/Underweight
n (%)
Gender
Girls 18 (25) 54 (75) 19 (26.4) 53 (77.6) 18 (25) 54 (75)
Boys 10(14.5) 58 (85.3) 15 (22.1) 53 (77.6) 14 (20.6) 54 (79.4)
p –value* 0.128 0.550 0.534
Type of school
Private 20 (29) 49(71) 26 (37.7) 43 (62.3) 25 (36.2) 44 (63.8)
Public 8 (11.3) 63(88.7) 8 (11.3) 63 (88.7) 7 (9.9) 64 (90.1)
p –value* 0.009 <0.001 <0.001
Father’s education
Primary education 8(13.8) 50 (86.2) 9 (15.5) 49 (84.5) 7 (12.1) 51 (87.9)
Secondary/post-secondary/college 20 (24.4) 62(75.6) 25 (30.5) 57 (69.5) 25 (30.5) 57 (69.5)
p-value* 0.123 0.042 0.011
Fathers occupation
Formally employed-private or government employee 13 (23.6) 42(76.4) 16 (29.1) 39 (70.9) 16 (29.1) 39 (70.9)
Self -employed/casual work/petty business/unemployed 15 (17.6) 70 (82.4) 18 (21.2) 67 (78.8) 16 (18.8) 69 (81.2)
p-value* 0.387 0.286 0.158
Mother’s education
Primary education 10 (13.7) 63(86.3) 11 (15.1) 62 (84.9) 10 (13.7) 63 (86.3)
Secondary/post-secondary/college 18 (26.9) 49(73.1) 23 (34.3) 44 (65.7) 22 (32.8) 45 (67.2)
p –value* 0.052 0.008 0.007
Mother’s occupation
Formally employed-private or government employee 10 (23.3) 33 (76.6) 13(30.2) 30 (78.4) 14 (32.6) 29 (67.4)
Self -employed/casual work/petty business/unemployed 18 (18.6) 79 (81.4) 21 (21.6) 76 (69.8) 18 (18.6) 79 (81.4)
p-value* 0.521 0.275 0.065
Number of people living in a household
≥ 6 9 (14.5) 52 (85.5) 13 (21) 49 (79) 9 (14.5) 53 (85.5)
<6 13(24.4) 59 (75.6) 21 (26.9) 57 (73.1) 23 (29.5) 55 (70.5)
p-value* 0.148 0.414 0.036
* Chi square (χ2) test
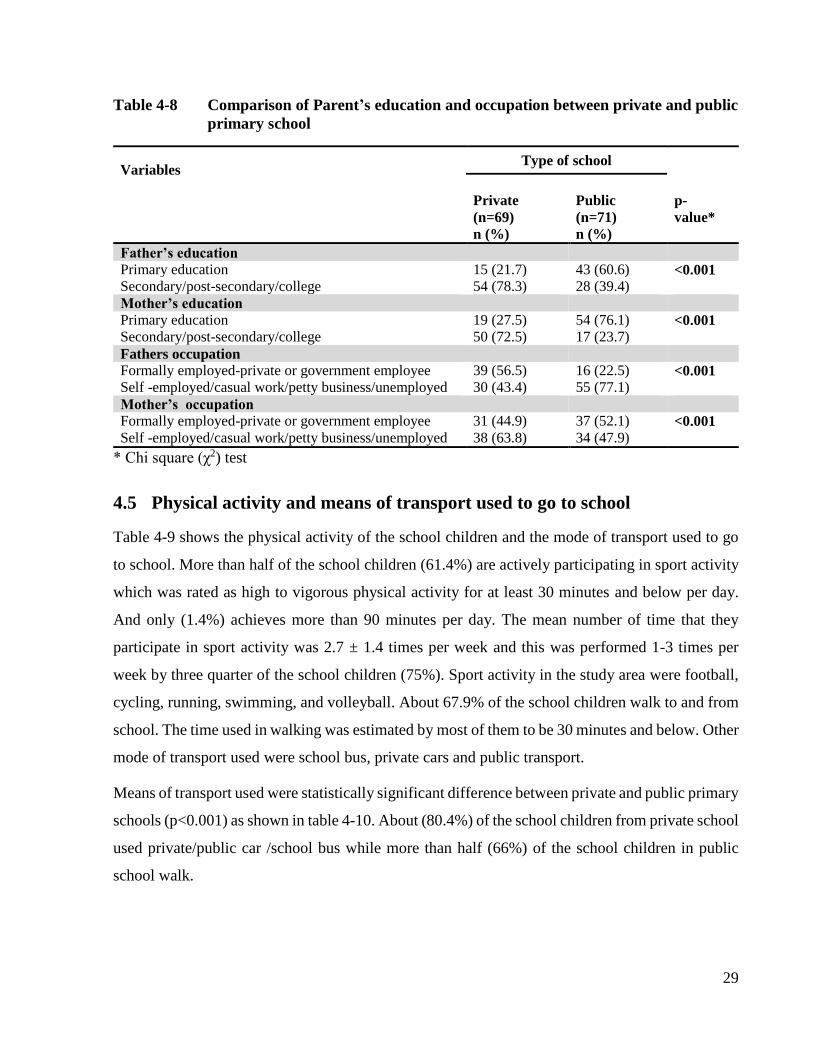
29
Table 4-8 Comparison of Parent’s education and occupation between private and public
primary school
Variables Type of school
Private
(n=69)
n (%)
Public
(n=71)
n (%)
p-
value*
Father’s education
Primary education 15 (21.7) 43 (60.6) <0.001
Secondary/post-secondary/college 54 (78.3) 28 (39.4)
Mother’s education
Primary education 19 (27.5) 54 (76.1) <0.001
Secondary/post-secondary/college 50 (72.5) 17 (23.7)
Fathers occupation
Formally employed-private or government employee 39 (56.5) 16 (22.5) <0.001
Self -employed/casual work/petty business/unemployed 30 (43.4) 55 (77.1)
Mother’s occupation
Formally employed-private or government employee 31 (44.9) 37 (52.1) <0.001
Self -employed/casual work/petty business/unemployed 38 (63.8) 34 (47.9)
* Chi square (χ2) test
4.5 Physical activity and means of transport used to go to school
Table 4-9 shows the physical activity of the school children and the mode of transport used to go
to school. More than half of the school children (61.4%) are actively participating in sport activity
which was rated as high to vigorous physical activity for at least 30 minutes and below per day.
And only (1.4%) achieves more than 90 minutes per day. The mean number of time that they
participate in sport activity was 2.7 ± 1.4 times per week and this was performed 1-3 times per
week by three quarter of the school children (75%). Sport activity in the study area were football,
cycling, running, swimming, and volleyball. About 67.9% of the school children walk to and from
school. The time used in walking was estimated by most of them to be 30 minutes and below. Other
mode of transport used were school bus, private cars and public transport.
Means of transport used were statistically significant difference between private and public primary
schools (p<0.001) as shown in table 4-10. About (80.4%) of the school children from private school
used private/public car /school bus while more than half (66%) of the school children in public
school walk.

30
Table 4-9 School children physical activity and means of transport used to go to school
Characteristics Mean ± SD Number (%)
Average number of times participating in sport activity per week 2.7 ±1.4
Average number of times participating in sport activity per week
1-3 times 105 75
4-5 times 35 25
Average time spent(hours) in sport activity per day
30 minutes and below 86 61.4
31-60 minutes 50 37.5
61-90 minutes 2 1.4
Above 90 minutes 2 1.4
Means of transport used to and from school
Private/public car /school bus 46 32.9
Walking 94 67.9
Table 4-10 Relationship between type of school and means of transport used to go to
school
Type of school Mode of transport
Private/public car /school bus n (%) Walk n (%)
p-value*
Private 37 (80.4) 32 (34) <0.001
Public 9 (19.6) 62 (66)
* Chi square (χ2) test
4.6 Relationship between obesity status of school children and physical activity
and means of transport used to and from school
According to the result in table 4-11, children who participating in sport activity on average of 4-5
times per week showed lower prevalence of overweight/obesity compared to those who participate
1-3 times per week however it was not statistically significant. The children that reported playing
for 30 minutes and less indicated higher prevalence of overweight/obesity than those playing more
than 30 minutes per day though the relationship was also not statistically significant. The children
who walk to and from school showed a low prevalence of overweight/obesity than those who use
private/public car /school bus going to school, this relationship was found to be statistically
significant (Triceps SFT, p=0.043 and Subscapular SFT, p=0.019) but not by using BMI.

31
Table 4-11 Relationship between obesity status of school children and physical activity and mode of transport used to go to
school
Variables
BMI Triceps SFT Subscapular SFT
Overweight/
Obese
n (%)
Normal
/Underweight
n (%)
Overweight/
Obese
n (%)
Normal
/Underweight
n (%)
Overweight/
Obese
n (%)
Normal
/Underweight
n (%)
Average number of times participating in
sport activity per week
1-3 times 23 (21.9) 82 (78.1) 28 (26.7) 77 (73.3) 26 (24.8) 30 (65.20
4-5 times 5 (14.3) 30 (85.7) 6 (17.1) 29 (82.9) 6 (17.1) 78 (83)
p –value* 0.329 0.255 0.353
Average time spent in physical activity
30 minutes and below 20 (23) 66 (76.7) 24 (27.9) 62 (72.1) 23 (26.7) 63 (73.3)
31-60 minutes 8 (16) 42 (84.4) 9 (18) 41 (82) 8 (16) 42 (84)
61-90 minutes 0 (0) 2 (100) 1 (50) 1 (50) 1 (50) 1 (50)
Above 90 minutes 0 (0) 2 (100) 0 (0) 2 (100) 0 (0) 2 (100)
p –value* 0.558 0.384 0.321
Mode of transport used to go to school
Private/public car /school bus 11 (23.3) 35 (76.1) 16 (34.8) 30 (65.2) 16 (34.8) 30 (65.2)
Walk 17 (18.1) 77(81.9) 18(19.1) 76 (80.9) 16 (17) 78 (830
p–value* 0.418 0.043 0.019
* Chi square (χ2) test

32
4.7 School children sedentary behaviour and home/school chores activities
Table 4-12 below shows that the average sleeping time was found to be 9.5 ± 0.8 hours, where
62.9% school children slept for less than 10 hours per day. About 66.4% of the school children
were involved in sedentary activities for more than four hours per day with average time of about
5.3± 2.5 hours. Sedentary activities in this group included doing arts and crafts, listening to music,
playing indoors with toys/card/computer games, reading, sitting, talking, talk on the phone, using
computer and watching television. Screen time includes the cumulative hours spent watching
television and video/computer game, this was found to be 1.7 ± 1.23 hours per day however 69.3%
used ≤2 hours per day. About 70% of school children use average of < 3 hours per day doing home
/school chores which includes house cleaning, laundry, preparing/cooking food, gardening, farm
work or talking care of siblings.
Table 4-12 School children sedentary behaviour and home/school chores activities
Characteristics Range Mean ± SD
Number (%)
Average sleeping time per day 4.0 9.5 ± 0.8
Sleeping hours per day
More than 10 hours 52 (37.1)
Less than 10 hours/day 88 (62.9)
Average time take for sedentary activities( in hours) 14.7 5.3 ± 2.5
Average time take for sedentary activities
>4 hours per day 93 (66.4)
≤4hours per day 49 (33.6)
Average screening time per day(hours) 6 1.7 ± 1.2
Average screening time per day(hours)
>2 hours per day 43 (30.7)
≤2 hours per day 97 (69.3)
Average time in home /school chores per day(hours) 10 2.2 ± 1.2
Average time in home /school chores per day(hours)
< 3hours per day 98 (70)
≥3 hours per day 42 (30)
Mann Whitney test was used to compare the median of the time spent for physical activity,
sedentary activity, screening and home/house chores as shown in Table 4-13. There were no
significance differences between overweight/obesity and normal/overweight children.

33
Table 4-13 Comparison length of time spend for physical activity, sedentary activity, screening and home/house chores
between Overweight/Obese and Normal/Underweight children
Variables BMI Triceps STF Subscapular SFT
Overweight/Obese
median(1st,3rd
quantile)
Normal
/Underweight
median(1st,3rd
quantile
Overweight/Obese
median(1st,3rd
quantile
Normal
/Underweight
Median(1st,3rd
quantile
Overweight/Obese
median(1st,3rd
quantile
Normal
/Underweight
median(1st,3rd
quantile
Sleeping time in
hours/day
9.5
(9.0,10.5)
9.5
(9.0,10)
10.0
(9.0,10.5)
9.5
(9.0,10.0)
9.75
(9.0,10.5)
9.5
(9.0,10.5)
p-value* 0.235 0.028 0.079
Times in Physical
activity per week
3.0
(1.0,3.0)
2.0
(1.0,4.0)
3.0
(1.0,4.0)
3.0
(1.0,3.0)
3.0
(1.0,3.0)
3.0
(1.0,4.0)
p-value* 0.647 0.721 0.781
Sedentary activity
in hours/day
5.09
(3,7,6.2)
4.81
(3.6,6.6)
4.75
(3.7,6.0)
4.91
(3.6,6.7)
4.75
(3.6,6.1)
4.89
(3.6,6.6
p-value* 0.813 0.478 0.665
Screening time in
hours/day
1.35
(0.9,2.2)
1.28
(0.7,2.2)
1.35
(0.9,2.0)
1.28
(0.8,2.3)
1.43
(1.0,2.3)
1.28
(0.8,2.3)
p-value* 0.633 0.926 0.445
Home/house chores
in hours/day
1.75 (0.5,3.1)
1.58 (0.8,3.0)
1.41 (0.7,3.0)
1.66 (0.7,3.0)
1.12 (0.5,3.0)
1.87 (0.9,3.0)
p-value* 0.977 0.920 0.354
* Mann Whitney test

34
4.8 Relationship between sedentary activity and home/school chores activities
and obesity status of the school children
The results in Table 4-14 shows that children sleeping more than ten hours per day seem to have
high prevalence of overweight/obesity than those who sleep less than ten hours. This was not
statistically significant for those children that were identified to be overweight/obesity by the use
of BMI and subscapular SFT, but it was significant to those observed by the use of Triceps SFT
(p=0.048), this was found to be similar to the average time taken by the children for the sedentary
activities. The proportion of overweight/obesity was higher in children that use ≤4 hours per day
for sedentary activities than the one used >4 hours per day.
The school children using ≤2 hours per day for watching television and video/computer game
(screening time) had high rate of overweight/obesity than ones with screen time of >2 hours per
day though it was not statistically significant. Those children that use ≥3 hours per day for home
/school chores per day showed higher prevalence of overweight/obesity compared to those who
used <3 hours and more per day. However, the association was not found to be statistically
significant for both groups that were identified by all three methods.

35
Table 4-14 Relationship between sedentary activity and home/school chores activities and obesity status of school children
Variables
BMI Triceps SFT Subscapular SFT
Overweight/
Obese
n (%)
Normal
/Underweight
n (%)
Overweight/
Obese
n (%)
Normal/
Underweight
n (%)
Overweight/
Obese
n (%)
Normal
/Underweight
n (%)
Sleeping hours per day
More than 10 hours 12 (24.4) 37 (75.5) 17 (34.7) 32 (65.3) 15 (30.6) 34 (69.4)
Less than 10 hours/day 15 (18.1) 68 (81.9) 16 (19.3) 67 980.7) 16 (19.3) 67 (80.7)
p –value * 0.377 0.048 0.138
Average time take for sedentary
activities
>4 hours per day 18 (19.4) 74 (80.4) 21 (22.8) 71 (77.2) 19 (20.7) 73 (79.3)
≤4hours per day 9 (22.5) 31 (77.5) 12 (30) 28 (70) 12 (30) 28 (70)
p-value* 0.701 0.048 0.244
Average screening time per day(hours)
>2 hours per day 8 (18.6) 35 (81.4) 8 (18.6) 35 (81.4) 9 (20.9) 34 (79.1)
≤2 hours per day 19 (21.3) 70 (78.7) 25 (28.1) 64 (71.9) 22 (24.7) 67 (75.3)
p-value* 0.714 0.238 0.630
Average time in home /school chores
per day(hours)
< 3hours per day 17 (18.7) 76 (81.7) 20 (21.5) 73 (78.5) 20 (21.5) 73 (21.5)
≥3 hours per day 11 (26.2) 31 (73.8) 13 (31) 29 (69) 11 (26.2) 31 (73.8)
p-value* 0.294 0.237 0.549
* Chi square (χ2) test

36
4.9 School children dietary practices and behaviour
Table 4-15 shows dietary practices assessed in this study. All the school children were given food
at school. The foods given were stiff porridge/rice /maize with beans/meat. This was the same in
both private and public primary schools. Less than half (46.6%) of the school children were given
money (mean=321.5 -Tanzanian shillings) to buy food at school. About (87.5%) took breakfast
more than five times per week. High percent of school children consume fruits and vegetables 3-4
days per week (42.9% for fruits and 46.4% for vegetables).
Table 4-15 School children dietary practices and behaviour
Characteristics Mean ± SD Number Percentage
Given any money for buying foods or drinks while at school or outside home
Yes 65 46.6
No 75 53.6 Average amount of money given per day? (Tsh)* 321.53+281.45
Number of times buying food at school per week
Once 3 2.1
2-4 times 48 34.3 5-6 times 14 10 Number of days per week taken breakfast 1-2 days 5 3.6
3-4 days 15 10.7 More than5 days 120 85.7
Number of days per week taken fruits
1-2 days 39 27.9
3-4 days 60 42.9 More than5 days 37 26.4
Number of days per week taken vegetables
1-2 days 17 2.1 3-4 days 65 46.4 More than5 days 58 41.5
*1 Tsh (Tanzanian shiling) = 2000 euro
4.10 Relationship between dietary practices and behaviour and obesity status of
school children
The result in in table 4-16 showed that there was no relationship between giving children money
for buying foods or drinks while at school or away from home and overweight/obesity. There was
a statistical significant differences (p=0.002 for BMI, and p=0.007 for triceps SFT) in number of
times that children buy food at school per week between the two groups. Taking breakfast, fruits
and vegetables showed no relationship with overweight/obesity in school children. However the
prevalence was high to those school children who take/eat fruits and vegetables more than five
days in a week and also to the school children that take breakfast 3-4 days in a week.

37
Table 4-16 Relationship between dietary practices and behaviour and obesity status of school children
Variables
BMI Triceps SFT Subscapular SFT
Overweight/
Obese
n (%)
Normal/
Underweight
n (%)
Overweight/
Obese
n (%)
Normal/
Underweight
n (%)
Overweight/
Obese
n (%)
Normal/
Underweight
n (%)
Given any money for buying foods or drinks while at
school or outside home
Yes 13 (20) 52 (80) 16 (24.6) 49 (75.4) 12 (18.5) 53 (81.5)
No 15 (20) 60 (80) 18 (24) 57 (76) 20 (26.7) 55 (73.3)
p –value* 1.000 0.933 0.249
Number of times buying food at school per week
Once 3(100) 0 3 (100) 0 1 (33.3) 2 (66.7)
2-4 time 8 (16.7) 40 (83.3) 11 (22.9) 37 (77.1) 9 (18.8) 39 (81.3)
5-6 times 2 (14.3) 12(85.7) 2 (14.5) 12 (85.7) 2 (14.3) 12 (87.7)
p-value * 0.002 0.007 0.739
Number of days per week taken breakfast
1-2 days 1 (20) 4 (80) 1 (20) 4 (80) 1 (20 4 (80)
3-4 days 5 (33.3) 10 (66.7) 5 (33.3) 10 (66.7) 4 (26.7) 11 (73.3)
More than 5 days 22 (18.5) 98 (81.7) 28 (32.3) 92 (76.7) 27 (22.5) 93 (77.5)
p-value* 0.392 0.678 0.925
Number of days per week taken fruits
1-2 days 7 (17.9) 32 (82.1) 8 (20.5) 31 (75.5) 7 (17.9) 32 (82.1)
3-4 days 13 (21.6) 47 (78.4) 16 9(26.7) 44 (73.3) 12 (20) 48 (80)
More than 5 days 8 (21.7) 29 (78.3) 10 (27) 27 (73) 13 (35.1) 24 (64.9)
p–value* 0.890 0.743 0.145
Number of days per week taken vegetables
1-2 days 3 (17.6) 14 (82.4) 4 (23.5) 13 (76.5) 2 (11.5) 15 (88.2)
3-4 days 11 (16.9) 54 (83.1) 12 (18.5) 53 (81.5) 13 (20) 52 (80)
More than 5 days 14 (24.1) 44 (75.9) 18 (31) 40 (69) 17 (29.3) 41 (70.3)
p –value* 0.587 0.267 0.240
* Chi square (χ2) test

38
Before controlling for the confounders, type of school was statistically significantly associated with
overweight/obesity to those children that were identified as overweight/obese using all the methods
(BMI-Odd ratio=0.31, CI=0.13-0.77, p=0.009, Triceps SFT-Odd ratio=0.21, CI=0.09-0.51,
p<0.001 and Subscapular SFT-Odd ratio=0.19, CI=0.08-0.48, p<0.001). After adjusting for
father’s education, mother’s education and mode of transport used to school ,type of school was
statistically significantly associated with overweight/obesity to those children that were identified
as overweight/obesity using Triceps SFT-Odd ratio=0.28, CI=0.1-0.79, p=017) and Subscapular
SFT-Odd ratio=0.29, CI=0.09-0.48, p=0.024) but not by using BMI -Odd ratio=0.35, CI=0.12-
1.02, p=0.053) as shown table 4-17.
The odd ratio of being overweight/obesity measured using BMI, Triceps SFT and Subscapular SFT
was 0.35, 0.28, and 0.29 respectively in children attending private schools.
Table 4-17 Adjusted relationship between type of school and school children overweight/
Obesity
Method used Type of schoola
Unadjusted Adjusted
Odd ratio 95% CI p-value Odd ratio 95% CI p-value
BMI 0.31 0.13-0.77 0.009 0.35 0.12-1.02 0.053
Triceps SFT 0.21 0.09-0.51 <0.001 0.28 0.1-0.79 0.017
Subscapular SFT 0.19 0.08-0.48 <0.001 0.29 0.09-0.48 0.024
a categorized as private school and public school
CI confidence interval
39
Chapter 5: Discussion
5.1 Prevalence of obesity and overweight among school children
The study investigated the prevalence of overweight and obesity among school children aged 10-
12 years in Moshi Municipal–Kilimanjaro using BMI, Triceps and subscapular SFT. The
prevalence of overweight and obesity obtained using BMI, Triceps, and Subscapular SFT were
20%, 24.3% and 22.9% respectively. In this study, overweight and obesity prevalence using BMI
criteria was 2.9% and 17.1% respectively. There was no significant difference in overweight/
obesity prevalence by gender. The combined prevalence of both overweight and obesity is slightly
higher than the figures obtained in similar previous studies (using IOTF cut-off points) in Dar es
salaam, Tanzania, where the combined prevalence of overweight and obesity ( 7-14years) was
14.7% (Mwaikambo, 2012). However, other studies using WHO criteria reported obesity
prevalence of 5.2% among school children aged 6-17 years from Dar es Salaam (Muhihi et al.,
2013). For children aged 10-12 years in Dodoma, the prevalence was 3.9% and 4.9% for obesity
and overweight respectively, whereas 5.8% obesity and 5.8% overweight were detected in
Kinondoni -Dar es salaam (Mosha & S Fungo, 2010).
This indicates an increased prevalence of overweight and obesity, worsening future trends of
childhood obesity, making it an important public health issue in Tanzania. In Kenya, the
neighbouring country a study of Kyallo et al., (2013) involved school children aged 9-14
years found 19.0%, as the prevalence of combined overweight and obesity which is comparable
to our study. Nevertheless, the prevalence of overweight and obesity in this study was closer to that
of the systematic review that was done to investigate the evidence of overweight/obesity transition
occurring in school-aged children and youth in Sub Saharan Africa which found the prevalence of
overweight/obesity and obesity to be 10.6% and 2.5% respectively (Muthuri et al., 2014). On the
other hand, the prevalence of overweight and obesity in this study was lower compared to recent
studies in developed countires. These include Oklohama where a combined prevalence of
overweight and obesity of children aged 7-13 years was 63% (Dennison et al., 2015). A systematic
review in Republic of Ireland between 2002 and 2012 found a combined prevalence of overweight
and obesity of primary school aged children ranged from 20-34% within the studies ( Keane et al.,
2014 ). In the United States in the year 2011-2012, 16% of the children 2-19 years were obese

40
(Ogden et al., 2014). Similarly in Brazil, 41% of children aged 6-10 year were overweight/obese (
Passos et al., 2015). Factors such as demography, lifestyle and socioeconomic differences may be
responsible for the lower figures seen in our subjects compared to the western children. Our study
did not find a significant gender difference in the prevalence of children obesity and overweight,
although absolute values were higher in girls. Others studies found similar results (Dennison et al.,
2015; Keane et al., 2014; Mwaikambo, 2012; Ogden et al., 2014; Passos et al., 2015; Van Stralen
et al., 2012).
Using SFT, the prevalence of obesity was higher than that obtained using BMI and for overweight
the prevalence was lower. Triceps SFT found a prevalence of obesity and overweight of 11.4% and
12.9% respectively, while Subscapular SFT determined 10% and 12.9% of obesity and overweight
respectively. There is no study in Tanzania that has used a combination of BMI and SFT to assess
the prevalence of obesity/overweight. The actual prevalence of school children overweight/obesity
can be obtained by the use of the combined methods of assessment.
The prevalence of the combined result of overweight and obesity obtained using BMI, Triceps, and
Subscapular SFT shows lower prevalence as compared to a study in Portugal. the study compared
BMI, SFT, and Waist circumferences that acquired a high prevalence of overweight/obesity of
31.6%, 61.4%, and 41.1% by the use of BMI, skinfold thickness, as well as waist circumference
respectively (Minghelli et al., 2013). Studies conducted in Nigeria found less prevalence of school
children overweight and obesity using Triceps SFT, BMI and BIA compared to this study. A study
involving adolescents aged 10-18 years, triceps SFT found a prevalence of obesity and overweight
to be 0.8% and 2.5% respectively whereas BIA gave a prevalence of obesity and overweight of
2.5% and 1.7% respectively (Ahmad et al., 2013). Other study including school children aged 5–
18 years, found obesity prevalence of 4.5% and 3.5% using Triceps SFT and BMI respectively
( Izuora et al., 2013). In both studies SFT seem to be more sensitive as it identifies more obese
school children than BMI.
The prevalence of overweight and obesity among children using all the three method of assessment
was significantly higher in children who attended private primary schools than those who attended
public primary schools. This finding agrees with findings of other studies that assessed children
and adolescent’s overweight and obesity using BMI in Tanzania, Kenya, Puerto Rica, India,
Andhra Pradesh; (Bhardwaj et al., 2008; Elías-Boneta et al., 2015; Kyallo et al., 2013;

41
Mwaikambo, 2012; Prasad et al., 2015). In Tanzania the public primary schools are funded by the
government whereas private primary schools charge considerable high tuition fees, which means
only parents who can afford the fees charged choose to enrol their children in private schools. This
is supported by the fact that children who attend private primary schools come from families with
higher social economic characteristics including higher incomes compared to those who go to
public schools. There was significant difference in parent’s education and occupation between
private and public primary school. A higher number of the children whose father and mother has
secondary/post-secondary/college education were in private primary schools compared to those
who were in public primary schools. Most probably parent’s education level reflects the socio-
economic status of families. A higher prevalence of overweight/obesity was observed in children
with parents that has secondary/post-secondary/college education. Father and mother’s education
had a relationship with overweight/obesity, and has been demonstrated by other studies (Anuradha
et al., 2015; De Silva et al., 2015; Karimi & Ghorbani, 2015; Kyallo et al., 2013; Meko et al., 2015;
Thanh, 2008).This has been observed in many developing countries where overweight/obesity rates
are higher among groups with higher socioeconomic status and education level. This might be
caused by the fact that these families can more easily manage motorized transport, sedentary
recreations and have high purchasing power that lead to an increased calorie accessibility, mostly
from fat, high sugar and refined grains foods. In Africa body weight perception is furthermore
influenced by social cultural factors, large body size is considered to be desirable as it reflects good
health and higher social economic status (Holdsworth et al., 2004; Muhihi et al., 2012). The HIV
pandemic has also been associated with body weight perception. People associate thinness with
illness especially HIV and AIDS and Tuberculosis therefore overweight/Obesity is preferred so
that to overcome this suspicion (Ezekiel et al., 2009; Puoaneet al., 2010).
5.2 Correlation between BMI and skinfold thickness measures in assessing
Obesity and overweight
The high level of correlation between the three anthropometric methods used in the classification
of weight status (BMI, Triceps and Subscapular SFT), indicate their applicability in assessing
weight status of children and adolescents. This study concurs with similar studies (Boeke et al.,
2013; Minghelli et al., 2013; Mohammed & Vuvor, 2012). These studies found that, SFT showed
the highest prevalence of overweight and obesity as compared to BMI. Various studies have

42
suggested that the best estimators of body density in the children and adolescents studied were a
combination of BMI and skinfold thickness. SFT is used as a good predictor of total body fat
(adiposity) in children and adolescents which provides a good estimate of obesity and body fat
distribution, (Ahmad et al., 2013; Nooyens et al., 2007; Rolland-Cachera, 1993). BMI is
recommended as method that provides a first-rate sign of overweight and obesity for surveillance
,screening and clinical purposes while the other should be importantly used when assessing the risk
factors for cardiovascular diseases (Himes, 2009). However then, it is known that obesity is a great
risk factor for many co-morbidities such as coronary heart disease, hypertension and stroke, certain
types of cancer, type 2 diabetes mellitus, gallbladder disease, dyslipidemia, osteoarthritis and gout,
and pulmonary diseases, including sleep apnea (WHO, 2000; Samuelson, 2004). Therefore all these
methods that assess adiposity should be used simultaneously in order to set preventive measures in
early stage.
5.3 Physical activity/sedentary activity and Obesity/overweight of school
children
In this study a high percentage of the school children spend approximately 30 minutes and less for
sport activity, and majority did it 1-3 times per week. Only 2.8 % met the recommended time (60
minutes or more for 5 days per week) for physical activity by WHO (WHO, 2010). However, our
study found no significant relationship between physical activity and overweight/obesity this
concur with a finding of Masuet-Aumatell et al., (2012). The probable explanation may be that the
recommended time for sport to have effect on weight management is not met or the eating habit
may negate the benefit achieved through sports.
Various studies have demonstrated the relationship between physical activity and overweight
/obesity, that insufficient physical activity increased the risk of overweight and obesity (Abril et
al., 2013; Kapil & Bhadoria, 2014; Rahman et al., 2015).
A recent review indicated that exercise was effective in reducing percent body fat in overweight
and obese children and adolescents (Kelley & Kelley, 2013). It has been shown that great number
of children and adolescents do not meet current recommendations of physical activity (Guthold et
al., 2008; Kalman et al., 2015). To reduce related future health problems children and adolescents
should be encouraged to participate in physical activity as recommended, this should be made
simple and enjoyable for children and adolescents to participate.

43
Walking to and from school is a factor of being physically active. The study found significant
differences between means of transport and overweight/obesity. The children walked to and from
school showed a low prevalence of obesity/overweight than those who use private/public car
/school bus, this agrees with other studies (Alkali et al., 2015; Duncan et al., 2011; Itoi et al., 2012).
Means of transport used was significantly different between private and public primary schools.
This is probably because of the fact that parents with children in private schools can meet the
expenses to take their children to school using private cars or school buses. Nowadays children are
unlikely to walk to school and prefer using vehicles to go to school especially in big cities possibly
because of changes in the built environment.
Other studies found that sleeping less than ten hours per night is a risk factor for overweight and
obesity in children (Owens et al., 2014; Padilla et al., 2011), but this was not found in this study.
High demand of physical, emotional and sexual development is attained when the sleeping time of
an adolescents is increased (Koss et al., 2015) and its recommended that school children should
sleep at least for 10 hours per day.
High percentage of school children in the study (66.4%) were involved in sedentary activities for
more than four hours per day with average time of about 5.3 hours which is a risk factor for
overweight and obesity as found by another study (Bhuiyan et al., 2013). Our study found no
relationship between sedentary activity, screening time and house/school chores and school
children overweight/obesity, that has been supported by certain studies (Al-Haifi et al., 2013;
Collings et al., 2015). Although other studies have found evidence of the relationship between
sedentary activities (Bhuiyan et al., 2013), screening time/computer usage (Giammattei et al., 2003;
Karimi & Ghorbani, 2015; Li et al., 2015; Padilla et al., 2011), home/school chores (Laxmaiah et
al., 2007) and overweight/obesity.
5.4 Dietary practices and school children obesity/overweight.
This study did not find a significant relationship between breakfast, fruits and vegetables
consumption and the risk of obesity in school children. For the positive effects the number of saving
and the portion size of fruits and vegetables recommended per day should be taken, in our study
this information was not collected, therefore, this might be the cause of this finding. This finding
appears to diverge from other studies which reported an inverse relationship between fruits and

44
vegetables consumption and overweight/obesity among children (Mocanu, 2013; Te Velde et al.,
2007; Vilchis-Gil et al., 2015).
Other studies (Antonogeorgos et al., 2012; Manios et al., 2014) found that children that consume
breakfast daily were found to be having lower chances of being overweight/obese. About 85.7%
of the school children in our study took breakfast more than five days in a week, but its relationship
with overweight/obesity was not observed, this might be caused by the consumption of poor
breakfast.
5.5 Strengths and Limitations of the study
The study used BMI, and SFT (Triceps and Subscapular), to assess the prevalence of weight status
of children and adolescents. The strong correlation obtained between these methods indicated their
applicability in assessing the nutrition status and gave the actual prevalence of overweight and
obesity among the school children. Many studies have applied one method (BMI) which
emphasizes the overweight than the excess body fat, which might be more crucial in the children.
Therefore, the combination of the three methods do not only provide information on excess weight
but also excess fat deposits. Furthermore, the combination of these methods has not been used in
Tanzania before.
However, this study is a cross-sectional and describes the situation of a small sample which may
not reflect the whole population. To study nutrition status of people a large sample size is required,
but in this study, only 140 participants were included, therefore the results of this study may have
some bias. Only associations can be reported and not causal effects. This is because of lack of time
and man power. In this study not all factors that influence school children’s weight status were
addressed; hence, the study assessed only some of the variable risk behaviour associated with
overweight and obesity.

45
This study has revealed a relatively high prevalence of overweight and obesity in a representative
sample of 140 school children in Moshi municipality in Kilimanjaro, Tanzania using three
anthropometric measurements: BMI, Triceps and Subscapular SFT. The results demonstrate that
prevalence of overweight and obesity is higher in school children attending private school, children
with parents that have high level of education and those who use private car/school buses to go to
school. There is a great need for the public health policy in Tanzania to act attentively so that early
detection and intervention can be made in order to prevent obesity and overweight in school
children. Preventive measures of obesity during childhood could reduce the adult incidence of
diseases. Both schools and home environment have an important role to play in preventing
children’s obesity and overweight directing on eating and physical activity behaviour. There is a
need to provide nutrition education to the parents as well as to school children in order to prevent
overweight and obesity as it has been shown that the prevalence is higher among school children
that belongs to parents with high level of education. This indicated that the people that are highly
educated may not necessarily have a nutrition education.
There was high correlation between the three methods (BMI, Triceps and Subscapular SFT) in the
classification of nutrition status of school children in this study. Therefore, all of these methods
should be used simultaneously in order to identify all subjects and to set preventive measures in
early stage. It’s obviously known that each method of assessing children and adolescent’s
overweight and obesity has advantages and disadvantages, as each method depends on
convenience, time, equipment and possibly a trained personnel. It will be more appropriate if all
these are taken into consideration when conducting the study that involved all the assessment
methods.
The study findings recommend the following; first, the assessment of overweight and obesity
should be conducted in other cities in Tanzania on a large scale and focus on more factors
influencing overweight and obesity among children and adolescents. This will facilitate the
creation of the preventive measures of overweight and obesity in Tanzania.
Chapter 6: Conclusion and Recommendations

46
Second; to reduce the future health problems, children and adolescents should be encouraged to
participate in physical activity as recommended, this should be simple and enjoyable that all the
children and adolescents will actively participate. Integrating physical activity and nutrition
education in school curriculum at all levels will play a great part in decreasing the prevalence of
obesity and overweight in Tanzania. This will produce a healthy generation that will consequently
lower the health costs associated with overweight and obesity.

47
Abdul-Rasoul, M. M. (2012). Obesity in children and adolescents in Gulf countries: facts and
solutions. Avances en Diabetología, 28(3), 64-69.
Abril, V., Manuel-y-Keenoy, B., Solà, R., García, J. L., Nessier, C., Rojas, R., . . . Arija, V.
(2013). Prevalence of overweight and obesity among 6-to 9-year-old schoolchildren
in Cuenca, Ecuador: Relationship with physical activity, poverty, and eating habits.
Food & Nutrition Bulletin, 34(4), 388-401.
Addo, O. Y., & Himes, J. H. (2010a). Reference curves for triceps and subscapular skinfold
thicknesses for US children and adolescents. The American journal of clinical
nutrition, ajcn. 28385.
Addo, O. Y., & Himes, J. H. (2010b). Reference curves for triceps and subscapular skinfold
thicknesses in US children and adolescents. The American journal of clinical
nutrition, 91(3), 635-642.
Ahluwalia, N., Dalmasso, P., Rasmussen, M., Lipsky, L., Currie, C., Haug, E., . . . Tabak, I.
(2015). Trends in overweight prevalence among 11-, 13-and 15-year-olds in 25
countries in Europe, Canada and USA from 2002 to 2010. The European Journal of
Public Health, 25(suppl 2), 28-32.
Ahmad, M., Ahmed, H., & Airede, K. (2013). Triceps skin fold thickness as a measure of body
fat in Nigerian adolescents. Nigerian Journal of Paediatrics, 40(2), 179-183.
Al-Haifi, A. R., Al-Fayez, M. A., Al-Athari, B. I., Al-Ajmi, F. A., Allafi, A. R., Al-Hazzaa, H.
M., & Musaiger, A. O. (2013). Relative contribution of physical activity, sedentary
behaviours, and dietary habits to the prevalence of obesity among Kuwaiti
adolescents. Food & Nutrition Bulletin, 34(1), 6-13.
Albertini, A., Tripodi, A., Fabbri, A., Mattioli, M., Cavrini, G., Cecchetti, R., . . . Contarini, V.
(2008). Prevalence of obesity in 6‐and 9‐year‐old children living in Central‐North
Italy. Analysis of determinants and indicators of risk of overweight. Obesity Reviews,
9(1), 4-10.
Alkali, Y., Ambe, J., Sabin, M., & Zacharin, M. (2015). Socio-economic status, lifestyle and
childhood obesity in Gombe. Nigerian Journal of Paediatrics, 42(2), 107-110.
Alwan, A. (2011). Global status report on noncommunicable diseases 2010: World Health
Organization.
Amin, T. T., Al-Sultan, A. I., & Ali, A. (2008). Overweight and Obesity and their Association
with Dietary Habits, and Sociodemographic Characteristics Among Male Primary
School Children in Al-Hassa, Kingdom of Saudi Arabia. Indian journal of community
medicine, 33(3).
References

48
Antonogeorgos, G., Panagiotakos, D., Papadimitriou, A., Priftis, K., Anthracopoulos, M., &
Nicolaidou, P. (2012). Breakfast consumption and meal frequency interaction with
childhood obesity. Pediatric obesity, 7(1), 65-72.
Anuradha, R., Sathyavathi, R., Reddy, T. M., Hemalatha, R., Sudhakar, G., Geetha, P., & Reddy,
K. K. (2015). Effect of social and environmental determinants on overweight and
obesity prevalence among adolescent school children. Indian Journal of
Endocrinology and Metabolism, 19(2), 283.
Berge, J. M., Wall, M., Loth, K., & Neumark-Sztainer, D. (2010). Parenting style as a predictor
of adolescent weight and weight-related behaviours. Journal of Adolescent Health,
46(4), 331-338.
Berge, J. M., Wall, M., Neumark-Sztainer, D., Larson, N., & Story, M. (2010). Parenting style
and family meals: cross-sectional and 5-year longitudinal associations. Journal of the
American Dietetic Association, 110(7), 1036-1042.
Bes-Rastrollo, M., Martínez-González, M. Á., Sánchez-Villegas, A., de la Fuente Arrillaga, C.,
& Martínez, J. A. (2006). Association of fiber intake and fruit/vegetable consumption
with weight gain in a Mediterranean population. Nutrition, 22(5), 504-511.
Bhardwaj, S., Misra, A., Khurana, L., Gulati, S., Shah, P., & Vikram, N. K. (2008). Childhood
obesity in Asian Indians: a burgeoning cause of insulin resistance, diabetes and sub-
clinical inflammation. Asia Pac J Clin Nutr, 17(Suppl 1), 172-175.
Bhuiyan, M. U., Zaman, S., & Ahmed, T. (2013). Risk factors associated with overweight and
obesity among urban school children and adolescents in Bangladesh: a case–control
study. BMC pediatrics, 13(1), 72.
Birch, L. L., & Fisher, J. O. (1998). Development of eating behaviours among children and
adolescents. Pediatrics, 101(Supplement 2), 539-549.
Bodor, J. N., Rice, J. C., Farley, T. A., Swalm, C. M., & Rose, D. (2010). The association between
obesity and urban food environments. Journal of Urban Health, 87(5), 771-781.
Boeke, C. E., Oken, E., Kleinman, K. P., Rifas-Shiman, S. L., Taveras, E. M., & Gillman, M. W.
(2013). Correlations among adiposity measures in school-aged children. BMC
pediatrics, 13(1), 99.
Branca, F., Nikogosian, H., & Lobstein, T. (2007). The challenge of obesity in the WHO
European Region and the strategies for response: summary: World Health
Organization.
Cart, L. R. S. M. (2012). Letter to the editor: standardized use of the terms “sedentary” and
“sedentary behaviours”.
Chaput, J.-P., & Tremblay, A. (2012). Insufficient sleep as a contributor to weight gain: an update.
Current Obesity Reports, 1(4), 245-256.
Chen, J.-L., & Kennedy, C. (2004). Family functioning, parenting style, and Chinese children’s
weight status. Journal of Family Nursing, 10(2), 262-279.

49
Cole, T. J., Bellizzi, M. C., Flegal, K. M., & Dietz, W. H. (2000). Establishing a standard
definition for child overweight and obesity worldwide: international survey. Bmj,
320(7244), 1240.
Cole, T. J., Flegal, K. M., Nicholls, D., & Jackson, A. A. (2007). Body mass index cut offs to
define thinness in children and adolescents: international survey. Bmj, 335(7612),
194.
Collings, P. J., Wijndaele, K., Corder, K., Westgate, K., Ridgway, C. L., Sharp, S. J., . . . Brage,
S. (2015). Prospective associations between sedentary time, sleep duration and
adiposity in adolescents. Sleep Medicine.
Control, C. f. D., & Prevention. (2011). School health guidelines to promote healthy eating and
physical activity. MMWR. Recommendations and reports: Morbidity and mortality
weekly report. Recommendations and reports/Centers for Disease Control, 60(RR-5),
1.
Crocker, P., Bailey, D. A., Faulkner, R. A., Kowalski, K. C., & McGRATH, R. (1997). Measuring
general levels of physical activity: preliminary evidence for the Physical Activity
Questionnaire for Older Children. Medicine and science in sports and exercise,
29(10), 1344-1349.
de Jong, E., Stocks, T., Visscher, T., HiraSing, R., Seidell, J., & Renders, C. (2012). Association
between sleep duration and overweight: the importance of parenting. International
Journal of Obesity, 36(10), 1278-1284.
De Onis, M., Blössner, M., & Borghi, E. (2010). Global prevalence and trends of overweight and
obesity among preschool children. The American journal of clinical nutrition, 92(5),
1257-1264.
de Onis, M., & Habicht, J.-P. (1996). Anthropometric reference data for international use:
recommendations from a World Health Organization Expert Committee. The
American journal of clinical nutrition, 64(4), 650-658.
De Silva, A. P., De Silva, S. H. P., Haniffa, R., Liyanage, I. K., Jayasinghe, K. S. A., Katulanda,
P., . . . Rajapakse, L. C. (2015). A cross sectional survey on social, cultural and
economic determinants of obesity in a low middle income setting. International
journal for equity in health, 14(1), 6.
Dehghan, M., Akhtar-Danesh, N., & Merchant, A. T. (2005). Childhood obesity, prevalence and
prevention. Nutrition journal, 4(1), 24.
Demerath, E. W. (2012). The genetics of obesity in transition. Collegium antropologicum, 36(4),
1161-1168.
Dennison, M. E., Sisson, S. B., Lora, K., Stephens, L. D., Copeland, K. C., & Caudillo, C. (2015).
Assessment of Body Mass Index, Sugar Sweetened Beverage Intake and Time Spent
in Physical Activity of American Indian Children in Oklahoma. Journal of community
health, 1-7.
Dietz, W. H. (1998). Health consequences of obesity in youth: childhood predictors of adult
disease. Pediatrics, 101(Supplement 2), 518-525.

50
Döring, N., de Munter, J., & Rasmussen, F. (2015). The associations between overweight, weight
change and health related quality of life: Longitudinal data from the Stockholm Public
Health Cohort 2002–2010. Preventive medicine.
Drewnowski, A., & Darmon, N. (2005). The economics of obesity: dietary energy density and
energy cost. The American journal of clinical nutrition, 82(1), 265S-273S.
Duncan, S., Duncan, E. K., Fernandes, R. A., Buonani, C., Bastos, K. D., Segatto, A. F., . . .
Freitas, I. F. (2011). Modifiable risk factors for overweight and obesity in children
and adolescents from São Paulo, Brazil. BMC public health, 11(1), 585.
Elías-Boneta, A. R., Toro, M. J., Garcia, O., Torres, R., & Palacios, C. (2015). High prevalence
of overweight and obesity among a representative sample of Puerto Rican children.
BMC public health, 15(1), 219.
Ezekiel, M. J., Talle, A., Juma, J. M., & Klepp, K.-I. (2009). “When in the body, it makes you
look fat and HIV negative”: The constitution of antiretroviral therapy in local
discourse among youth in Kahe, Tanzania. Social science & medicine, 68(5), 957-
964.
Finistrella, V., Manco, M., Corciulo, N., Sances, B., Di Pietro, M., Di Gregorio, R., . . . Ambruzzi,
A. M. (2015). Eating Disorders and Psychopathological Traits in Obese
Preadolescents and Adolescents. Journal of the American College of Nutrition(ahead-
of-print), 1-8.
Freedman, D. S., Wang, J., Ogden, C. L., Thornton, J. C., Mei, Z., Pierson, R. N., . . . Horlick,
M. (2007). The prediction of body fatness by BMI and skinfold thicknesses among
children and adolescents. Annals of human biology, 34(2), 183-194.
Giammattei, J., Blix, G., Marshak, H. H., Wollitzer, A. O., & Pettitt, D. J. (2003). Television
watching and soft drink consumption: associations with obesity in 11-to 13-year-old
schoolchildren. Archives of pediatrics & adolescent medicine, 157(9), 882-886.
Golan, M. (2006). Parents as agents of change in childhood obesity‐from research to practice.
International Journal of Pediatric Obesity, 1(2), 66-76.
Gulliford, M., Mahabir, D., Rocke, B., Chinn, S., & Rona, R. (2001). Overweight, obesity and
skinfold thicknesses of children of African or Indian descent in Trinidad and Tobago.
International journal of epidemiology, 30(5), 989-998.
Guo, S. S., Wu, W., Chumlea, W. C., & Roche, A. F. (2002). Predicting overweight and obesity
in adulthood from body mass index values in childhood and adolescence. The
American journal of clinical nutrition, 76(3), 653-658.
Gupta, N., Goel, K., Shah, P., & Misra, A. (2012). Childhood obesity in developing countries:
epidemiology, determinants, and prevention. Endocrine Reviews, 33(1), 48-70.
Guthold, R., Cowan, M. J., Autenrieth, C. S., Kann, L., & Riley, L. M. (2008). Physical inactivity
and sedentary behaviour among schoolchildren: A24-country comparison Physical
inactivity and sedentary behaviour among schoolchildren: A24-country comparison:
OMS.

51
Halliday, J., Palma, C., Mellor, D., Green, J., & Renzaho, A. (2013). The relationship between
family functioning and child and adolescent overweight and obesity: a systematic
review. International Journal of Obesity.
Himes, J. H. (2009). Challenges of accurately measuring and using BMI and other indicators of
obesity in children. Pediatrics, 124(Supplement 1), S3-S22.
Himes, J. H., Roche, A. F., & Webb, P. (1980). Fat areas as estimates of total body fat. The
American journal of clinical nutrition, 33(10), 2093-2100.
Holdsworth, M., Gartner, A., Landais, E., Maire, B., & Delpeuch, F. (2004). Perceptions of
healthy and desirable body size in urban Senegalese women. International journal of
obesity, 28(12), 1561-1568.
Hung, L.-S., Tidwell, D. K., Hall, M. E., Lee, M. L., Briley, C. A., & Hunt, B. P. (2015). A Meta-
Analysis of School-Based Obesity Prevention Programs Demonstrates Limited
Efficacy of Decreasing Childhood Obesity. Nutrition Research.
Itoi, A., Yamada, Y., Watanabe, Y., & Kimura, M. (2012). Physical activity, energy intake, and
obesity prevalence among urban and rural schoolchildren aged 11–12 years in Japan.
Applied Physiology, Nutrition, and Metabolism, 37(6), 1189-1199.
Izuora, A., Animasahun, B., Nwodo, U., Ibeabuchi, N., Njokanma, O., & Renner, J. (2013).
Assessment of overweight and obesity among Nigerian children and adolescents
using triceps skin‐fold thickness and body mass index. Clinical obesity, 3(3-4), 103-
111.
Kalman, M., Inchley, J., Sigmundova, D., Iannotti, R. J., Tynjälä, J. A., Hamrik, Z., . . . Bucksch,
J. (2015). Secular trends in moderate-to-vigorous physical activity in 32 countries
from 2002 to 2010: a cross-national perspective. The European Journal of Public
Health, 25(suppl 2), 37-40.
Kaphingst, K. M., & French, S. (2006). The role of schools in obesity prevention. The Future of
Children, 16(1), 109-142.
Kapil, U., & Bhadoria, A. S. (2014). Television viewing and overweight and obesity amongst
children. Biomed J, 37, 337-338.
Karimi, B., & Ghorbani, R. (2015). Overweight and Obesity in the Iranian Schoolchildren.
Katz, D., O'connell, M., Njike, V. Y., Yeh, M., & Nawaz, H. (2008). Strategies for the prevention
and control of obesity in the school setting: systematic review and meta-analysis.
International Journal of Obesity, 32(12), 1780-1789.
Keane, E., Kearney, P. M., Perry, I. J., Kelleher, C. C., & Harrington, J. M. (2014). Trends and
prevalence of overweight and obesity in primary school aged children in the Republic
of Ireland from 2002-2012: a systematic review. BMC public health, 14(1), 974.
Keding, G. B., Msuya, J. M., Maass, B. L., & Krawinkel, M. B. (2013). Obesity as a public health
problem among adult women in rural Tanzania. Global Health: Science and Practice,
1(3), 359-371.
Kelishadi, R., Hashemi Pour, M., Sarraf‐Zadegan, N., Ansari, R., Alikhassy, H., & Bashardoust,
N. (2003). Obesity and associated modifiable environmental factors in Iranian

52
adolescents: Isfahan Healthy Heart Program− Heart Health Promotion from
Childhood. Pediatrics International, 45(4), 435-442.
Kelley, G. A., & Kelley, K. S. (2013). Effects of exercise in the treatment of overweight and
obese children and adolescents: a systematic review of meta-analyses. Journal of
obesity, 2013.
Kesztyüs, D., Schreiber, A., Kobel, S., Wartha, O., Kesztyüs, T., Kilian, R., & Steinacker, J. M.
(2014). Illness and determinants of health-related quality of life in a cross-sectional
sample of schoolchildren in different weight categories. GMS German Medical
Science, 12.
Koplan, J., Liverman, C. T., & Kraak, V. I. (2005). Preventing childhood obesity: health in the
balance: National Academies Press.
Koss, S., Shankar, P., & Ahuja, S. (2015). Obesity Among Youth-Is Sleep Deprivation One of
the Causes?
Kosti, R. I., & Panagiotakos, D. B. (2006). The epidemic of obesity in children and adolescents
in the world. Central European journal of public health, 14(4).
Kouéta, F., Dao, L., Dao, F., Djekompté, S., Sawadogo, J., Diarra, Y., . . . Sawadogo, A. (2010).
[Factors associated with overweight and obesity in children in Ouagadougou (Burkina
Faso)]. Sante (Montrouge, France), 21(4), 227-231.
Kramoh, K., N'goran, Y., Ake-Traboulsi, E., Boka, B., Harding, D., Koffi, D., . . . Guikahue, M.
(2012). [Prevalence of obesity in school children in Ivory Coast]. Paper presented at
the Annales de cardiologie et d'angeiologie.
Kyallo, F., Makokha, A., & Mwangi, A. M. (2013). Overweight and obesity among public and
private primary school children in Nairobi, Kenya. Health, 2013.
Laxmaiah, A., Nagalla, B., Vijayaraghavan, K., & Nair, M. (2007). Factors Affecting Prevalence
of Overweight Among 12‐to 17‐year‐old Urban Adolescents in Hyderabad, India.
Obesity, 15(6), 1384-1390.
Lehnert, T., Sonntag, D., Konnopka, A., Riedel-Heller, S., & König, H.-H. (2013). Economic
costs of overweight and obesity. Best Practice & Research Clinical Endocrinology &
Metabolism, 27(2), 105-115.
Li, L., Shen, T., Wen, L. M., Wu, M., He, P., Wang, Y., . . . He, G. (2015). Lifestyle factors
associated with childhood obesity: a cross-sectional study in Shanghai, China. BMC
research notes, 8(1), 6.
Lobstein, T., Jackson-Leach, R., Moodie, M. L., Hall, K. D., Gortmaker, S. L., Swinburn, B. A.,
. . . McPherson, K. (2015). Child and adolescent obesity: part of a bigger picture. The
Lancet.
Lohman, T., Roche, A., & Martorell, R. (1988). Anthropometric standardization reference
manual. Champaign, IL: Human Kinetics: Inc.
Manios, Y., Moschonis, G., Androutsos, O., Filippou, C., Van Lippevelde, W., Vik, F. N., . . .
Bere, E. (2014). Family sociodemographic characteristics as correlates of children’s
breakfast habits and weight status in eight European countries. The ENERGY

53
(EuropeaN Energy balance Research to prevent excessive weight Gain among Youth)
project. Public health nutrition, 1-10.
Masuet-Aumatell, C., Ramon-Torrell, J., Banque-Navarro, M., Dávalos-Gamboa, M. R., &
Montano-Rodriguez, S. (2012). [Prevalence of overweight and obesity in children and
adolescents from Cochabamba (Bolivia); a cross-sectional study]. Nutricion
hospitalaria, 28(6), 1884-1891.
Meko, L. N., Slabber-Stretch, M., Walsh, C. M., Kruger, S. H., & Nel, M. (2015). School
environment, socioeconomic status and weight of children in Bloemfontein, South
Africa. African Journal of Primary Health Care & Family Medicine, 7(1), 7 pages.
Minghelli, B., Nunes, C., & Oliveira, R. (2013). Prevalence of overweight and obesity in
portuguese adolescents: Comparison of different anthropometric methods. North
American journal of medical sciences, 5(11), 653.
Mocanu, V. (2013). Prevalence of overweight and obesity in urban elementary school children in
Northeastern Romania: Its relationship with socioeconomic status and associated
dietary and lifestyle factors. BioMed research international, 2013.
Mohammadpour-Ahranjani, B., Pallan, M., Rashidi, A., & Adab, P. (2014). Contributors to
childhood obesity in Iran: the views of parents and school staff. Public health, 128(1),
83-90.
Mohammed, H., & Vuvor, F. (2012). Prevalence of childhood overweight/obesity in basic school
in Accra. Ghana medical journal, 46(3), 124.
Moshi Municipal Investment Profile (2013) Moshi Municipal Investment Profile Moshi
Municipal Council, Kilimanjaro Region
Mosha, T., & Fungo, S. (2010). Prevalence of overweight and obesity among children aged 6-12
years in Dodoma and Kinondoni Municipalities, Tanzania. Tanzania journal of health
research, 12(1), 6-16.
Muhihi, A. J., Mpembeni, R. N., Njelekela, M. A., Anaeli, A., Chillo, O., Kubhoja, S., . . .
Ngarashi, D. (2013). Prevalence and determinants of obesity among primary school
children in Dar es Salaam, Tanzania. Archives of Public Health, 71(1), 1-8.
Muhihi, A. J., Njelekela, M. A., Mpembeni, R., Mwiru, R. S., Mligiliche, N., & Mtabaji, J. (2012).
Obesity, overweight, and perceptions about body weight among middle-aged adults
in Dar es Salaam, Tanzania. ISRN obesity, 2012.
Must, A. (1996). Morbidity and mortality associated with elevated body weight in children and
adolescents. The American journal of clinical nutrition, 63(3), 445S-447S.
Muthuri, S. K., Francis, C. E., Wachira, L.-J. M., LeBlanc, A. G., Sampson, M., Onywera, V. O.,
& Tremblay, M. S. (2014). Evidence of an overweight/obesity transition among
school-aged children and youth in Sub-Saharan Africa: A systematic review. PloS
one, 9(3), e92846.
Mwaikambo, S. A. (2012). Prevalence and Factors Associated with Overweight and Obesity
Among Primary School Children in Kinondoni District, Dar-es-salaam. Muhimbili
University of Health and Allied Sciences.

54
Ng, M., Fleming, T., Robinson, M., Thomson, B., Graetz, N., Margono, C., . . . Abera, S. F.
(2014). Global, regional, and national prevalence of overweight and obesity in
children and adults during 1980–2013: a systematic analysis for the Global Burden
of Disease Study 2013. The Lancet.
Nooyens, A. C., Koppes, L. L., Visscher, T. L., Twisk, J. W., Kemper, H. C., Schuit, A. J., . . .
Seidell, J. C. (2007). Adolescent skinfold thickness is a better predictor of high body
fatness in adults than is body mass index: the Amsterdam Growth and Health
Longitudinal Study. The American journal of clinical nutrition, 85(6), 1533-1539.
Nowicka, P., & Flodmark, C. E. (2007). Physical activity—key issues in treatment of childhood
obesity. Acta Paediatrica, 96(s454), 39-45.
Ogden, C. L., Carroll, M. D., Kit, B. K., & Flegal, K. M. (2014). Prevalence of childhood and
adult obesity in the United States, 2011-2012. Jama, 311(8), 806-814.
Owens, J., Au, R., Carskadon, M., Millman, R., Wolfson, A., Braverman, P. K., . . . Marcell, A.
V. (2014). Insufficient sleep in adolescents and young adults: an update on causes and
consequences. Pediatrics, 134(3), e921-e932.
Padilla, N., Biason, M.-L., & Ledesert, B. (2011). [Prevalence and risk factors of overweight
among 5-to 11-year-old schoolchildren in Narbonne, France]. Sante publique
(Vandoeuvre-les-Nancy, France), 24(4), 317-328.
Passos, D., Gigante, D., Maciel, F., & Matijasevich, A. (2015). [Children's eating behaviour:
comparison between normal and overweighted children in a school of Pelotas, Rio
Grande do Sul, Brazil.]. Revista paulista de pediatria: orgao oficial da Sociedade de
Pediatria de Sao Paulo.
Patterson, R., Risby, A., & Chan, M.-Y. (2012). Consumption of takeaway and fast food in a
deprived inner London Borough: are they associated with childhood obesity? BMJ
open, 2(3).
Penney, T. L., Almiron-Roig, E., Shearer, C., McIsaac, J.-L., & Kirk, S. F. (2014). Modifying the
food environment for childhood obesity prevention: challenges and opportunities.
Proceedings of the Nutrition Society, 73(02), 226-236.
Posso, M., Brugulat-Guiteras, P., Puig, T., Mompart-Penina, A., Medina-Bustos, A., Alcañiz, M.,
. . . Tresserras-Gaju, R. (2014). [Prevalence and determinants of obesity in children
and young people in Catalonia, Spain, 2006-2012]. Medicina clinica, 143(11), 475-
483.
Prasad, M., Thomas, J. V., & Bhatia, P. (2015). Prevalence of Overweight and Obesity among
Rural High School Children in Patancheru, Andhra Pradesh. International Journal of
Contemporary Medicine, 3(1), 65-70.
Puoane, T., Tsolekile, L., & Steyn, N. (2010). Perceptions about body image and sizes among
black African girls living in Cape Town.
Rahman, M., Reza, S., Islam, M., Rahman, A., & Nath, A. (2015). Prevalence of Obesity and
Overweight among English Medium School Children of Dhaka City in Bangladesh.
Journal of Environmental Science and Natural Resources, 7(1), 63-67.

55
Riazi, A., Shakoor, S., Dundas, I., Eiser, C., & McKenzie, S. A. (2010). Health-related quality of
life in a clinical sample of obese children and adolescents. Health and quality of life
outcomes, 8(1), 134.
Rolland-Cachera, M. (1993). Body composition during adolescence: methods, limitations and
determinants. Hormone Research in Paediatrics, 39(Suppl. 3), 25-40.
Rolls, B. J., Ello‐Martin, J. A., & Tohill, B. C. (2004). What can intervention studies tell us about
the relationship between fruit and vegetable consumption and weight management?
Nutrition reviews, 62(1), 1-17.
Samuelson, G. (2004). Global strategy on diet, physical activity and health. Food & Nutrition
Research, 48(2), 57-57.
Sardinha, L. B., Going, S. B., Teixeira, P. J., & Lohman, T. G. (1999). Receiver operating
characteristic analysis of body mass index, triceps skinfold thickness, and arm girth
for obesity screening in children and adolescents. The American journal of clinical
nutrition, 70(6), 1090-1095.
Sarria, A., Garcia-Llop, L., Moreno, L., Fleta, J., Morellon, M., & Bueno, M. (1998). Skinfold
thickness measurements are better predictors of body fat percentage than body mass
index in male Spanish children and adolescents. European Journal of clinical
nutrition, 52(8), 573.
Schneider, A. C. R., Pinto, R. B., & Silveira, T. R. d. (2007). Nutritional risk and malnutrition
determination by anthropometry in cirrhotic children and adolescents. Arquivos de
gastroenterologia, 44(4), 345-349.
Singh, M., & Sharma, M. (2005). Risk factors for obesity in children. Indian pediatrics, 42(2),
183-185.
Strong, W. B., Malina, R. M., Blimkie, C. J., Daniels, S. R., Dishman, R. K., Gutin, B., . . .
Pivarnik, J. M. (2005). Evidence based physical activity for school-age youth. The
Journal of pediatrics, 146(6), 732-737.
Te Velde, S. J., Twisk, J. W., & Brug, J. (2007). Tracking of fruit and vegetable consumption
from adolescence into adulthood and its longitudinal association with overweight.
British Journal of Nutrition, 98(02), 431-438.
Thanh, N. (2008). Obesity and Related Factors among Students Grade 7–12 In Phuttha Monthon
District, Nakhon Pathom Provice, Thailand. Mahidol University.
Tremblay, M. S., LeBlanc, A. G., Janssen, I., Kho, M. E., Hicks, A., Murumets, K., . . . Duggan,
M. (2011). Canadian sedentary behaviour guidelines for children and youth. Applied
Physiology, Nutrition, and Metabolism, 36(1), 59-64.
Trogdon, J., Finkelstein, E., Hylands, T., Dellea, P., & Kamal‐Bahl, S. (2008). Indirect costs of
obesity: a review of the current literature. Obesity Reviews, 9(5), 489-500.
van Sluijs, E. M., Fearne, V. A., Mattocks, C., Riddoch, C., Griffin, S. J., & Ness, A. (2009). The
contribution of active travel to children's physical activity levels: cross-sectional
results from the ALSPAC study. Preventive medicine, 48(6), 519-524.

56
Van Stralen, M., Te Velde, S., Van Nassau, F., Brug, J., Grammatikaki, E., Maes, L., . . . Iotova,
V. (2012). Weight status of European preschool children and associations with family
demographics and energy balance‐related behaviours: a pooled analysis of six
European studies. Obesity Reviews, 13(s1), 29-41.
Verloigne, M., Van Lippevelde, W., Maes, L., Brug, J., & De Bourdeaudhuij, I. (2012). Family-
and school-based correlates of energy balance-related behaviours in 10–12-year-old
children: a systematic review within the ENERGY (EuropeaN Energy balance
Research to prevent excessive weight Gain among Youth) project. Public health
nutrition, 15(08), 1380-1395.
Vilchis-Gil, J., Galván-Portillo, M., Klünder-Klünder, M., Cruz, M., & Flores-Huerta, S. (2015).
Food habits, physical activities and sedentary lifestyles of eutrophic and obese school
children: a case–control study. BMC public health, 15(1), 124.
Wang, Y. (2001). Cross-national comparison of childhood obesity: the epidemic and the
relationship between obesity and socioeconomic status. International journal of
epidemiology, 30(5), 1129-1136.
Wang, Y., & Lobstein, T. (2006). Worldwide trends in childhood overweight and obesity.
International Journal of Pediatric Obesity, 1(1), 11-25.
Wang, Y. C., McPherson, K., Marsh, T., Gortmaker, S. L., & Brown, M. (2011). Health and
economic burden of the projected obesity trends in the USA and the UK. The Lancet,
378(9793), 815-825.
Warburton, D. E., Nicol, C. W., & Bredin, S. S. (2006). Health benefits of physical activity: the
evidence. Canadian medical association journal, 174(6), 801-809.
Waters, E., de Silva Sanigorski, A., Hall, B., Brown, T., Campbell, K., Gao, Y., . . . Summerbell,
C. (2011). Interventions for preventing obesity in children (review). Cochrane
collaboration(12), 1-212.
WHO. (2000). Obesity: preventing and managing the global epidemic: World Health
Organization.
WHO. (2008). Physical inactivity: a global public health problem. World Health Organization,
Geneva.
WHO. (2010). Global recommendations on physical activity for health.
Yamamoto-Kimura, L., Alvear-Galindo, M., Morán-Álvarez, C., Acuña-Sánchez, M., Torres-
Durán, P., Juárez-Oropeza, M., . . . Solís-Díaz, M. (2012). Activities after school time
and obesity in children. Infl fluence of family and neighborhood environment.

A1
Appendices
Appendix 1 Demographic data and Physical Activity questionnaire
Questionnaire No………….
Date: ………….
Name of School: ………….………….………….………….………….
School Location: ………….………….………….
Part A: Demographic characteristics
1. Pupil’s Age (Years): ………….
2. Sex: Male…………. Female: ………….
3. Residence: ………….………….………….………….
4. Father’s education
a) No formal education
b) Primary education
c) Secondary education
d) Post-secondary education / college
e) Not applicable
5. Mother’s education
a) No formal education
b) Primary education
c) Secondary education
d) Post-secondary education / college
e) Not applicable
6. Father’s occupation
a) Self-employed/Casual work/petty business
b) Formally employed-private or government employee
c) Unemployed

A2
7. Mother’s occupation
a) Self-employed/Casual work/petty business
b) Formally employed-private or government employee
c) Unemployed
d) House wife
8. Who is the head of the household where you live?
a) Male head HH (Father)
b) Female head HH (Mother)
c) Child headed HH
d) Grandparent head HH
e) Other adult living in H
9. What is the total number of individuals living in your household
a) 2
b) 3
c) 4
d) 5
e) 6+
Part B: Anthropometric measurements
1. Height (cm): ………….
2. Weight (kg): …………. BMI______________________
3. Skinfold thickness
Number of
times
Triceps (back of mid-upper arm)
(mm)
Subscapular (below the shoulder blade)
(mm)
Average

A3
Part C: Physical Activity
C1: Personal fitness
1. Please put a time in each box
Average over the past year
At what time do you normally
get up?
At what time do you
normally go to bed?
On a weekday
On a weekend day
2. Which form of transport do you use most often when going to school?
Please tick (✓) one box ONLY per line
Distance of journeys
(Approximate time in minutes)
Usual mode of transport
Car Walk Public
transport
Cycle School bus
Less than 30minutes
30minutes to 1 hour
More than 1hour
C2: School Physical Education
3. Do you usually participate in sports activities (by playing)?
4. If yes, what types of sports do you usually play? Please tick (✓)
Football Cycling Running Swimming Volleyball Aerobics Others
(specify)
5. For how long (in minutes) do you play the sports above?
Football Cycling Running Swimming Volleyball Aerobics Others
6. How many times per week do you participate in sports activities during physical education
lesson………………………………
7. For how long in a day? ………………………hours/minutes
Yes: No:

A4
C3: Home Activities
8. Did you do the following activities during your free time in the past 7 days?
Weekdays
Total
hours/minutes
Weekend
Total
hours/minutes Art & craft (e.g. pottery, sewing, drawing, painting)
No Yes
Doing homework No Yes
Listen to music No Yes
Play indoors with toys No Yes
Playing board games / cards No Yes
Playing computer games (e.g. PlayStation / Gameboy)
No Yes
Playing musical instrument No Yes
Reading No Yes
Sitting talking No Yes
Talk on the phone No Yes
Using computer / internet No Yes
Watching TV / videos No Yes
C4: House Activities
9. What other activities (house chores), do you usually perform while at home? Please tick
(✓) and indicate number of hours
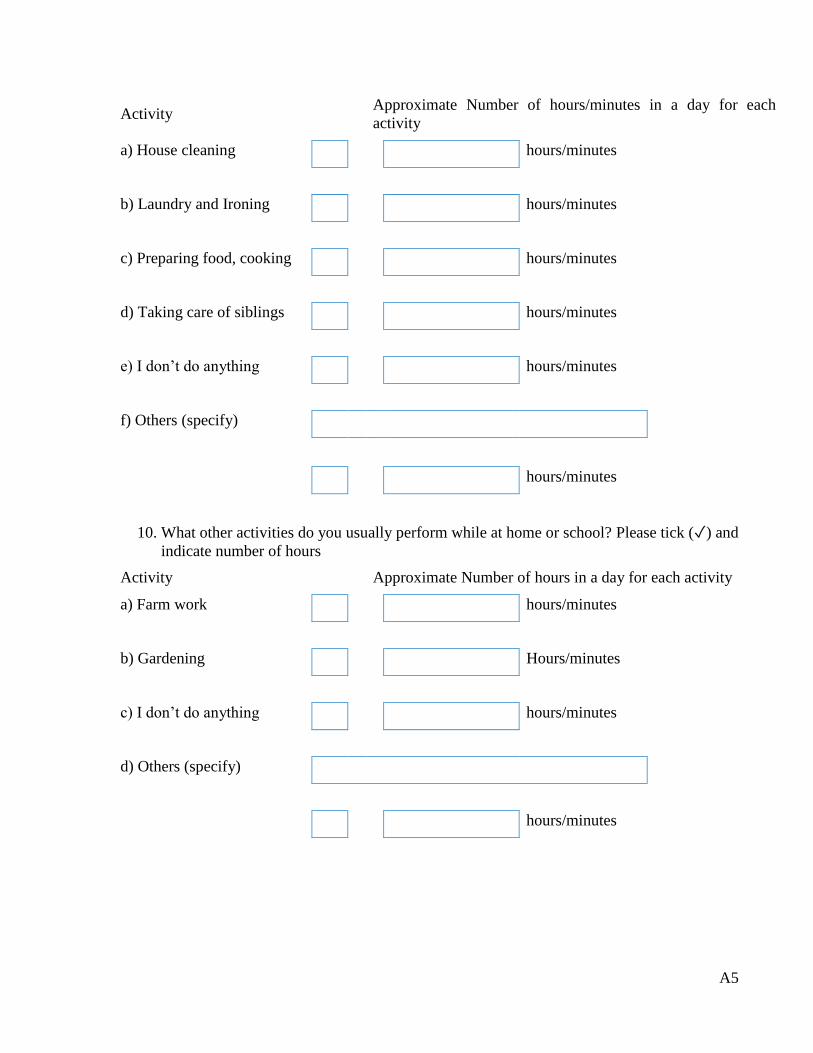
A5
Activity Approximate Number of hours/minutes in a day for each
activity
a) House cleaning hours/minutes
b) Laundry and Ironing hours/minutes
c) Preparing food, cooking hours/minutes
d) Taking care of siblings hours/minutes
e) I don’t do anything hours/minutes
f) Others (specify)
hours/minutes
10. What other activities do you usually perform while at home or school? Please tick (✓) and
indicate number of hours
Activity Approximate Number of hours in a day for each activity
a) Farm work hours/minutes
b) Gardening Hours/minutes
c) I don’t do anything hours/minutes
d) Others (specify)
hours/minutes

A6
Part D. Questions related to dietary habits
1. Are you given any money for buying food or drinks while at school or outside home?
a) Yes
b) No
2. If yes, on average how much money are you given per day? _______________________
3. How many times per week do you buy foods/ drinks sold in school or away from home?
a) Once
b) 2-4times
c) 5-6 times
4. What type of food do you usually buy at school or away from home? _____________
5. Are you given lunch at school?
a) Yes
b) No
6. If yes, what type of food are you usually given at school? _____________________
7. Are you given any food at home to take to school?
a) Yes
b) No
8. If yes, what type of food do you usually take to school? ____________________
9. How many times per week do you take food to school?
a) Once
b) 2-4times
c) 5-6 times
10. Do you usually eat breakfast before going to school?
a) Yes
b) No
11. If yes, on average how many times per week do you take breakfast?
a) Once
b) 2-4times
c) 5-6 times

A7
12. Do you usually eat fruits?
a) Yes
b) No
13. If yes on average how many times per weeks do you eat fruits? ...............days per week
a) 1-2 days
b) 3-4days
c) More than 4 times
13. Do you usually eat vegetables?
a) Yes
b) No
14. If yes, on average how many times per week do you eat vegetables?
......................days per week
a) 1-2 days
b) 3-4days
c) More than 5 days

A8
Appendix 2 Permission to conduct a study
MOSHI MUNICIPAL COUNCIL (All correspondence be addressed to the Municipal director)
MUNICIPAL DIRECTOR: + 255-027-2752344
MUNICIPAL HALL
ALL OFFICE: +255-027-2752906 P.O BOX 318
E-MAIL: [email protected] MOSHI.
WEBSITE: www.moshimc.go.tz
Blog-manispaayamoshi.com 17.7.2014
TELEGRAPHIC ADDRESS: MANISPAA
Ref. No. MMC/A.40/13/1/130
Ms. Josephine Thadeus Kimario,
Researcher,
Gent University,
Faculty of Bioscience Engineering,
Belgium.
RE: PERMISSION TO CONDUCT A RESEARCH
Refer to the above heading and your letter dated 24th June, 2014 from Gent University, Faculty of
Bioscience engineering regarding the permission to conduct the study with the title Prevalence of
Obesity and Overweight among School Children in Moshi Municipality, Kilimanjaro, Tanzania.
With this letter, the permission has been granted to you to conduct the study in our Municipality
starting from 17th July to 25th July 2014.
Best regards
Gloria S. Haule
For; MUNICIPAL DIRECTOR, MOSHI
C.C: HOD-Education Primary,
MOSHI MUNICIPALITY

A9
Appendix 3 Informed Consent Form
To Head Teacher
Title of the study: Prevalence of Obesity and Overweight among School Children in Moshi
Municipality, Kilimanjaro, Tanzania.
I am a student at Ghent University pursuing masters in Nutrition and rural Development, main
subject Human Nutrition.
Your school has been selected to participate in the study. The purpose of the study is to identify
the prevalence of Obesity and Overweight among school children aged 10-12 years in Moshi
Municipality – Kilimanjaro, Results that will be obtained from this study will be used to propose
school based intervention methods for prevention of overweight and obesity among primary school
children. The study results will be disseminated through a publication and in a thesis for academic
purpose. In this study children will be interviewed on questions related to potential risk factors for
the development of overweight and obesity, demographical data will also be taken.
There are no straight benefits for participating in the study. But the study will obtain the information
on risk factors for overweight and obesity. The study will recommend preventive measures that
can be adopted by schools or parents to prevent children from becoming overweight or obese.
Please note that your school’s participation in this study is voluntary and you have a right to refuse
to consent. If you consent for your school to participate you have the right to withdraw your school
from the study at any time if you wish to do so.
There are no risks or discomforts involved in this study. Children will be asked questions and their
height, weight, triceps and subscapular skinfold thicknesses measurements will be taken in a non-
invasive ways.
Names of interviewed children will not appear on the questionnaire and no record of their
participation as individuals will be kept.
I confirm that I have read carefully and understood the information provided and consent for my
school to participate in the study. I am aware that I can freely withdraw my school from this study
any time I wish to do so.
Signature of the participant (Head Teacher) ______________________________
Date: __________________________________
Signature of Researcher __________________________
Date _________________________

A10
Appendix 4 Internation cutoff points for body mass index for overweight and
obesity by Sex between 2 and 18 years,defined to pass through the
BMI of 25 and 30kg/m2 at age of 18 years
Source: (Cole et al., 2000)
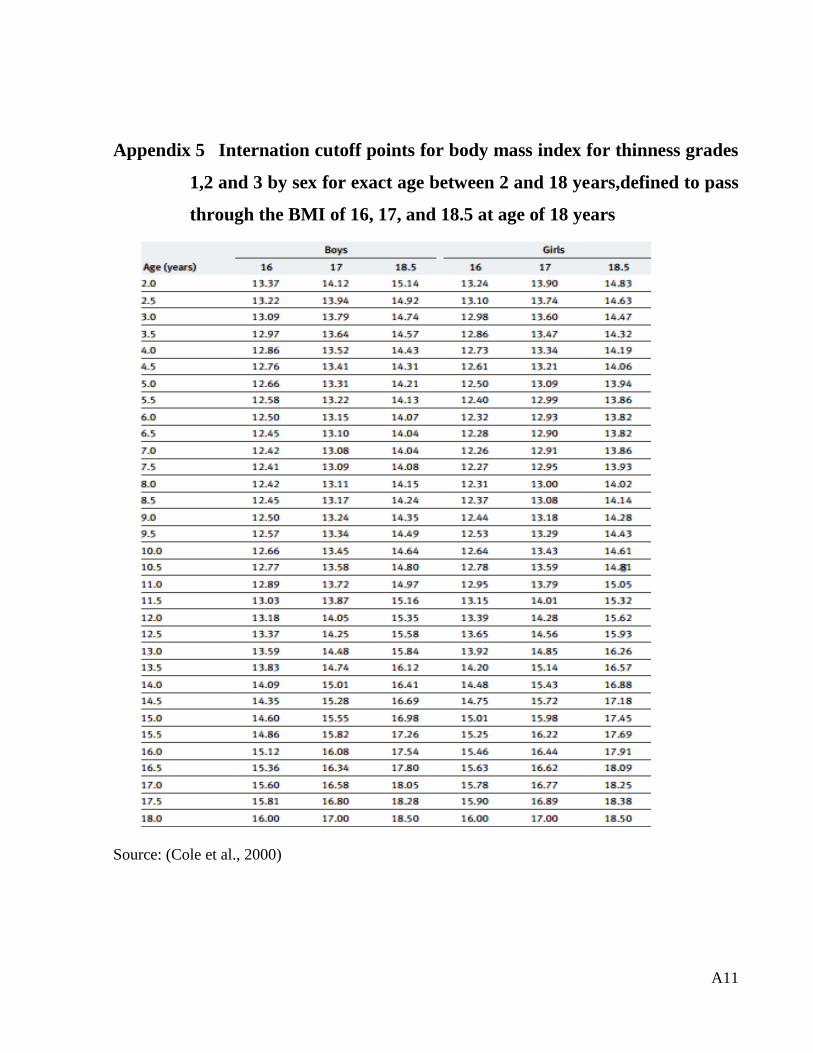
A11
Appendix 5 Internation cutoff points for body mass index for thinness grades
1,2 and 3 by sex for exact age between 2 and 18 years,defined to pass
through the BMI of 16, 17, and 18.5 at age of 18 years
Source: (Cole et al., 2000)

A12
Appendix 6 Smoothed percentiles for Subscapular skinfold for age (mm): boys
aged 1.50 – 19.99years
Source : Addo & Himes, 2010b

A13
Appendix 7 Smoothed percentiles for Triceps skinfold for age (mm): boys aged
1.50 – 19.99years
Source : Addo & Himes, 2010b

A14
Appendix 8 Smoothed percentiles for Subscapular Skinfolds for age (mm):
girls aged 1.50 -19.99years
Source: Addo & Himes, 2010b
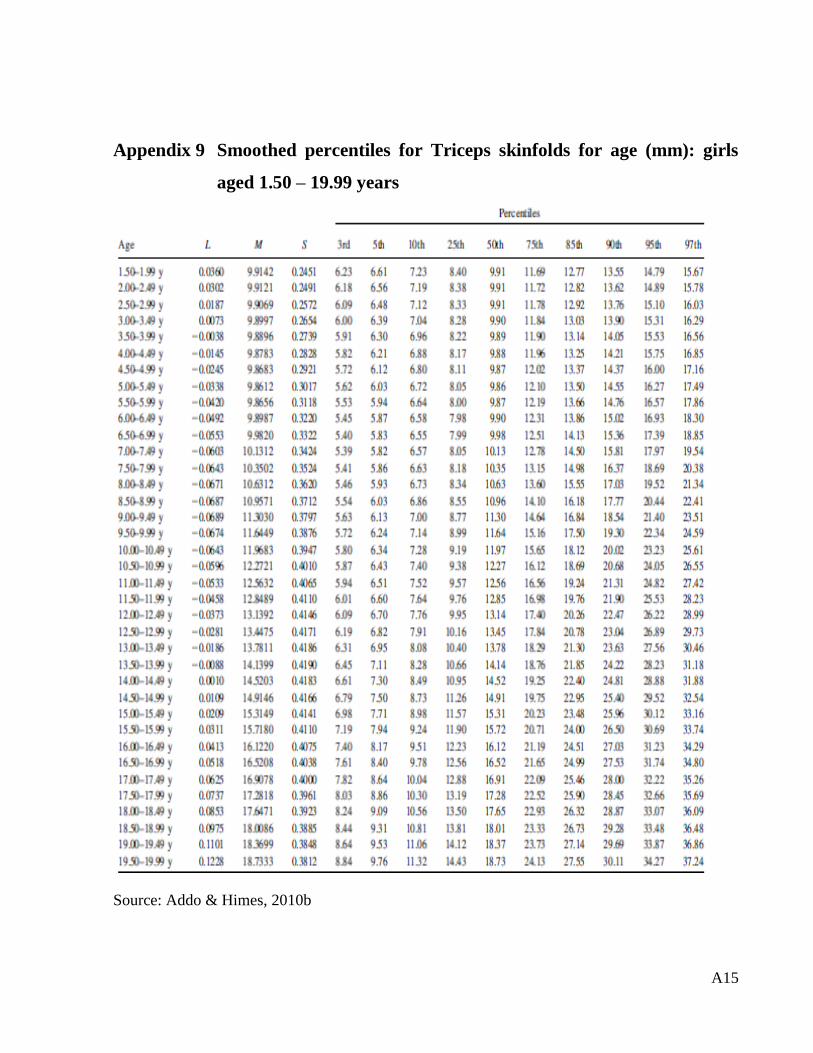
A15
Appendix 9 Smoothed percentiles for Triceps skinfolds for age (mm): girls
aged 1.50 – 19.99 years
Source: Addo & Himes, 2010b