


Languages
Pages
Legal


ORIGINAL ARTICLE
Preliminary parametric estimation of steel weight for new ships
Cheng-Kuan Lin1 · Heiu-Jou Shaw1
Received: 20 February 2015 / Accepted: 26 September 2015 / Published online: 30 October 2015
© JASNAOE 2015
Abstract This paper presents an agile method for accu-
rately estimating the steel weight of a new ship in the
preliminary design stage. A container ship database within
a three-dimensional computer-aided design system was
used to facilitate the division of a ship into several esti-
mated structural sections, including the forward, cargo,
engine room, aft, etc. This procedure is an improvement
over the traditional parametric estimation process, which
only estimates a rough weight for an entire ship based on
specific empirical formulas and then assigns a weight to
each part of the ship manually. To estimate the steel weight
of a new ship, the parameters of the individual sections are
referenced from a similar vessel automatically selected
using the principal dimension. Next, principal component
analysis is applied to define the principal parameters, i.e.,
the principal dimension, the feature of each section and the
fitting coefficient of the principal parameters. The general
equations with the highest correlative predictor variables
for the individual sections are then obtained by regression.
Comparing the estimation variability, the section estima-
tion provides a more accurate steel weight and constitutes a
new means of efficiently obtaining the weight distribution
to support the various aspects of preliminary design, i.e.,
the determination of the center of gravity, the design of the
ship lines and ship performance evaluation.
Keywords Light ship weight · Steel weight estimation ·
Preliminary ship design · Principal component analysis
1 Introduction
The estimation of steel weight is an important task for the
design and cost calculation of merchant ships. Because the
steel weight is the main component of the weight of a light
ship [1], it accounts for more than 70 % of the weight
component and 20 % of the material costs in large con-
tainer ships with capacities greater than 8000 twenty-foot
equivalent units (TEU), as determined using our research
database. Therefore, this measurement decisively influ-
ences the weight calculation and is also a critical cost item
in the tender of a new shipbuilding contract.
During this preliminary design phase, it is difficult to
conduct the detailed weight calculations necessary for a
new type of ship. Because neither a completed three-di-
mensional (3D) computer-aided design (CAD) ship model
nor a reasonable general arrangement plan has been pre-
pared in this phase, only a rough arrangement is available
using the principal available parameters. Hence, we con-
centrate on developing a quick and precise method for steel
weight estimation using the specific parameters obtained in
the design phase.
The classic parametric method, shown in Fig. 1, only
provides a rough estimate of the hull weight based on
overall ship parameters and does not reflect local design
features. The use of parametric estimation based on several
reference ships and regression lines by the use of built-in
formulas. Many approximate methods using parametric
formulae have been derived based on such minimal infor-
mation, i.e., the length L, breadth B, depth D, draft d, andblock coefficient CB [1–5]. As the parametric estimations,
the format of the equation is often a combination of the
correlative principal parameters to obtain linear, area or
volume relationships using L, B, D, and CB. A review of
the formats of these formulas identified
& Cheng-Kuan Lin
1 Department of Systems and Naval Mechatronic Engineering,
National Cheng Kung University, Tainan, Taiwan, ROC
123
J Mar Sci Technol (2016) 21:227–239
DOI 10.1007/s00773-015-0345-y

k 9 La 9 Bb 9 Dc 9 CBd (cubic number) [6] and k 9 La
(B + D) [7] as the two most popular forms; functions of
these types are still used in ship design today. However,
these studies only used fixed arguments and did not con-
sider the optimum values of k, a, b, c, d [8, 9]. The
estimated result influences aspects related to the prelimi-
nary design, i.e., the center of gravity, speed and power
calculations; the design of ship lines for performance
evaluation; and the cost of a new ship.
The standards for steel used in ship design have been
raised over time. For example, a bulk carrier satisfying the
common structural rules will have a higher hull steel
weight [10]; the hull steel weight also can be reduced by
the use of high tensile steel [1, 11]. The parametric esti-
mation method is generally only relevant to the parameters
of the entire ship and does not reflect changes in the local
design features, such as the parallel mid-ship section, bow
type, and forecastle patterns. Although this method could
be quickly introduced for general use, the choice of the
appropriate formula and coefficients for a particular ship
type has been a historically difficult issue in practical
applications.
To obtain more accurate estimations, a practical method
based on the midship section design is widely used by
classification societies and shipyards. The weight can be
calculated by designing the scantlings of the midship sec-
tion, calculating the structural limits and bending moments,
and estimating the weight distribution [12]. For more
precise estimates, the ship can be divided into sections that
are considered separately. However, the need for human
intervention and the processing time required for the design
process is still the major limit in the early design stage,
despite the emergence of CAD systems as powerful design
tools.
As a result of the capabilities of CAD, ship division is
a popular methodology for the initial estimation in the
industry. In a previous study, a segment framework of
the ship structure was applied to estimate the preliminary
cost [13]. The qualitative complexity criteria have also
been considered for estimating six segments of a ship in
the concept design stage [14]. Mano applied a section-
based method to estimate the weight of the sections,
including the fore, cargo, aft and superstructures. This
method is based on the midship section design, which
calculates the steel weight of the longitudinal structures
using the principal dimensions and length of the section
and calculates the weight of the bulkheads by summing
the lengths of all the bulkheads for each section. This
method also considers the influence of high tensile steel
by analyzing the midship section design [15]. Because it
requires more information due to the inclusion of the
bulkheads, this approach is better suited to cases in
which the general arrangement and subdivisions are
already approximately known. In another study, a fea-
ture-based method based on principal component analysis
(PCA) was presented to analyze and estimate the seg-
ment weight of ships [16]. We adopt this concept aiming
to design a new parametric method that divides the main
hull into several estimated sections. In this design
approach, a ship is divided into several sections,
including the fore, aft, engine room, deckhouse, etc.
Each section can be represented by the specific block of
various differently built ships. By the association of local
variables, the method is able to consider individual dif-
ferences in weight. However, a parametric estimation
that combines section estimations is quite complex for
the selection of the significant associated parameters and
their appropriate coefficients. Therefore, this study
focuses on the question of how to obtain the best-fitting
regression model for the reasonable partition of the
entire ship by automatically selecting the parameters and
reference data. The relationship between the principal
dimension parameters and the section parameters is then
identified. Using the main dimension parameters, the
method estimates the section parameters, which are in
turn used to estimate the section weight in a simple
model.
In this paper, we propose an innovative estimation
method, parametric section-based estimation (PSE), which
derives the optimum coefficient of the individual parameter
applied to support the division of a ship into several
Preliminary Ship Design
Principal Dimension Decision
1st Steel Weight Estimation
Lightship Weight Estimation
Parametric Function Selection
Speed & Power CalculationEngine Selection
Weight Estimation of the Entire Ship Rough General
Arrangement
Principal Dimension
1st Cost Estimation Traditional Parametric Method
Reference Ship Selection
Determination of Estimated Coefficients
Fig. 1 Parametric estimation
228 J Mar Sci Technol (2016) 21:227–239
123

estimated structural sections. Figure 2 shows the procedure
for this method, and Fig. 3 shows the details of the section
framework. First, this section framework is derived by
dividing the container ship into various sections: forward,
cargo, engine room, aft, forecastle, and deckhouse. To
implement the early stage estimation, the parameters of the
individual sections are referenced from a similar vessel
selected only using the principal dimension. To obtain
more accurate results, more parameters can be used to
develop the corrected procedures after a preliminary esti-
mate. Second, the concept of PSE establishes the
middleware tire to extract section characteristics by linking
the principal dimension and the past detail design infor-
mation for the preliminary estimation based on the ship
arrangement and 3D CAD models.
In Sect. 2, we present the definition of the section
parameters of the framework and then build the esti-
mated database. We refer to the PCA-based ship cost
estimation method [17] and then analyze the principal
parameters of these sections. PCA identifies the variables
that are highly correlated with the hull steel weight by
eigenvalue and eigenvector computations. The identified
physical parameters and the participation factors of the
important principal components then serve as the pre-
dictor variables. The highest correlative predictor
variables for each section are identified by regression
with exponents. In Sect. 3, we describe the proposed
PSE process, as shown in Fig. 2a, and derive the equa-
tion for estimating the steel weight and adjusting the
treatments of each section, as shown in Fig. 2b. The
formula is based on the cubic number format, which
estimates each section of the entire ship using the
principal dimensions and one or two local factors. In
Sect. 4, we demonstrate the method and its practicality
and effectiveness. The section estimation results are
presented and compared with those obtained from
methods that only use overall ship parameters. Finally,
in Sect. 5, we provide conclusions and describe future
work. Using the proposed method, it is possible to obtain
an accurate weight estimation for a new ship.
Fig. 2 Parametric section-based estimation
J Mar Sci Technol (2016) 21:227–239 229
123

2 Section framework and database
Instead of estimating the complete hull, PSE divides
the hull into subgroups that are estimated separately.
By choosing a single type of ship, this study avoids
the estimation error resulting from the differences in
configuration among various ship types. Although
container ships have different sizes, their interior
structures are similar. Referring to the general struc-
tural section of 31 historical container vessels at the
collaborative shipyard, this section framework is pre-
sented in Fig. 3. We analyzed the general
arrangements to establish a general model for this
section estimation.
Aft Cargo Hold including Hatch Coaming
Lower Portion
Superstructure
Cargo Hold
Rudder Engine Space
Upper Portion
Lower Portion
Hatch Coaming
Upper Portion
ForwardCargoEngine RoomAft
Deckhouse Forecastle
ForwardCargo
Engine RoomAft
Deckhouse Forecastle
Hull
(a) (b)
(c)
Funnel
Fig. 3 Section framework
230 J Mar Sci Technol (2016) 21:227–239
123

The hull steel weight is traditionally divided into the
hull and superstructure, as shown in Fig. 3a, each of which
is further divided into smaller sections. The container ship
is divided into 6 structural sections: the forward, cargo,
engine room, aft, forecastle, and deckhouse. L0–L5 are the
major section parameters for reflecting the design changes
resulting from different ship owners’ requirements of dif-
ferent levels of speed and flexibility in the estimation. We
found that a more subtle partition requires the input of
more parameters but does not improve the accuracy of the
estimation and thus is not conducive to application in the
preliminary design. In this study, the weights of two small
parts, the rudder and funnel, are not estimated; the directly
added weight is used instead.
Figure 3 and Table 1 show the scope of the individual
sections assembled using a combination of internal blocks.
Each section is composed of its own main structural parts
to capture the characteristics of the section itself. Next, the
local variables of the section are measured from the block
arrangements and 3D CAD models, as shown in Fig. 3b, c.
The list of blocks for each section may be obtained from
the block arrangement, the 3D model of the ships, and the
shipyard’s naming standard. Next, the exact section data
are obtained by summing the weights from the database of
3D CAD models.
2.1 Ship selection
First, 31 vessels from the initial database were classified
into 10 categories by size. Because the use of reference
ships with the same principal dimensions would signifi-
cantly reduce the accuracy of the regression results, these
ships should be omitted, as should those with special or
obsolete designs. We thus selected the most recent design
types for ships of various sizes to obtain representative
data. Next, 9 vessels with the same dimensions, 8 vessels
designed by other companies, and 3 vessels for which the
complete lofting drawings are lacking were omitted. Fur-
thermore, 2 new vessels for which the complete structural
drawings are still being developed were omitted. Nine
more modern designs for 9 capacity categories, ranging
from 2000 to 8500 TEU, were selected. It was assumed that
these 9 categories must be satisfied by the various general
designs. The minimum capacity category, 1000 TEU, was
omitted because the lofting drawings are incomplete and it
was built in a different shipyard using special subdivisions.
Because this type of ship has less market demand and is of
the minimal length, it may be considered an outlier. The
selection steps are presented in Fig. 4, and the selection
strategies are as follows:
● Only container vessels are used in the project.
● The reference data are sufficiently disperse.
● Old designs are omitted.
● Series ships are omitted.
● The design is conducted by the same shipyard.
● The ship data contain the details in lofting drawings that
can be checked using the data for the itemized
structures.
2.2 Section and parameter definition
Many hull steel weight coefficients exist, and these factors
are classified by the global variables and local section
variables of each vessel. The global variables consist of the
principal dimensions and coefficients of ships, relative ship
features, layouts, and main characteristics; the local section
variables are based on the defined framework of the
Table 1 Section parameters
Section Part Assembly blocks Principal parameters
Entire parameters Section parameters
Forward Upper portion SM5 + SU5 + BM5 L B D d CB L4 L5 Bow type
Lower portion B5 + SL5 + B5
Cargo Cargo Fore cargo block 1–29 L B D d CB L3 Mid-ship length Frame space
Hatch coaming HC Coaming length Coaming number
Engine room Engine room Engine room block 31–34 L B D d CB L1 L2 MCR (PS)
Aft cargo Aft cargo block 31–39 Aft cargo type
Aft Upper portion SL4 L B D d CB L0Lower portion FS + FD + BW + WB
Rudder RD + RH Area Area ratio Balance ratio
Forecastle Forecastle FS + FD + BW + WB B Lf (max length) Hf (max height)
Deckhouse Deck house 1A + ··· + 8A L B D Ld (the sum of all length of layers) Hd (layer height)
Funnel FNA + FNF + FNL Length Width Height
J Mar Sci Technol (2016) 21:227–239 231
123

sections of the container vessels in Fig. 3. The ship
parameters listed above are collected and classified by the
configured section, as shown in Table 1.
2.2.1 Global parameters
Four important parameters are investigated in this research:
L (length between perpendiculars), B (breadth), D (depth),
and CB (block coefficient). Most pieces of the hull (outer
plate, bottom structure, decks, bulkheads, etc.) are related
to the length. In terms of strength, longer pieces suffer
greater longitudinal torques, and the longitudinal structural
piece must be larger in size or constructed from a larger
quantity of material. Therefore, L is one of the most sig-
nificant factors in weight.
B is the second factor. The geometry and quantity of the
transverse pieces (bottom structure, deck, transverse
bulkhead, etc.) are related to the breadth. In terms of
strength, the breadth has a greater impact on the transverse
strength but little effect on the longitudinal strength.
Therefore, the influence of the breadth pieces on the hull
steel weight is secondary to that of the length pieces.
D is the third factor. The vertical height is measured from
the bottom of the keel to the lower surface of the upper deck
within the mid-ship section. The geometry and quantity of
the pieces in this section (ribs, bulkheads, side plating, etc.)
are related to the depth. However, in terms of strength, the
depth of large ships with greater depth has little effect on the
weight; thus, the depth is a less important factor for the hull
steel weight. Because draft d andD have similar features and
D has a larger proportional effect, D is selected as the esti-
mated parameter and d as an optional correction parameter.
The three essential parameters L, B, and D are applied to
the section estimation in the research. We also find that the
best estimation can be obtained by combining the local
length, width, and height of each section for the section
estimation.
Many hull geometry coefficients are used as guides for
the fatness or slimness of the hull. However, accurate
coefficients often cannot be obtained during the prelimi-
nary ship design phase. Because CB is the most frequently
used coefficient related to the weight estimation, it is
regarded as an optional parameter in this study. For
container vessels, CB takes values of 0.6–0.7. This coef-
ficient describes the geometry type below the waterline in
terms of the ratio of the volume of displacement to the
volume of a rectangular block whose sides are equal to
the maximum breadth, the mean draught, and the length
of the design waterline.
2.2.2 Section parameters
The most important factors are the local length, width,
and height of sections. Table 1 and Fig. 3 show the
sensitive parameters of each section based on the PSE
framework. For unquantifiable parameters, such as the
stem type, bow type, accommodation type, engine room
space and aft cargo space, we provide a classification
code for the selection of the sections. In addition, we
collect the section-related design parameters used to
analyze the section, such as the section size, cross-sec-
tional area, weight distribution of the section for various
ship sizes, and section location.
3 Parametric section-based estimation (PSE)
The PSE procedure consists of two steps. First, PSE uses
the several parameters that determine the standard weight
in the conceptual design stage. After determining the
All Ship Types
Determine Excluding Similar or Series Ships
Collect Principal Parameters of Ship(DWT, L, B, D, d, CB)
Ship Type Selection
No
Yes
Create Ship DatabaseFor Weight Estimating
Collect Segment Data
Fig. 4 Ship selection
232 J Mar Sci Technol (2016) 21:227–239
123

principal dimensions, each section’s weight may be cal-
culated by referring to the parameters of the corresponding
section in the fitting standard ship based on the principal
dimensions. Second, the standard weight may be modified
based on the estimated standard weight using optional
parameters, i.e., CB and B/d.If we adjust the section parameters, the initial estimation
is quickly modified based on the design of this new ship.
Finally, the real parameters of the individual sections are
obtained to fix the estimated weight from a fixed rough
arrangement negotiated with the ship owner. Figure 2a
outlines the sequential steps of PSE, which are described
below.
3.1 PCA parameter analysis
PCA is a multivariate analysis method that is widely
used in statistics in various fields [18, 19], i.e., system
engineering [17] and gene analysis [20]. The earliest
descriptions of PCA were given by Pearson in 1901
[21] and Hotelling in 1933 [22]. We apply PCA to
derive the value of the weight factor for each parameter
and subsequently identify the important physical char-
acteristics of the ships, namely, those with the highest
correlation with the weight. PCA is mathematically
defined [19] as an orthogonal linear transformation that
transforms the data into a new coordinate system such
that the greatest variance by any projection of the data
lies on the first coordinate (referred to as the first
principal component), the second greatest variance lies
on the second coordinate, etc. PCA is often used to
reduce the dimensions of data sets, and the data set
with the largest contribution to the variance character-
istics is retained. The data sets are collected by
retaining the low-order principal component and
ignoring the higher-order principal components. PCA
can then calculate the combinations of these variables.
The largest eigenvector aligns with the direction of
greatest variation in the data, which calculates the
individual first principal component (PC) as
PC ið Þ ¼ AmaxXt; i ¼ 1; . . .; n: ð1Þ
where the index i represents data corresponding to a dif-
ferent ship; X ¼ x1; . . . ; xmð Þ consists of m physical
parameters; t is the transposed matrix; and Amax ¼a1; . . . ; amð Þ is the corresponding eigenvector of the lar-
gest eigenvalue of the matrix. Each item of Amax is treated
as a weighting factor for the corresponding physical
parameter. The higher the value of the term in Amax, the
greater is the influence of the parameter. We can then
analyze the influence of each parameter in Amax to select
the principal parameters.
By combining the correlative principal parameters in
terms of area or volume relationships [23], these factors are
analyzed again by PCA. Hence, the significant input cor-
relation parameters are determined such that PC(i) is an
independent variable and the hull steel weight is a depen-
dent variable to establish a regression model in this
research.
3.1.1 Structure factor
The still water bending moment and shear force calcu-
lations, which determine the bending moment and hull
girder shear force values along the vessel’s entire length,
are to be submitted together with the distribution of the
lightship weights. The maximum bending moment can
be defined as:
r ¼ M
Z, ð2Þ
where M is the moment and Z is the modulus of the
effective structural section.
As the ship length decreases, the bending moment also
decreases. Furthermore, the equivalent thickness of the
section decreases with the ship length. Hence, the
parameter L is the most important item. In the rules of the
American Bureau of Shipping (ABS) and other class
societies, the wave bending moment is generally expres-
sed as (Cb + 0.7)L2B, where the still water bending
moment does not exceed the approximate wave bending
moment. The envelopes of the maximum shearing forces
may be obtained from (Cb + 0.7)L 9 B, and the bending
moment and the modulus-related term are the same [24].
The modulus-related term may also be expressed as
Cb0.5L2B. The hull steel weight may then be deduced as a
modulus-related and a volume-related term L 9 B 9 D).The combined expression is then deduced as Cb
0.5[a1(L2B)
L 9 D−1 + a2L 9 B 9 D] [25]. This expression is similar
to Cb1/3[a1L
3.3B 9 D−1 + a2L(B + D)2] in Sato’s research
[26]. However, previous studies assumed that the inclu-
sion of this term would lead to a more accurate weight
estimation, but the selection of the values of the coeffi-
cients a1 and a2 for various ship types is difficult. An
expression using more items may add (1) a modulus-re-
lated term to CbaL3B 9 D−1, (2) the side shell and
longitudinal bulkheads to CbbL2D, (3) transverse frame
beam bulkhead to CbcL 9 B 9 D, (4) platform decks and
flats to CbdL2B, and (5) superstructure and deck fittings to
LB2, where Cb is taken as an index exponent [25]. Other
general design variables include L/B, L/D, and B/d. Theseterms and dead weight tonnage (DWT), TEU, and the still
water bending moment (MS) have been considered in
Eq. 1.
J Mar Sci Technol (2016) 21:227–239 233
123

3.1.2 Midship section and steel grade
Two types of midship sections are used in Fig. 5. The left-
hand type is more popular in containerships. Because the
right-hand type is only applied to one of the smaller con-
tainerships among the ships selected from the database, the
types are not estimated. However, if the types are more
complicated, the type of the analyzed ship should be
classified, or the estimated result should be corrected based
on the type.
Although the moment MS is high, the weight of the
section may be decreased using high-tension steel. High-
tension steel is mainly applied in the four hull sections, and
its use ratio may be modified. The use ratio for the high-
tension steel for the entire ships is between 45 and 55 %,
except for Ship 4, in which almost no high-tension steel is
applied. Although the use ratio of high-tension steel in the
cargo section is generally close to 60 %, the ratio for ship 4
is less than 3 %.
A precise numerical correction is beyond the scope of
this study, but the ratio is an important factor in the esti-
mation. Hence, if the ratio is high, the section will be
overestimated.
3.2 Reference ship selection
At the beginning of a new design phase, the principal
dimension of the new ship is only the known parameter;
most section parameters may not yet be configured. In this
case, we can utilize a more convenient treatment to apply
this method. When the dimension of the sections of the
new ship is not available, the dimension of the sections can
be determined from a similar ship.
After analyzing these parameters for the entire ship by
PCA in Eq. 1, we find that the L, B, D, and DWT are
important for selecting the reference ship most similar to
the design ship. The similarity is obtained using PCA,
which calculates the individual PC by Eq. 1; next, these
nearest neighborhood PCs are chosen by
Similaritymax ¼ Min PCdesign � PC ið Þ� �
: ð3ÞThe parameters of the individual sections can be
approximated as the values from the reference ship.
However, the dimensions of the new ship are usually dif-
ferent from those of the reference ship. The correction
factor is defined using the ratio of the design ship param-
eter to the reference ship parameter, i.e., L/LR, B/BR, and D/DR, which are used to modify each section parameter for
the conceptual ship. For a more precise estimation, the
parameters of the individual sections should be obtained
later from the rough arrangement negotiated with the ship
owner to adjust the estimated weight in the beginning of
the design stage.
3.3 Weight estimation
The traditional parametric estimation only provides a rough
estimate of the total weight using the overall ship param-
eters and does not reflect local design features. To improve
upon this method, the present method estimates each sec-
tion for the entire ship and assumes that one section may be
estimated using the section dimensions and one or two
local factors.
Considering the principal dimensions and the parame-
ters of the sections, we chose the most important
parameters, namely, those with large weights in the PCA.
We find that the hull weight of a ship is primarily a
function of the principal dimensions length L, breadth B,and depth D and one or two local parameters. The com-
bination of the natural logarithms of the variables is defined
as:
PC1 ¼ a1 lnL� lnL� �þ a2 lnB� lnB
� �þ a3 lnD� lnD� �
þ a4 lnP4 � lnP4
� �þ � � � þ am lnPm � lnPm
� �
ð4Þwhere P4–Pm are the section parameters, the over bar sig-
nifies the average value of the parameters, and a1–am are
calculated by Eq. 4 of the PCA. According to PCA, the
principal parameters may then have significant weighting
factors, whereas the weighting factors of the other
parameters are close to zero. P4 is usually the length of the
section, and other section parameters may be optional if the
specific section has four principal parameters. For calcu-
lation convenience, irrelevant parameters can be taken as
“1”, in which case the item has no influence in the PCA.
More section parameters are described in Table 1.
Equation 4 differs from the traditional equation, in
which only the entire ship or local parameters are used.
Equation 4 may then be written as:Fig. 5 Two midship section types
234 J Mar Sci Technol (2016) 21:227–239
123

PC1 ¼ ln PC� lnPC ð5Þand
ln PC ¼ a1 ln Lþ a2 lnBþ a3 lnDþ a4 lnP1 þ a5 lnP2:
ð6ÞEquation 6 is equivalent to
PC ¼ La1Ba2Da3Pa41 Pa5
2 : ð7aÞThe PC for all sections may be calculated from the
principal parameters and is defined as:
PCForward ¼ La1Ba2Da3La44 La55 ð7bÞ
PCCargo ¼ La1Ba2Da3La43 ð7cÞPCEngineRoom ¼ La1Ba2Da3La41 ð7dÞPCAft ¼ La1Ba2Da3La40 ð7eÞPCForecastle ¼ La1f B
a2Ha3f ð7fÞ
PCDeckhouse ¼ La1Ba2Da3La4d Ha4d ð7gÞ
When establishing the regression model, PC is treated as
an independent variable and the hull steel weight as a
dependent variable. The regression model is defined as:
We ¼ aebPC ð8Þwhere We is the estimated weight and α and β are deter-
mined by regression.
3.4 Weight modification
The modification process is defined as:
Ws
We
¼ RegressionðxÞ ð9Þ
where Ws is the real weight of the section and x is the
parameter of the modification. This process is applied when
the value of the parameter is between the maximum and
minimum reference values for ships. For the forward,
cargo, engine room, and aft sections of the hull, because
the shape of the section is not uniform, we make x depen-
dent on CB to modify the weight to account for the effect of
the form factor. The parameter of the modification B/d is
then also applied to modify the effect of the freeboard and
breadth.
The engine room has two possible configurations: one
that includes aft cargo and one that does not. To estimate
the section weight for smaller container vessels, these steps
are similar to those for the cargo section. In larger vessels,
however, the engine room section also contains cargo
space, and a special modification is thus required by the aft
cargo length (L3 − L2).Finally, we sum all estimated weights to obtain the total
weight,
Wtal ¼X
We: ð10Þ
4 Comparative study
4.1 Entire estimation
Tables 2, 3 and Fig. 6 compare four methods with our
database to estimate the steel weight. Method (a) is PSE,
which divides the ship into 6 sections based on the selected
9 ships. Meanwhile, Methods (b)–(d) use the equa-
tions 0.034 9 L1.7 9 B0.7 9 D0.4 9 CB0.5 [9],
k 9 L 9 B 9 D 9 CB0.5 [3], and k 9 L1.6(B + D) [8],
respectively. Because the exponential regression model
equation is significantly proper [3], the maximum errors
and standard deviation are lower than those in the linear
regression in this study. Thus, these methods determine the
coefficient k using the exponential regression analysis of
the same 9 ships. For these models, the R-squared are
greater than 0.99, and the P values are less than 0.01, which
indicates that the models are proper.
Table 3 shows the standard deviation, average, maxi-
mum error, and minimum error for Methods (a)–(d).
Specifically, these values are, respectively (1.67, 1.04,
3.22, −2.45 %) for Method (a), (8.80, 6.73, 10.20,
−13.67 %) for Method (b), (3.38, 2.67, 6.80, −4.93 %) for
Method (c), and (4.26, 3.70, 7.25, −6.18 %) for Method
(d). The overall error of Method (a) is considerably lower
than those of the other methods. This method has also a
smaller standard deviation and error range (±5.67 %) and
provides a significantly lower and more stable result.
Hence, the estimated model is better for these modern
target ships.
4.1.1 Influence of the steel grade
The major error in Ship 4 occurs because the ratio of the
high-tension steel is close to zero, compared to values
between 45 and 55 % for the other ships. The estimated
results also explain the change in the consistency of the
factor. Thus, it would be beneficial to further analyze the
features of the steel grade with more ships of this type.
4.2 Section estimation
Using the established estimation model, Tables 4 and 5
show the 6 section estimations based on Method (a). Fig-
ure 7 shows that the two main sections, the cargo and the
engine room, account for almost 70 % of the total weight
and have accurate estimate results. Figure 8 presents the
other sections. Once again, the major error incurred in Ship
J Mar Sci Technol (2016) 21:227–239 235
123

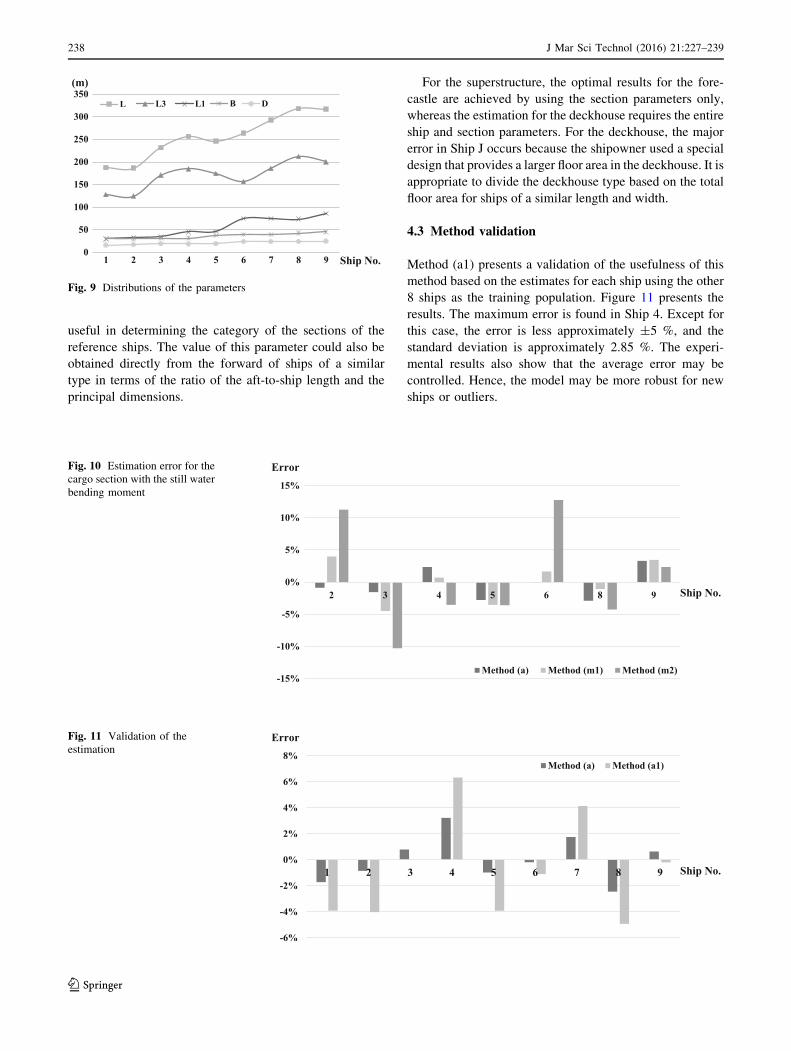
4 is due to the influence of the steel grade. Figure 9 pre-
sents the distributions of the parameters. Because the
distribution change for the different parameters is not
consistent with the length of the aft cargo, it is necessary to
consider the section parameters. In particular, the ratio of
the section length of the cargo-to-engine room is signifi-
cantly different for Ships I and J despite their similar ship
lengths. For the engine room, it is more appropriate to
divide this section into three types for the optimal
-15%
-10%
-5%
0%
5%
10%
15%
1 2 3 4 5 6 7 8 9
Method (a) Method (b) Method (c) Method (d)
Error
Ship No.
Fig. 6 Comparison of the
estimation results
Table 4 Estimation error for
the sectionsShip no. 1 2 3 4 5 6 7 8 9
Forward (%) −13.50 2.56 −2.94 15.33 15.40 −10.92 5.15 −8.46 6.59
Cargo (%) 1.05 −0.88 −1.56 2.35 −2.79 −0.05 1.88 −2.90 3.30
Engine room (%) −2.49 0.82 1.78 1.15 −1.14 0.02 0.26 −0.22 −0.04
Aft (%) −8.53 −1.77 15.01 4.62 −4.73 −0.35 4.00 −4.16 −0.53
Forecastle (%) −16.98 7.97 18.84 20.11 35.93 −8.95 −8.02 −15.00 −19.23
Deckhouse (%) 2.39 −9.93 13.30 12.05 3.15 8.87 9.44 1.74 −26.91
The error differences are calculated from (the estimated weight We/the real section weight Ws 9 100 %)
Table 2 Comparison of the estimation results
Ship no. 1 2 3 4 5 6 7 8 9
TEU 2200 2226 3237 4200 4680 6000 6600 8626 8500
LBP (m) 187.6 187.1 232.4 256.5 246.4 263.8 293.2 318.2 317
Breadth (m) 30.2 30.2 32.2 32.2 37.3 40 40 42.8 45.8
Depth (m) 16.6 17.5 19.5 19.1 19.4 24.2 24.2 24.5 25
Error in Method (a) (%) −1.72 −0.85 0.79 3.22 −0.98 −0.19 1.76 −2.45 0.64
Error in Method (b) (%) −13.67 −11.72 0.09 8.93 0.35 2.78 10.20 6.58 6.25
Error in Method (c) (%) −1.10 −1.49 1.06 0.20 −1.36 6.80 4.21 −4.93 −2.89
Error in Method (d) (%) −2.94 −2.56 1.53 3.58 0.07 7.25 4.63 −6.18 −4.57
The error differences are calculated as (the estimated weight Wtal/the real weight 9 100 %), where Wtal is obtained by the equations for each
method: (a) PSE, (b) 0.034 9 L1.7 9 B0.7 9 D0.4 9 CB0.5, (c) k 9 L 9 B 9 D 9 CB
0.5, and (d) k 9 L1.6(B + D)
Table 3 Summary of the estimation results
Method SD (%) Avg (%) Max (%) Min (%) Range (%)
(a) 1.67 1.04 3.22 −2.45 5.67
(b) 8.80 6.73 10.20 −13.67 23.87
(c) 3.38 2.67 6.80 −4.93 11.73
(d) 4.26 3.70 7.25 −6.18 13.43
SD standard deviation, Avg average value based on the absolute value
of the error percentage, Range max–min
236 J Mar Sci Technol (2016) 21:227–239
123

estimation: the no aft cargo space, cargo space above the
deck, and full aft cargo space. For the cargo, the still water
bending moment (WS) is strongly correlated with the
weight. The parameters are also taken in combination with
the term from Eq. 7b, as shown in Fig. 10. The estimated
result of Method (m1) using the original parameters and
WS is similar to that of the original Method (a). However,
the standard deviation is 0.5 % higher. Method (m2), using
only WS, does not provide a good fit, having a greater
number of outliers. The estimated error using WS would be
higher for smaller ships because the standards require WS
to have different conditions along the ship length. The
values for these parameters could be chosen more suitably
by selecting several similar ships within the limited length
of the ships. In this study, DWT is influenced little by the
section weight, but it is the most consistent change
parameter for the weight of the entire ship.
For the forward and aft, the error can be improved to
less than 10 % by the modification of the individual
maximum cross-sectional area. However, the sectional area
for the forward and aft of new ships is usually not available
in the design phase. Thus, this parameter could be more
-4%
-3%
-2%
-1%
0%
1%
2%
3%
4%
1 2 3 4 5 6 7 8 9
Cargo Engine Room
Error
Ship No.
Fig. 7 Estimation error for the
cargo and engine room sections
-40%
-30%
-20%
-10%
0%
10%
20%
30%
40%
1 2 3 4 5 6 7 8 9
Forward Aft Forecastle Deckhouse
Error
Ship No.
Fig. 8 Estimation error for the
other sections
Table 5 Summary of the
estimation error for the sectionsMethod SD (%) Avg (%) Max (%) Min (%) Range (%)
Forward 10.12 8.98 15.33 −13.50 28.83
Cargo 2.12 1.86 3.30 −2.90 6.20
Engine room 1.19 0.88 1.78 −2.49 4.27
Aft 6.47 4.86 15.01 −8.53 23.54
Forecastle 18.61 16.78 35.93 −19.23 55.16
Deckhouse 12.06 9.75 13.30 −26.91 40.21
SD standard deviation, Avg average value based on the absolute value of the error percentage, Range max–
min
J Mar Sci Technol (2016) 21:227–239 237
123
useful in determining the category of the sections of the
reference ships. The value of this parameter could also be
obtained directly from the forward of ships of a similar
type in terms of the ratio of the aft-to-ship length and the
principal dimensions.
For the superstructure, the optimal results for the fore-
castle are achieved by using the section parameters only,
whereas the estimation for the deckhouse requires the entire
ship and section parameters. For the deckhouse, the major
error in Ship J occurs because the shipowner used a special
design that provides a larger floor area in the deckhouse. It is
appropriate to divide the deckhouse type based on the total
floor area for ships of a similar length and width.
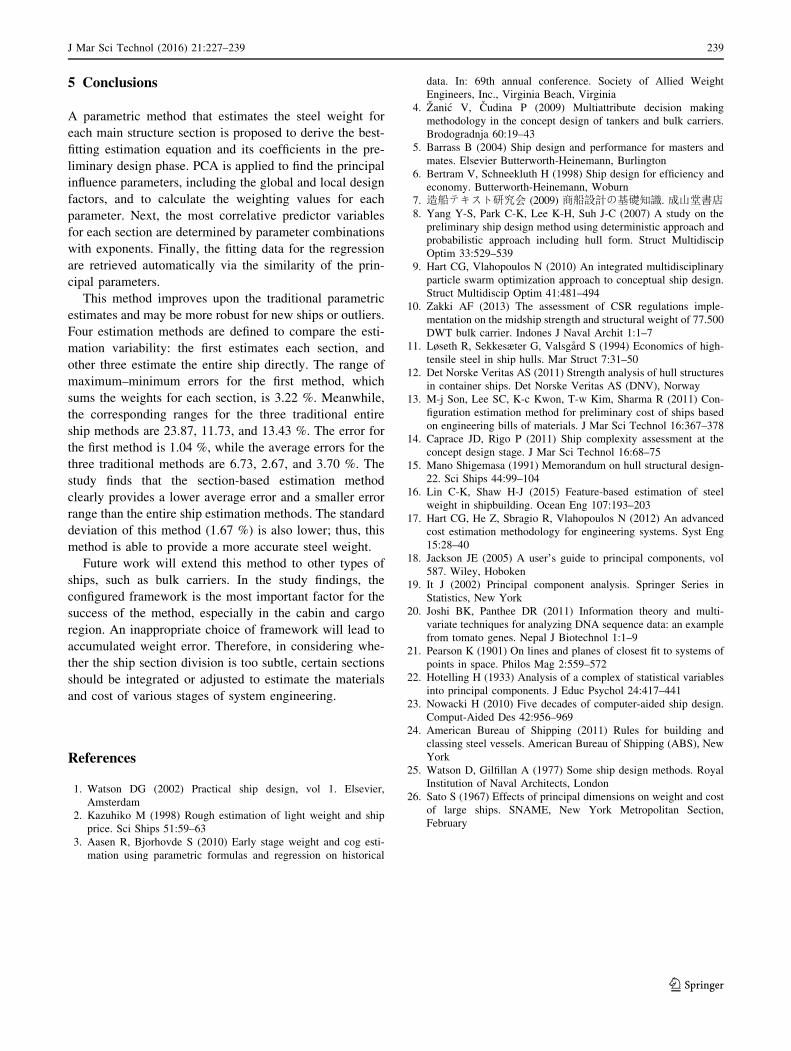
4.3 Method validation
Method (a1) presents a validation of the usefulness of this
method based on the estimates for each ship using the other
8 ships as the training population. Figure 11 presents the
results. The maximum error is found in Ship 4. Except for
this case, the error is less approximately ±5 %, and the
standard deviation is approximately 2.85 %. The experi-
mental results also show that the average error may be
controlled. Hence, the model may be more robust for new
ships or outliers.
0
50
100
150
200
250
300
350
1 2 3 4 5 6 7 8 9
L L3 L1 B D
Ship No.
(m)
Fig. 9 Distributions of the parameters
-15%
-10%
-5%
0%
5%
10%
15%
2 3 4 5 6 8 9
Method (a) Method (m1) Method (m2)
Error
Ship No.
Fig. 10 Estimation error for the
cargo section with the still water
bending moment
-6%
-4%
-2%
0%
2%
4%
6%
8%
1 2 3 4 5 6 7 8 9
Method (a) Method (a1)
Error
Ship No.
Fig. 11 Validation of the
estimation
238 J Mar Sci Technol (2016) 21:227–239
123
5 Conclusions
A parametric method that estimates the steel weight for
each main structure section is proposed to derive the best-
fitting estimation equation and its coefficients in the pre-
liminary design phase. PCA is applied to find the principal
influence parameters, including the global and local design
factors, and to calculate the weighting values for each
parameter. Next, the most correlative predictor variables
for each section are determined by parameter combinations
with exponents. Finally, the fitting data for the regression
are retrieved automatically via the similarity of the prin-
cipal parameters.
This method improves upon the traditional parametric
estimates and may be more robust for new ships or outliers.
Four estimation methods are defined to compare the esti-
mation variability: the first estimates each section, and
other three estimate the entire ship directly. The range of
maximum–minimum errors for the first method, which
sums the weights for each section, is 3.22 %. Meanwhile,
the corresponding ranges for the three traditional entire
ship methods are 23.87, 11.73, and 13.43 %. The error for
the first method is 1.04 %, while the average errors for the
three traditional methods are 6.73, 2.67, and 3.70 %. The
study finds that the section-based estimation method
clearly provides a lower average error and a smaller error
range than the entire ship estimation methods. The standard
deviation of this method (1.67 %) is also lower; thus, this
method is able to provide a more accurate steel weight.
Future work will extend this method to other types of
ships, such as bulk carriers. In the study findings, the
configured framework is the most important factor for the
success of the method, especially in the cabin and cargo
region. An inappropriate choice of framework will lead to
accumulated weight error. Therefore, in considering whe-
ther the ship section division is too subtle, certain sections
should be integrated or adjusted to estimate the materials
and cost of various stages of system engineering.
References
1. Watson DG (2002) Practical ship design, vol 1. Elsevier,
Amsterdam
2. Kazuhiko M (1998) Rough estimation of light weight and ship
price. Sci Ships 51:59–63
3. Aasen R, Bjorhovde S (2010) Early stage weight and cog esti-
mation using parametric formulas and regression on historical
data. In: 69th annual conference. Society of Allied Weight
Engineers, Inc., Virginia Beach, Virginia
4. Zanic V, Cudina P (2009) Multiattribute decision making
methodology in the concept design of tankers and bulk carriers.
Brodogradnja 60:19–43
5. Barrass B (2004) Ship design and performance for masters and
mates. Elsevier Butterworth-Heinemann, Burlington
6. Bertram V, Schneekluth H (1998) Ship design for efficiency and
economy. Butterworth-Heinemann, Woburn
7. 造船テキスト研究会 (2009) 商船設計の基礎知識. 成山堂書店
8. Yang Y-S, Park C-K, Lee K-H, Suh J-C (2007) A study on the
preliminary ship design method using deterministic approach and
probabilistic approach including hull form. Struct Multidiscip
Optim 33:529–539
9. Hart CG, Vlahopoulos N (2010) An integrated multidisciplinary
particle swarm optimization approach to conceptual ship design.
Struct Multidiscip Optim 41:481–494
10. Zakki AF (2013) The assessment of CSR regulations imple-
mentation on the midship strength and structural weight of 77.500
DWT bulk carrier. Indones J Naval Archit 1:1–7
11. Løseth R, Sekkesæter G, Valsgard S (1994) Economics of high-
tensile steel in ship hulls. Mar Struct 7:31–50
12. Det Norske Veritas AS (2011) Strength analysis of hull structures
in container ships. Det Norske Veritas AS (DNV), Norway
13. M-j Son, Lee SC, K-c Kwon, T-w Kim, Sharma R (2011) Con-
figuration estimation method for preliminary cost of ships based
on engineering bills of materials. J Mar Sci Technol 16:367–378
14. Caprace JD, Rigo P (2011) Ship complexity assessment at the
concept design stage. J Mar Sci Technol 16:68–75
15. Mano Shigemasa (1991) Memorandum on hull structural design-
22. Sci Ships 44:99–104
16. Lin C-K, Shaw H-J (2015) Feature-based estimation of steel
weight in shipbuilding. Ocean Eng 107:193–203
17. Hart CG, He Z, Sbragio R, Vlahopoulos N (2012) An advanced
cost estimation methodology for engineering systems. Syst Eng
15:28–40
18. Jackson JE (2005) A user’s guide to principal components, vol
587. Wiley, Hoboken
19. It J (2002) Principal component analysis. Springer Series in
Statistics, New York
20. Joshi BK, Panthee DR (2011) Information theory and multi-
variate techniques for analyzing DNA sequence data: an example
from tomato genes. Nepal J Biotechnol 1:1–9
21. Pearson K (1901) On lines and planes of closest fit to systems of
points in space. Philos Mag 2:559–572
22. Hotelling H (1933) Analysis of a complex of statistical variables
into principal components. J Educ Psychol 24:417–441
23. Nowacki H (2010) Five decades of computer-aided ship design.
Comput-Aided Des 42:956–969
24. American Bureau of Shipping (2011) Rules for building and
classing steel vessels. American Bureau of Shipping (ABS), New
York
25. Watson D, Gilfillan A (1977) Some ship design methods. Royal
Institution of Naval Architects, London
26. Sato S (1967) Effects of principal dimensions on weight and cost
of large ships. SNAME, New York Metropolitan Section,
February
J Mar Sci Technol (2016) 21:227–239 239
123

Reproduced with permission of the copyright owner. Further reproduction prohibited withoutpermission.
Top Related