


Languages
Pages
Legal


Pipeline & Specialty Services (P&SS)
Mark Slaughter
Global Product Line Manager
A Pipeline Inspection Case Study: Design Improvements on a
New Generation UT In-line Inspection Crack Tool
© 2008 Weatherford. All rights reserved.1
This paper is a joint collaboration between
AWP, represented by Mr. Michael Huss, and
Weatherford P&SS.
Pipeline & Specialty Services (P&SS)
A Pipeline Inspection Case Study: Design Improvements on a
New Generation UT In-line Inspection Crack Tool

© 2008 Weatherford. All rights reserved.
P&SS Services
Pipeline
Process
Flooding
Cleaning
Pigging
Inline Inspection
Testing
Integrity
Pre-Commissioning & Maintenance
Testing
Flushing & Jetting
Leak Detection
Oil Flushing
Chemical Cleaning
Drying
Purging
Camera Inspection
Flange Management
Controlled Bolting
Shutdown
Membrane N2
Leak Detection
Dewatering
Drying
Purging & Packing
Umbilical Monitoring & Testing
Membrane N2
© 2008 Weatherford. All rights reserved.4
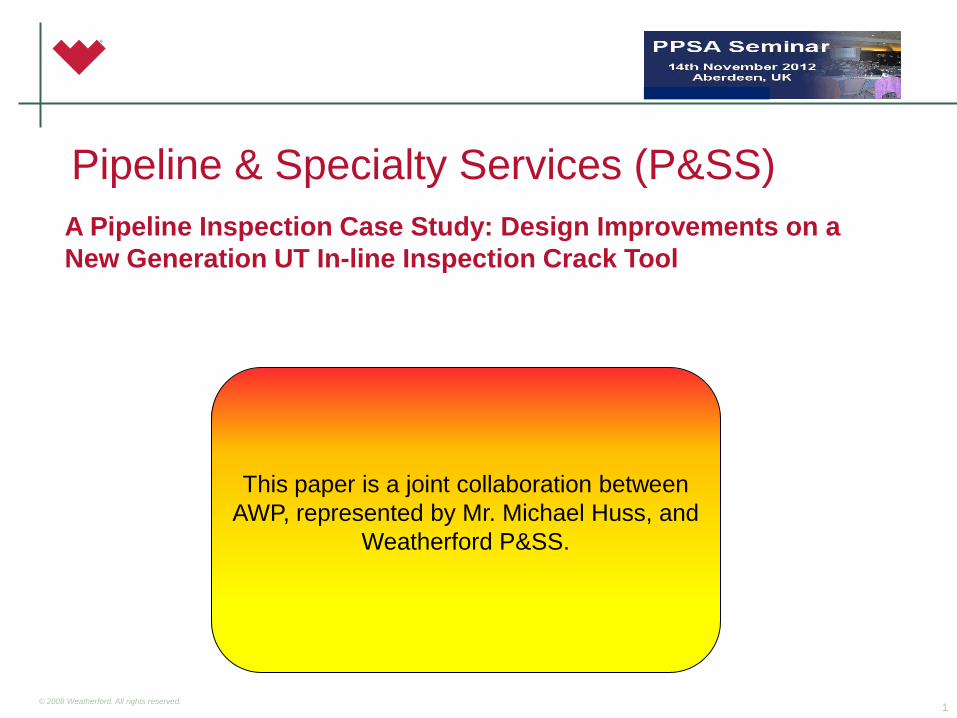
Latest Generation ILI Technologies
• Cleaning
• Gauging
• Geometry
• Mapping
• MFL
• Crack Detection
• Combos Tools
• Integrity
Assessment
P&SS Services - ILI

© 2008 Weatherford. All rights reserved.5
Ultrasonic Crack Detection background
For 20 years, ultrasonic (UT) in-line inspection (ILI) tools have played a
crucial role in helping operators manage pipeline integrity threats. The
predominant ILI applications utilizing UT technology have been for wall
loss and crack inspection.
Technological improvements are still required to help operators
manage the integrity of an ageing pipeline infrastructure:
• Probability of Detection (POD) / Probability of Identification
(POI)
• Detection reliability under different pipeline conditions
• Increased ranges for pipeline operating parameters
• Leveraging synergies from a Combo Wall Measurement-Crack
Detection (WM-CD) tool in a single run.
© 2008 Weatherford. All rights reserved.6
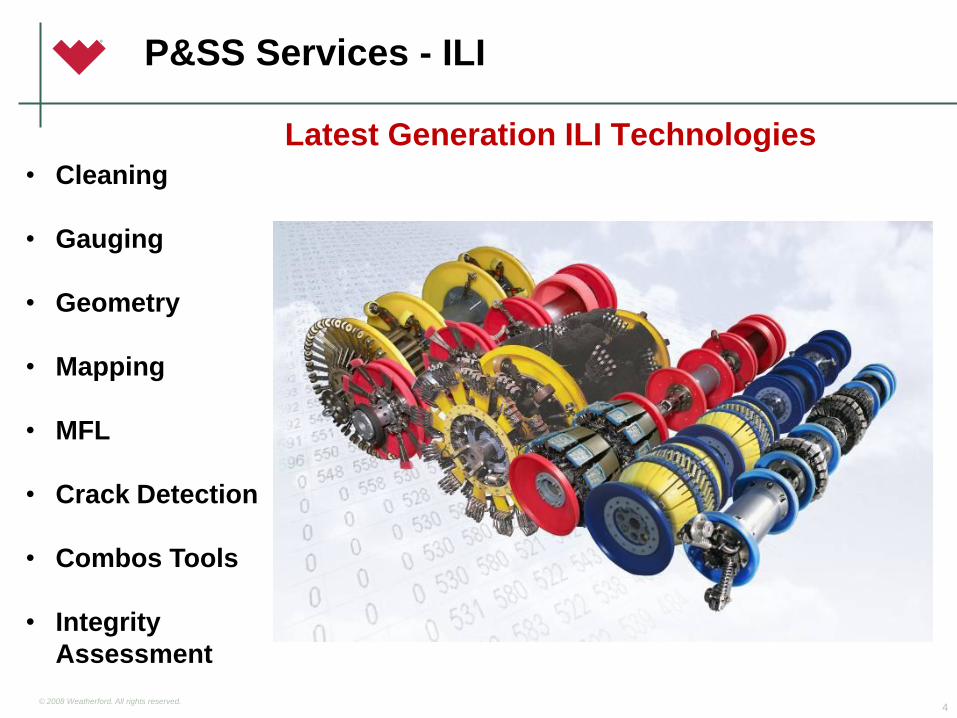
Ultrasonic Inspection (CD) [Shear Wave]
Listing of the types of defects best characterized by a
Shear Wave UTCD tool:
• Stress-Corrosion-Cracking (SCC)
• Axial cracking
• Crack-Like defects
• Fatigue cracking
• Hydrogen-Induced-Cracking (HIC)
• Circumferential cracking

© 2008 Weatherford. All rights reserved.
Crack-field associated with a dent Pipeline located in the northeast USA
Crack-field
Dent

© 2008 Weatherford. All rights reserved.
Stress Corrosion Cracking (SCC)
• Zoomed photo of the crack field
ILI:
crack-field
Depth: 40-
80 mils
Field:
crack-field
Max Depth:
80 mils

© 2008 Weatherford. All rights reserved.9
Ultrasonic Inspection (CD) [Shear Wave]
Principle of Operation
Ultrasonic Sensor
Oil, Water
Steel
Incident Wave, L ?
Reflected Wave, LInternal Crack
External Crack
45°Defracted Wave, S
Am
pli
tud
e (
dB
)
Surface
External Crack
Internal Crack
Ultrasonic Sensor
Oil,
Steel
Incident Wave, L
Internal Crack
External Crack
45°Refracted Wave
Am
pli
tud
e (
dB
)
Surface
External Crack
Internal Crack
An ultrasonic shear wave is propagated in the pipe-wall, by setting
the crack sensors at a predetermined angle in the sensor carrier.
In addition a set of compression wave sensors is used to obtain pipe-
wall thickness and girthweld information.

© 2008 Weatherford. All rights reserved.10
New Generation Ultrasonic (UT) Tools
In 2009/2010, Weatherford P&SS commissioned its new generation fleet
of ultrasonic wall measurement and crack detection tools. A major design
objectives was to address some of the ILI tool limitations identified in a
previous slide.
This presentation focuses on reviewing the latest design improvements
for the new generation tools and presents a case study on a recent
survey conducted on the Adria-Wien Pipeline (AWP).
© 2008 Weatherford. All rights reserved.11
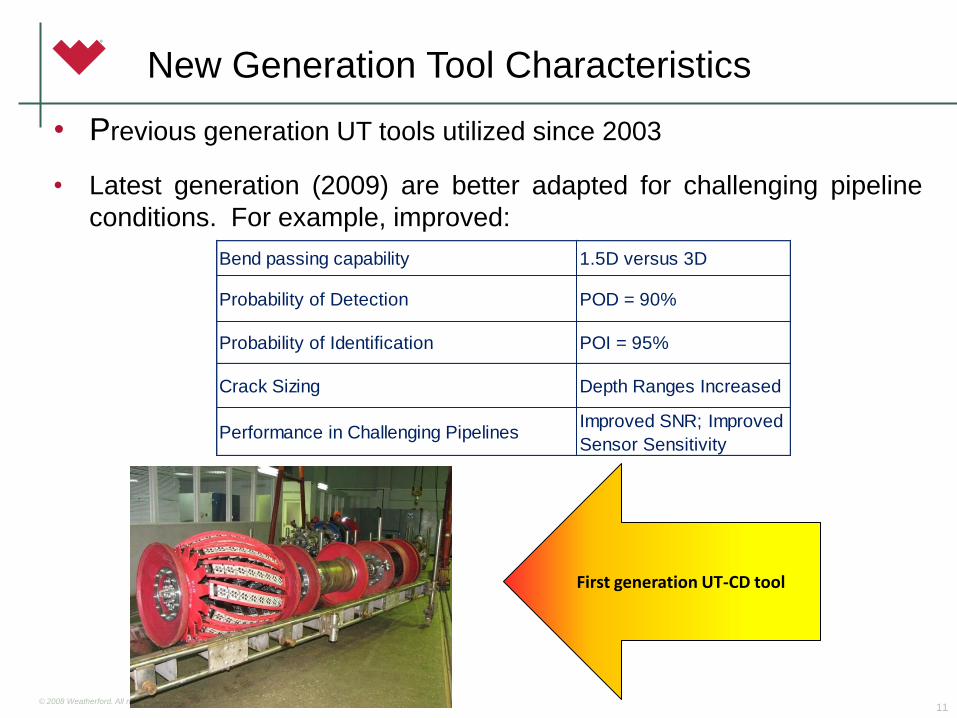
New Generation Tool Characteristics
• Previous generation UT tools utilized since 2003
• Latest generation (2009) are better adapted for challenging pipeline
conditions. For example, improved:
Bend passing capability 1.5D versus 3D
Probability of Detection POD = 90%
Probability of Identification POI = 95%
Crack Sizing Depth Ranges Increased
Performance in Challenging PipelinesImproved SNR; Improved
Sensor Sensitivity
First generation UT-CD tool
© 2008 Weatherford. All rights reserved.12
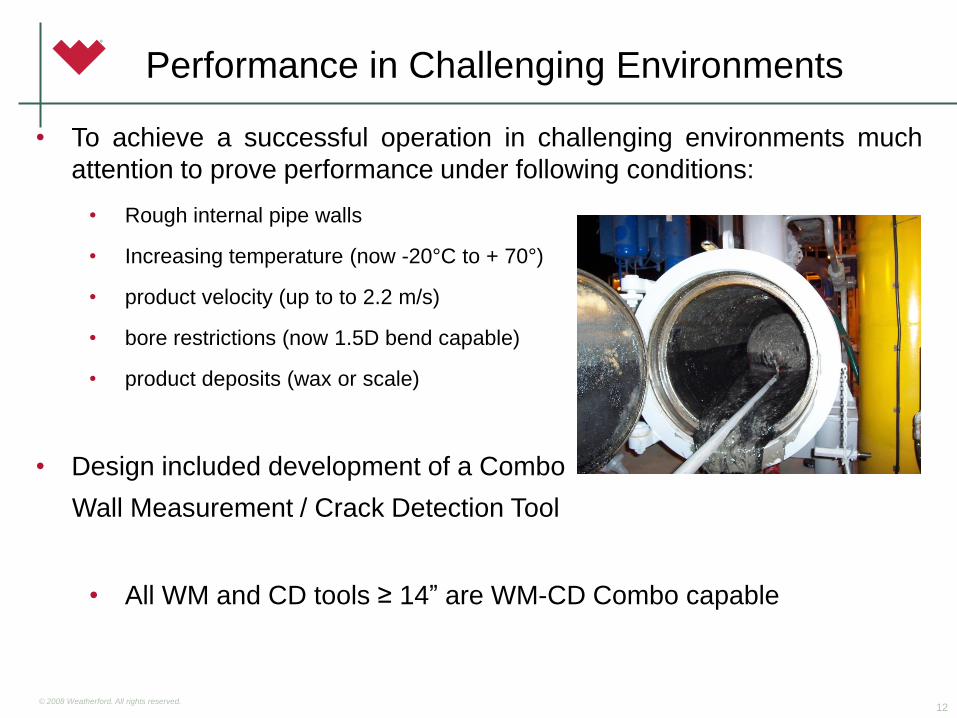
Performance in Challenging Environments
• To achieve a successful operation in challenging environments much
attention to prove performance under following conditions:
• Rough internal pipe walls
• Increasing temperature (now -20°C to + 70°)
• product velocity (up to to 2.2 m/s)
• bore restrictions (now 1.5D bend capable)
• product deposits (wax or scale)
• Design included development of a Combo
Wall Measurement / Crack Detection Tool
• All WM and CD tools ≥ 14” are WM-CD Combo capable

© 2008 Weatherford. All rights reserved.
Many CD – WM Combo ultrasonic immersion-type transducers were investigated
to ensure improved detection and sizing characteristics for the UT tools.
• High sensitivity – signal is 15-20 dB greater sensitivity
• Improved signal to noise ratio
• Improved detection in waxy environments
• Improved transducer focusing
• Less sensitivity to medium acoustical properties
• Reduction in signal losses from transducer to medium transition
• Improved operational parameters:
• Operating pressure up to 200 Bar
• Temperature range of -20 С to 120 С
13
Improved Ultrasonic Transducers
Latest Generation
Ultrasonic transducers

© 2008 Weatherford. All rights reserved.14
Data Processing Software and Sensors
0
256
512
768
1024
1280
1
37
73
109
145
181
217
253
289
325
361
397
433
469
505
541
577
613
649
685
721
757
793
829
865
901
937
973
Am
pli
tud
e
Time, sec
Waxy Surface Rectified Echoes
WM echoes with 1 mm hard wax deposit (zoomed),
feature measurement capability is maintained
Leveraging technology to minimize impact of
degraded data
0
1024
2048
3072
4096
5120
6144
7168
8192
9216
16.0
2
18.8
4
21.6
6
24.4
8
27.3
30.1
2
32.9
4
35.7
6
38.5
8
41.4
44.2
2
47.0
4
49.8
6
52.6
8
55.5
58.3
2
61.1
4
63.9
6
Am
pli
tud
e
Time, sec
Waxy & Clean Surface Comparison
WM sensor echoes comparison:
1mm hard wax
deposit (blue) and clean
internal surface (magenta)
© 2008 Weatherford. All rights reserved.15
New Data Acquisition System
Specifications of the New Generation UT ILI tools are also based on the data
acquisition system features:
• Echo-signals processing chain
• Higher capacity for up-to-date signal processing algorithms
• Optimum recording levels of inspection data.
• New data acquisition system scalability:
• Covers diameter ranges required
.

© 2008 Weatherford. All rights reserved.16
Data Acquisition System continued…
-32
0
32
15.9
6
16.5
2
17.0
8
17.6
4
18.2
18.7
6
19.3
2
19.8
8
20.4
4
21
21.5
6
22.1
2
22.6
8
23.2
4
23.8
24.3
6
24.9
2
25.4
8
26.0
4
26.6
27.1
6
27.7
2
28.2
8
28.8
4
29.4
29.9
6
30.5
2
31.0
8
31.6
4
Am
pli
tud
e
Time, sec
Weak Echoes
-32
0
32
15.9
6
16.5
2
17.0
8
17.6
4
18.2
18.7
6
19.3
2
19.8
8
20.4
4
21
21.5
6
22.1
2
22.6
8
23.2
4
23.8
24.3
6
24.9
2
25.4
8
26.0
4
26.6
27.1
6
27.7
2
28.2
8
28.8
4
29.4
29.9
6
30.5
2
31.0
8
31.6
4
Am
pli
tud
e
Time, sec
Weak Echoes Filtered
0
32
64
15.9
6
16.5
2
17.0
8
17.6
4
18.2
18.7
6
19.3
2
19.8
8
20.4
4
21
21.5
6
22.1
2
22.6
8
23.2
4
23.8
24.3
6
24.9
2
25.4
8
26.0
4
26.6
27.1
6
27.7
2
28.2
8
28.8
4
29.4
29.9
6
30.5
2
31.0
8
31.6
4
Am
pli
tud
e
Time, sec
Weak Echoes Filtered
Pre-processed Signal
Digital Filtering
Rectification
Noisy weak echo signals processed with
onboard digital filtering, followed by
rectification process for improved detection
and signal recording accuracy
• To minimize echo-loss:
• Pulses are processed using a high
selectivity matched digital filter
• Filter criteria is chosen during UT
system testing and calibration prior to
the inspection run
• Digital rectifier sharpens max signals
peaks
• A wide dynamic range of the receive path
prevents signal saturation
• Ensures maximum possible SNR
© 2008 Weatherford. All rights reserved.17
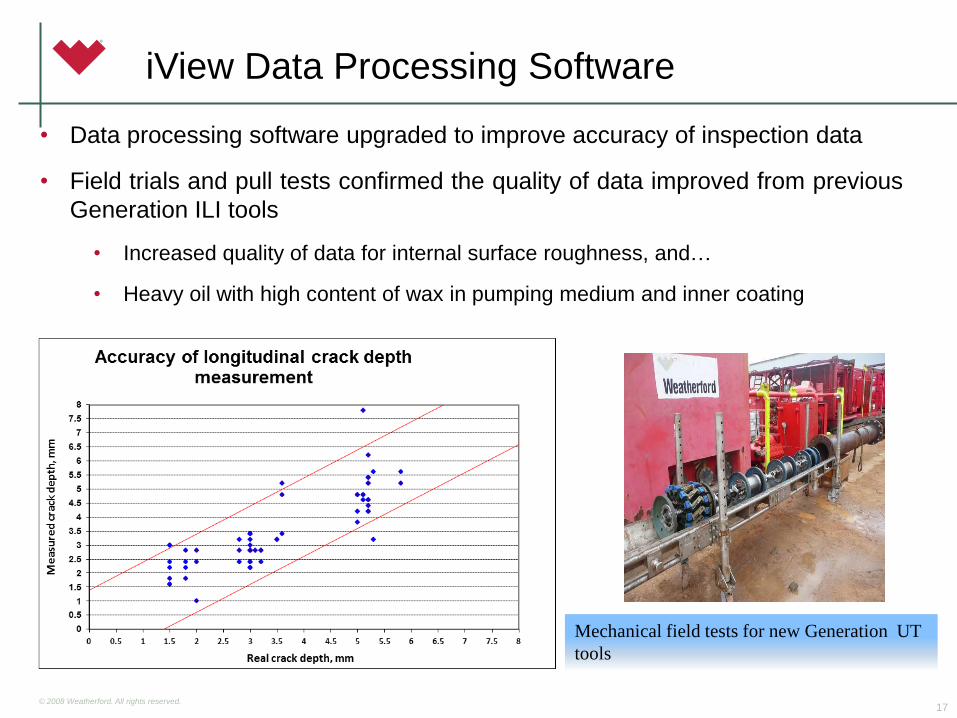
iView Data Processing Software
• Data processing software upgraded to improve accuracy of inspection data
• Field trials and pull tests confirmed the quality of data improved from previous
Generation ILI tools
• Increased quality of data for internal surface roughness, and…
• Heavy oil with high content of wax in pumping medium and inner coating
±1.4 m
Mechanical field tests for new Generation UT
tools
© 2008 Weatherford. All rights reserved.18
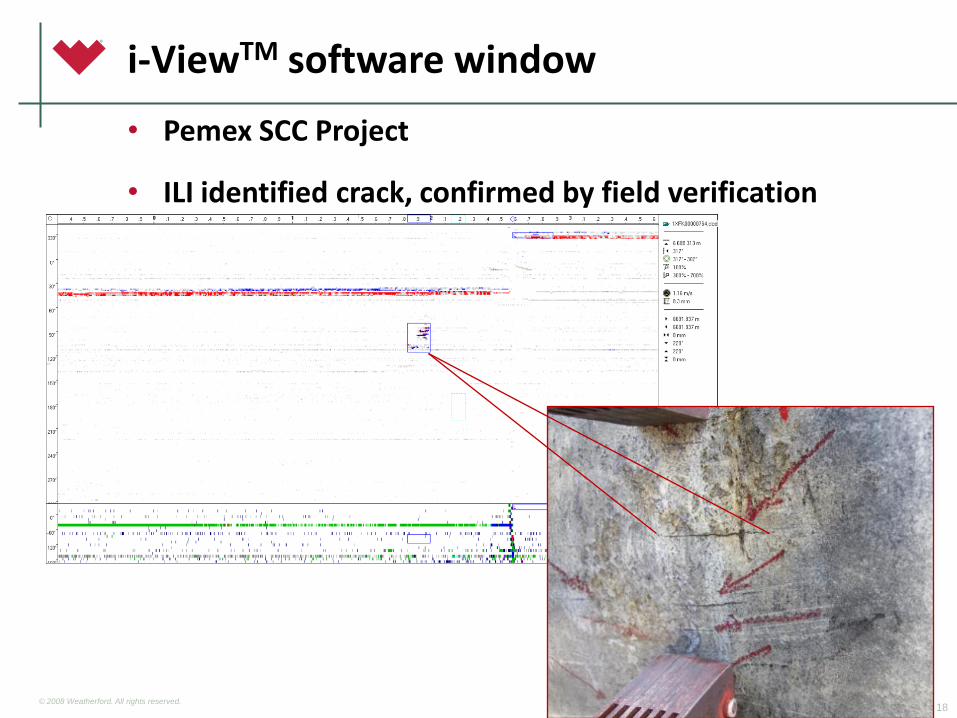
i-ViewTM software window
• Pemex SCC Project
• ILI identified crack, confirmed by field verification

© 2008 Weatherford. All rights reserved.19
Case Study
Adria–Wien Pipeline (AWP) Pipeline
The Adria–Wien Pipeline GmbH
• Main pipeline is 3 sections of 460mm (18”) x 416 kms
• 762 mm (30”) x 4 kms connecting to the Transalpine Pipeline (TAL) system
• From Würmlach to Schwechat Refinery, Austria
• Provides oil supplies to Austria from oil terminal in Trieste
• Improve classification of features and Fitness for Purpose
Construction Date
1970
Material API 5L X52
Wall Thickness 6.35mm - 9.52 mm
Coating External Bitumen with fiberglass inlay
Previous Inspections
1991, 2000, 2006 and 2010
ILI Technologies Geometry, MFL, UT Crack
Weatherford 2010Crack Inspection
Crack Assessment
Pipeline Details Inspection History

© 2008 Weatherford. All rights reserved.20
Crack Inspection Field Ops Summary
• Weatherford mobilized its crew from an ILI base in Germany to provide the
turnkey service, services included:
• Pre-inspection cleaning by magnetic and brush scrapers
• Gauging Pig run
• UTCD inspection runs
• Field data quality evaluation determined UTCD tool runs were successful.
• From preliminary report, AWP selected 4 verification locations
• The 4 features excavated comprised of 2 cracks, 1 crack-like anomaly and 1
longitudinal weld anomaly.

© 2008 Weatherford. All rights reserved.21
ILI Verification
• Weatherford provided a verifications specialist to aid AWP personnel in
locating, classifying and sizing:
• All 4 verified locations confirmed the measurements predicted by the ILI tool
were within stated tolerances.
• The probability of detection (crack POD @ 90%) within tolerances
• Probability of classification within tolerances (POI @ 95% confidence)
• Sizing within tolerances
• API 579 crack assessment was also performed:
• Continue to operate with understanding of Remaining Strength Factors for a
certain Operating Pressure.
• Detailed sizing allows operator to monitor defect growth following future
inspections.

© 2008 Weatherford. All rights reserved.22
Summary of Data Analysis
Below are the results of the ultrasonic crack inspection of the 30'' and 18”'
TAZ1 – USO1 pipeline with a total length of 420 km.
Cracks NotchesLW
AnomalyTotal
30” TAZ1 - PS01, 4 km 0 0 0 0
18” PS01 – PS06, 169 km 25 297 12 334
18” PS06 – PS09, 121.5 km 34 228 4 266
18” PS09 – US02, 123 km 20 258 2 280
Grand Total of Anomalies 880
Total Anomalies – All 4 Sections
© 2008 Weatherford. All rights reserved.24
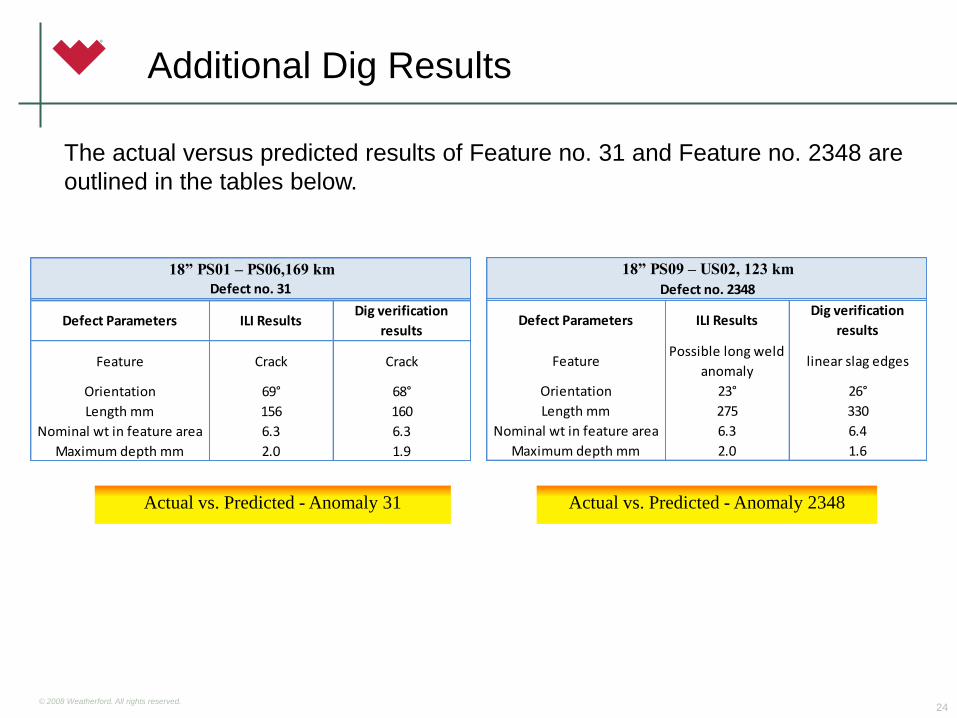
Additional Dig Results
The actual versus predicted results of Feature no. 31 and Feature no. 2348 are
outlined in the tables below.
Actual vs. Predicted - Anomaly 2348 Actual vs. Predicted - Anomaly 31
18” PS01 – PS06,169 km 18” PS06 – PS09, 121.5 km
Defect no. 31 Defect no. 2148
Defect Parameters ILI ResultsDig verification
results
Feature Crack Crack
Orientation 69° 68°
Length mm 156 160
Nominal wt in feature area 6.3 6.3
Maximum depth mm 2.0 1.9
18” PS09 – US02, 123 km 18” PS01 – PS06,169 km
Defect no. 2348 Defect no. 31
Defect Parameters ILI ResultsDig verification
results
FeaturePossible long weld
anomalylinear slag edges
Orientation 23° 26°
Length mm 275 330
Nominal wt in feature area 6.3 6.4
Maximum depth mm 2.0 1.6
© 2008 Weatherford. All rights reserved.25
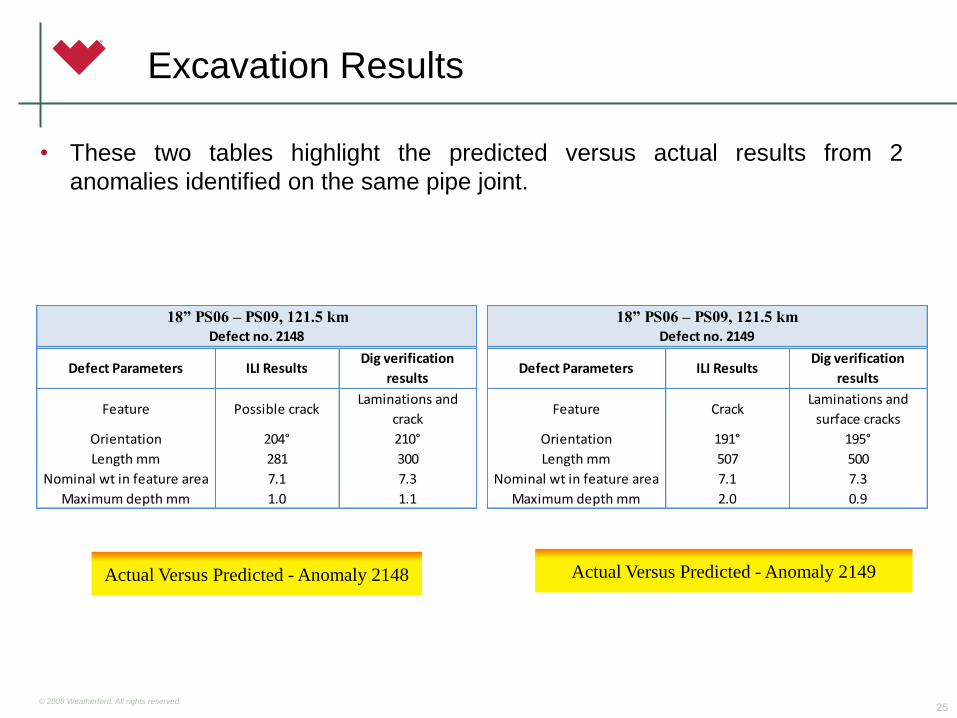
Excavation Results
• These two tables highlight the predicted versus actual results from 2
anomalies identified on the same pipe joint.
Actual Versus Predicted - Anomaly 2149 Actual Versus Predicted - Anomaly 2148
18” PS06 – PS09, 121.5 km
Defect no. 2149
Defect Parameters ILI ResultsDig verification
results
Feature CrackLaminations and
surface cracks
Orientation 191° 195°
Length mm 507 500
Nominal wt in feature area 7.1 7.3
Maximum depth mm 2.0 0.9
18” PS06 – PS09, 121.5 km 18” PS06 – PS09,
Defect no. 2148 Defect no. 2149
Defect Parameters ILI ResultsDig verification
results
Feature Possible crackLaminations and
crack
Orientation 204° 210°
Length mm 281 300
Nominal wt in feature area 7.1 7.3
Maximum depth mm 1.0 1.1

© 2008 Weatherford. All rights reserved.26
Excavation Results cont…
I–ViewTM Screenshot of Anomalies 2148 and 2149
Defect 2148
Defect 2149
Photo of pipe joint - Anomalies 2148 and 2149
© 2008 Weatherford. All rights reserved.27
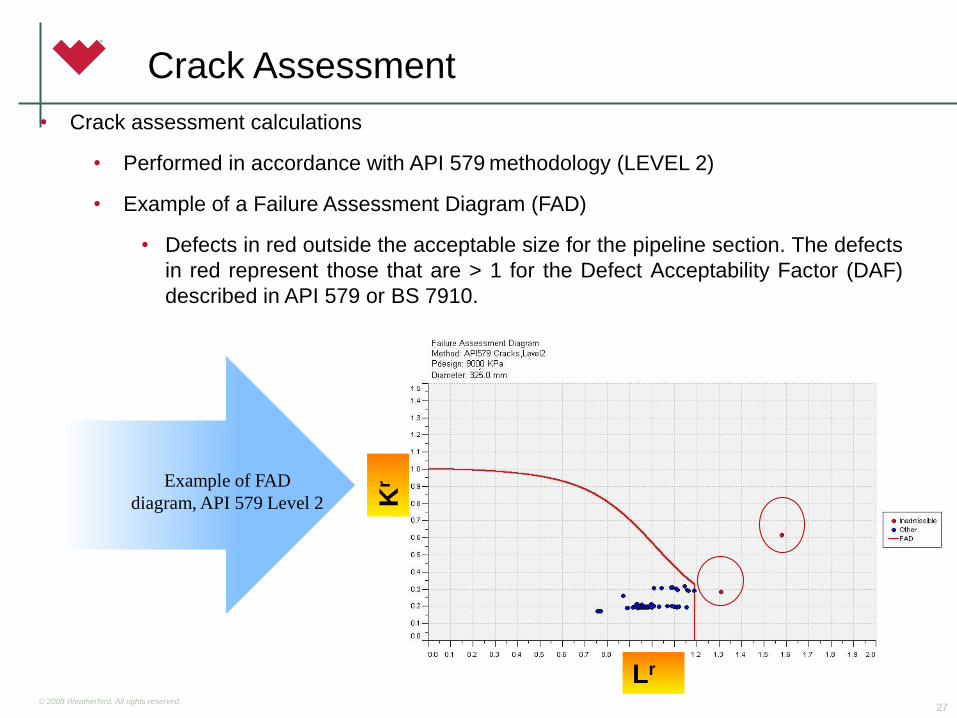
Crack Assessment
• Crack assessment calculations
• Performed in accordance with API 579 methodology (LEVEL 2)
• Example of a Failure Assessment Diagram (FAD)
• Defects in red outside the acceptable size for the pipeline section. The defects
in red represent those that are > 1 for the Defect Acceptability Factor (DAF)
described in API 579 or BS 7910.
Example of FAD
diagram, API 579 Level 2 Kr
Lr

© 2008 Weatherford. All rights reserved.28
Summary of Results with DAF > 1
Below are the results of Anomalies with a Defect Acceptability Factor (DAF) > 1
according to API 579
Cracks Notches LW Anomaly Total
30” TAZ1 - PS01, 4 km 0 0 0 0
18” PS01 – PS06, 169 km 0 2 0 2
18” PS06 – PS09, 121.5 km 0 4 0 4
18” PS09 – US02, 123 km 0 2 1 3
Grand Total of Anomalies 9
Anomalies with DAF > 1 – All 4 Sections
© 2008 Weatherford. All rights reserved.29
• UT CD technology performed well and within specifications
• The projects preparation and planning, tool technology and positive
client-vendor collaboration contributed to a successful project.
• In accordance with the vendor’s internal project management
indicators:
• Scope was delivered on time
• Delivered within budget
• To the client’s satisfaction.
Conclusion

© 2008 Weatherford. All rights reserved.30
www.weatherford.com/pss
Questions?
Thank you!
Top Related