


Languages
Pages
Legal

PhiladelphiaCity of
PEDESTRIAN AND BICYCLE CRASH REPORT
2009-2013
April 2015

2
THIS PAGE INTENTIONALLY LEFT BLANK

3
CITY OF PHILADELPHIA
April 17, 2015
Philadelphians, Over the past seven years, Philadelphia has strived to encourage healthier lifestyles by making it safer and easier to walk and bicycle as an alternative to driving a car for errands, work, and play. Nationally, about 40% of all trips that people make on a daily basis are less than two miles. In urban core areas, this percentage is even greater. Supporting alternative, active transportation for these trips can increase physical activity, improve air quality, and social interactions, but people must feel safe to walk or bike. A key step of our process for continued transportation safety improvements that help to promote alternative transportation is being able to review and measure our performance. Although various traffic safety reports are completed on a regular basis within the Department of Streets, this report serves as a model for measuring safety trends citywide to be reproduced every two years as part of an ever-improving process. It is our hope, that this process is one that will serve our City by allowing the public and city employees to reflect on these accomplishments and focus on what is still necessary for improving a safer and healthier multi-modal transportation network.
Rina Cutler James W.Buehler Deputy Mayor, Transportation and Utilities Health Commissioner

4
THIS PAGE INTENTIONALLY LEFT BLANK

EXECUTIVE SUMMARY | 5
EXECUTIVE SUMMARY
A truly healthy, sustainable, and economically viable city makes it safe for all residents to bike or walk for work and play. Over the study period, walking rates in Philadelphia have remained relatively steady (currently at 8.5% of commuters), while bicycle commuting rates have increased (currently at 2%). These rates are above the national average, and higher or on par with peer cities in Pennsylvania and the Mid-Atlantic region. At the same time, the City has made a significant investment in bicycle and pedestrian infrastructure, including bike lanes, bike parking, signage, low-cost safety improvements, education and enforcement campaigns, complete streets policies, and healthy planning and zoning.
Yet real and perceived safety barriers are still key deterrents for people who may otherwise walk or bicycle to their destinations. Motor vehicle crashes claim the lives of over 30 pedestrians and bicyclists per year, and more than 2,200 crashes result in injuries.
This report outlines demographic and geographic trends in bicycle and pedestrian crashes from 2009-2013 based on data provided by the Pennsylvania Department of Transportation (PennDOT) and the Philadelphia Police Department. It also includes a summary of key safety and policy initiatives underway to further reduce crashes and increase active commuting (see page 17). It concludes by providing a snapshot of 11 hotspots, or areas with the highest bicycle and pedestrian crashes.
Key Findings:
• Pedestrian crashes remained fairly stable over the course of the study period while bicycle crashes experienced year-to-year fluctuations.
• Bicycle crashes were more likely to have seasonal fluctuations, increasing during the peak riding seasons of July and August.
• The pedestrian and bicycle rate of crashes involving children was 1.5 times as high as the rate among adults, but severe injuries were more common in crashes involving adults.
• Pedestrian fatalities increased 15.6% from 32 in 2009 to 37 in 2013. During this same time period, the number of bicycle fatalities fell from 2 in 2009 to 0 in 2013
• Fatalities were more likely, and injuries more severe, in pedestrian crashes compared to bicycle crashes.
• Center City is the most heavily affected area for both bicycle and pedestrian crashes, potentially reflecting higher rates of bicycling and pedestrian activity.
• Outside of Center City, bicycle crash hotspots exist where high bicycle traffic and high motor-vehicle traffic overlap. Pedestrian crash hotspots appear to be associated with high pedestrian volumes and public transit nodes.
In order to remove perceived barriers to walking and cycling and to reduce the numbers of bicycle and pedestrian crashes in the City of Philadelphia, City agencies such as the Department of Streets, Philadelphia Police Department, the Philadelphia Department of Public Health, and local advocacy organizations will continue to work together on engineering, enforcement, and education interventions, with particular attention to the city’s hotspots. The City also commits to reporting on bicycle and pedestrian crash trends through this biennial public report.

6 | POLICY CONTEXT
POLICY CONTEXT
Complete Streets
Pedestrian and bicyclist health and safety are one of the key priorities of the City of Philadelphia and are addressed by many departments and initiatives.
The Mayor’s Office of Transportation and Utilities (MOTU) is responsible for coordinating all improvements to the pedestrian and bicycle networks and for ensuring increased mobility and sustainability for all travel modes. In support of this vision, in 2011 Mayor Nutter signed the Complete Streets Executive Order that directed all City agencies to accommodate “all users of the transportation system, be they pedestrians, bicyclists, public transit users, or motor vehicle drivers”.
In December 2012, the City Council adopted supporting legislation that formalized this process. MOTU developed a Complete Streets Handbook to guide the City’s future streets planning and designs.
Get Healthy Philly
The Department of Public Health’s Get Healthy Philly was established to make it easier for Philadelphians to be active and stay healthy. Under the initiative the City focused on improving pedestrian and bicycle infrastructure and safety by developing a city-wide Pedestrian and Bicycle Master Plan, forming a Bicycle and Pedestrian Safety Task Force, offering a 39-week Give Respect, Get Respect bicycle and pedestrian education and enforcement campaign, installing new buffered bike lanes and sharrows, and installing way-finding signage, and new bike racks.
Greenworks Philadelphia
Greenworks Philadelphia, a comprehensive framework released by the Mayor’s Office of Sustainability, aims to make Philadelphia the greenest city in the United States by 2015. Of more than 150 initiatives to address the 15 targets of environmental improvements, projects related to pedestrian and bicycle include: more bike racks and bike parking, increased traffic calming, riverfront trail projects, street trees to buffer for pedestrians, street repaving, and sidewalk upgrades.
Philadelphia 2035
Themed around “Thrive, Connect, and Renew”, the Philadelphia Planning Commission’s “Philadelphia 2035” Comprehensive Plan integrates the pedestrian and bicycle networks and development proposals with their neighborhood and district level planning. In particular, policy recommendations under “Connect” theme call for repairs for all infrastructure systems, a bikeshare network, more complete streets, and enhanced pedestrian safety and comfort.
TABLE OF CONTENTS | 7
TABLE OF CONTENTSINTRODUCTION
COMMUTE TRENDS IN WALKING AND BICYCLINGNational and Local ComparisonsState and Local Comparisons
CRASH DATA 2009-2013 ANALYSISMethodology and LimitationsPedestrian and Bicycle Crash Trends
Fatality TrendsYearly TrendsSeasonal ChangeDay of WeekTime of DayDemographics Trends
CURRENT PROGRAMS IN PHILADELPHIA
HOTSPOT ANALYSIS
8
101011
111112121313141516
17
18
LIST OF FIGURES8
9
10
12131414151516
Figure 1: Percent of Workers 16 Years and Older Who Walked and Biked to Work in Philadelphia, 1990 Census, 2000 Census, 2005-2013 American Community Survey Estimate (ACS)Figure 2: Percent of Workers 16 Years and Older Who Walked and Biked to Work, U.S. Cities Compared to the National Average, 2009-2013 ACS Figure 3: Percent of Workers 16 Years and Older Who Walked and Biked to Work in Pennsylvania Cities, 2009-2013 ACSFigure 4: Pedestrian and Bicycle Fatalities, 2009-2013Figure 5: Pedestrian and Bicycle Crashes, 2009-2013Figure 6: Percent of Pedestrian and Bicycle Crashes by Month, 2009-2013Figure 7: Percent of Pedestrian and Bicycle Crashes by Day of Week, 2009-2013Figure 8: Percent of Pedestrian and Bicycle Crashes by Hour of Crash, 2009-2013Figure 9: Percent of Pedestrian and Bicycle Crashes by Hour of Crash and Age, 2009-2013Figure 10: Percent of Pedestrian and Bicycle Crashes by Age, 2009-2013
LIST OF MAPSMap 1: Bicycle Crash HeatmapMap 2: Pedestrian Crash HeatmapMap 3: Pedestrian and Bicycle Crash Hotspot Map
181920
LIST OF TABLESTable 1: Percent Biked and Walked, Philadelphia Gender Split, Last 5 ACS 5-year Estimates and U.S. 2009-2013 ACS
9

8 | INTRODUCTION
INTRODUCTION
Bicycling and walking are active modes of transportation that can contribute to mobility, economic development, public health, and environmental sustainability of a city. Much of Philadelphia’s cityscape has been shaped by its historic past, which produced a walkable street grid that allowed people to shop, eat, commute, and otherwise travel conveniently by foot. These walkable and bikeable streets attract tourists and new residents but also serve as affordable transportation options for local residents. In fact, one-third of Philadelphia’s households have no cars according to the 2010 U.S. Census.
In Philadelphia, bicycle commuting increased by 233% from 1990 to 2013. As illustrated in Figure 1, over the same time period the downward trend in pedestrian commuting has stabilized at around 8.5%. To ensure further improvements of the walkable and bikeable streets, it is important to analyze the areas with traffic safety concerns and to propose interventions under appropriate policies and programs in order to provide more convenient, comfortable, and safe travel routes for pedestrians and bicyclists.
Figure 1: Percent of Workers 16 Years and Older Who Walked and Biked to Work in Philadelphia, 1990 Census, 2000 Census, 2005-2013 American Community Survey Estimate (ACS)
COMMUTE TRENDS IN WALKING AND BICYCLING | 9
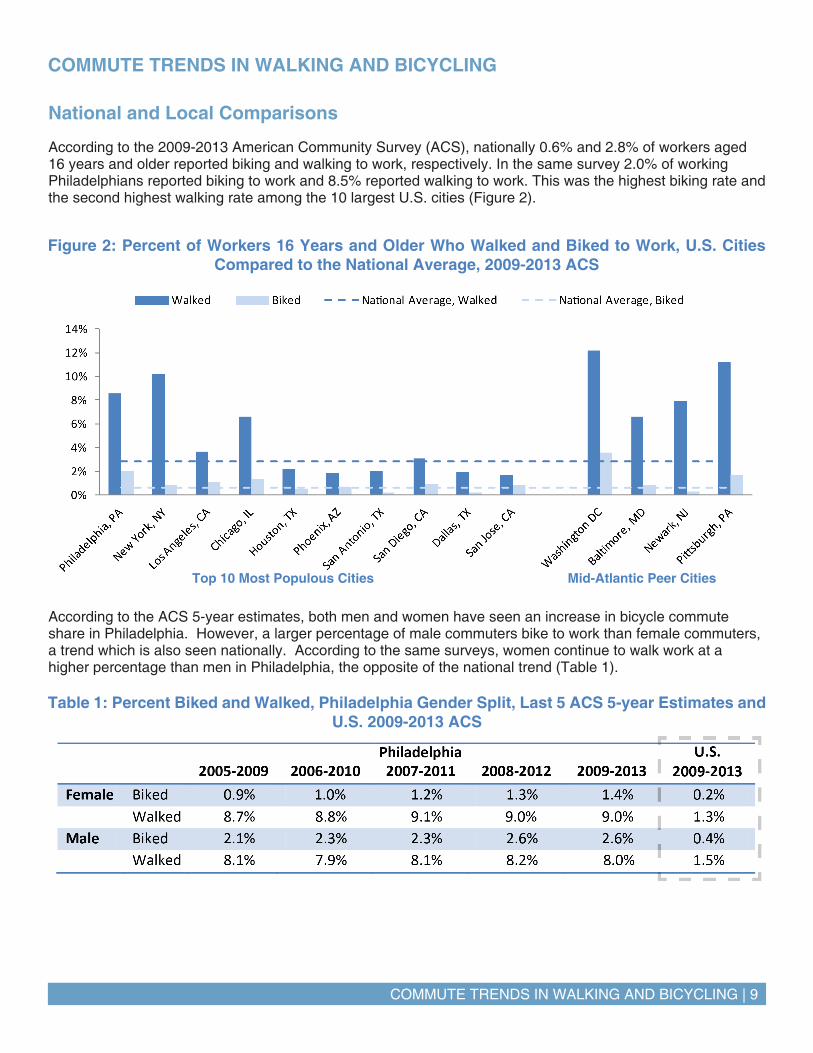
According to the ACS 5-year estimates, both men and women have seen an increase in bicycle commute share in Philadelphia. However, a larger percentage of male commuters bike to work than female commuters, a trend which is also seen nationally. According to the same surveys, women continue to walk work at a higher percentage than men in Philadelphia, the opposite of the national trend (Table 1).
COMMUTE TRENDS IN WALKING AND BICYCLING
According to the 2009-2013 American Community Survey (ACS), nationally 0.6% and 2.8% of workers aged 16 years and older reported biking and walking to work, respectively. In the same survey 2.0% of working Philadelphians reported biking to work and 8.5% reported walking to work. This was the highest biking rate and the second highest walking rate among the 10 largest U.S. cities (Figure 2).
Figure 2: Percent of Workers 16 Years and Older Who Walked and Biked to Work, U.S. Cities Compared to the National Average, 2009-2013 ACS
Top 10 Most Populous Cities Mid-Atlantic Peer Cities
National and Local Comparisons
Table 1: Percent Biked and Walked, Philadelphia Gender Split, Last 5 ACS 5-year Estimates and U.S. 2009-2013 ACS
10 | COMMUTE TRENDS IN WALKING AND BICYCLING
State and Local Comparisons
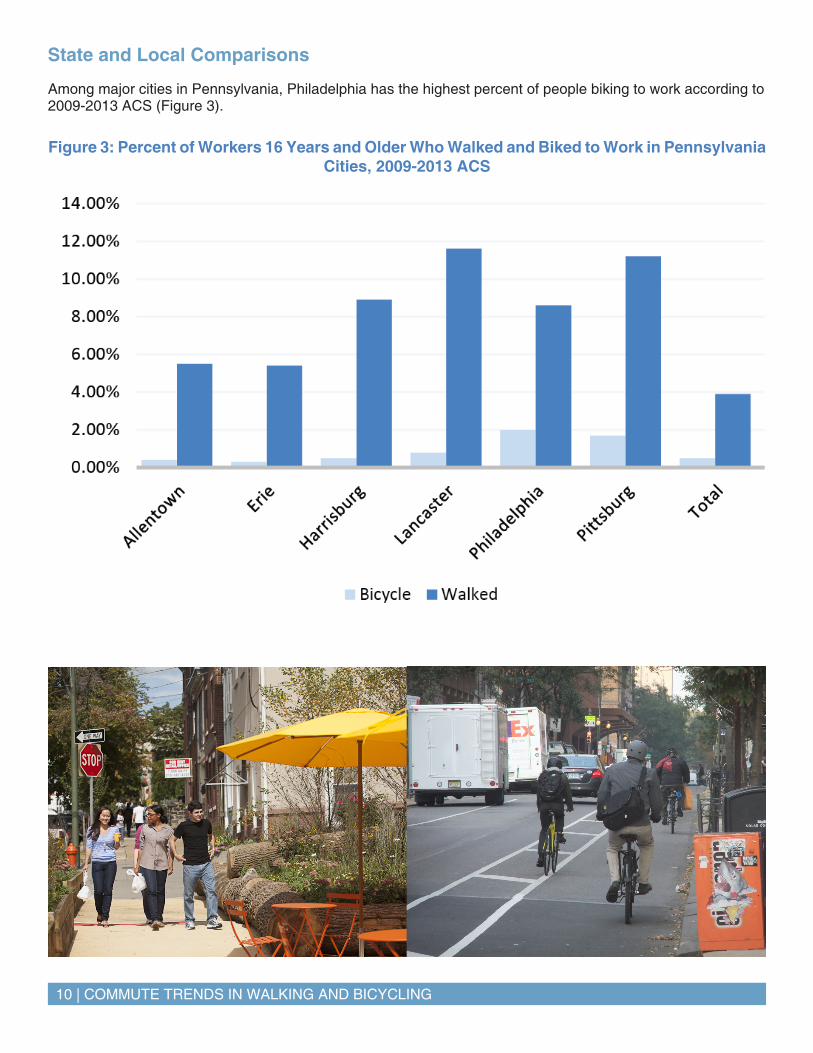
Among major cities in Pennsylvania, Philadelphia has the highest percent of people biking to work according to 2009-2013 ACS (Figure 3).
Figure 3: Percent of Workers 16 Years and Older Who Walked and Biked to Work in Pennsylvania Cities, 2009-2013 ACS
CRASH DATA 2009 - 2013 ANALYSIS | 11
CRASH DATA 2009-2013 ANALYSIS
Methodology and Limitations
For this report the Pennsylvania Department of Transportation (PennDOT) provided the Philadelphia Health Department with a database that provided a wealth of information regarding all reportable crashes that occurred in Philadelphia over the study period of 2009 to 2013, the most recent 5-year span of information available.
This database summarizes crash reports from the Philadelphia Police Department, university police departments, state police, police from adjoining municipalities, transportation authorities, and other agencies with sworn police officers.
Limitations to the information provided in this database are two-fold, the first being the definition of a “reportable motor vehicle crash”, as outlined in the previous section. Because of this definition, any pedestrian or bicycle crash that did not result in an injury or a fatality is not reported in the PennDOT database; therefore, many minor crashes are not reported. In addition, the data also does not include crashes that did not involve a motor vehicle. It is important to note that omitted crashes could include crashes that resulted in serious injuries or fatalities and occurred on public streets. One final note on the limitations of a “reportable motor vehicle crash”, the Pennsylvania Vehicle Code definition of a motor vehicle specifically excludes vehicles that operate on rails, such as trolleys. As a result, crashes between a trolley and a pedestrian or a bicyclist are not included in the PennDOT database even if they resulted in a severe injury or fatality.
The second limitation of the PennDOT database is that it aggregates crash reports, which are not always complete, to provide both descriptive (e.g. age, time of day, etc.) and geospatial (latitude and longitude) information for crashes. Because of this, 3%-10% of bicycle and pedestrian descriptive crash information is missing from the database. In addition, the database is also missing information. Most notably, the database is missing 19.6% of 2009 pedestrian crash locations and 14.8% of 2009 bicycle crash locations. The quality of data has consistently improved over the five year period and geospatial omissions were kept under 0.5% in the last two years.
The remainder of this report analyzes data concerning motor vehicle crashes which involved pedestrians or bicyclists.
The Federal Highway Administration (FHWA) and the National Highway Traffic Safety Administration (NHTSA) have established a national crash reporting system to assure that each state is collecting and analyzing roadway crashes in a relatively comparable way.
Crash data under this system is based on “reportable motor vehicle crashes”. Each state establishes its own criteria regarding what constitutes a reportable crash. According to Title 75, Pennsylvania Consolidated Statutes (the State Vehicle Code), Section 3746 (a), a reportable crash is an incident that occurs on a highway or traffic way that is open to the public by right or custom and involved at least one motor vehicle in transport, if it:
• Results in the death of any person;
• Results in an injury to any person that requires the person to be taken to a hospital; or
• Involves damage to any vehicle to the extent that it cannot be driven under its own power in its customary manner without further damage or hazard to the vehicle, other traffic elements, or the roadway, and therefore requires towing.
12 | CRASH DATA 2009 - 2013 ANALYSIS
Pedestrian and Bicycle Crash Trends
High crash hotspots found in this report reflect the concentration of pedestrian and bicycle crashes, regardless of the concentration of pedestrian or bicycle activity in an area or “exposure.” High concentrations of pedestrian and bicycle activity in an area can lead to higher concentrations of crashes. Without accurate information on pedestrian and bicycle volumes, determining relative danger of a roadway or intersection is not possible. It is also important to address the absolute number of crashes to improve the overall pedestrian and bicycle safety.
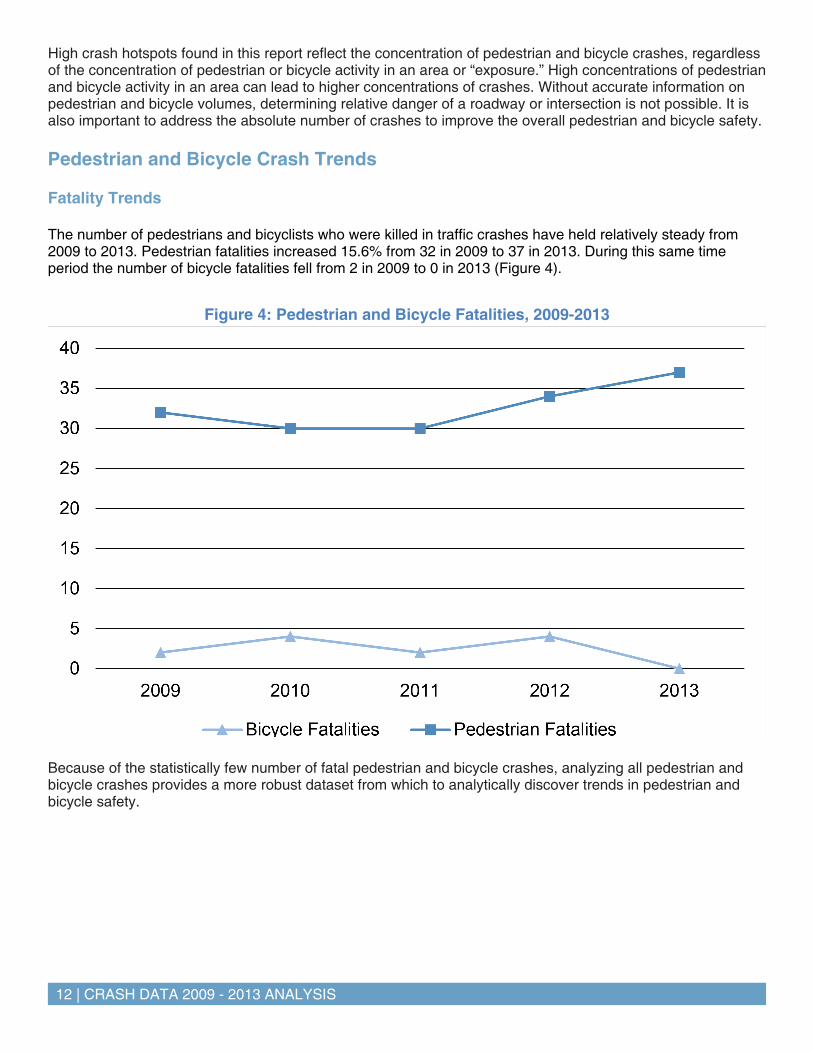
Fatality Trends
The number of pedestrians and bicyclists who were killed in traffic crashes have held relatively steady from 2009 to 2013. Pedestrian fatalities increased 15.6% from 32 in 2009 to 37 in 2013. During this same time period the number of bicycle fatalities fell from 2 in 2009 to 0 in 2013 (Figure 4).
Because of the statistically few number of fatal pedestrian and bicycle crashes, analyzing all pedestrian and bicycle crashes provides a more robust dataset from which to analytically discover trends in pedestrian and bicycle safety.
Figure 4: Pedestrian and Bicycle Fatalities, 2009-2013

CRASH DATA 2009 - 2013 ANALYSIS | 13
1,810 ! 1,798 ! 1,788 ! 1,791 ! 1,842 !
473 ! 573 ! 513 ! 493 ! 541 !
0!200!400!600!800!
1,000!1,200!1,400!1,600!1,800!2,000!
2009! 2010! 2011! 2012! 2013!
Pedestrian Crashes! Bicycle Crashes!
Yearly Trends
Both pedestrian and bicycle crashes increased in number over the course of the study period. Crashes involving pedestrians increased 1.8% from 1,810 in 2009 to 1,825 in 2013 while crashes involving bicyclists increased 14.4% from 473 to 541 during the same period (Figure 5).
Figure 5: Pedestrian and Bicycle Crashes, 2009-2013
Seasonal Change
Bicycle crashes are more likely to occur during periods of greater cycling activity. Consequently, crashes peaked in the summer and remained high into early fall, with very few crashes in winter. Bicyclists are about six times as likely to be involved in a crash during the peak riding season of July and August than during the winter months of January and February.
Pedestrian crashes, on the other hand, were relatively more evenly distributed throughout the year, with slightly higher numbers in the spring and fall. This suggests more consistent walking habits year-round when compared with cycling (Figure 5).
14 | CRASH DATA 2009 - 2013 ANALYSIS
6.9%
!
7.0%
! 8.5%
!
9.1%
!
10.0
%!
9.1%
!
7.6%
!
7.6%
! 9.2%
!
8.9%
!
8.1%
!
8.0%
!
2.2%
!
2.4%
!
5.6%
!
8.7%
! 10.7
%! 13
.3%!
13.8
%!
11.5
%!
12.2
%!
9.4%
!
6.2%
!
4.0%
!
0%!
5%!
10%!
15%!
Jan! Feb! Mar! Aprl! May! Jun! Jul! Aug! Sep! Oct! Nov! Dec!
Pedestrian Crashes! Bicycle Crashes!
14.1
%!
14.8
%!
14.9
%!
15.2
%! 18
.3%!
12.8
%!
9.9%
!
15.7
%!
13.7
%!
15.0
%!
14.1
%!
15.7
%!
14.3
%!
11.6
%!
0%!
5%!
10%!
15%!
20%!
Mon! Tues! Wed! Thu! Fri! Sat! Sun!
Pedestrian Crashes! Bicycle Crashes!
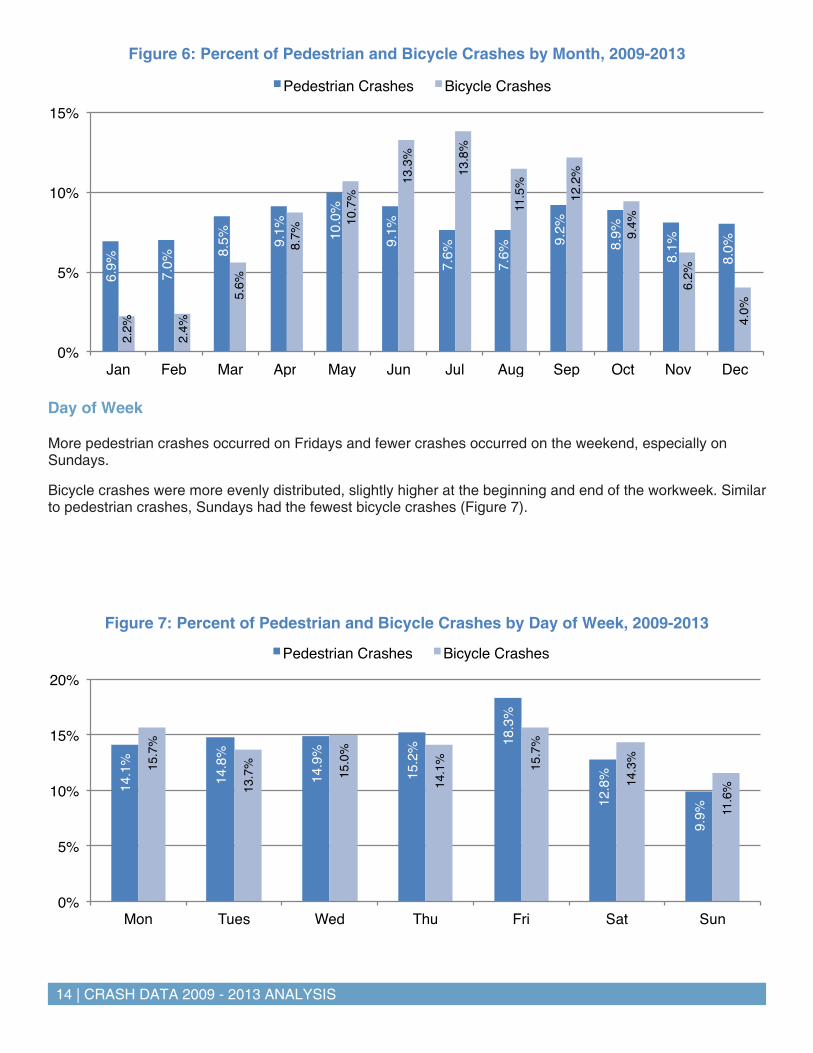
Figure 6: Percent of Pedestrian and Bicycle Crashes by Month, 2009-2013
Day of Week
More pedestrian crashes occurred on Fridays and fewer crashes occurred on the weekend, especially on Sundays.
Bicycle crashes were more evenly distributed, slightly higher at the beginning and end of the workweek. Similar to pedestrian crashes, Sundays had the fewest bicycle crashes (Figure 7).
Figure 7: Percent of Pedestrian and Bicycle Crashes by Day of Week, 2009-2013
CRASH DATA 2009 - 2013 ANALYSIS | 15
0%!
1%!
2%!
3%!
4%!
5%!
6%!
7%!
8%!
9%!
10%!
12 AM!
1 AM!
2 AM!
3 AM!
4 AM!
5 AM!
6 AM!
7 AM!
8 AM!
9 AM!
10 AM!
11 AM!
12 PM!
1 PM!
2 PM!
3 PM!
4 PM!
5 PM!
6 PM!
7 PM!
8 PM!
9 PM!
10 PM!
11 PM!
Pedestrian Crashes! Bicycle Crashes!
0%
10%
20%
30%
40%
12AM-2AM 3AM-5AM 6AM-8AM 9AM-11AM 12PM-2PM 3PM-5PM 6PM-8PM 9PM-11PM
Pedestrian crashes: Adult, 18+ Pedestrian crashes: Child, 17 and UnderBicycle crashes: Adult, 18+ Bicycle crashes: Child, 17 and Under
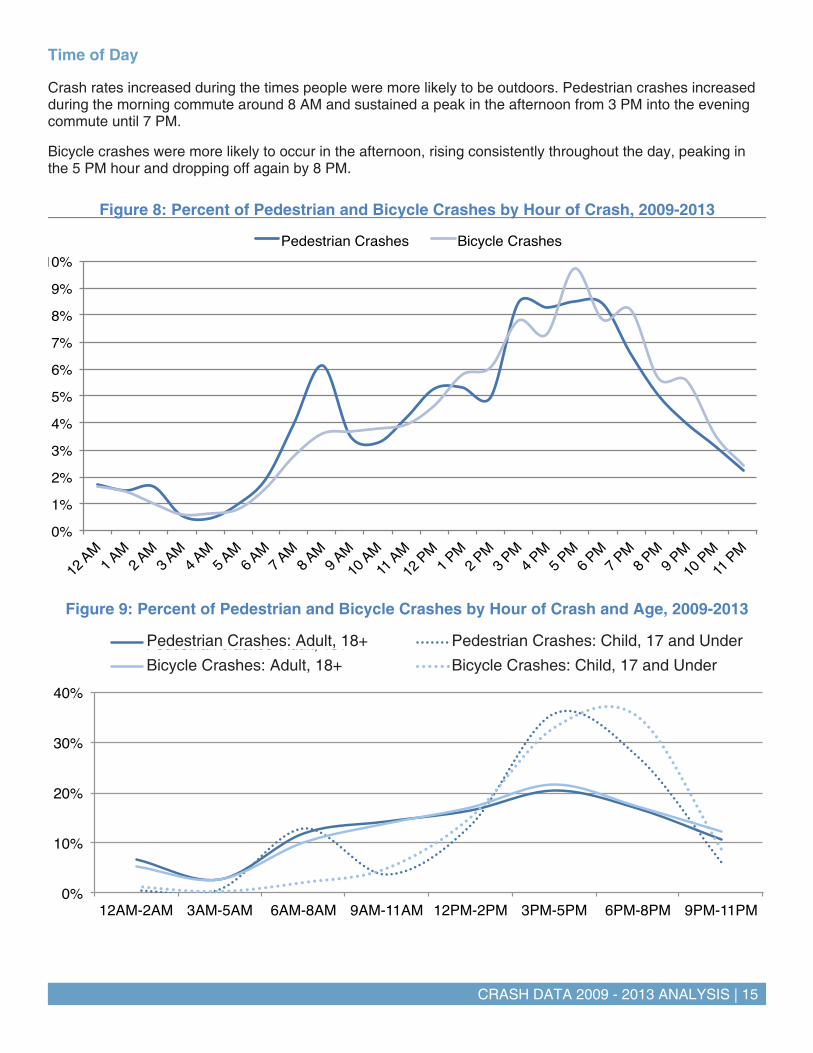
Time of Day
Crash rates increased during the times people were more likely to be outdoors. Pedestrian crashes increased during the morning commute around 8 AM and sustained a peak in the afternoon from 3 PM into the evening commute until 7 PM.
Bicycle crashes were more likely to occur in the afternoon, rising consistently throughout the day, peaking in the 5 PM hour and dropping off again by 8 PM.
Figure 8: Percent of Pedestrian and Bicycle Crashes by Hour of Crash, 2009-2013
Figure 9: Percent of Pedestrian and Bicycle Crashes by Hour of Crash and Age, 2009-2013
Pedestrian Crashes: Adult, 18+
Bicycle Crashes: Adult, 18+
Pedestrian Crashes: Child, 17 and Under
Bicycle Crashes: Child, 17 and Under
16 | CRASH DATA 2009 - 2013 ANALYSIS
0%!
2%!
4%!
6%!
8%!
10%!
12%!
14%!
16%!
18%!
20%!
1-5!
6-10!
11-15!16
-20!21
-25!26
-30!31
-35!36
-40!41
-45!46
-50!51
-55!56
-60!61
-65!66
-70!71
-75!76
-80!81
-85!86
-90!91
-95!
Pedestrian Crashes! Bicycle Crashes!
Pedestrian crashes involving children increased between 6 AM and 9 AM during the morning commute to schools and peaked between 3 PM and 6 PM during after school hours. Pedestrian crashes among adults were more evenly distributed throughout the day, rising somewhat during afternoon rush hour.
The majority of bicycle crashes involving children occurred between 3 PM and 9 PM during after school and recreation hours while crashes involving adults were more evenly distributed and rose moderately during the afternoon rush hour.
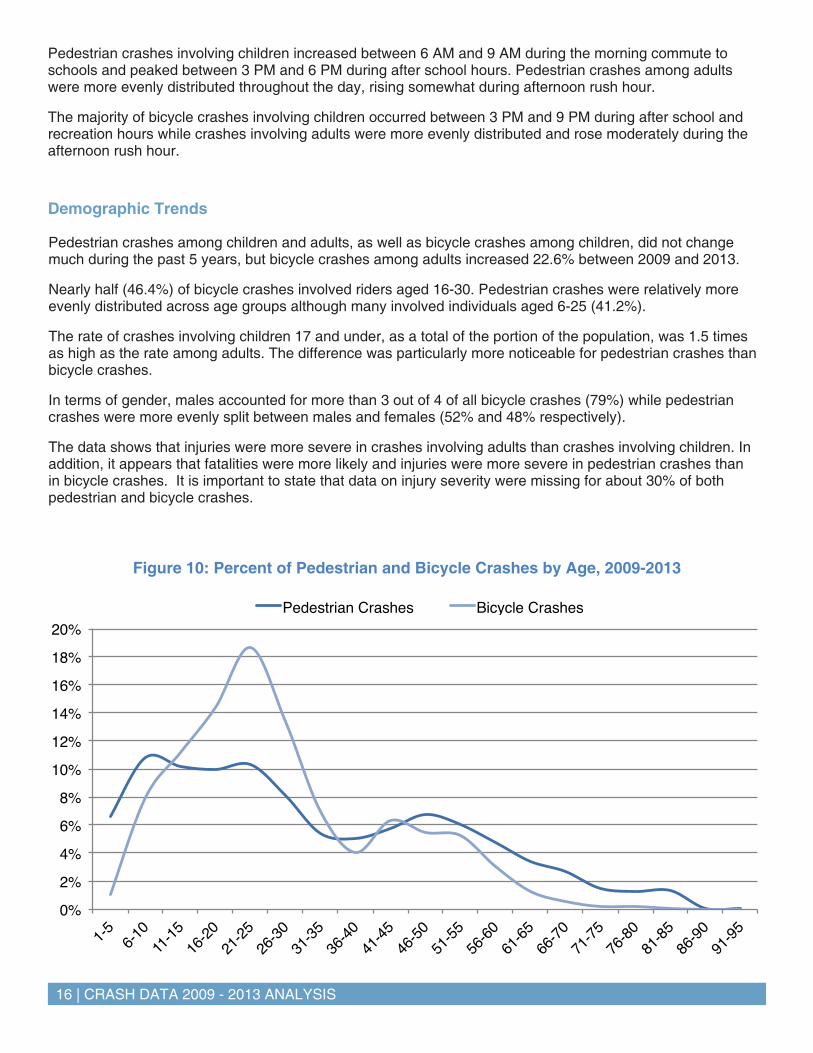
Demographic Trends
Figure 10: Percent of Pedestrian and Bicycle Crashes by Age, 2009-2013
Pedestrian crashes among children and adults, as well as bicycle crashes among children, did not change much during the past 5 years, but bicycle crashes among adults increased 22.6% between 2009 and 2013.
Nearly half (46.4%) of bicycle crashes involved riders aged 16-30. Pedestrian crashes were relatively more evenly distributed across age groups although many involved individuals aged 6-25 (41.2%).
The rate of crashes involving children 17 and under, as a total of the portion of the population, was 1.5 times as high as the rate among adults. The difference was particularly more noticeable for pedestrian crashes than bicycle crashes.
In terms of gender, males accounted for more than 3 out of 4 of all bicycle crashes (79%) while pedestrian crashes were more evenly split between males and females (52% and 48% respectively).
The data shows that injuries were more severe in crashes involving adults than crashes involving children. In addition, it appears that fatalities were more likely and injuries were more severe in pedestrian crashes than in bicycle crashes. It is important to state that data on injury severity were missing for about 30% of both pedestrian and bicycle crashes.
CURRENT PROGRAMS | 17
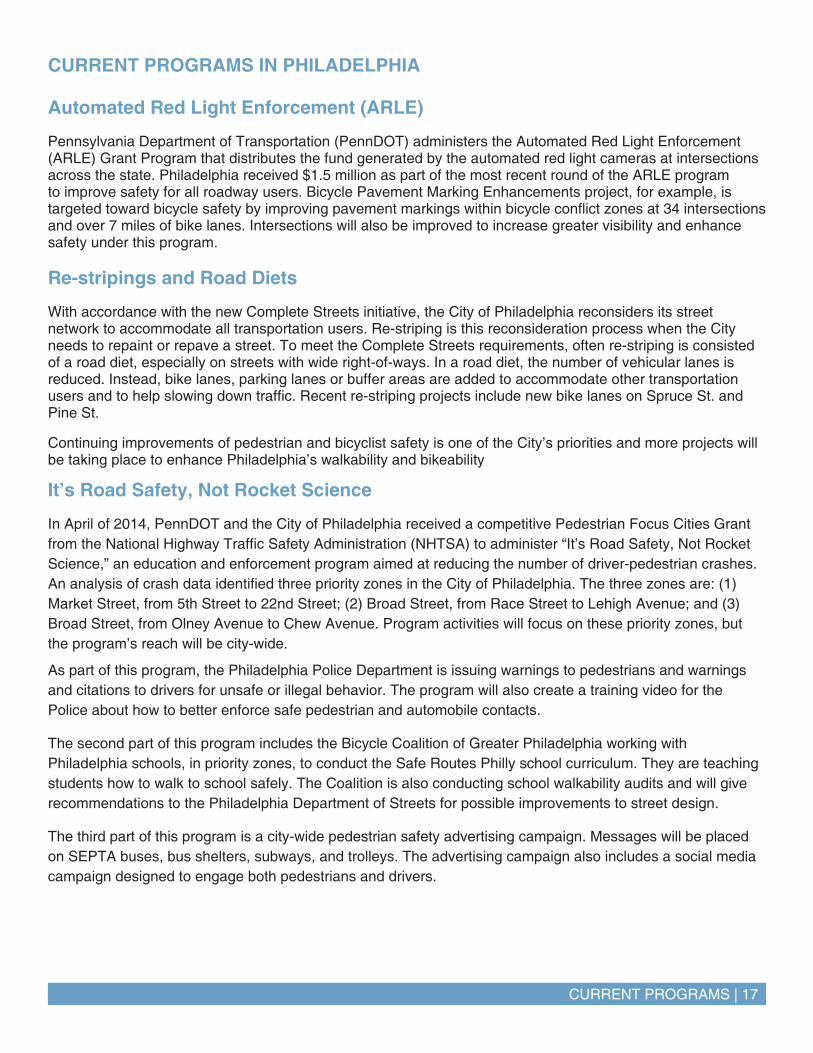
CURRENT PROGRAMS IN PHILADELPHIA
Automated Red Light Enforcement (ARLE)
Pennsylvania Department of Transportation (PennDOT) administers the Automated Red Light Enforcement (ARLE) Grant Program that distributes the fund generated by the automated red light cameras at intersections across the state. Philadelphia received $1.5 million as part of the most recent round of the ARLE program to improve safety for all roadway users. Bicycle Pavement Marking Enhancements project, for example, is targeted toward bicycle safety by improving pavement markings within bicycle conflict zones at 34 intersections and over 7 miles of bike lanes. Intersections will also be improved to increase greater visibility and enhance safety under this program.
Re-stripings and Road Diets
With accordance with the new Complete Streets initiative, the City of Philadelphia reconsiders its street network to accommodate all transportation users. Re-striping is this reconsideration process when the City needs to repaint or repave a street. To meet the Complete Streets requirements, often re-striping is consisted of a road diet, especially on streets with wide right-of-ways. In a road diet, the number of vehicular lanes is reduced. Instead, bike lanes, parking lanes or buffer areas are added to accommodate other transportation users and to help slowing down traffic. Recent re-striping projects include new bike lanes on Spruce St. and Pine St.
Continuing improvements of pedestrian and bicyclist safety is one of the City’s priorities and more projects will be taking place to enhance Philadelphia’s walkability and bikeability
It’s Road Safety, Not Rocket Science
In April of 2014, PennDOT and the City of Philadelphia received a competitive Pedestrian Focus Cities Grant from the National Highway Traffic Safety Administration (NHTSA) to administer “It’s Road Safety, Not Rocket Science,” an education and enforcement program aimed at reducing the number of driver-pedestrian crashes. An analysis of crash data identified three priority zones in the City of Philadelphia. The three zones are: (1) Market Street, from 5th Street to 22nd Street; (2) Broad Street, from Race Street to Lehigh Avenue; and (3) Broad Street, from Olney Avenue to Chew Avenue. Program activities will focus on these priority zones, but the program’s reach will be city-wide.
As part of this program, the Philadelphia Police Department is issuing warnings to pedestrians and warnings and citations to drivers for unsafe or illegal behavior. The program will also create a training video for the Police about how to better enforce safe pedestrian and automobile contacts.
The second part of this program includes the Bicycle Coalition of Greater Philadelphia working with Philadelphia schools, in priority zones, to conduct the Safe Routes Philly school curriculum. They are teaching students how to walk to school safely. The Coalition is also conducting school walkability audits and will give recommendations to the Philadelphia Department of Streets for possible improvements to street design.
The third part of this program is a city-wide pedestrian safety advertising campaign. Messages will be placed on SEPTA buses, bus shelters, subways, and trolleys. The advertising campaign also includes a social media campaign designed to engage both pedestrians and drivers.
18 | HOTSPOTS ANAYSIS
± 0 1 20.5Miles
CENTER CITY
UNIVERSITY/SOUTHWEST
BROA
D ST
REET
LINE
MARKET-FRANKFORD LINE
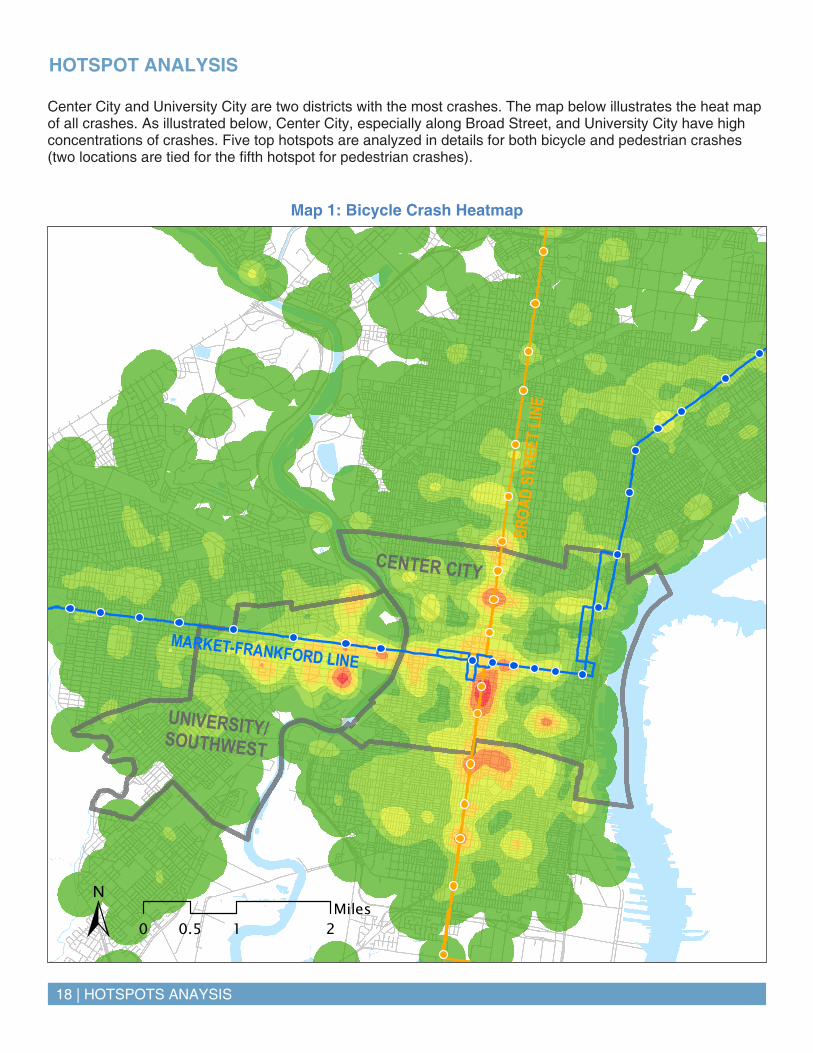
Map 1: Bicycle Crash Heatmap
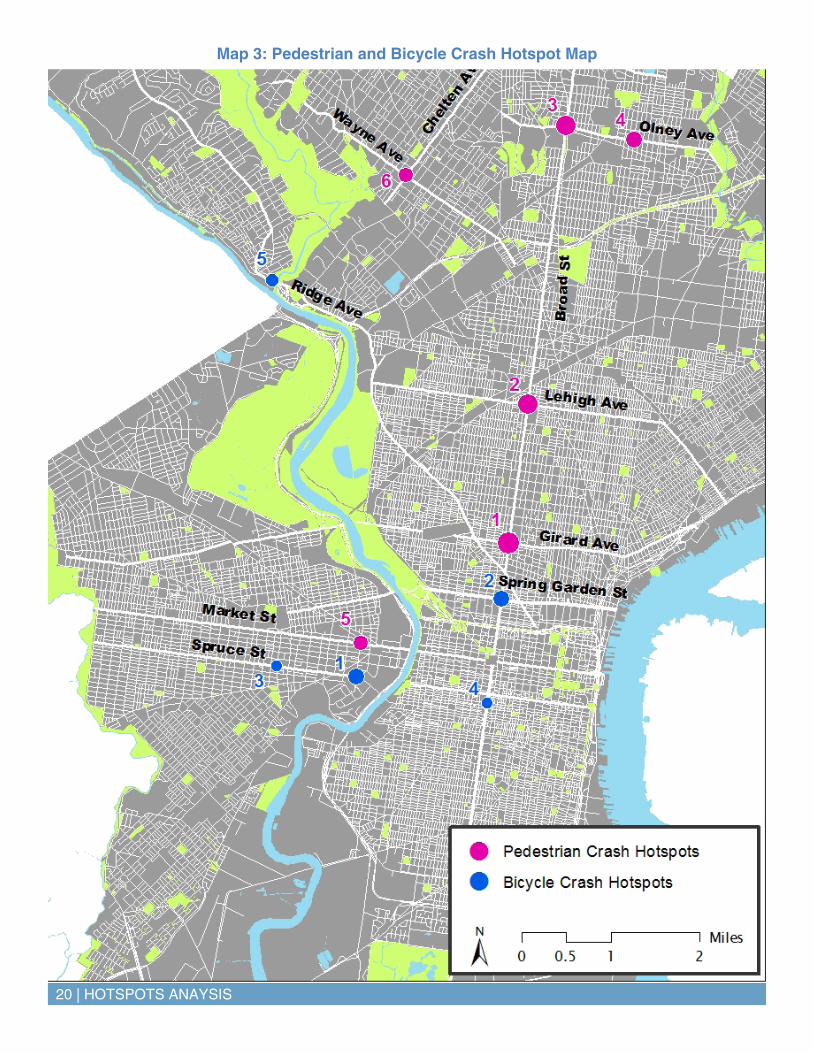
Center City and University City are two districts with the most crashes. The map below illustrates the heat map of all crashes. As illustrated below, Center City, especially along Broad Street, and University City have high concentrations of crashes. Five top hotspots are analyzed in details for both bicycle and pedestrian crashes (two locations are tied for the fifth hotspot for pedestrian crashes).
HOTSPOT ANALYSIS
HOTSPOTS ANAYSIS | 19
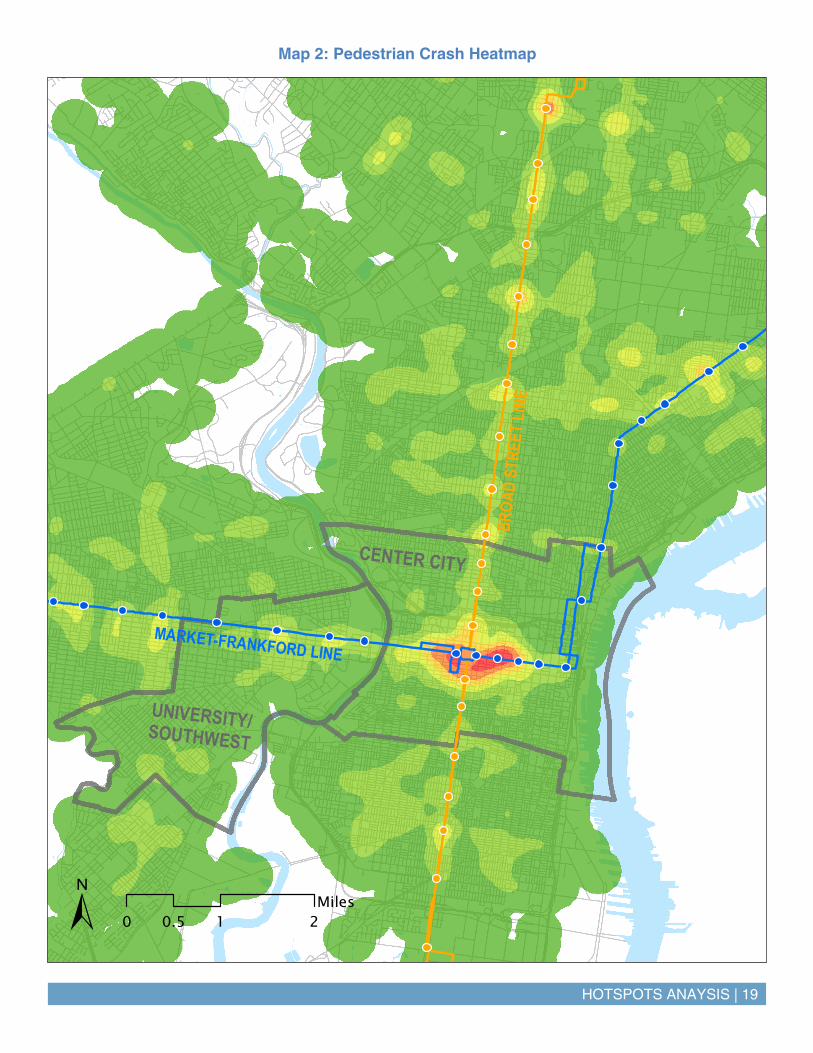
Map 2: Pedestrian Crash Heatmap
± 0 1 20.5Miles
CENTER CITY
UNIVERSITY/SOUTHWEST
BROA
D ST
REET
LINE
MARKET-FRANKFORD LINE
20 | HOTSPOTS ANAYSIS
Map 3: Pedestrian and Bicycle Crash Hotspot Map
HOTSPOTS ANAYSIS | 21
P
P
SPRUCE ST
34TH
ST
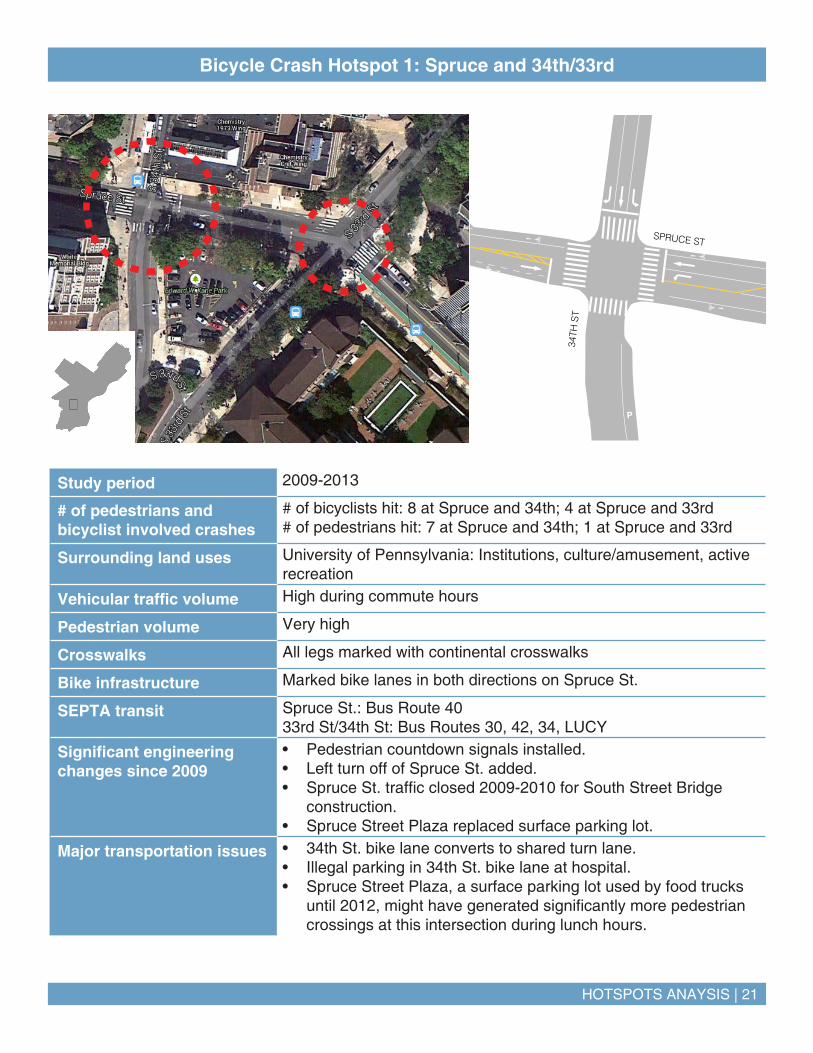
Bicycle Crash Hotspot 1: Spruce and 34th/33rd
Study period 2009-2013
# of pedestrians and bicyclist involved crashes
# of bicyclists hit: 8 at Spruce and 34th; 4 at Spruce and 33rd# of pedestrians hit: 7 at Spruce and 34th; 1 at Spruce and 33rd
Surrounding land uses University of Pennsylvania: Institutions, culture/amusement, active recreation
Vehicular traffic volume High during commute hours
Pedestrian volume Very high
Crosswalks All legs marked with continental crosswalks
Bike infrastructure Marked bike lanes in both directions on Spruce St.
SEPTA transit Spruce St.: Bus Route 4033rd St/34th St: Bus Routes 30, 42, 34, LUCY
Significant engineering changes since 2009
• Pedestrian countdown signals installed.• Left turn off of Spruce St. added.• Spruce St. traffic closed 2009-2010 for South Street Bridge
construction.• Spruce Street Plaza replaced surface parking lot.
Major transportation issues • 34th St. bike lane converts to shared turn lane.• Illegal parking in 34th St. bike lane at hospital.• Spruce Street Plaza, a surface parking lot used by food trucks
until 2012, might have generated significantly more pedestrian crossings at this intersection during lunch hours.
22 | HOTSPOTS ANAYSIS
P
P
P
P
SPRING GARDEN ST
BRO
AD S
T
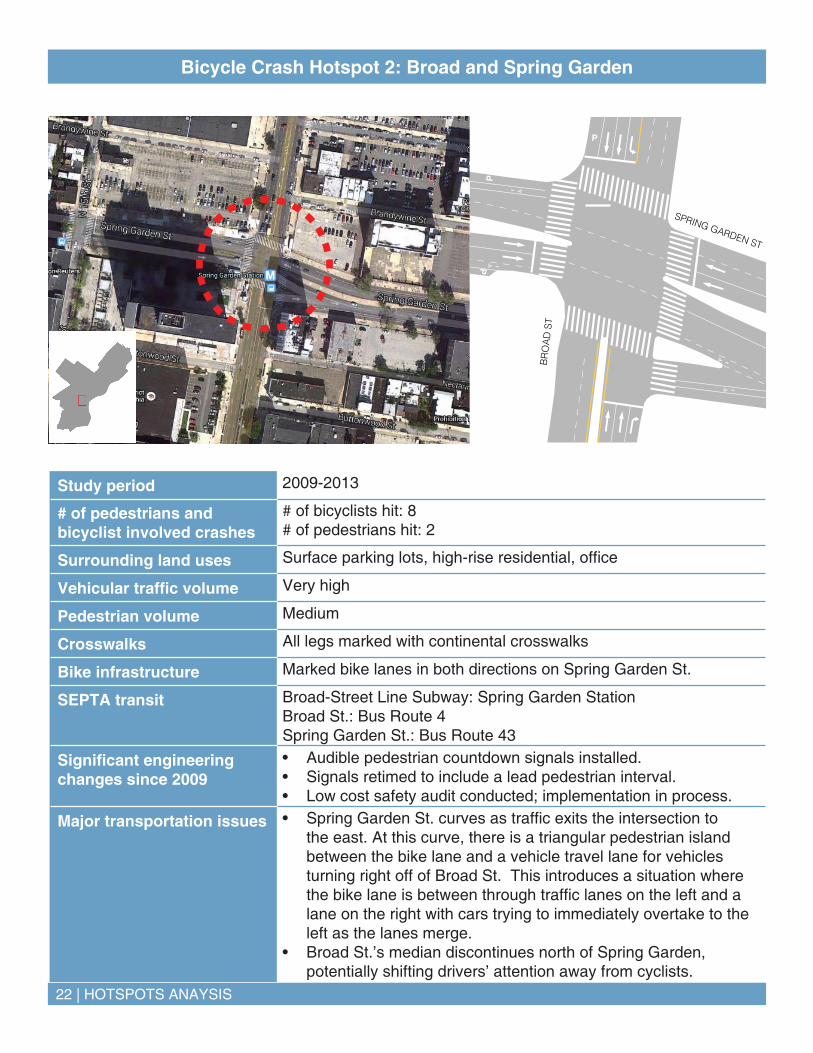
Bicycle Crash Hotspot 2: Broad and Spring Garden
Study period 2009-2013
# of pedestrians and bicyclist involved crashes
# of bicyclists hit: 8# of pedestrians hit: 2
Surrounding land uses Surface parking lots, high-rise residential, office
Vehicular traffic volume Very high
Pedestrian volume Medium
Crosswalks All legs marked with continental crosswalks
Bike infrastructure Marked bike lanes in both directions on Spring Garden St.
SEPTA transit Broad-Street Line Subway: Spring Garden StationBroad St.: Bus Route 4Spring Garden St.: Bus Route 43
Significant engineering changes since 2009
• Audible pedestrian countdown signals installed.• Signals retimed to include a lead pedestrian interval.• Low cost safety audit conducted; implementation in process.
Major transportation issues • Spring Garden St. curves as traffic exits the intersection to the east. At this curve, there is a triangular pedestrian island between the bike lane and a vehicle travel lane for vehicles turning right off of Broad St. This introduces a situation where the bike lane is between through traffic lanes on the left and a lane on the right with cars trying to immediately overtake to the left as the lanes merge.
• Broad St.’s median discontinues north of Spring Garden, potentially shifting drivers’ attention away from cyclists.
HOTSPOTS ANAYSIS | 23
PP
PP
P
P
P
P
SPRUCE ST
43RD
ST
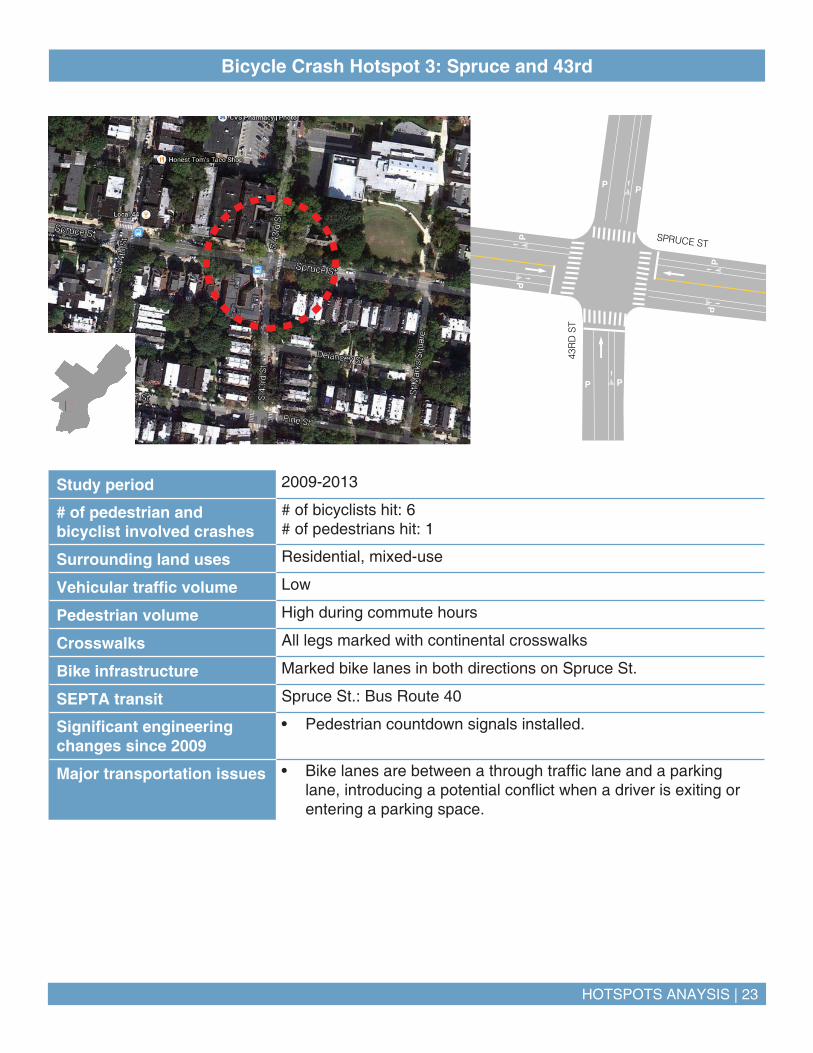
Bicycle Crash Hotspot 3: Spruce and 43rd
Study period 2009-2013
# of pedestrian and bicyclist involved crashes
# of bicyclists hit: 6# of pedestrians hit: 1
Surrounding land uses Residential, mixed-use
Vehicular traffic volume Low
Pedestrian volume High during commute hours
Crosswalks All legs marked with continental crosswalks
Bike infrastructure Marked bike lanes in both directions on Spruce St.
SEPTA transit Spruce St.: Bus Route 40
Significant engineering changes since 2009
• Pedestrian countdown signals installed.
Major transportation issues • Bike lanes are between a through traffic lane and a parking lane, introducing a potential conflict when a driver is exiting or entering a parking space.

24 | HOTSPOTS ANAYSIS
P
P
P
P
P
PINE ST
BRO
AD S
T
Bicycle Crash Hotspot 4: Broad and Pine
Study period 2009-2013
# of pedestrian and bicyclist involved crashes
# of bicyclists hit: 6 (additional 3 within 300 feet east of this intersection)# of pedestrians hit: 1
Surrounding land uses Institutions (University of the Arts Library, Jewish Community Center), parking garage with mixed-use retails, mixed-use high-rise residential
Vehicular traffic volume High
Pedestrian volume High during commute hours
Crosswalks Paved in different materials but not marked
Bike infrastructure Eastbound buffered bike lane on Pine St.
SEPTA transit Broad St.: Bus Routes 4, 27, 32
Significant engineering changes since 2009
• Pedestrian countdown signals installed.• New buffered bike lane on Pine.
Major transportation issues • The new bike lane on Pine St. in 2009 increased bicyclist traffic in this area.
• Difficult to bike on Broad St.• Drivers are able to load/unload in the bicycle lane, creating
potential for conflict. • Bicycle lane becomes a right turn lane, creating potential for
conflict.
HOTSPOTS ANAYSIS | 25
RIDGE AVE
MAIN ST
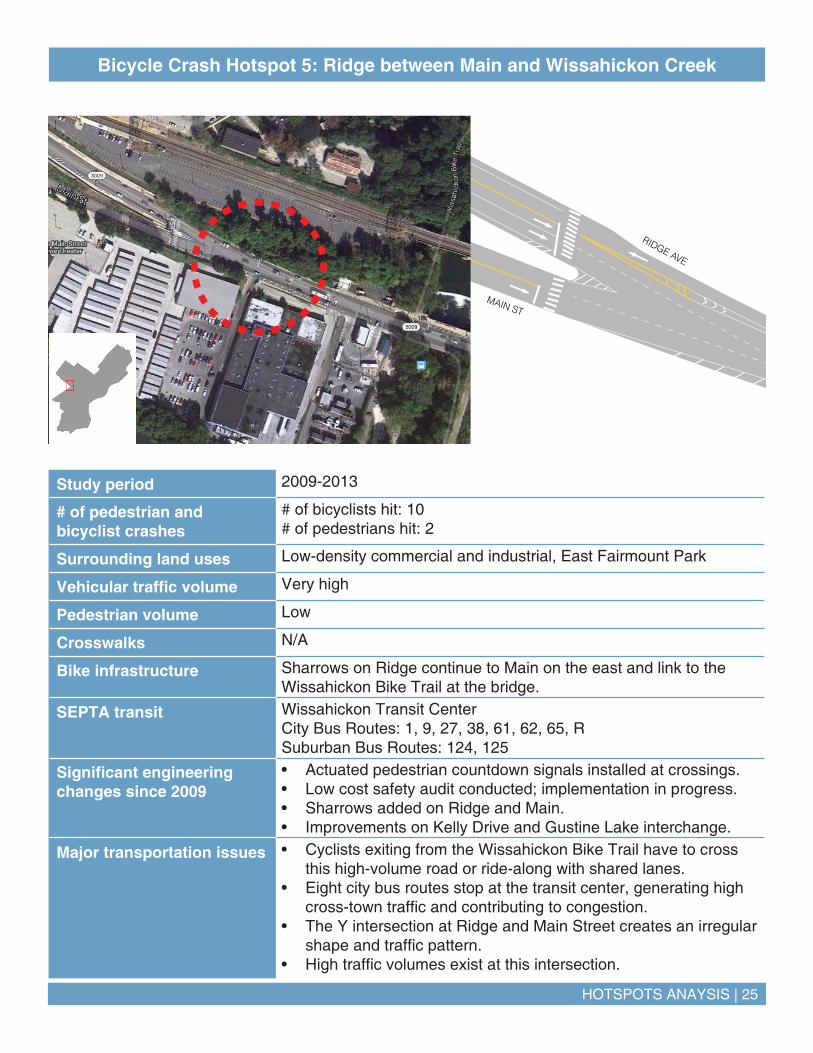
Bicycle Crash Hotspot 5: Ridge between Main and Wissahickon Creek
Study period 2009-2013
# of pedestrian and bicyclist crashes
# of bicyclists hit: 10# of pedestrians hit: 2
Surrounding land uses Low-density commercial and industrial, East Fairmount Park
Vehicular traffic volume Very high
Pedestrian volume Low
Crosswalks N/A
Bike infrastructure Sharrows on Ridge continue to Main on the east and link to the Wissahickon Bike Trail at the bridge.
SEPTA transit Wissahickon Transit CenterCity Bus Routes: 1, 9, 27, 38, 61, 62, 65, RSuburban Bus Routes: 124, 125
Significant engineering changes since 2009
• Actuated pedestrian countdown signals installed at crossings.• Low cost safety audit conducted; implementation in progress.• Sharrows added on Ridge and Main.• Improvements on Kelly Drive and Gustine Lake interchange.
Major transportation issues • Cyclists exiting from the Wissahickon Bike Trail have to cross this high-volume road or ride-along with shared lanes.
• Eight city bus routes stop at the transit center, generating high cross-town traffic and contributing to congestion.
• The Y intersection at Ridge and Main Street creates an irregular shape and traffic pattern.
• High traffic volumes exist at this intersection.
26 | HOTSPOTS ANAYSIS
PP
P
P
P
P
GIRARD AVE
BRO
AD S
T
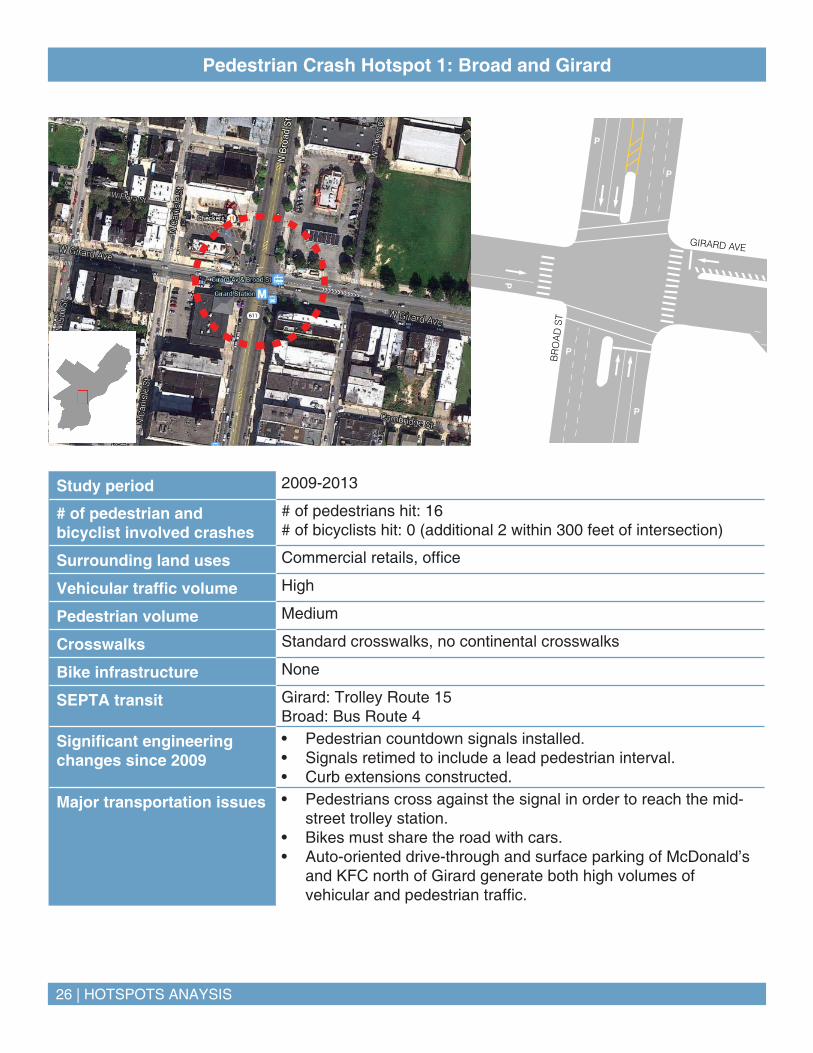
Pedestrian Crash Hotspot 1: Broad and Girard
Study period 2009-2013
# of pedestrian and bicyclist involved crashes
# of pedestrians hit: 16# of bicyclists hit: 0 (additional 2 within 300 feet of intersection)
Surrounding land uses Commercial retails, office
Vehicular traffic volume High
Pedestrian volume Medium
Crosswalks Standard crosswalks, no continental crosswalks
Bike infrastructure None
SEPTA transit Girard: Trolley Route 15Broad: Bus Route 4
Significant engineering changes since 2009
• Pedestrian countdown signals installed.• Signals retimed to include a lead pedestrian interval.• Curb extensions constructed.
Major transportation issues • Pedestrians cross against the signal in order to reach the mid-street trolley station.
• Bikes must share the road with cars.• Auto-oriented drive-through and surface parking of McDonald’s
and KFC north of Girard generate both high volumes of vehicular and pedestrian traffic.
HOTSPOTS ANAYSIS | 27
PP
P
P
P
P
PP
LEHIGH AVE
BRO
AD S
T
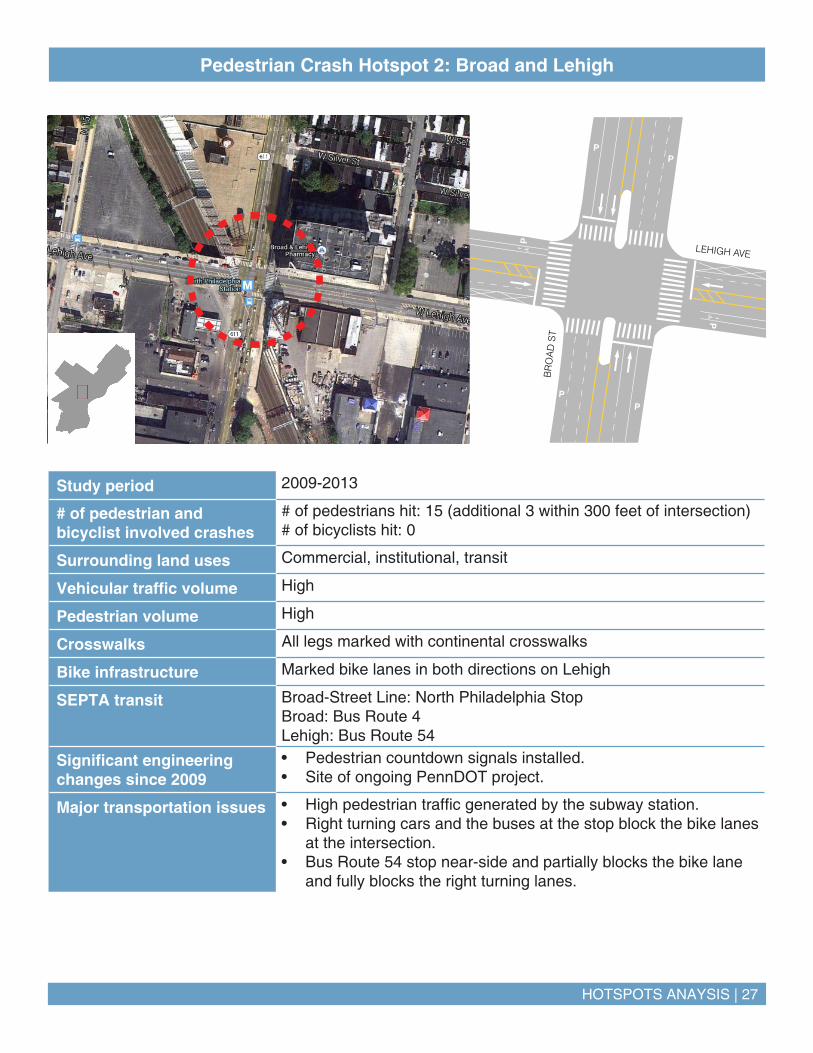
Pedestrian Crash Hotspot 2: Broad and Lehigh
Study period 2009-2013
# of pedestrian and bicyclist involved crashes
# of pedestrians hit: 15 (additional 3 within 300 feet of intersection)# of bicyclists hit: 0
Surrounding land uses Commercial, institutional, transit
Vehicular traffic volume High
Pedestrian volume High
Crosswalks All legs marked with continental crosswalks
Bike infrastructure Marked bike lanes in both directions on Lehigh
SEPTA transit Broad-Street Line: North Philadelphia StopBroad: Bus Route 4Lehigh: Bus Route 54
Significant engineering changes since 2009
• Pedestrian countdown signals installed.• Site of ongoing PennDOT project.
Major transportation issues • High pedestrian traffic generated by the subway station.• Right turning cars and the buses at the stop block the bike lanes
at the intersection.• Bus Route 54 stop near-side and partially blocks the bike lane
and fully blocks the right turning lanes.
28 | HOTSPOTS ANAYSIS
P
PP
P
P
OLNEY AVE
BRO
AD S
T
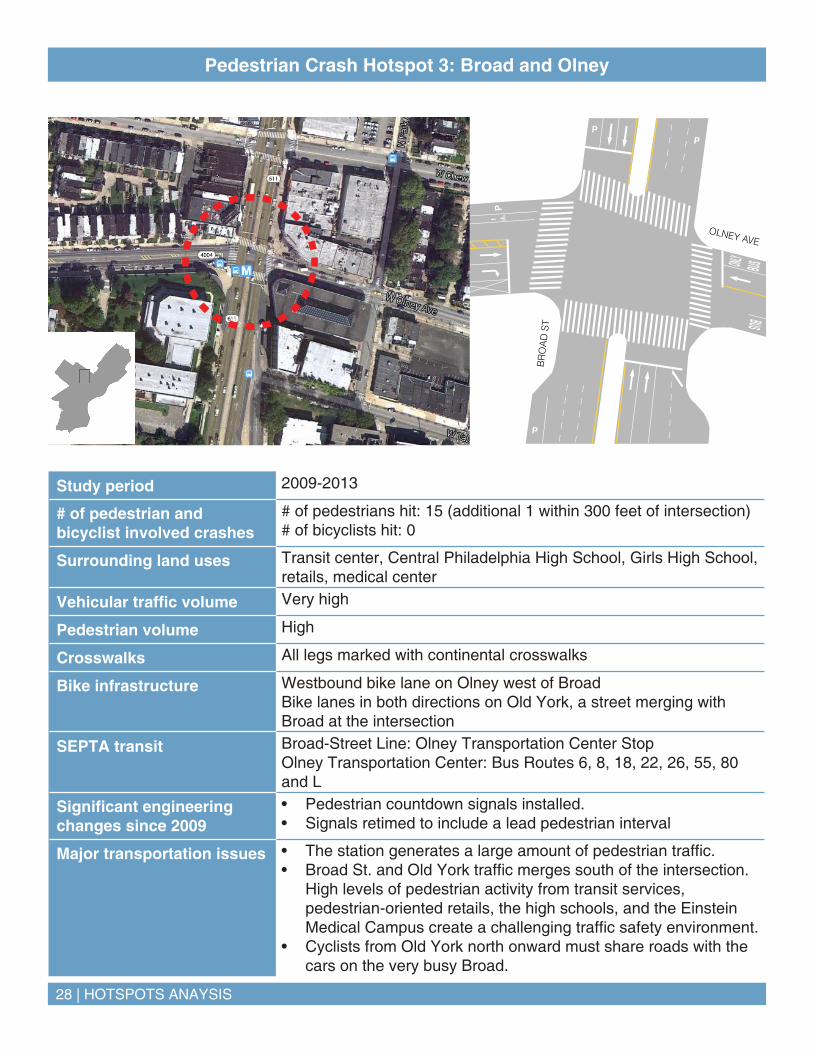
Pedestrian Crash Hotspot 3: Broad and Olney
Study period 2009-2013
# of pedestrian and bicyclist involved crashes
# of pedestrians hit: 15 (additional 1 within 300 feet of intersection)# of bicyclists hit: 0
Surrounding land uses Transit center, Central Philadelphia High School, Girls High School, retails, medical center
Vehicular traffic volume Very high
Pedestrian volume High
Crosswalks All legs marked with continental crosswalks
Bike infrastructure Westbound bike lane on Olney west of BroadBike lanes in both directions on Old York, a street merging with Broad at the intersection
SEPTA transit Broad-Street Line: Olney Transportation Center StopOlney Transportation Center: Bus Routes 6, 8, 18, 22, 26, 55, 80 and L
Significant engineering changes since 2009
• Pedestrian countdown signals installed.• Signals retimed to include a lead pedestrian interval
Major transportation issues • The station generates a large amount of pedestrian traffic. • Broad St. and Old York traffic merges south of the intersection.
High levels of pedestrian activity from transit services, pedestrian-oriented retails, the high schools, and the Einstein Medical Campus create a challenging traffic safety environment.
• Cyclists from Old York north onward must share roads with the cars on the very busy Broad.
HOTSPOTS ANAYSIS | 29
P
P
P
P
P
P
P
P
OLNEY AVE
5TH
ST
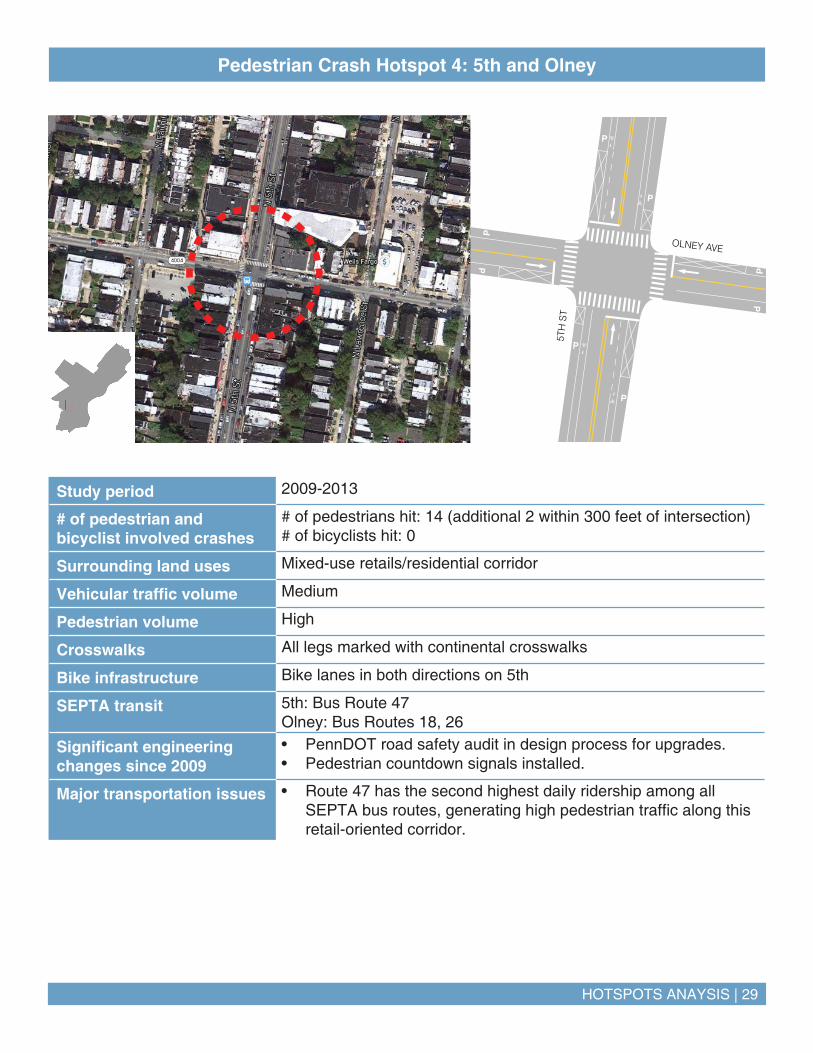
Pedestrian Crash Hotspot 4: 5th and Olney
Study period 2009-2013
# of pedestrian and bicyclist involved crashes
# of pedestrians hit: 14 (additional 2 within 300 feet of intersection)# of bicyclists hit: 0
Surrounding land uses Mixed-use retails/residential corridor
Vehicular traffic volume Medium
Pedestrian volume High
Crosswalks All legs marked with continental crosswalks
Bike infrastructure Bike lanes in both directions on 5th
SEPTA transit 5th: Bus Route 47Olney: Bus Routes 18, 26
Significant engineering changes since 2009
• PennDOT road safety audit in design process for upgrades.• Pedestrian countdown signals installed.
Major transportation issues • Route 47 has the second highest daily ridership among all SEPTA bus routes, generating high pedestrian traffic along this retail-oriented corridor.
30 | HOTSPOTS ANAYSIS
P
P
P
P
MARKET ST
34TH
ST
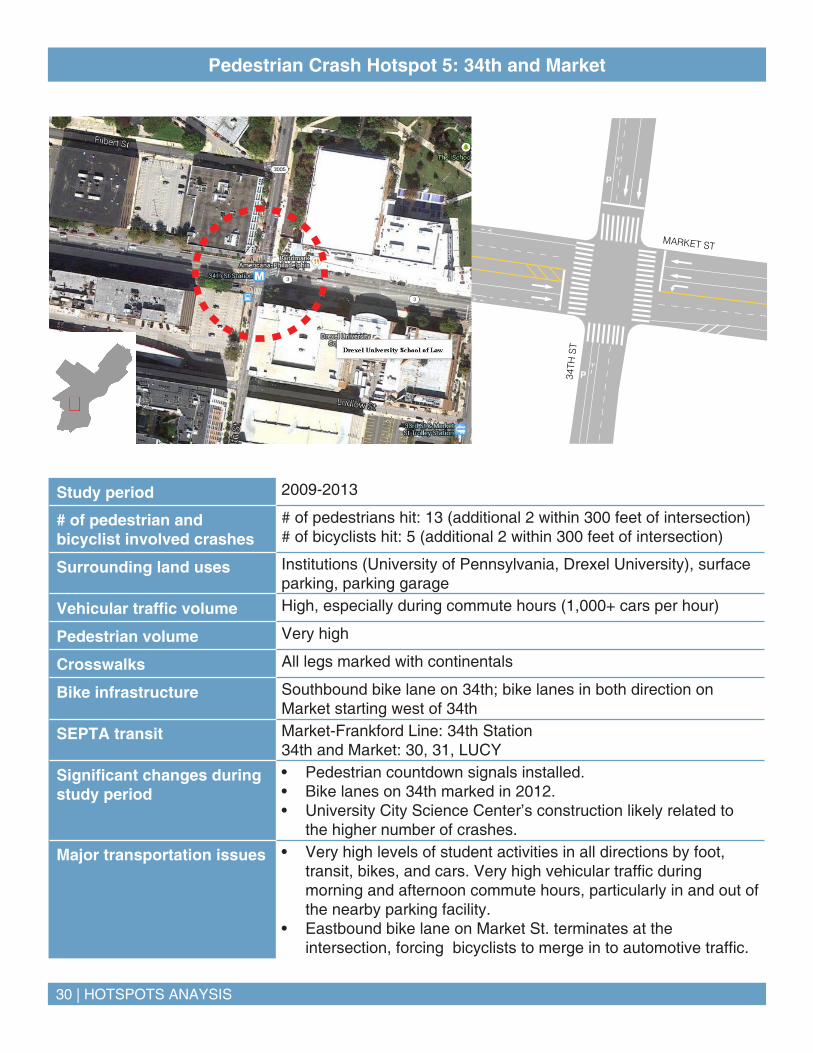
Pedestrian Crash Hotspot 5: 34th and Market
Study period 2009-2013
# of pedestrian and bicyclist involved crashes
# of pedestrians hit: 13 (additional 2 within 300 feet of intersection)# of bicyclists hit: 5 (additional 2 within 300 feet of intersection)
Surrounding land uses Institutions (University of Pennsylvania, Drexel University), surface parking, parking garage
Vehicular traffic volume High, especially during commute hours (1,000+ cars per hour)
Pedestrian volume Very high
Crosswalks All legs marked with continentals
Bike infrastructure Southbound bike lane on 34th; bike lanes in both direction on Market starting west of 34th
SEPTA transit Market-Frankford Line: 34th Station34th and Market: 30, 31, LUCY
Significant changes during study period
• Pedestrian countdown signals installed.• Bike lanes on 34th marked in 2012.• University City Science Center’s construction likely related to
the higher number of crashes.
Major transportation issues • Very high levels of student activities in all directions by foot, transit, bikes, and cars. Very high vehicular traffic during morning and afternoon commute hours, particularly in and out of the nearby parking facility.
• Eastbound bike lane on Market St. terminates at the intersection, forcing bicyclists to merge in to automotive traffic.

HOTSPOTS ANAYSIS | 31
P
P
P
P
WAYNE AVE
CHELTE
N AVE
Pedestrian Crash Hotspot 6: Chelten and Wayne
Study period 2009-2013
# of pedestrian and bicyclist involved crashes
# of pedestrians hit: 13 (additional 1 within 300 feet of intersection)# of bicyclists hit: 0
Surrounding land uses Institution (Mastery Charter School-Pickett Campus), commercial retails
Vehicular traffic volume Medium
Pedestrian volume High, especially before and after school hours
Crosswalks Marked with continentals but faded on Wayne; none on Chelten
Bike infrastructure Bike lanes on Chelten Ave
SEPTA transit Chelton: bus routes 26 and JWayne: bus routes 53 and K
Significant changes during study period
• Pedestrian countdown signals installed.
Major transportation issues • Surface parking lots and drive-through at the north and east corners introduce high in and out vehicular traffic and higher chance of a driver-pedestrian conflict at the entrance/exit or within the parking lot.
• Route 26 has 9th highest ridership among all SEPTA buses, potentially creating a high pedestrian volume.
• Bike lane markings are faded.
Top Related