


Languages
Pages
Legal

Patterns of morbidity and mortality among older
persons in South Africa, 2013
Statistics South Africa
Pali Lehohla Statistician-GeneralReport No. 03-09-11 (2013)
Statistics South Africa ii
Patterns of morbidity and mortality among older persons in South Africa, 2013
Patterns of morbidity and mortality among older persons in South Africa, 2013/Statistics South Africa Published by Statistics South Africa, Private Bag X44, Pretoria 0001 © Statistics South Africa, 2015 Users may apply or process this data, provided Statistics South Africa (Stats SA) is acknowledged as the original source of the data; that it is specified that the application and/or analysis is the result of the user's independent processing of the data; and that neither the basic data nor any reprocessed version or application thereof may be sold or offered for sale in any form whatsoever without prior permission from Stats SA. Stats SA Library Cataloguing-in-Publication (CIP) Data Patterns of morbidity and mortality among older persons in South Africa, 2013/Statistics South Africa. Pretoria: Statistics South Africa, 2013 03-09-11 83pp Report No. 03-09-11 (2013) ISBN 978-0-621-43218-3 A complete set of Stats SA publications is available at Stats SA Library and the following libraries:
National Library of South Africa, Pretoria Division National Library of South Africa, Cape Town Division Library of Parliament, Cape Town Bloemfontein Public Library Natal Society Library, Pietermaritzburg Johannesburg Public Library Eastern Cape Library Services, King William’s Town Central Regional Library, Polokwane Central Reference Library, Nelspruit Central Reference Collection, Kimberley Central Reference Library, Mmabatho
This report is available on the Stats SA website: www.statssa.gov.za Copies are obtainable from: Printing and Distribution, Statistics South Africa Enquiries Tel: 012 310 8093 012 3108619 012 310 8908 (technical) Email: [email protected] [email protected] [email protected] (technical)
Statistics South Africa iii
Patterns of morbidity and mortality among older persons in South Africa, 2013
Preface
This report is part of a regular series of thematic health reports produced by Statistics South Africa. It outlines the patterns of morbidity and mortality among older persons (60 years and above) in South Africa using data from the 2013 General Household Survey and the 2013 Mortality and causes of death from the South African civil registration system.
The report provides information on the general health status of older persons, focussing on perceived health status; medical aid coverage; self-reported illnesses suffered a month prior to the survey; and consultations with health workers. The report further outlines information chronic illnesses and use of medication. Information on mortality is also included in the report and highlights the leading causes of death among older persons, and causes of death due to communicable and non-communicable diseases.
It is anticipated that this report will contribute to the provision of relevant health information that can assist programme managers dealing with older persons in South Africa in improving their health status and quality of life in general.
PJ Lehohla Statistician-General
Statistics South Africa iv
Patterns of morbidity and mortality among older persons in South Africa, 2013
Contents
Preface.. ..................................................................................................................................................................... iii
Contents. ..................................................................................................................................................................... iv
List of figures ............................................................................................................................................................................... vi List of abbreviations and acronyms .......................................................................................................................... viii
1. Introduction .......................................................................................................................................................................... 1 1.1 Background.......................................................................................................................................................... 1
1.2 Objectives of this report ....................................................................................................................................... 2
1.3 Organisation and presentation of this report ......................................................................................................... 3
2. Data and methods ................................................................................................................................................................ 4 2.1 Data sources........................................................................................................................................................ 4
2.2 Data analysis ....................................................................................................................................................... 5
3. Distribution and characteristics of older persons ............................................................................................ 6
3.1 Introduction .......................................................................................................................................................... 6
3.2 Distribution of older persons ................................................................................................................................. 6
3.2.1 Age and sex distribution ....................................................................................................................................... 6
3.2.2 Population group .................................................................................................................................................. 7
3.2.3 Province of usual residence ................................................................................................................................. 8
3.3 Characteristics of older persons ........................................................................................................................... 9
3.3.1 Marital status ....................................................................................................................................................... 9
3.3.2 Relationship to the head of the household .......................................................................................................... 10
3.3.3 Living arrangements of skip-generation children ................................................................................................. 10
3.3.4 Education .......................................................................................................................................................... 12
3.3.5 Employment ....................................................................................................................................................... 12
3.3.6 Grants ............................................................................................................................................................... 13
3.4 Summary ........................................................................................................................................................... 13
4. Perceived health status and healthcare-seeking practices ............................................................................ 14
4.1 Introduction ........................................................................................................................................................ 14
4.2 Perceived health status ...................................................................................................................................... 14
4.3 Healthcare-seeking practices ............................................................................................................................. 17
4.3.1 Medical aid coverage ......................................................................................................................................... 17
4.3.2 Consultations with health workers ...................................................................................................................... 18
4.3.3 Characteristics of those who consulted health workers when ill .......................................................................... 18
4.3.4 Reasons for not consulting health workers ......................................................................................................... 19
4.4 Summary ........................................................................................................................................................... 20
5. Recent self-reported illnesses ......................................................................................................................... 21
5.1 Introduction ........................................................................................................................................................ 21
5.2 Self-reported illnesses ....................................................................................................................................... 21
5.2.1 Flu or acute respiratory tract infection ................................................................................................................ 23
5.2.2 High blood pressure ........................................................................................................................................... 24
Statistics South Africa v
Patterns of morbidity and mortality among older persons in South Africa, 2013
5.2.3 Diabetes ............................................................................................................................................................ 25
5.3 Summary ........................................................................................................................................................... 25
6. Chronic conditions and use of medication ..................................................................................................... 26
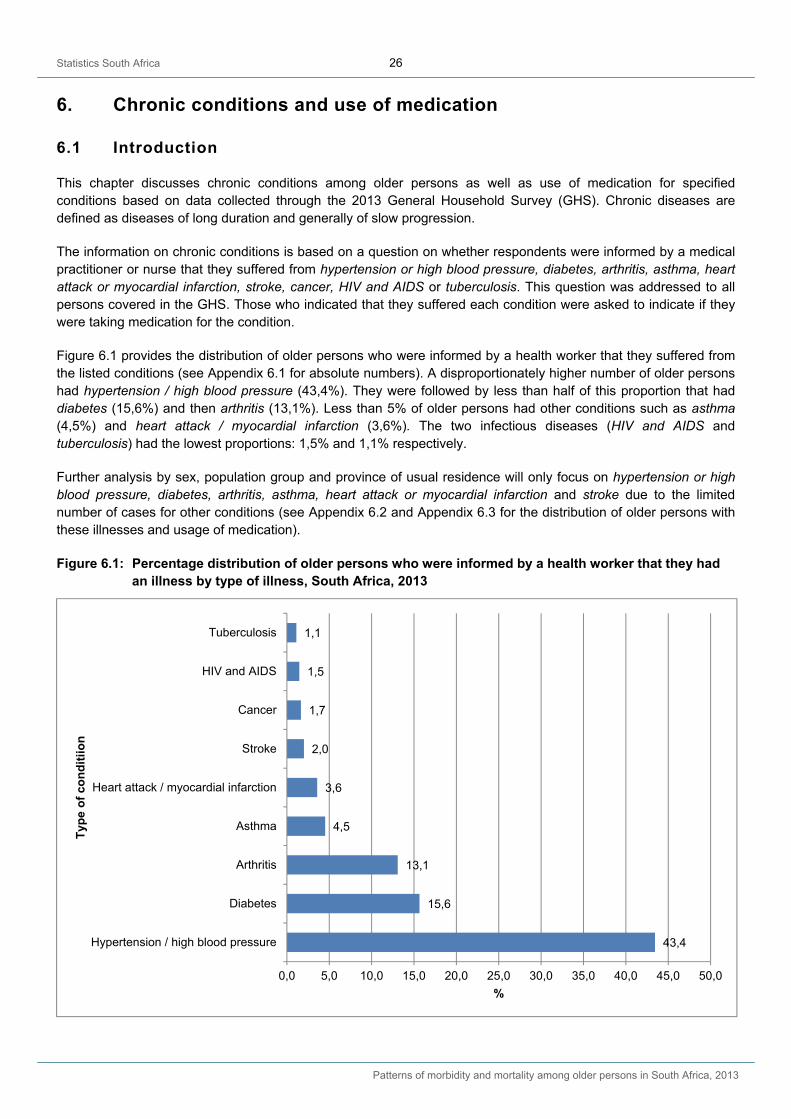
6.1 Introduction ........................................................................................................................................................ 26
6.2 Hypertension / high blood pressure .................................................................................................................... 27
6.3 Diabetes ............................................................................................................................................................ 28
6.4 Arthritis .............................................................................................................................................................. 29
6.5 Asthma .............................................................................................................................................................. 30
6.6 Heart attack / myocardial infarction .................................................................................................................... 32
6.7 Stroke ................................................................................................................................................................ 33
6.8 Summary ........................................................................................................................................................... 35
7. Disability and use of assistive devices ........................................................................................................... 36
7.1 Introduction ........................................................................................................................................................ 36
7.2 Overall patterns ................................................................................................................................................. 36
7.3 Seeing ............................................................................................................................................................... 37
7.4 Hearing .............................................................................................................................................................. 39
7.5 Walking .............................................................................................................................................................. 41
7.6 Remembering .................................................................................................................................................... 43
7.7 Other disabilities ................................................................................................................................................ 45
7.8 Summary ........................................................................................................................................................... 45
8. Mortality and causes of death ......................................................................................................................... 46
8.1 Introduction ........................................................................................................................................................ 46
8.2 Mortality ............................................................................................................................................................. 46
8.2.1 Trends in number of deaths ................................................................................................................................ 46
8.2.2 Contribution of older persons’ deaths to overall mortality .................................................................................... 47
8.3 Causes of death ................................................................................................................................................. 49
8.3.1 Natural and non-natural causes .......................................................................................................................... 49
8.3.2 Communicable and non-communicable diseases ................................................................................................ 50
8.3.3 The ten leading causes of death ......................................................................................................................... 51
8.4 Summary ........................................................................................................................................................... 55
9. Summary and concluding remarks .................................................................................................................. 56
10. References ....................................................................................................................................................... 58
11. Appendices ...................................................................................................................................................... 59
Statistics South Africa vi
Patterns of morbidity and mortality among older persons in South Africa, 2013
List of figures
Figure 3.1: Percentage distribution of older persons by age group and sex, South Africa, 2013 .............................. 6
Figure 3.2: Percentage distribution of older persons by age and population group, South Africa, 2013 ................... 7
Figure 3.3: Percentage distribution of older persons by age group and province of usual residence, South Africa, 2013 .............................................................................................................................................. 8
Figure 3.4: Percentage distribution of older persons by age group and marital status, South Africa, 2013 .............. 9
Figure 3.5: Percentage distribution of older persons by age group and relationship to the head of the household, South Africa, 2013 ............................................................................................................... 10
Figure 3.6: Percentage distribution of grandchildren by living arrangements with grandparents, South Africa, 2013 ....................................................................................................................................................... 10
Figure 3.7: Percentage distribution by educational level of grandchildren less than five years, South Africa, 2013 ....................................................................................................................................................... 11
Figure 3.8: Percentage distribution of grandchildren five years and above who were attending educational institution, South Africa, 2013 ................................................................................................................ 11
Figure 3.9: Percentage distribution of older persons by age group and level of education, South Africa, 2013* .... 12
Figure 3.10: Percentage distribution of older persons by age group and level of employment, South Africa, 2013 ....................................................................................................................................................... 12
Figure 3.11: Percentage distribution of older persons by age group and receipt of social grants, South Africa, 2013 ....................................................................................................................................................... 13
Figure 4.1: Percentage distribution of older persons by perceived health status and sex, South Africa, 2013* ..... 14
Figure 4.2: Percentage distribution of older persons by perceived health status and population group, South Africa, 2013* ........................................................................................................................................... 15
Figure 4.3: Percentage distribution of older persons by perceived health status and province of usual residence, South Africa, 2013* ............................................................................................................... 16
Figure 4.4: Percentage distribution of older persons by medical aid coverage and province of usual residence, South Africa, 2013 ................................................................................................................ 17
Figure 4.5: Percentage distribution of older persons who consulted health workers by population group and province of usual residence, South Africa, 2013 .................................................................................... 18
Figure 4.6: Percentage distribution of older persons by reasons given for not consulting a health worker when ill a month before the survey, South Africa, 2013 .................................................................................. 19
Figure 4.7: Percentage distribution of older persons by reasons given for not consulting a health worker when ill a month before the survey classified by sex, South Africa, 2013* ..................................................... 20
Figure 5.1: Percentage distribution of older persons by who reported being ill a month before the survey by sex, population group and province of usual residence, South Africa, 2013 ......................................... 21
Figure 5.2: Percentage distribution of older persons by type of illness suffered a month before the survey, South Africa, 2013 .................................................................................................................................. 22
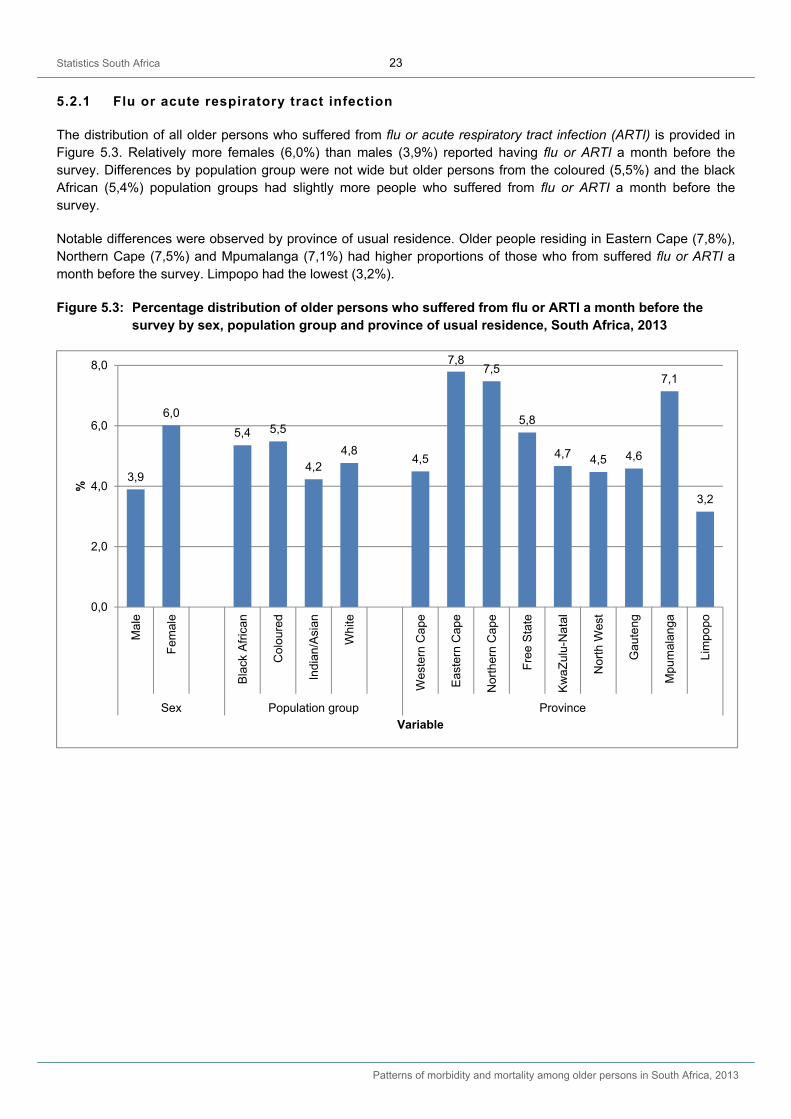
Figure 5.3: Percentage distribution of older persons who suffered from flu or ARTI a month before the survey by sex, population group and province of usual residence, South Africa, 2013 .................................... 23
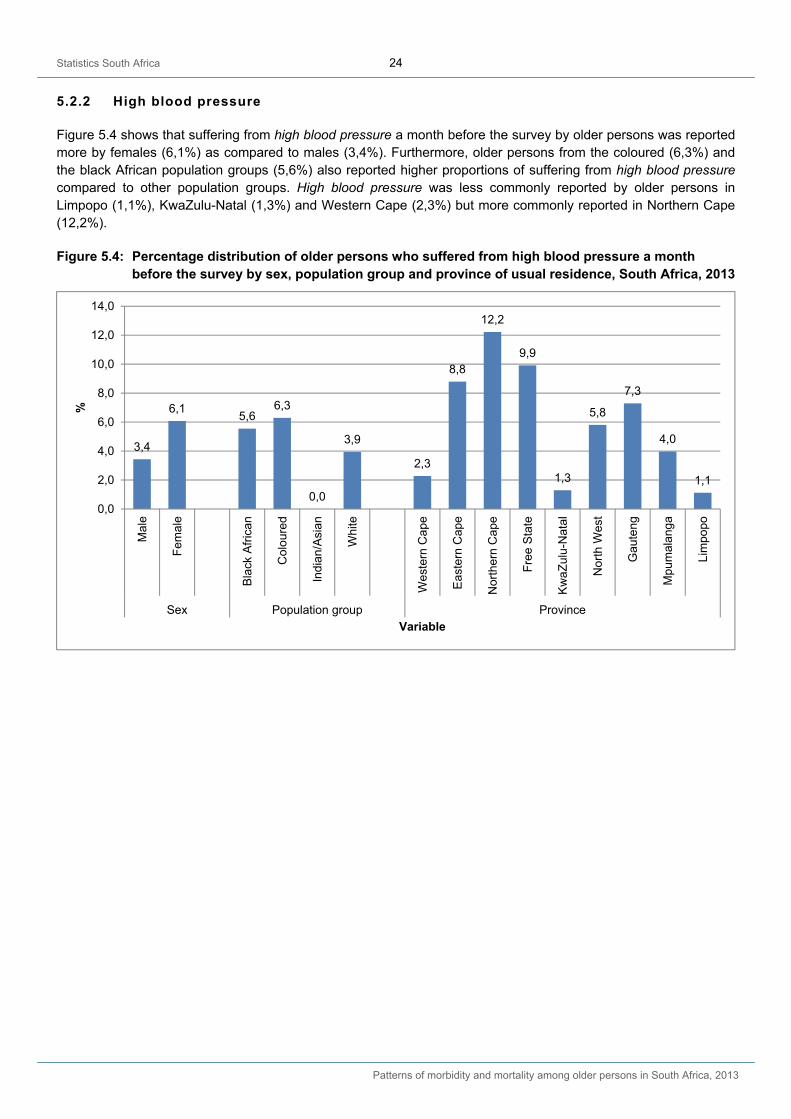
Figure 5.4: Percentage distribution of older persons who suffered from high blood pressure a month before the survey by sex, population group and province of usual residence, South Africa, 2013 .................. 24
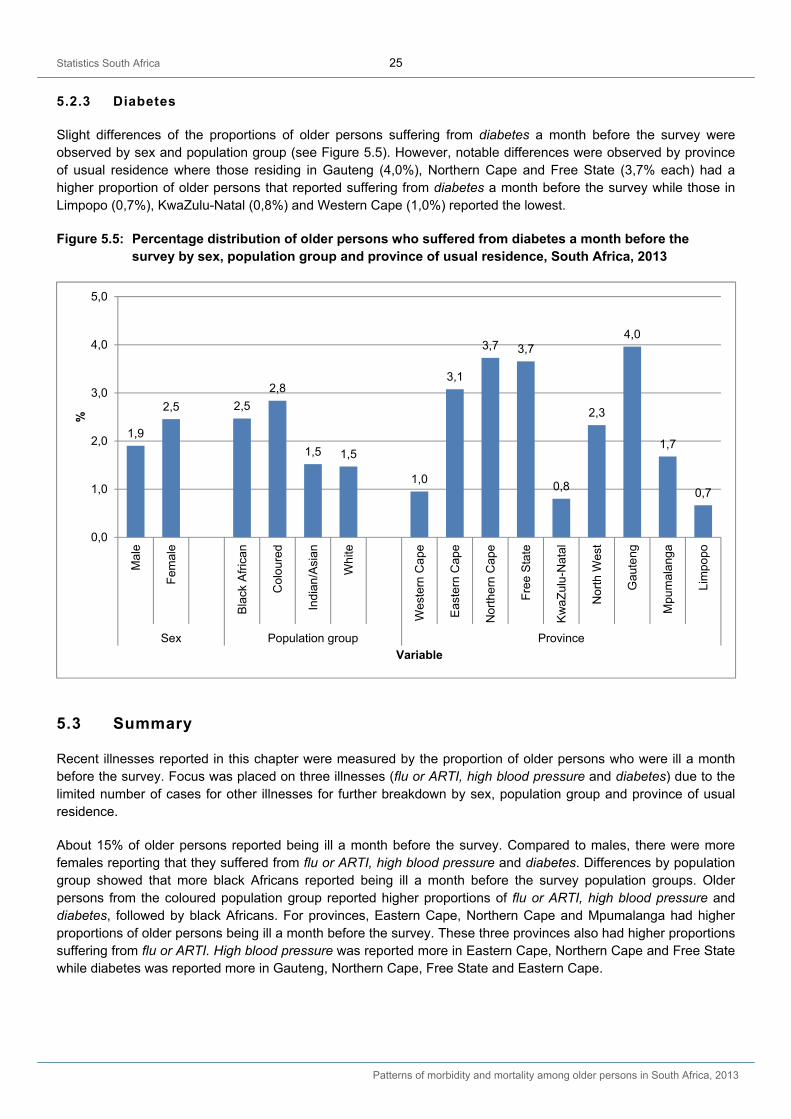
Figure 5.5: Percentage distribution of older persons who suffered from diabetes a month before the survey by sex, population group and province of usual residence, South Africa, 2013 .................................... 25
Figure 6.1: Percentage distribution of older persons who were informed by a health worker that they had an illness by type of illness, South Africa, 2013 .......................................................................................... 26
Figure 6.2: Percentage distribution of older persons who had hypertension or high blood pressure by sex, population group and province of usual residence, South Africa, 2013 ................................................. 27
Figure 6.3: Percentage distribution of older persons who had diabetes by sex, population group and province of usual residence, South Africa, 2013 .................................................................................................. 28
Statistics South Africa vii
Patterns of morbidity and mortality among older persons in South Africa, 2013
Figure 6.4: Percentage distribution of older persons who had arthritis by sex, population group and province of usual residence, South Africa, 2013 .................................................................................................. 29
Figure 6.5: Percentage distribution of older persons with arthritis who were taking medication for the condition by sex, population group and province of usual residence, South Africa, 2013 ..................... 30
Figure 6.6: Percentage distribution of older persons who had asthma by sex, population group and province of usual residence, South Africa, 2013 .................................................................................................. 31
Figure 6.7: Percentage distribution of older persons with asthma who were taking medication for the condition by sex, population group and province of usual residence, South Africa, 2013 ..................... 31
Figure 6.8: Percentage distribution of older persons who had heart attack or myocardial infarction by sex, population group and province of usual residence, South Africa, 2013 ................................................. 32
Figure 6.9: Percentage distribution of older persons with heart attack or myocardial infarction who were taking medication for the condition by sex, population group and province of usual residence, South Africa, 2013 .................................................................................................................................. 33
Figure 6.10: Percentage distribution of older persons who had stroke by sex, population group and province of usual residence, South Africa, 2013 ...................................................................................................... 34
Figure 6.11: Percentage distribution of older persons with stroke who were taking medication for the condition by sex, population group and province of usual residence, South Africa, 2013 .................................... 34
Figure 7.1: Percentage distribution of older persons by type and level of disability, South Africa, 2013* ............... 37
Figure 7.2: Percentage distribution of older persons by level of difficulty in seeing classified by sex, population group and province of usual residence, South Africa, 2013* ............................................... 38
Figure 7.3: Percentage distribution of older persons using eye glasses/spectacles/contact lenses by sex, population group and province of usual residence, South Africa, 2013* ............................................... 39
Figure 7.4: Percentage distribution of older persons by level of difficulty in hearing classified by sex, population group and province of usual residence, South Africa, 2013* ............................................... 40
Figure 7.5: Percentage distribution of older persons by level of difficulty in walking classified by sex, population group and province of usual residence, South Africa, 2013* ............................................... 42
Figure 7.6: Percentage distribution of older persons using a walking stick/walking frame by sex, population group and province of usual residence of usual residence, South Africa, 2013* .................................. 43
Figure 7.7: Percentage distribution of older persons by level of difficulty in remembering classified by sex, population group and province of usual residence, South Africa, 2013* ............................................... 44
Figure 8.1: Number of deaths among older persons by sex and year of death, South Africa, 1997–2013 ............. 46
Figure 8.2: Percentage distribution of deaths by age and year of death, South Africa, 1997–2013 ........................ 47
Figure 8.3: Percentage distribution of deaths by age classified by sex, population group and province of usual residence of deceased, South Africa, 2013 .................................................................................. 48
Figure 8.4: Percentage distribution of deaths by type of death classified by sex, population group and province of usual residence of deceased, South Africa, 2013* ............................................................. 49
Figure 8.5: Percentage distribution of deaths due to communicable and non-communicable diseases classified by sex, population group and province of usual residence of deceased, South Africa, 2013* ...................................................................................................................................................... 50
Table of contents Table 8.1: Distribution of the ten leading causes of death among older persons, South Africa, 2013 ................... 51
Table 8.2: Distribution of the ten leading causes of death among older persons by sex, South Africa, 2013* ...... 52
Table 8.3: Distribution of the ten leading causes of death among older persons by population group, South Africa, 2013 ............................................................................................................................................ 53
Table 8.4: Distribution of the ten leading causes of death among older persons by province of usual residence, South Africa, 2013 ................................................................................................................ 54
Statistics South Africa viii
Patterns of morbidity and mortality among older persons in South Africa, 2013
List of abbreviations and acronyms
AIDS Acquired Immunodeficiency Syndrome
ARTI Acute Respiratory Tract Infections
CMS Council for Medical Schemes
CRD Chronic Respiratory Disease
CVD Cardiovascular Disease
GHS General Household Survey
HBP High Blood Pressure
HIV Human Immunodeficiency Virus
MDGs Millennium Development Goals
MVAs Motor Vehicle Accidents
SAS Statistical Analysis Software
Stats SA Statistics South Africa
STDs Sexually Transmitted Diseases
TB Tuberculosis
WHO World Health Organization
Statistics South Africa 1
Patterns of morbidity and mortality among older persons in South Africa, 2013
1. Introduction
1.1 Background
Statistics South Africa (Stats SA) has a mandate to provide statistical information in South Africa and conducts household surveys, population censuses and use of administrative records to achieve this. With the establishment of a Health Statistics component within the organisation, Stats SA also provides information on health statistics in the country. While there is currently no dedicated survey on health issues conducted by Stats SA, the organisation is able to collect some information through other surveys such as the General Household Survey (GHS) and the Living Conditions Survey (LCS), as well as through the use of data on deaths from the South African civil registration system that is processed at Stats SA.
On an annual basis, a theme is selected to produce a thematic health report, based on available data at Stats SA. This report focuses on the health of older persons in South Africa, highlighting their morbidity and mortality patterns based on recent information obtained from the 2013 GHS and the 2013 Mortality and causes of death data. It follows up on two key publications with detailed information on older persons published by Stats SA in 2013: (i) Social profile of South Africa, 2002–2012 (Report 03-19-00) and (ii) Census 2011: Profile of older persons in South Africa (Report No. 03-01-60). Both reports used the age range of 60 years and older to define ‘older persons’ and the same age range is used in this report. This is also in line with the recommendation made by the World Health Organization (2009).
Globally, the number of older people is expected to rise above the number of children by 2045 (Joubert & Bradshaw 2006). There are 50 million people who are 60 years and above, accounting for 5% in sub-Saharan Africa. South Africa is one of the most rapidly ageing countries in Africa and the population is projected to continue ageing over the next two decades despite the impact of the AIDS epidemic (Joubert & Bradshaw 2006). The 2011 South African population census showed that the number of older persons in the country increased from 2,8 million in 1996 to 4,1 million in 2011 (7,1% in 1996 to 8,0% in 2011). According to the revised 2013 mid-year population estimates, the total population of South Africa was 53 157 490 and older persons accounted for 4 394 295 people, representing 8,3% of the total population in South Africa (Statistics South Africa, 2013). The number of older persons is expected to continue to increase and it is estimated that there will be approximately 7 million older persons in South Africa by 2030 (Statistics South Africa, 2013).
This increase in numbers and proportions of older persons has implications for the planning of social and health services in South Africa (Joubert & Bradshaw 2006). Chronic and degenerative diseases represent a major cause of morbidity and mortality among older people in both developed and developing countries (Medical Research Council, 2005). Developing countries are at different stages of the epidemiological transition, which is the change in causes of death from infectious diseases to chronic diseases (Medical Research Council, 2005). In Africa, deaths from non-communicable diseases are expected to rise above deaths due to nutritional diseases, maternal and prenatal diseases combined (International Longevity Centre, 2011). There is a scarcity of information about the health status and causes of mortality in the older population, as well as use and satisfaction of health services by older persons (Joubert & Bradshaw 2006).
For the period 2010–2014, the Government of South Africa agreed on 12 key outcomes as the key indicators for its programme of action. This included a vision of “A long and healthy life for all South Africans”. (Department of Health, 2011). In addition, the Department of Health identified four outputs against which to be measured and these included increasing life expectancy and combating HIV and AIDS, and tuberculosis. Information in this report will play an important role in assisting the Government of South Africa when establishing progress made towards achieving its vision of “A long and healthy life for all South Africans”, with a specific focus on the needs of older persons.
Statistics South Africa 2
Patterns of morbidity and mortality among older persons in South Africa, 2013
For many decades, older persons remained a vulnerable group in many societies. International and country commitments were made to create age-friendly societies that attend to the health and socio-economic needs of older persons. The commitments are reflected in the recent spell of international guidelines and country-specific older person legislations and policies. The Madrid Plan calls for the recognition of the contribution of older persons and the promotion of their rights, and emphasises the role of government in providing and ensuring access to basic social services (United Nations, 2002).
The rights of older persons are enshrined in the Universal Declaration of Human Rights. According to section 25 of the Declaration, “everyone has the right to a standard of living adequate for the health and well-being of himself and of his family, including food, clothing, housing and medical care and necessary social services, and the right to security in the event of unemployment, sickness, disability, widowhood, old age or other lack of livelihood in circumstances beyond his control” (United Nations, 1948).
The South African older person legislations and policies reflect key guidelines embedded in the Madrid Plan. The commitment from the government to develop the lives of the older persons is reflected in the establishment of relevant structures and bodies. The South African Older Persons Policy adopted in 2006 (Act No. 13 of 2006) provides a framework for providing for the needs of older persons. These include the establishment of the Directorate of Care and Services within the Department of Social Development. The government recognises that older persons are indeed a vulnerable group, due to their health and socio-economic circumstances. The vulnerability of older persons in South Africa is largely determined by pre-1994 policies and inequalities.
The Constitution of the Republic of South Africa, 1996 (Act No. 108 of 1996) declares that every South African (including older persons) has the right to dignity and to have that dignity respected and protected (Republic of South Africa, 1996). The Older Persons Act, 2006 (Act No. 13 of 2006) makes provision for fulfilling these rights by alleviating the difficulty or plight of older persons in South Africa through setting up a framework for their empowerment and protection. The Older Persons Act promotes and maintains the rights, status, wellbeing, and safety and security of older persons through maintenance and promotion of the status, wellbeing, safety and security of older persons, protection of their rights, helping them stay in their homes in the community for as long as possible, regulate services and residential facilities for older persons, and to combat abuse of older persons.
The Older Persons Act, 2006 stipulates that older persons require social security in the form of an old-age pension as a support mechanism. It has been noted that old-age pensions play a crucial role in supplementing household income and in some instances it is the only source of income for some households (Statistics South Africa, 2012). The National Development Plan 2030 emphasises the importance of the social security systems in an attempt to redress the high levels of poverty and inequality experienced in South Africa (Statistics South Africa, 2011).
1.2 Objectives of this report
The main purpose of this report is to provide detailed information on the morbidity and mortality profile of older persons in South Africa. The report draws on secondary data from the GHS and the Mortality and causes of death data to provide detailed information on the health status of this special group.
This report is part of an annual regular series of thematic health reports produced by Statistics South Africa and the objectives of this report are as follows:
To provide information on coverage of medical aid among older persons, their health and disability status and self-reported illnesses;
To present patterns on chronic conditions among older persons and the use of medication; and
To highlight patterns of mortality among older persons focussing on the underlying causes of death.
It is envisaged that this report will be used to inform planning initiatives that are aimed at the improvement of the geriatric services within the health sector in South Africa. Furthermore, information from this report can be used to identify challenges faced by older persons in their health needs.
Statistics South Africa 3
Patterns of morbidity and mortality among older persons in South Africa, 2013
1.3 Organisation and presentation of this report
This report is divided into nine chapters: Chapter 1 provides an introduction to the report. The second chapter outlines the sources of data and methods used to analyse the data. Background characteristics and distribution of older persons are presented in Chapter 3. The fourth chapter covers information on perceived health status and healthcare-seeking behaviour focussing on medical aid coverage and consultations with health workers. The fifth chapter presents information on recent self-reported illnesses. Chronic conditions and use of medication are discussed in Chapter 6 while issues on disability and use of assistive devices are in Chapter 7. Patterns of mortality and causes of death are provided in Chapter 8. The last chapter, Chapter 9, presents the summary and concluding remarks.
Statistics South Africa 4
Patterns of morbidity and mortality among older persons in South Africa, 2013
2. Data and methods
This chapter presents information on sources of data as well as the methodology applied in analysing data from the General Household Survey (GHS) and Mortality and causes of death from the South African civil registration system.
2.1 Data sources
This thematic health report uses data acquired from the General Household Survey (GHS) conducted by Statistics South Africa (Stats SA) between January and December 2013 and the Mortality and causes of death data from the South Africa civil registration system for deaths that occurred between January and December 2013 and were registered at the Department of Home Affairs.
2.1.1 General Household Survey data
The GHS is an annual survey conducted by Stats SA with the aim of determining the level of development in the country and for measuring the performance of programmes and projects implemented by the government (Stats SA, 2012). The primary purpose of the GHS is to measure service delivery, demand for services as well as the improvement in the living conditions of individuals and households.
The 2013 GHS used a multistage, stratified random sampling method. A total of 25 786 households (including multiple households) were successfully interviewed through face-to-face interviews. The survey collected information at household and individual levels. At household level, the head of the household was required to answer questions on behalf of members of the household, but if he or she was not available, any responsible adult found at the household could answer. At individual the level, the head of the household only answered questions for himself or herself and for persons under the age of 15 years. Persons aged 15 years and above answered survey questions for themselves if they were present at the time of the survey, otherwise the head of the household answered on their behalf.
The GHS collects data on six broad areas, namely: education, health and social development, housing, household access to services and facilities, food security, and agriculture. Health variables collected through this survey include: medical aid coverage, injuries, self-reported diseases suffered in the month prior to the survey; chronic diseases as diagnosed by a health worker; use of medication for chronic illnesses; and their disability status.
Information on self-reported diseases collected through this survey includes the following: flu or acute respiratory tract infections, diabetes, high blood pressure, diarrhoea, tuberculosis or severe cough with blood, sexually transmitted diseases, pneumonia, bronchitis, meningitis and sinusitis. Information on chronic diseases and the use of medication is also collected and includes: asthma, diabetes, cancer, hypertension, stroke, heart attack/myocardial infarction, arthritis, depression, epilepsy and osteoporosis.
Statistics South Africa 5
Patterns of morbidity and mortality among older persons in South Africa, 2013
2.1.2 Mortality and causes of death data
The information on mortality and causes of death is drawn from death notification forms for the civil registration system maintained by the Department of Home Affairs (DHA). The information is based on all deaths that occurred in 2013, were registered at the DHA, and the forms were received by Stats SA for processing in 2014.
Stats SA collects all completed death notification forms from the DHA head office for data processing. There are different stages in the processing of data. The forms are first sorted by year of death and labels with unique identifiers pasted on each form. The information on the form is then coded as well as the causes of death using the International Classification of Diseases, tenth revision (ICD-10) (World Health Organization, 2009). Thereafter, the data is captured and the derivation of the underlying cause of death is undertaken.
Information on causes of death in this report are based on the ICD-10 diagnostic tool for coding diseases, signs, symptoms and other factors causing morbidity and mortality (World Health Organization, 2009). The tool was developed by WHO to promote international comparability in collection, processing, classification and presentation of mortality statistics. The ICD-10 has been adopted by all member states of the United Nations (UN) as the standard classification system. The tool enables countries to monitor and evaluate the prevalence of health problems and compare and share information in a consistent manner. The International Classification of Diseases (ICD) is revised from time to time to incorporate changes in medical knowledge and currently the tenth revision is under review.
2.2 Data analysis
Data from the GHS and the Mortality and causes of death were analysed using SAS Enterprise Guide version 4.3. Descriptive analyses (frequency distributions and cross-tabulations) were applied to both data sets, focusing on age, sex, population group and province of usual residence. Results are presented in tables and graphs showing percentage distributions.
Statistics South Africa 6
Patterns of morbidity and mortality among older persons in South Africa, 2013
3. Distribution and characteristics of older persons
3.1 Introduction
This chapter provides information on the distribution of older persons in South Africa by age, sex, population group and province of usual residence, as well as their characteristics focussing on their marital status, education and relationship to the head of the household.
The information in this chapter is based on data from the 2013 General Household Survey (GHS), from which the total population of South Africa was estimated as 52 981 991 in 2013. Of these, 4 146 911 were older persons [1 601 114 males (38,6%) and 2 545 797 (61,4%) females].
3.2 Distribution of older persons
This subsection provides the distribution of older persons in the country in comparison to all other ages. For the analyses undertaken in this subsection, the denominator used is the total population for each category. Absolute numbers from which the percentage distributions were calculated are provided in Appendix 3.1.
3.2.1 Age and sex distribution
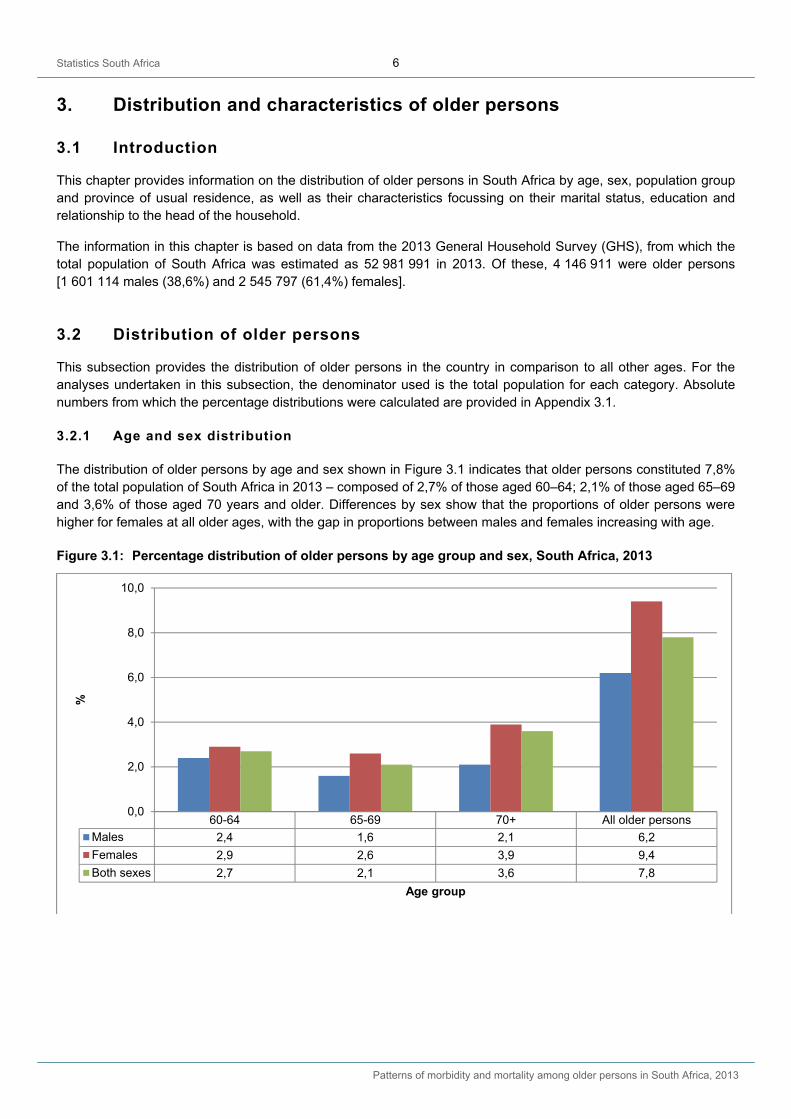
The distribution of older persons by age and sex shown in Figure 3.1 indicates that older persons constituted 7,8% of the total population of South Africa in 2013 – composed of 2,7% of those aged 60–64; 2,1% of those aged 65–69 and 3,6% of those aged 70 years and older. Differences by sex show that the proportions of older persons were higher for females at all older ages, with the gap in proportions between males and females increasing with age.
Figure 3.1: Percentage distribution of older persons by age group and sex, South Africa, 2013
60-64 65-69 70+ All older persons
Males 2,4 1,6 2,1 6,2
Females 2,9 2,6 3,9 9,4
Both sexes 2,7 2,1 3,6 7,8
0,0
2,0
4,0
6,0
8,0
10,0
%
Age group
Statistics South Africa 7
Patterns of morbidity and mortality among older persons in South Africa, 2013
3.2.2 Population group
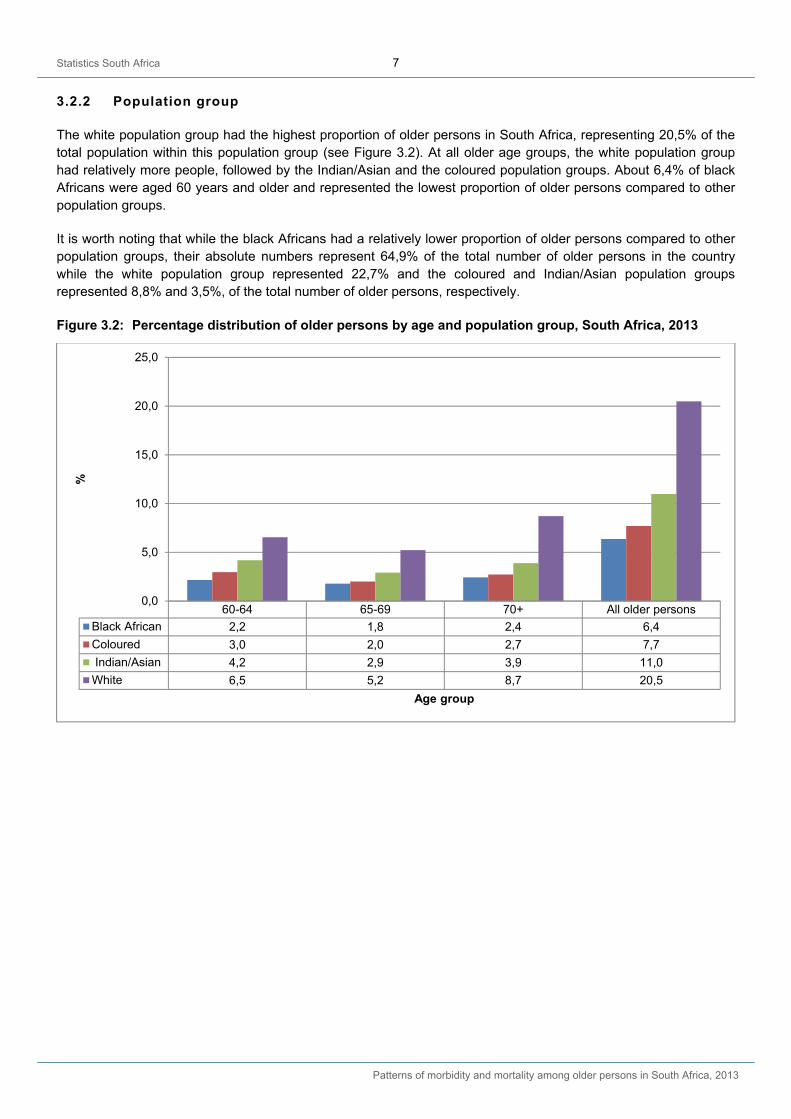
The white population group had the highest proportion of older persons in South Africa, representing 20,5% of the total population within this population group (see Figure 3.2). At all older age groups, the white population group had relatively more people, followed by the Indian/Asian and the coloured population groups. About 6,4% of black Africans were aged 60 years and older and represented the lowest proportion of older persons compared to other population groups.
It is worth noting that while the black Africans had a relatively lower proportion of older persons compared to other population groups, their absolute numbers represent 64,9% of the total number of older persons in the country while the white population group represented 22,7% and the coloured and Indian/Asian population groups represented 8,8% and 3,5%, of the total number of older persons, respectively.
Figure 3.2: Percentage distribution of older persons by age and population group, South Africa, 2013
60-64 65-69 70+ All older persons
Black African 2,2 1,8 2,4 6,4
Coloured 3,0 2,0 2,7 7,7
Indian/Asian 4,2 2,9 3,9 11,0
White 6,5 5,2 8,7 20,5
0,0
5,0
10,0
15,0
20,0
25,0
%
Age group
Statistics South Africa 8
Patterns of morbidity and mortality among older persons in South Africa, 2013
3.2.3 Province of usual residence
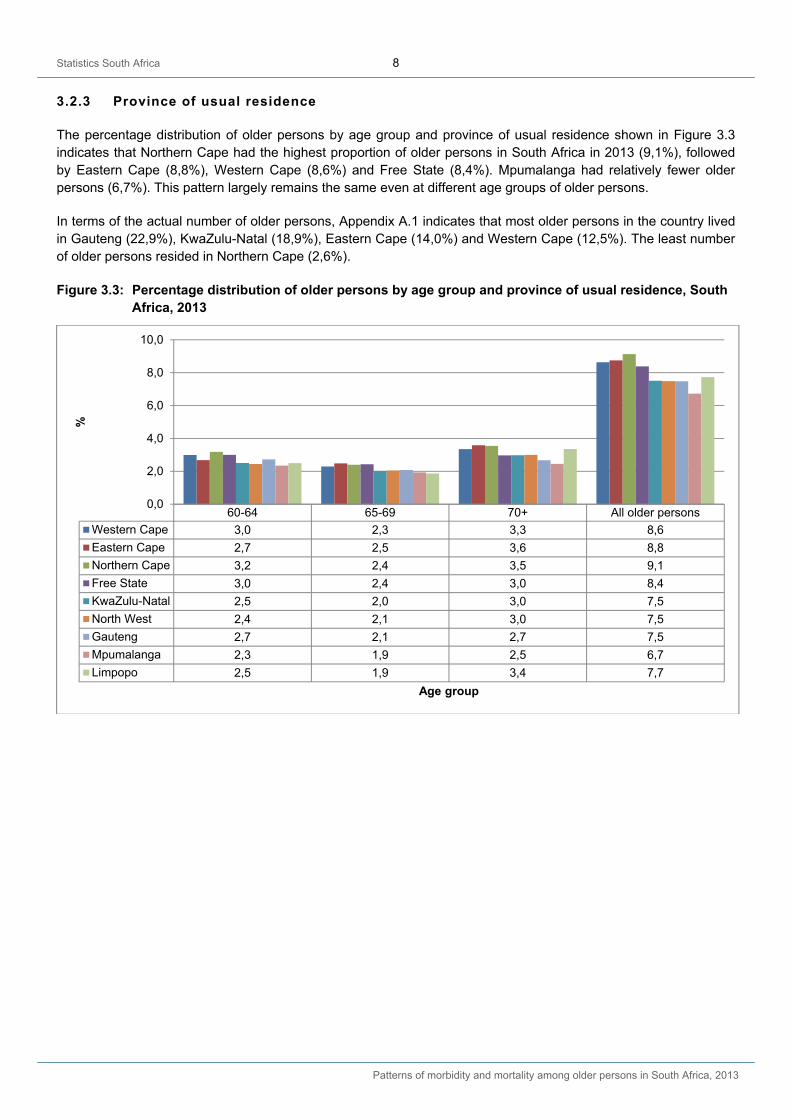
The percentage distribution of older persons by age group and province of usual residence shown in Figure 3.3 indicates that Northern Cape had the highest proportion of older persons in South Africa in 2013 (9,1%), followed by Eastern Cape (8,8%), Western Cape (8,6%) and Free State (8,4%). Mpumalanga had relatively fewer older persons (6,7%). This pattern largely remains the same even at different age groups of older persons.
In terms of the actual number of older persons, Appendix A.1 indicates that most older persons in the country lived in Gauteng (22,9%), KwaZulu-Natal (18,9%), Eastern Cape (14,0%) and Western Cape (12,5%). The least number of older persons resided in Northern Cape (2,6%).
Figure 3.3: Percentage distribution of older persons by age group and province of usual residence, South Africa, 2013
60-64 65-69 70+ All older persons
Western Cape 3,0 2,3 3,3 8,6
Eastern Cape 2,7 2,5 3,6 8,8
Northern Cape 3,2 2,4 3,5 9,1
Free State 3,0 2,4 3,0 8,4
KwaZulu-Natal 2,5 2,0 3,0 7,5
North West 2,4 2,1 3,0 7,5
Gauteng 2,7 2,1 2,7 7,5
Mpumalanga 2,3 1,9 2,5 6,7
Limpopo 2,5 1,9 3,4 7,7
0,0
2,0
4,0
6,0
8,0
10,0
%
Age group
Statistics South Africa 9
Patterns of morbidity and mortality among older persons in South Africa, 2013
3.3 Characteristics of older persons
This subsection provides information on the characteristics of older people. The denominator used to calculate the percentage distributions is the total number of older persons in each category. That is, the focus is just on older persons, not in comparison to other age groups. The characteristics of older persons that are studied include marital status, relationship to the head of the household, education, employment and access to social grants. All these variables are categorised according to three age groups: 60–64, 65–69 and 70 years and older. Absolute numbers are provided in Appendix 3.2.
3.3.1 Marital status
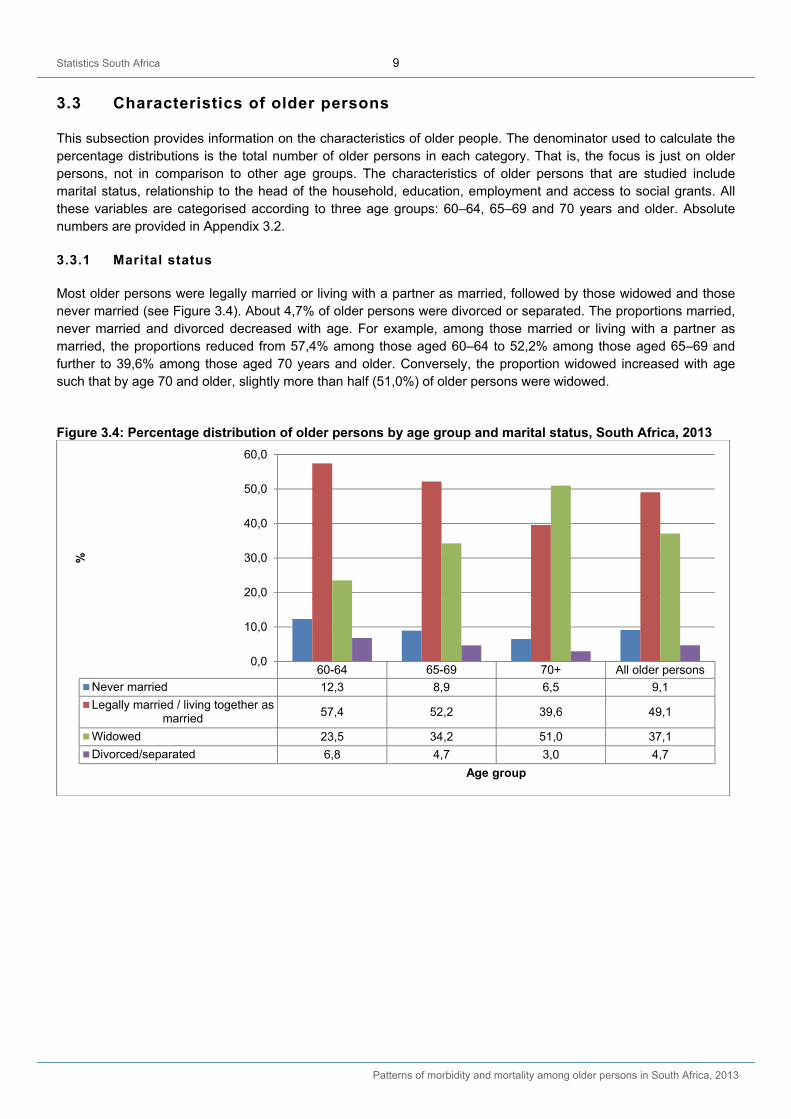
Most older persons were legally married or living with a partner as married, followed by those widowed and those never married (see Figure 3.4). About 4,7% of older persons were divorced or separated. The proportions married, never married and divorced decreased with age. For example, among those married or living with a partner as married, the proportions reduced from 57,4% among those aged 60–64 to 52,2% among those aged 65–69 and further to 39,6% among those aged 70 years and older. Conversely, the proportion widowed increased with age such that by age 70 and older, slightly more than half (51,0%) of older persons were widowed.
Figure 3.4: Percentage distribution of older persons by age group and marital status, South Africa, 2013
60-64 65-69 70+ All older persons
Never married 12,3 8,9 6,5 9,1
Legally married / living together asmarried 57,4 52,2 39,6 49,1
Widowed 23,5 34,2 51,0 37,1
Divorced/separated 6,8 4,7 3,0 4,7
0,0
10,0
20,0
30,0
40,0
50,0
60,0
%
Age group

Statistics South Africa 10
Patterns of morbidity and mortality among older persons in South Africa, 2013
3.3.2 Relationship to the head of the household
Figure 3.5 shows that the majority (more than 70%) of older persons at different age groups were heads of households. Overall, 17,7% of older persons were spouses of heads of households, although this proportion decreased with age, particularly among those aged 70 years and older, whereby 12,4% indicated that the head was their spouse compared to 21,4% who indicated the same relationship among those aged 60–64. Relatively, much older persons lived in households headed by their children (6,3% at 70 years and older) or other relatives (6,2% at 70 years and older). A small proportion of older persons lived in households headed by people they were not related to.
Figure 3.5: Percentage distribution of older persons by age group and relationship to the head of the household, South Africa, 2013
3.3.3 Living arrangements of skip-generation children
The General Household Survey had a question to establish whether individual lived with their biological parents or grandparents in the same household. This section presents information only on children of school going age (less than 18 years).
Figure 3.6 presents information on the living arrangements, where grandchildren were living with their grandparents in the absence of their biological parents. Results show that majority of grandchildren (over 90%) live with their grandparents in the same household.
Figure 3.6: Percentage distribution of grandchildren by living arrangements with grandparents, South Africa, 2013
60-64 65-69 70+ All older personsHead 71,3 72,4 74,8 72,9Spouse 21,4 20,6 12,4 17,7Parent 1,3 2,6 6,3 3,6Other relative 5,4 3,8 6,2 5,3Non-related 0,6 0,5 0,3 0,4
0,010,020,030,040,050,060,070,080,0
%
Age Group
0-4 5-13 14-18Unspecified 0,4 0,1 0,1Non relatives 0,7 0,4 0,4Other relatives 3,4 4,2 6,6Grand child 95,5 95,3 92,9
88,090,092,094,096,098,0
100,0102,0
Grand child Other relatives Non relatives Unspecified
Statistics South Africa 11
Patterns of morbidity and mortality among older persons in South Africa, 2013
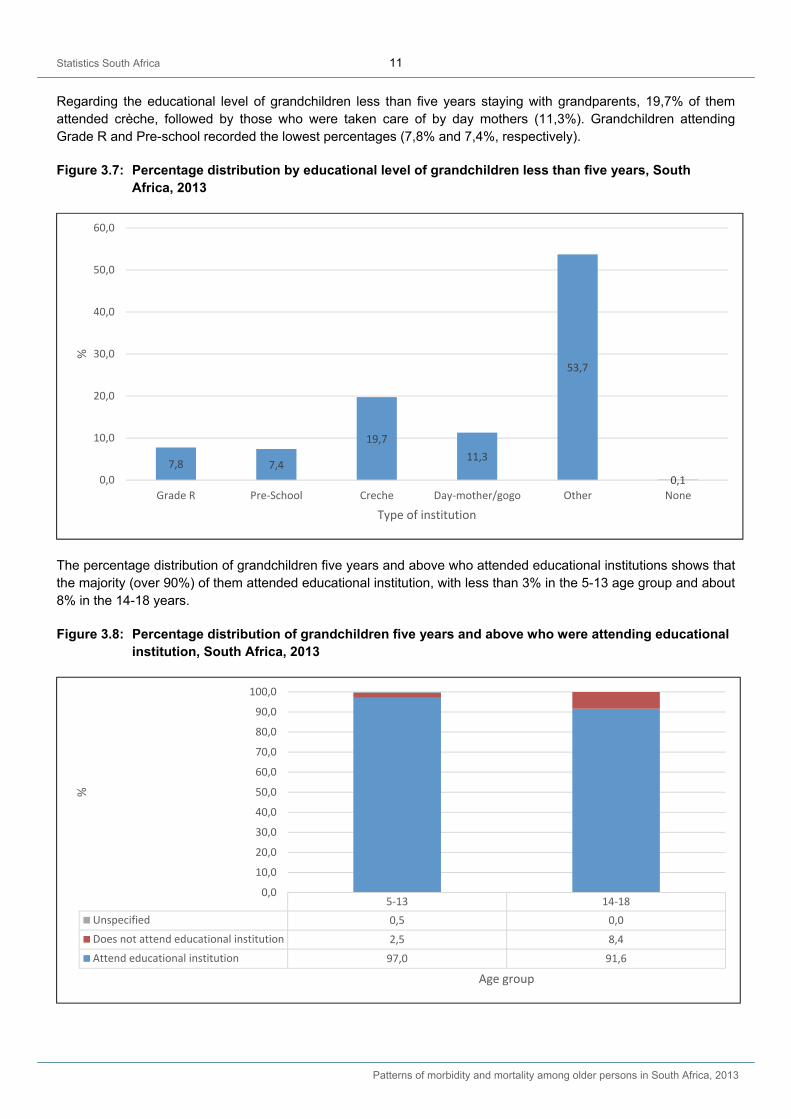
Regarding the educational level of grandchildren less than five years staying with grandparents, 19,7% of them attended crèche, followed by those who were taken care of by day mothers (11,3%). Grandchildren attending Grade R and Pre-school recorded the lowest percentages (7,8% and 7,4%, respectively).
Figure 3.7: Percentage distribution by educational level of grandchildren less than five years, South Africa, 2013
The percentage distribution of grandchildren five years and above who attended educational institutions shows that the majority (over 90%) of them attended educational institution, with less than 3% in the 5-13 age group and about 8% in the 14-18 years.
Figure 3.8: Percentage distribution of grandchildren five years and above who were attending educational institution, South Africa, 2013
7,8 7,4
19,711,3
53,7
0,10,0
10,0
20,0
30,0
40,0
50,0
60,0
Grade R Pre-School Creche Day-mother/gogo Other None
%
Type of institution
5-13 14-18Unspecified 0,5 0,0Does not attend educational institution 2,5 8,4Attend educational institution 97,0 91,6
0,0
10,0
20,0
30,0
40,0
50,0
60,0
70,0
80,0
90,0
100,0
%
Age group
Statistics South Africa 12
Patterns of morbidity and mortality among older persons in South Africa, 2013
3.3.4 Education
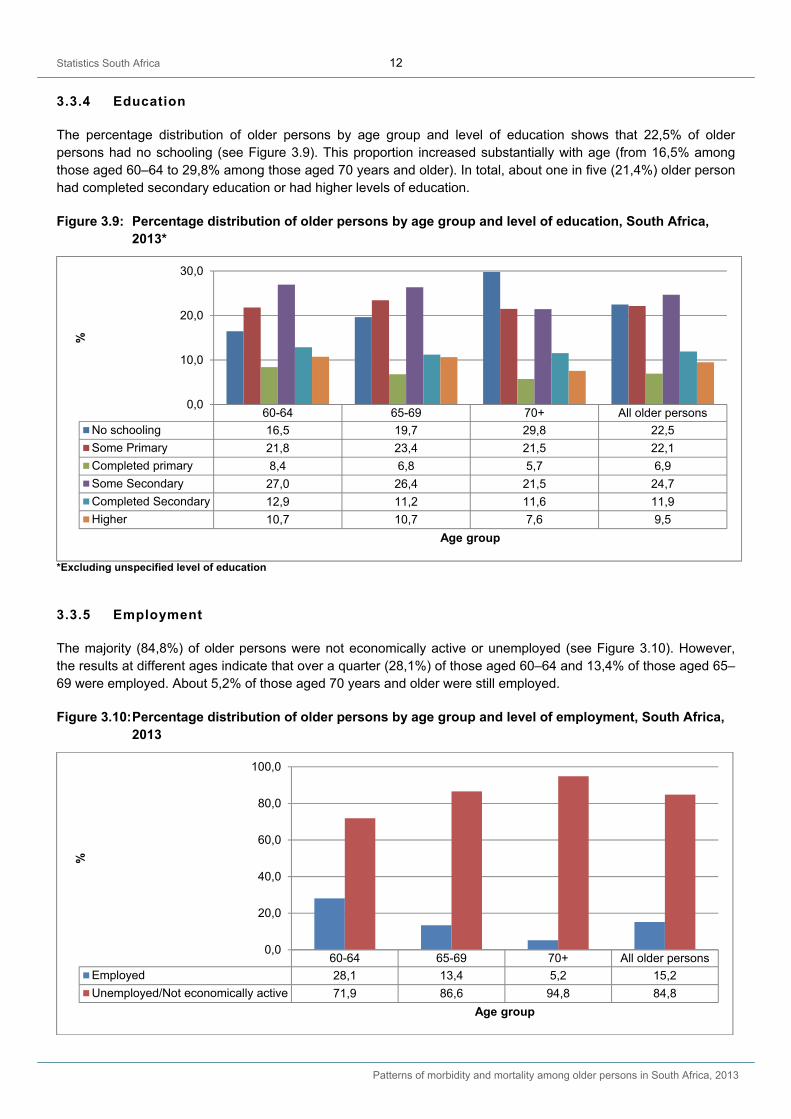
The percentage distribution of older persons by age group and level of education shows that 22,5% of older persons had no schooling (see Figure 3.9). This proportion increased substantially with age (from 16,5% among those aged 60–64 to 29,8% among those aged 70 years and older). In total, about one in five (21,4%) older person had completed secondary education or had higher levels of education.
Figure 3.9: Percentage distribution of older persons by age group and level of education, South Africa, 2013*
*Excluding unspecified level of education
3.3.5 Employment
The majority (84,8%) of older persons were not economically active or unemployed (see Figure 3.10). However, the results at different ages indicate that over a quarter (28,1%) of those aged 60–64 and 13,4% of those aged 65–69 were employed. About 5,2% of those aged 70 years and older were still employed.
Figure 3.10: Percentage distribution of older persons by age group and level of employment, South Africa, 2013
60-64 65-69 70+ All older persons
No schooling 16,5 19,7 29,8 22,5
Some Primary 21,8 23,4 21,5 22,1
Completed primary 8,4 6,8 5,7 6,9
Some Secondary 27,0 26,4 21,5 24,7
Completed Secondary 12,9 11,2 11,6 11,9
Higher 10,7 10,7 7,6 9,5
0,0
10,0
20,0
30,0
%
Age group
60-64 65-69 70+ All older persons
Employed 28,1 13,4 5,2 15,2
Unemployed/Not economically active 71,9 86,6 94,8 84,8
0,0
20,0
40,0
60,0
80,0
100,0
%
Age group
Statistics South Africa 13
Patterns of morbidity and mortality among older persons in South Africa, 2013
3.3.6 Grants
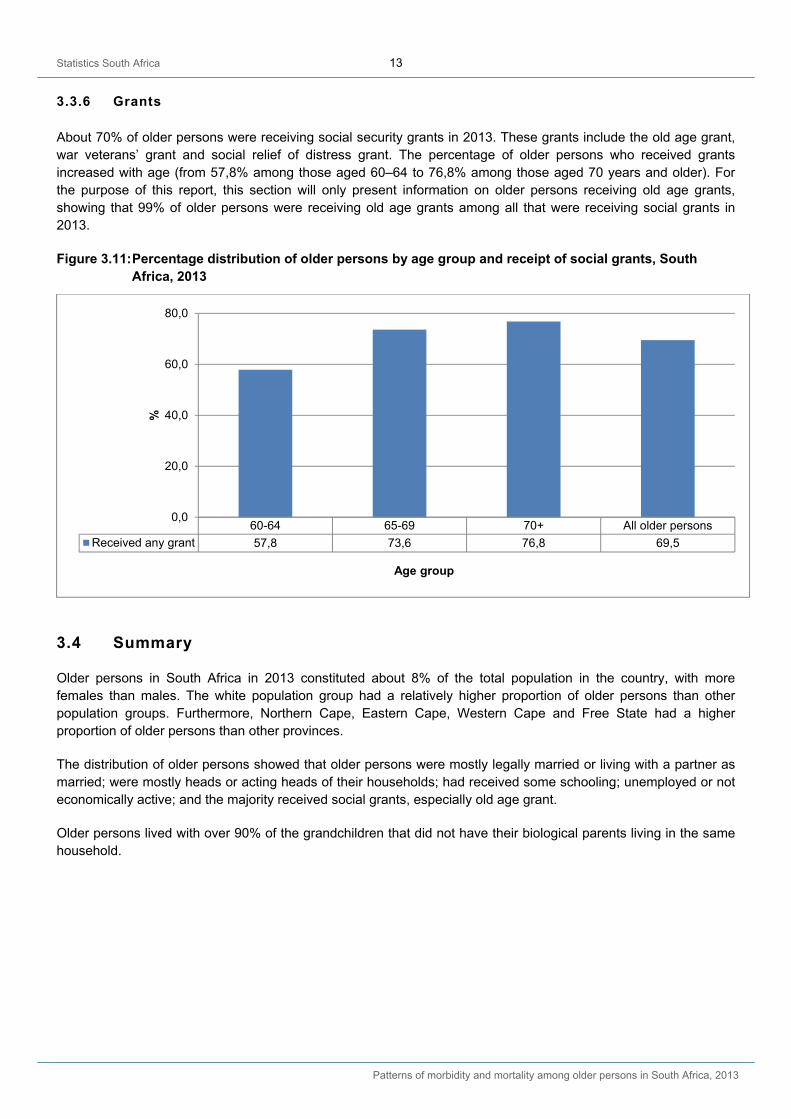
About 70% of older persons were receiving social security grants in 2013. These grants include the old age grant, war veterans’ grant and social relief of distress grant. The percentage of older persons who received grants increased with age (from 57,8% among those aged 60–64 to 76,8% among those aged 70 years and older). For the purpose of this report, this section will only present information on older persons receiving old age grants, showing that 99% of older persons were receiving old age grants among all that were receiving social grants in 2013.
Figure 3.11: Percentage distribution of older persons by age group and receipt of social grants, South Africa, 2013
3.4 Summary
Older persons in South Africa in 2013 constituted about 8% of the total population in the country, with more females than males. The white population group had a relatively higher proportion of older persons than other population groups. Furthermore, Northern Cape, Eastern Cape, Western Cape and Free State had a higher proportion of older persons than other provinces.
The distribution of older persons showed that older persons were mostly legally married or living with a partner as married; were mostly heads or acting heads of their households; had received some schooling; unemployed or not economically active; and the majority received social grants, especially old age grant.
Older persons lived with over 90% of the grandchildren that did not have their biological parents living in the same household.
60-64 65-69 70+ All older persons
Received any grant 57,8 73,6 76,8 69,5
0,0
20,0
40,0
60,0
80,0
%
Age group
Statistics South Africa 14
Patterns of morbidity and mortality among older persons in South Africa, 2013
4. Perceived health status and healthcare-seeking practices
4.1 Introduction
Information on perceived health status of older person and their practices in healthcare-seeking is provided in this chapter. It is based on responses provided by individual older persons with regard to: how they perceived their health; if they had access to medical aid; if they consulted a health worker when ill a month before the survey; and to provide reasons for not consulting a health worker if they were ill a month before the survey but did not consult a health worker.
The information is based on data from the 2013 General Household Survey (GHS), specifically focussing on older persons aged 60 years and older. The results are provided for the overall number of older persons, classified by sex, population group and province of usual residence.
4.2 Perceived health status
The GHS included a question for respondents to describe their health in general. Absolute numbers used to calculate proportions reported in this subsection are provided in Appendix 4.1.
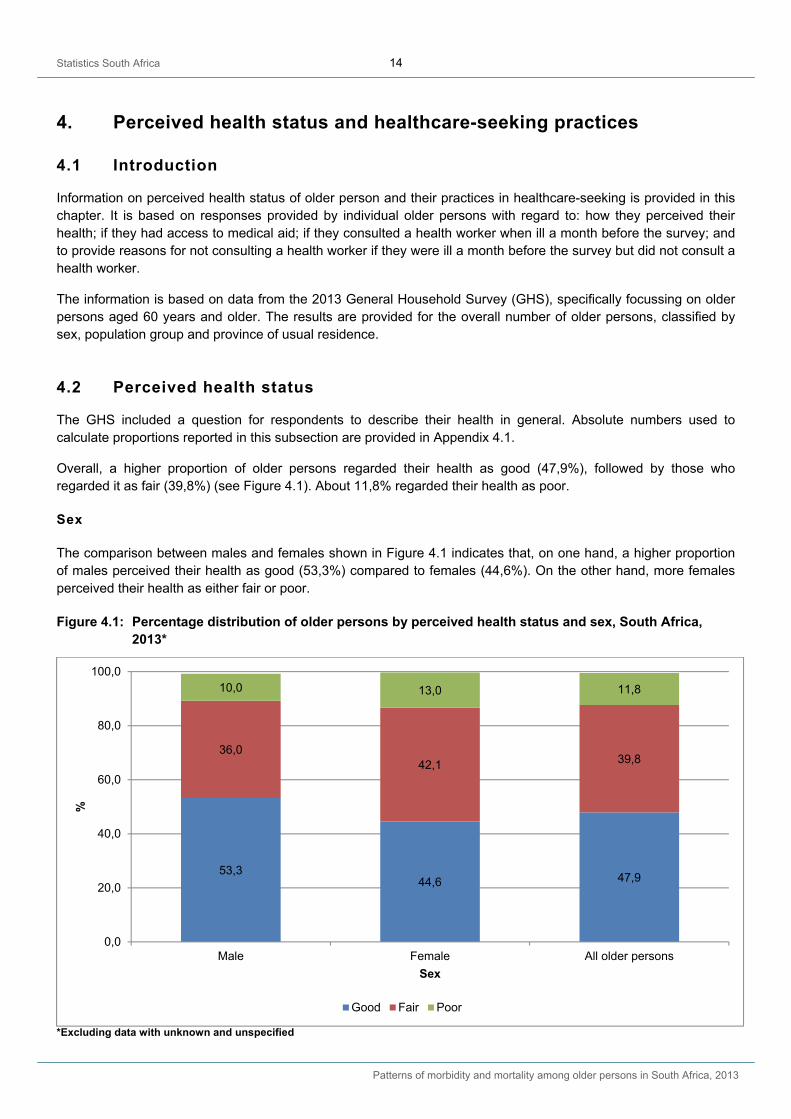
Overall, a higher proportion of older persons regarded their health as good (47,9%), followed by those who regarded it as fair (39,8%) (see Figure 4.1). About 11,8% regarded their health as poor.
Sex
The comparison between males and females shown in Figure 4.1 indicates that, on one hand, a higher proportion of males perceived their health as good (53,3%) compared to females (44,6%). On the other hand, more females perceived their health as either fair or poor.
Figure 4.1: Percentage distribution of older persons by perceived health status and sex, South Africa, 2013*
*Excluding data with unknown and unspecified
53,344,6 47,9
36,042,1 39,8
10,0 13,0 11,8
0,0
20,0
40,0
60,0
80,0
100,0
Male Female All older persons
%
Sex
Good Fair Poor
Statistics South Africa 15
Patterns of morbidity and mortality among older persons in South Africa, 2013
Population group
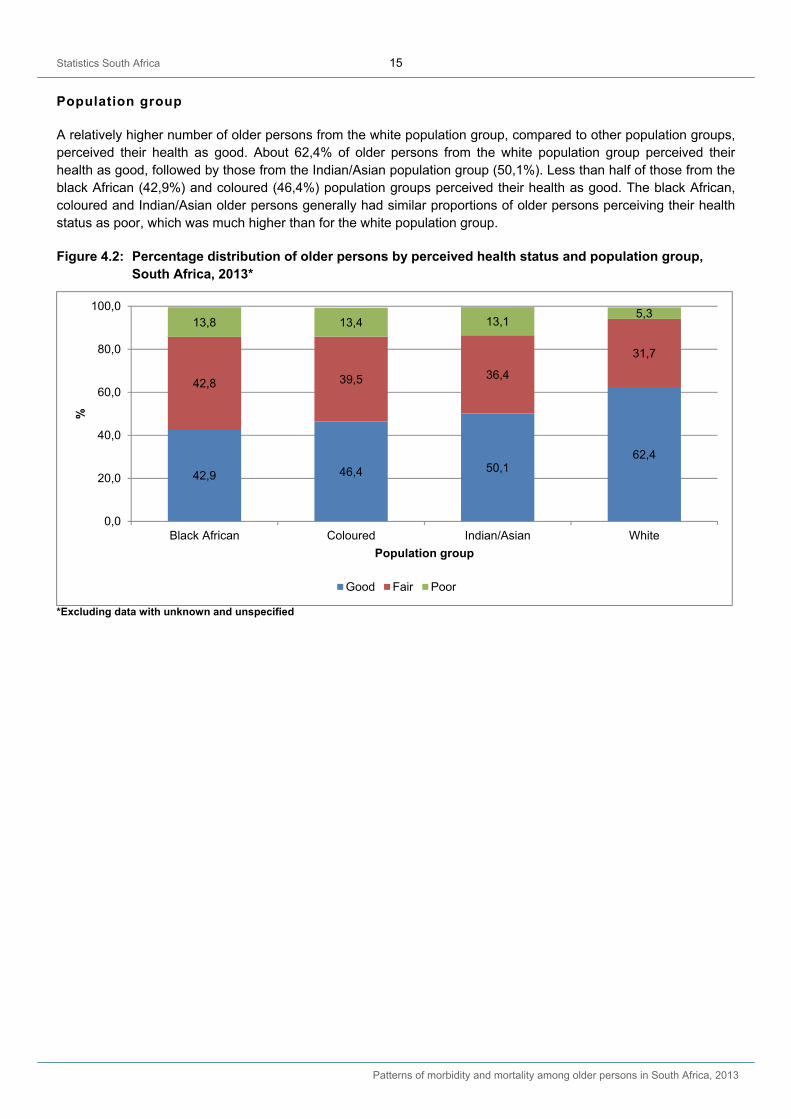
A relatively higher number of older persons from the white population group, compared to other population groups, perceived their health as good. About 62,4% of older persons from the white population group perceived their health as good, followed by those from the Indian/Asian population group (50,1%). Less than half of those from the black African (42,9%) and coloured (46,4%) population groups perceived their health as good. The black African, coloured and Indian/Asian older persons generally had similar proportions of older persons perceiving their health status as poor, which was much higher than for the white population group.
Figure 4.2: Percentage distribution of older persons by perceived health status and population group, South Africa, 2013*
*Excluding data with unknown and unspecified
42,9 46,4 50,162,4
42,8 39,5 36,4
31,7
13,8 13,4 13,15,3
0,0
20,0
40,0
60,0
80,0
100,0
Black African Coloured Indian/Asian White
%
Population group
Good Fair Poor
Statistics South Africa 16
Patterns of morbidity and mortality among older persons in South Africa, 2013
Province of usual residence
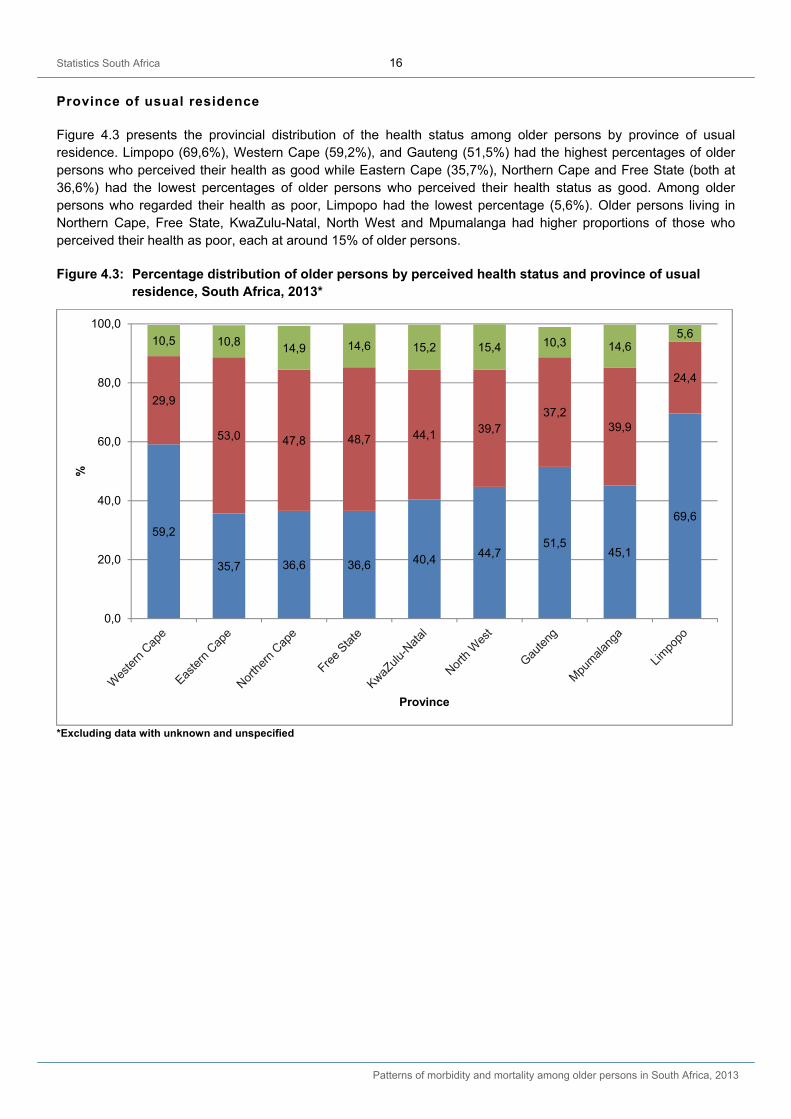
Figure 4.3 presents the provincial distribution of the health status among older persons by province of usual residence. Limpopo (69,6%), Western Cape (59,2%), and Gauteng (51,5%) had the highest percentages of older persons who perceived their health as good while Eastern Cape (35,7%), Northern Cape and Free State (both at 36,6%) had the lowest percentages of older persons who perceived their health status as good. Among older persons who regarded their health as poor, Limpopo had the lowest percentage (5,6%). Older persons living in Northern Cape, Free State, KwaZulu-Natal, North West and Mpumalanga had higher proportions of those who perceived their health as poor, each at around 15% of older persons.
Figure 4.3: Percentage distribution of older persons by perceived health status and province of usual residence, South Africa, 2013*
*Excluding data with unknown and unspecified
59,2
35,7 36,6 36,6 40,4 44,751,5
45,1
69,6
29,9
53,0 47,8 48,7 44,1 39,737,2
39,9
24,4
10,5 10,814,9 14,6 15,2 15,4 10,3 14,6
5,6
0,0
20,0
40,0
60,0
80,0
100,0
%
Province
Statistics South Africa 17
Patterns of morbidity and mortality among older persons in South Africa, 2013
4.3 Healthcare-seeking practices
This subsection presents information on healthcare-seeking practices based on medical aid coverage (proportion covered by medical aid or medical benefit scheme or other private health insurance) and consultations with health workers. The results are classified by sex, population group and province of usual residence. Absolute numbers used to calculate proportions covered by medical aid are provided in Appendix 4.2.
4.3.1 Medical aid coverage
Just about a quarter (24,0%) of older persons were covered by medical aid, with slightly more males (27,5%) than females (21,8%) with medical aid coverage. However, the distribution by population group showed that the majority of older persons from the white population group (78,1%) were covered by medical aid while 35,8%, 15,9% and only 5,5% of the Indian/Asian, coloured and black African population respectively were covered by medical aid.
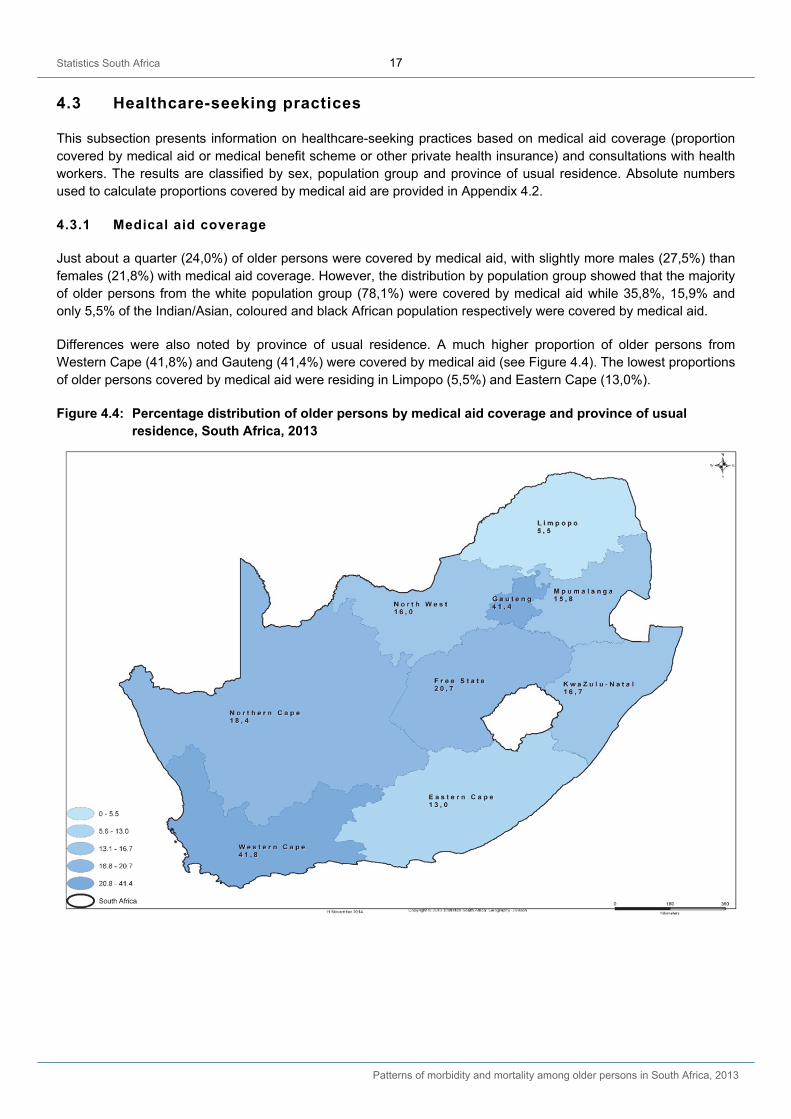
Differences were also noted by province of usual residence. A much higher proportion of older persons from Western Cape (41,8%) and Gauteng (41,4%) were covered by medical aid (see Figure 4.4). The lowest proportions of older persons covered by medical aid were residing in Limpopo (5,5%) and Eastern Cape (13,0%).
Figure 4.4: Percentage distribution of older persons by medical aid coverage and province of usual residence, South Africa, 2013
Statistics South Africa 18
Patterns of morbidity and mortality among older persons in South Africa, 2013
4.3.2 Consultations with health workers
Respondents who indicated that they suffered from an illness a month before the survey were asked if they consulted a health worker such as a nurse, doctor or traditional healer as a result of the illness. If not, they were asked to indicate reasons for not consulting a health worker. The analyses in this subsection cover proportions who did not consult a health worker when ill and the reasons given for not consulting.
4.3.3 Characteristics of those who consulted health workers when ill
A total of 620 429 older persons indicated that they suffered an illness a month before the survey, representing 15,0% of all older persons. This group forms the basis of the analyses undertaken on consultations with health workers. Absolute numbers used to calculate proportions reported in this subsection are provided in Appendix 4.3.
The majority (83,3%) of older persons who said they suffered an illness a month before the survey consulted a health worker while 14,6% did not consult. About 2,1% of them did not specify whether or not they consulted a health worker. Slightly more females (84,2%) than males (81,4%) who were ill a month before the survey consulted a health worker.
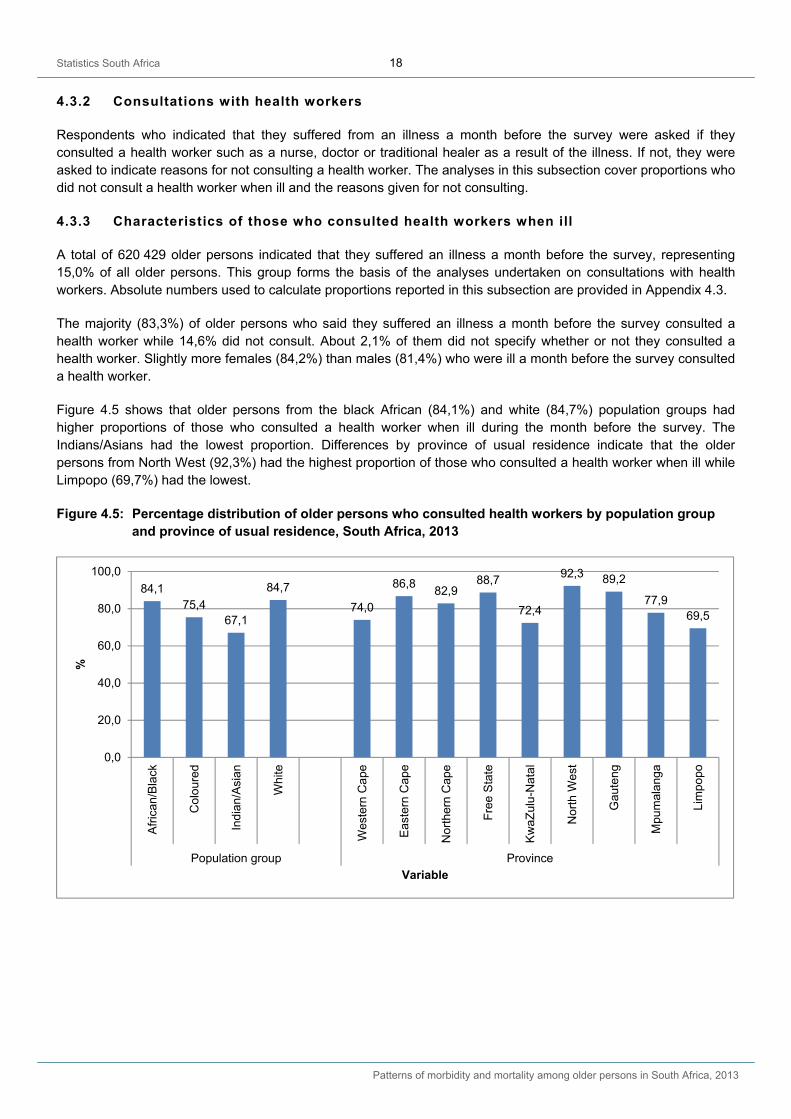
Figure 4.5 shows that older persons from the black African (84,1%) and white (84,7%) population groups had higher proportions of those who consulted a health worker when ill during the month before the survey. The Indians/Asians had the lowest proportion. Differences by province of usual residence indicate that the older persons from North West (92,3%) had the highest proportion of those who consulted a health worker when ill while Limpopo (69,7%) had the lowest.
Figure 4.5: Percentage distribution of older persons who consulted health workers by population group and province of usual residence, South Africa, 2013
84,175,4
67,1
84,7
74,0
86,882,9
88,7
72,4
92,3 89,2
77,969,5
0,0
20,0
40,0
60,0
80,0
100,0
Afr
ican
/Bla
ck
Co
lour
ed
Ind
ian
/Asi
an
Whi
te
Wes
tern
Ca
pe
Eas
tern
Cap
e
Nor
ther
n C
ape
Fre
e S
tate
Kw
aZul
u-N
atal
No
rth
Wes
t
Gau
teng
Mpu
mal
ang
a
Lim
popo
Population group Province
%
Variable
Statistics South Africa 19
Patterns of morbidity and mortality among older persons in South Africa, 2013
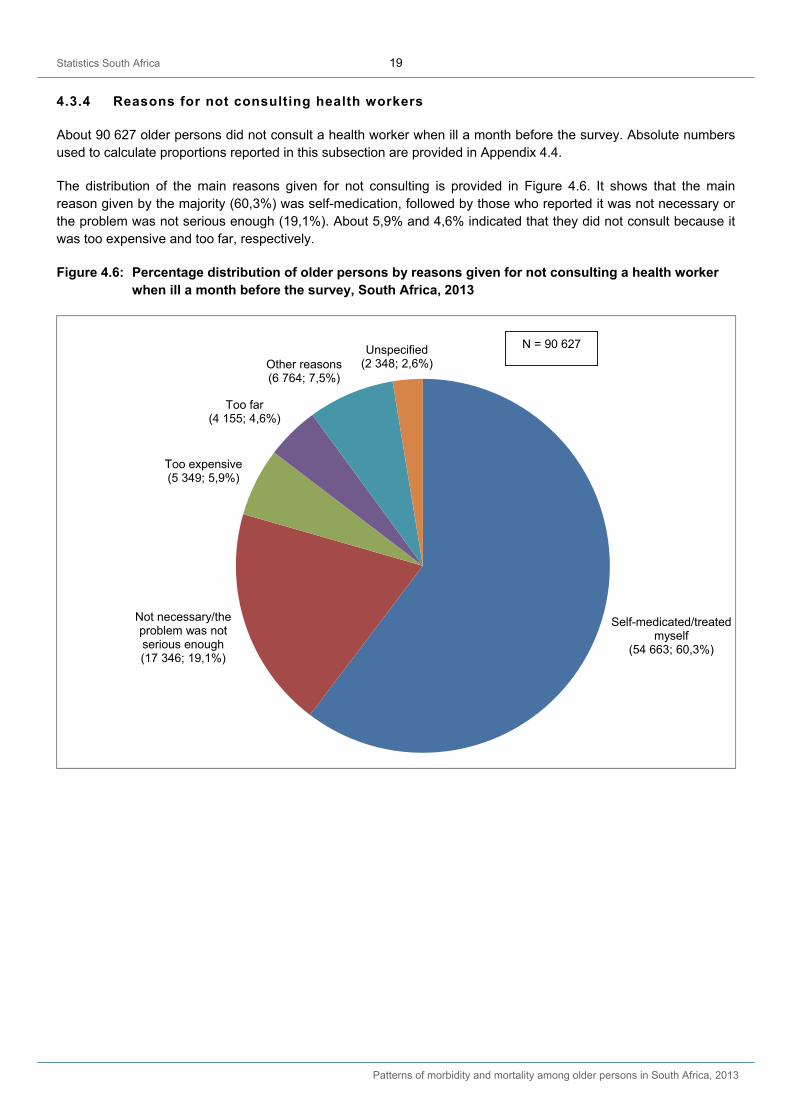
4.3.4 Reasons for not consulting health workers
About 90 627 older persons did not consult a health worker when ill a month before the survey. Absolute numbers used to calculate proportions reported in this subsection are provided in Appendix 4.4.
The distribution of the main reasons given for not consulting is provided in Figure 4.6. It shows that the main reason given by the majority (60,3%) was self-medication, followed by those who reported it was not necessary or the problem was not serious enough (19,1%). About 5,9% and 4,6% indicated that they did not consult because it was too expensive and too far, respectively.
Figure 4.6: Percentage distribution of older persons by reasons given for not consulting a health worker when ill a month before the survey, South Africa, 2013
Self-medicated/treated myself
(54 663; 60,3%)
Not necessary/the problem was not serious enough (17 346; 19,1%)
Too expensive (5 349; 5,9%)
Too far(4 155; 4,6%)
Other reasons (6 764; 7,5%)
Unspecified(2 348; 2,6%)
N = 90 627
Statistics South Africa 20
Patterns of morbidity and mortality among older persons in South Africa, 2013
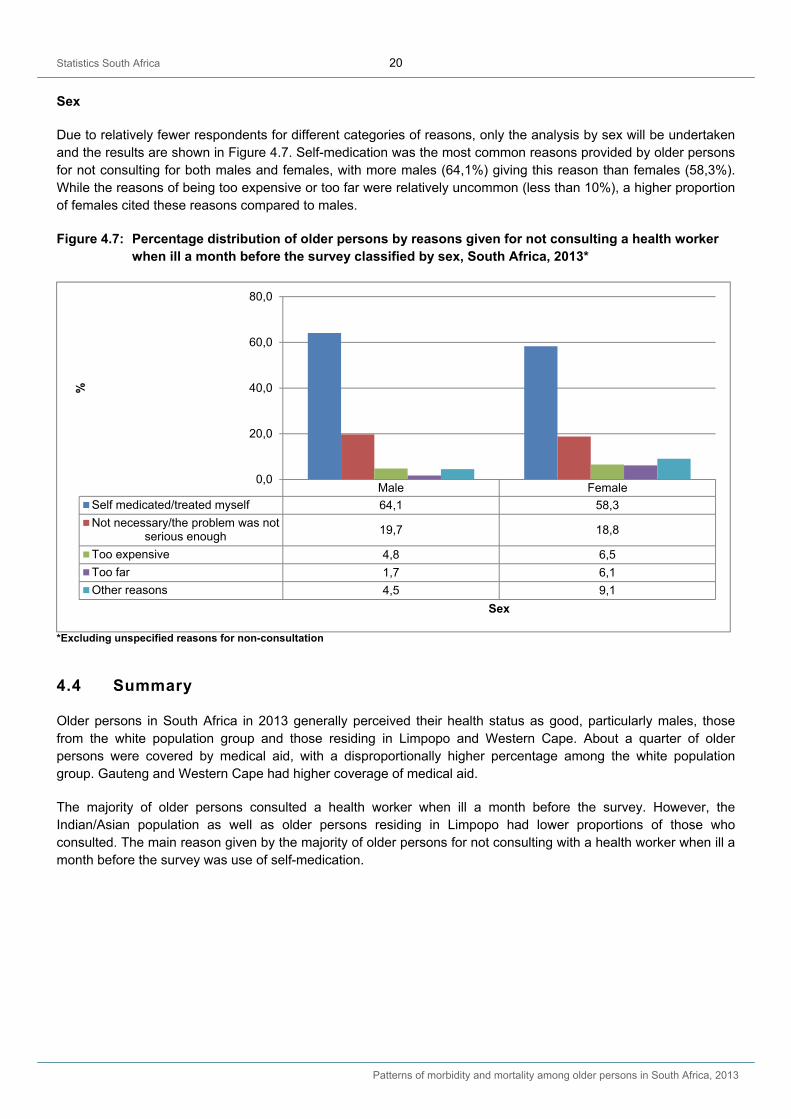
Sex
Due to relatively fewer respondents for different categories of reasons, only the analysis by sex will be undertaken and the results are shown in Figure 4.7. Self-medication was the most common reasons provided by older persons for not consulting for both males and females, with more males (64,1%) giving this reason than females (58,3%). While the reasons of being too expensive or too far were relatively uncommon (less than 10%), a higher proportion of females cited these reasons compared to males.
Figure 4.7: Percentage distribution of older persons by reasons given for not consulting a health worker when ill a month before the survey classified by sex, South Africa, 2013*
*Excluding unspecified reasons for non-consultation
4.4 Summary
Older persons in South Africa in 2013 generally perceived their health status as good, particularly males, those from the white population group and those residing in Limpopo and Western Cape. About a quarter of older persons were covered by medical aid, with a disproportionally higher percentage among the white population group. Gauteng and Western Cape had higher coverage of medical aid.
The majority of older persons consulted a health worker when ill a month before the survey. However, the Indian/Asian population as well as older persons residing in Limpopo had lower proportions of those who consulted. The main reason given by the majority of older persons for not consulting with a health worker when ill a month before the survey was use of self-medication.
Male Female
Self medicated/treated myself 64,1 58,3
Not necessary/the problem was notserious enough 19,7 18,8
Too expensive 4,8 6,5
Too far 1,7 6,1
Other reasons 4,5 9,1
0,0
20,0
40,0
60,0
80,0
%
Sex
Statistics South Africa 21
Patterns of morbidity and mortality among older persons in South Africa, 2013
5. Recent self-reported illnesses
5.1 Introduction
This chapter presents information on self-reported illnesses suffered by older persons a month before the survey based on data from the 2013 General Household Survey (GHS). The survey asked respondents if they were ill a month before the survey and if ill, to specify the illness they suffered from. The basis of the analyses undertaken in this chapter is the total number of older persons from which the proportions ill and with specific illnesses were calculated.
5.2 Self-reported illnesses
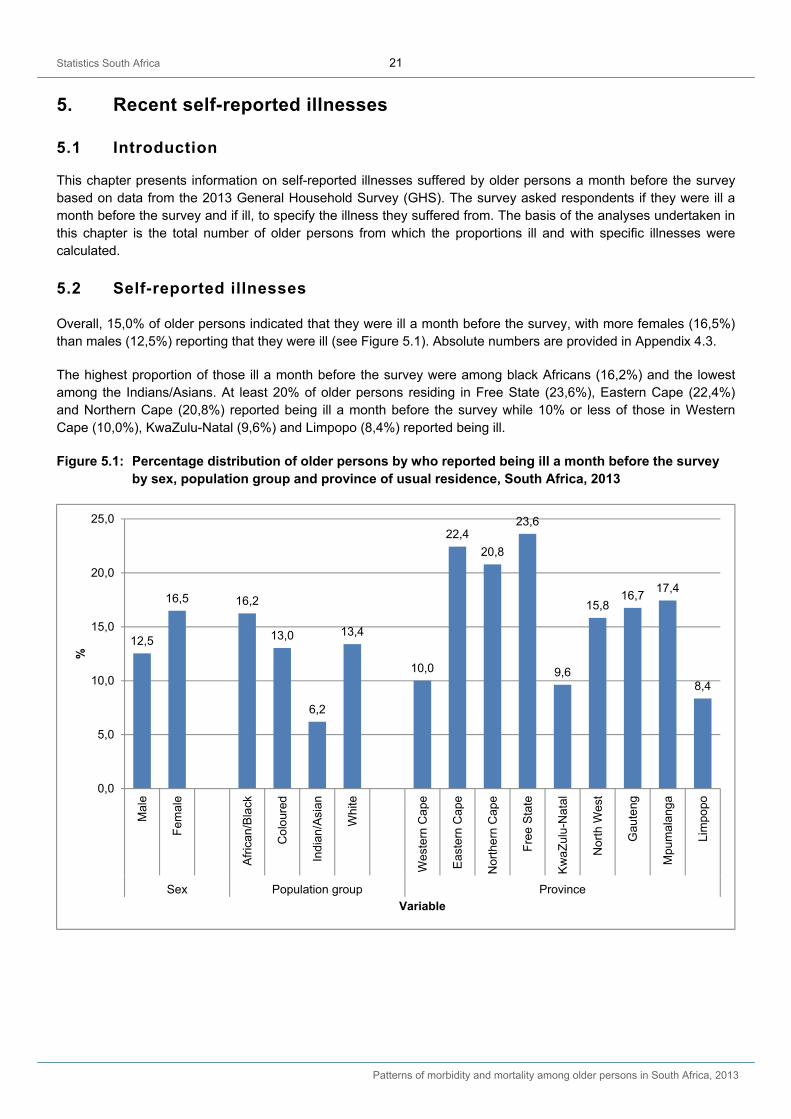
Overall, 15,0% of older persons indicated that they were ill a month before the survey, with more females (16,5%) than males (12,5%) reporting that they were ill (see Figure 5.1). Absolute numbers are provided in Appendix 4.3.
The highest proportion of those ill a month before the survey were among black Africans (16,2%) and the lowest among the Indians/Asians. At least 20% of older persons residing in Free State (23,6%), Eastern Cape (22,4%) and Northern Cape (20,8%) reported being ill a month before the survey while 10% or less of those in Western Cape (10,0%), KwaZulu-Natal (9,6%) and Limpopo (8,4%) reported being ill.
Figure 5.1: Percentage distribution of older persons by who reported being ill a month before the survey by sex, population group and province of usual residence, South Africa, 2013
12,5
16,5 16,2
13,0
6,2
13,4
10,0
22,4
20,8
23,6
9,6
15,816,7
17,4
8,4
0,0
5,0
10,0
15,0
20,0
25,0
Mal
e
Fem
ale
Afr
ican
/Bla
ck
Co
lour
ed
Ind
ian
/Asi
an
Whi
te
Wes
tern
Ca
pe
Eas
tern
Cap
e
Nor
ther
n C
ape
Fre
e S
tate
Kw
aZul
u-N
atal
No
rth
Wes
t
Gau
teng
Mpu
mal
ang
a
Lim
popo
Sex Population group Province
%
Variable
Statistics South Africa 22
Patterns of morbidity and mortality among older persons in South Africa, 2013
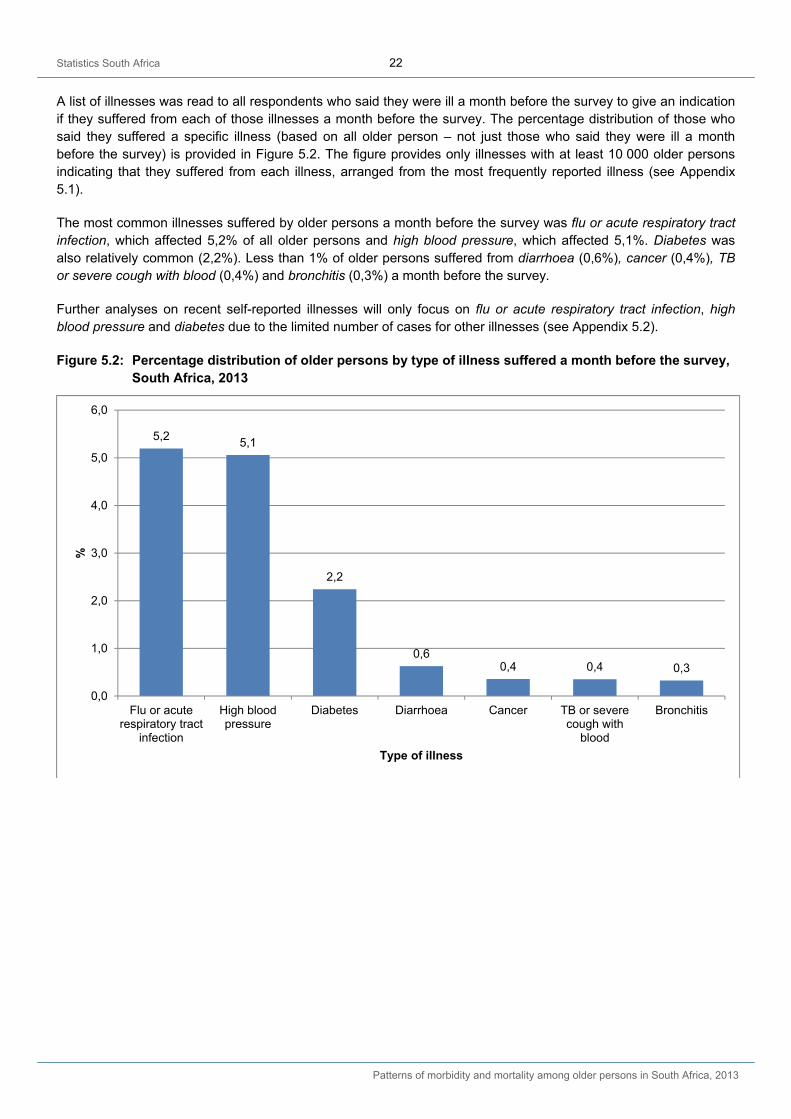
A list of illnesses was read to all respondents who said they were ill a month before the survey to give an indication if they suffered from each of those illnesses a month before the survey. The percentage distribution of those who said they suffered a specific illness (based on all older person – not just those who said they were ill a month before the survey) is provided in Figure 5.2. The figure provides only illnesses with at least 10 000 older persons indicating that they suffered from each illness, arranged from the most frequently reported illness (see Appendix 5.1).
The most common illnesses suffered by older persons a month before the survey was flu or acute respiratory tract infection, which affected 5,2% of all older persons and high blood pressure, which affected 5,1%. Diabetes was also relatively common (2,2%). Less than 1% of older persons suffered from diarrhoea (0,6%), cancer (0,4%), TB or severe cough with blood (0,4%) and bronchitis (0,3%) a month before the survey.
Further analyses on recent self-reported illnesses will only focus on flu or acute respiratory tract infection, high blood pressure and diabetes due to the limited number of cases for other illnesses (see Appendix 5.2).
Figure 5.2: Percentage distribution of older persons by type of illness suffered a month before the survey, South Africa, 2013
5,2 5,1
2,2
0,60,4 0,4 0,3
0,0
1,0
2,0
3,0
4,0
5,0
6,0
Flu or acuterespiratory tract
infection
High bloodpressure
Diabetes Diarrhoea Cancer TB or severecough with
blood
Bronchitis
%
Type of illness
Statistics South Africa 23
Patterns of morbidity and mortality among older persons in South Africa, 2013
5.2.1 Flu or acute respiratory tract infection
The distribution of all older persons who suffered from flu or acute respiratory tract infection (ARTI) is provided in Figure 5.3. Relatively more females (6,0%) than males (3,9%) reported having flu or ARTI a month before the survey. Differences by population group were not wide but older persons from the coloured (5,5%) and the black African (5,4%) population groups had slightly more people who suffered from flu or ARTI a month before the survey.
Notable differences were observed by province of usual residence. Older people residing in Eastern Cape (7,8%), Northern Cape (7,5%) and Mpumalanga (7,1%) had higher proportions of those who from suffered flu or ARTI a month before the survey. Limpopo had the lowest (3,2%).
Figure 5.3: Percentage distribution of older persons who suffered from flu or ARTI a month before the survey by sex, population group and province of usual residence, South Africa, 2013
3,9
6,0
5,4 5,5
4,24,8
4,5
7,87,5
5,8
4,7 4,5 4,6
7,1
3,2
0,0
2,0
4,0
6,0
8,0
Mal
e
Fem
ale
Bla
ck A
fric
an
Co
lour
ed
Ind
ian
/Asi
an
Whi
te
Wes
tern
Ca
pe
Eas
tern
Cap
e
Nor
ther
n C
ape
Fre
e S
tate
Kw
aZul
u-N
atal
No
rth
Wes
t
Gau
teng
Mpu
mal
ang
a
Lim
popo
Sex Population group Province
%
Variable
Statistics South Africa 24
Patterns of morbidity and mortality among older persons in South Africa, 2013
5.2.2 High blood pressure
Figure 5.4 shows that suffering from high blood pressure a month before the survey by older persons was reported more by females (6,1%) as compared to males (3,4%). Furthermore, older persons from the coloured (6,3%) and the black African population groups (5,6%) also reported higher proportions of suffering from high blood pressure compared to other population groups. High blood pressure was less commonly reported by older persons in Limpopo (1,1%), KwaZulu-Natal (1,3%) and Western Cape (2,3%) but more commonly reported in Northern Cape (12,2%).
Figure 5.4: Percentage distribution of older persons who suffered from high blood pressure a month before the survey by sex, population group and province of usual residence, South Africa, 2013
3,4
6,15,6
6,3
0,0
3,9
2,3
8,8
12,2
9,9
1,3
5,8
7,3
4,0
1,1
0,0
2,0
4,0
6,0
8,0
10,0
12,0
14,0
Mal
e
Fem
ale
Bla
ck A
fric
an
Co
lour
ed
Ind
ian
/Asi
an
Whi
te
Wes
tern
Ca
pe
Eas
tern
Cap
e
Nor
ther
n C
ape
Fre
e S
tate
Kw
aZul
u-N
atal
No
rth
Wes
t
Gau
teng
Mpu
mal
ang
a
Lim
popo
Sex Population group Province
%
Variable
Statistics South Africa 25
Patterns of morbidity and mortality among older persons in South Africa, 2013
5.2.3 Diabetes
Slight differences of the proportions of older persons suffering from diabetes a month before the survey were observed by sex and population group (see Figure 5.5). However, notable differences were observed by province of usual residence where those residing in Gauteng (4,0%), Northern Cape and Free State (3,7% each) had a higher proportion of older persons that reported suffering from diabetes a month before the survey while those in Limpopo (0,7%), KwaZulu-Natal (0,8%) and Western Cape (1,0%) reported the lowest.
Figure 5.5: Percentage distribution of older persons who suffered from diabetes a month before the survey by sex, population group and province of usual residence, South Africa, 2013
5.3 Summary
Recent illnesses reported in this chapter were measured by the proportion of older persons who were ill a month before the survey. Focus was placed on three illnesses (flu or ARTI, high blood pressure and diabetes) due to the limited number of cases for other illnesses for further breakdown by sex, population group and province of usual residence.
About 15% of older persons reported being ill a month before the survey. Compared to males, there were more females reporting that they suffered from flu or ARTI, high blood pressure and diabetes. Differences by population group showed that more black Africans reported being ill a month before the survey population groups. Older persons from the coloured population group reported higher proportions of flu or ARTI, high blood pressure and diabetes, followed by black Africans. For provinces, Eastern Cape, Northern Cape and Mpumalanga had higher proportions of older persons being ill a month before the survey. These three provinces also had higher proportions suffering from flu or ARTI. High blood pressure was reported more in Eastern Cape, Northern Cape and Free State while diabetes was reported more in Gauteng, Northern Cape, Free State and Eastern Cape.
1,9
2,5 2,5
2,8
1,5 1,5
1,0
3,1
3,7 3,7
0,8
2,3
4,0
1,7
0,7
0,0
1,0
2,0
3,0
4,0
5,0
Mal
e
Fem
ale
Bla
ck A
fric
an
Co
lour
ed
Ind
ian
/Asi
an
Whi
te
Wes
tern
Ca
pe
Eas
tern
Cap
e
Nor
ther
n C
ape
Fre
e S
tate
Kw
aZul
u-N
atal
No
rth
Wes
t
Gau
teng
Mpu
mal
ang
a
Lim
popo
Sex Population group Province
%
Variable
Statistics South Africa 26
Patterns of morbidity and mortality among older persons in South Africa, 2013
6. Chronic conditions and use of medication
6.1 Introduction
This chapter discusses chronic conditions among older persons as well as use of medication for specified conditions based on data collected through the 2013 General Household Survey (GHS). Chronic diseases are defined as diseases of long duration and generally of slow progression.
The information on chronic conditions is based on a question on whether respondents were informed by a medical practitioner or nurse that they suffered from hypertension or high blood pressure, diabetes, arthritis, asthma, heart attack or myocardial infarction, stroke, cancer, HIV and AIDS or tuberculosis. This question was addressed to all persons covered in the GHS. Those who indicated that they suffered each condition were asked to indicate if they were taking medication for the condition.
Figure 6.1 provides the distribution of older persons who were informed by a health worker that they suffered from the listed conditions (see Appendix 6.1 for absolute numbers). A disproportionately higher number of older persons had hypertension / high blood pressure (43,4%). They were followed by less than half of this proportion that had diabetes (15,6%) and then arthritis (13,1%). Less than 5% of older persons had other conditions such as asthma (4,5%) and heart attack / myocardial infarction (3,6%). The two infectious diseases (HIV and AIDS and tuberculosis) had the lowest proportions: 1,5% and 1,1% respectively.
Further analysis by sex, population group and province of usual residence will only focus on hypertension or high blood pressure, diabetes, arthritis, asthma, heart attack or myocardial infarction and stroke due to the limited number of cases for other conditions (see Appendix 6.2 and Appendix 6.3 for the distribution of older persons with these illnesses and usage of medication).
Figure 6.1: Percentage distribution of older persons who were informed by a health worker that they had an illness by type of illness, South Africa, 2013
43,4
15,6
13,1
4,5
3,6
2,0
1,7
1,5
1,1
0,0 5,0 10,0 15,0 20,0 25,0 30,0 35,0 40,0 45,0 50,0
Hypertension / high blood pressure
Diabetes
Arthritis
Asthma
Heart attack / myocardial infarction
Stroke
Cancer
HIV and AIDS
Tuberculosis
%
Typ
e o
f co
nd
itii
on
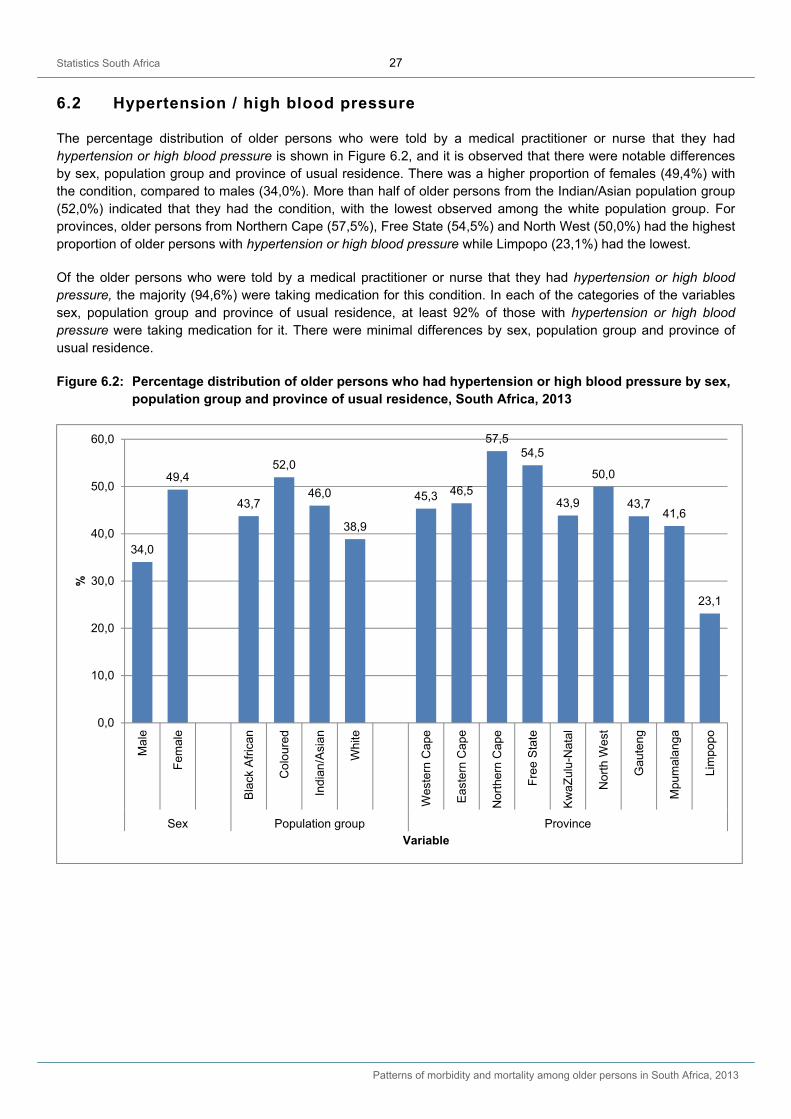
Statistics South Africa 27
Patterns of morbidity and mortality among older persons in South Africa, 2013
6.2 Hypertension / high blood pressure
The percentage distribution of older persons who were told by a medical practitioner or nurse that they had hypertension or high blood pressure is shown in Figure 6.2, and it is observed that there were notable differences by sex, population group and province of usual residence. There was a higher proportion of females (49,4%) with the condition, compared to males (34,0%). More than half of older persons from the Indian/Asian population group (52,0%) indicated that they had the condition, with the lowest observed among the white population group. For provinces, older persons from Northern Cape (57,5%), Free State (54,5%) and North West (50,0%) had the highest proportion of older persons with hypertension or high blood pressure while Limpopo (23,1%) had the lowest.
Of the older persons who were told by a medical practitioner or nurse that they had hypertension or high blood pressure, the majority (94,6%) were taking medication for this condition. In each of the categories of the variables sex, population group and province of usual residence, at least 92% of those with hypertension or high blood pressure were taking medication for it. There were minimal differences by sex, population group and province of usual residence.
Figure 6.2: Percentage distribution of older persons who had hypertension or high blood pressure by sex, population group and province of usual residence, South Africa, 2013
34,0
49,4
43,7
52,0
46,0
38,9
45,3 46,5
57,554,5
43,9
50,0
43,741,6
23,1
0,0
10,0
20,0
30,0
40,0
50,0
60,0
Mal
e
Fem
ale
Bla
ck A
fric
an
Co
lour
ed
Ind
ian
/Asi
an
Whi
te
Wes
tern
Ca
pe
Eas
tern
Cap
e
Nor
ther
n C
ape
Fre
e S
tate
Kw
aZul
u-N
atal
No
rth
Wes
t
Gau
teng
Mpu
mal
ang
a
Lim
popo
Sex Population group Province
%
Variable

Statistics South Africa 28
Patterns of morbidity and mortality among older persons in South Africa, 2013
6.3 Diabetes
The proportion of older persons who were told by a medical practitioner or nurse that they had diabetes was also higher among females (16,9%) than males (13,7%) (see Figure 6.3). The Indian/Asian population group (34,5%), followed by the coloured population group (22,7%) had higher proportions of older persons with diabetes while the white population group had the lowest (10,1%). About 15,6% of older persons from the black African population group had diabetes. Comparison by province of usual residence shows that older persons in KwaZulu-Natal (22,2%) had the highest proportion with diabetes while North West (8,6%) and Limpopo (8,4%) had the lowest. The remaining provinces had proportions ranging between 12% and 18%.
With regard to medication taken for diabetes, the results showed that 94,8% of older persons who had diabetes were on medication for the condition. The results further indicate that, generally, there were no differences by sex and population group. In each of the categories of these variables, at least 94% of older persons who were told by a medical practitioner or nurse that they had diabetes were taking medication for the condition. Minimal differences were noted for provinces. With the exception of North West (89,4%), Mpumalanga (90,8%) and Free State (93,6%), at least 94% of older persons with diabetes were taking medication for the condition.
Figure 6.3: Percentage distribution of older persons who had diabetes by sex, population group and province of usual residence, South Africa, 2013
13,7
16,915,6
22,7
34,5
10,1
16,617,6
16,3 15,6
22,2
8,6
14,712,4
8,4
0,0
10,0
20,0
30,0
40,0
Mal
e
Fem
ale
Bla
ck A
fric
an
Co
lour
ed
Ind
ian
/Asi
an
Whi
te
Wes
tern
Ca
pe
Eas
tern
Cap
e
Nor
ther
n C
ape
Fre
e S
tate
Kw
aZul
u-N
atal
No
rth
Wes
t
Gau
teng
Mpu
mal
ang
a
Lim
popo
Sex Population group Province
%
Variable
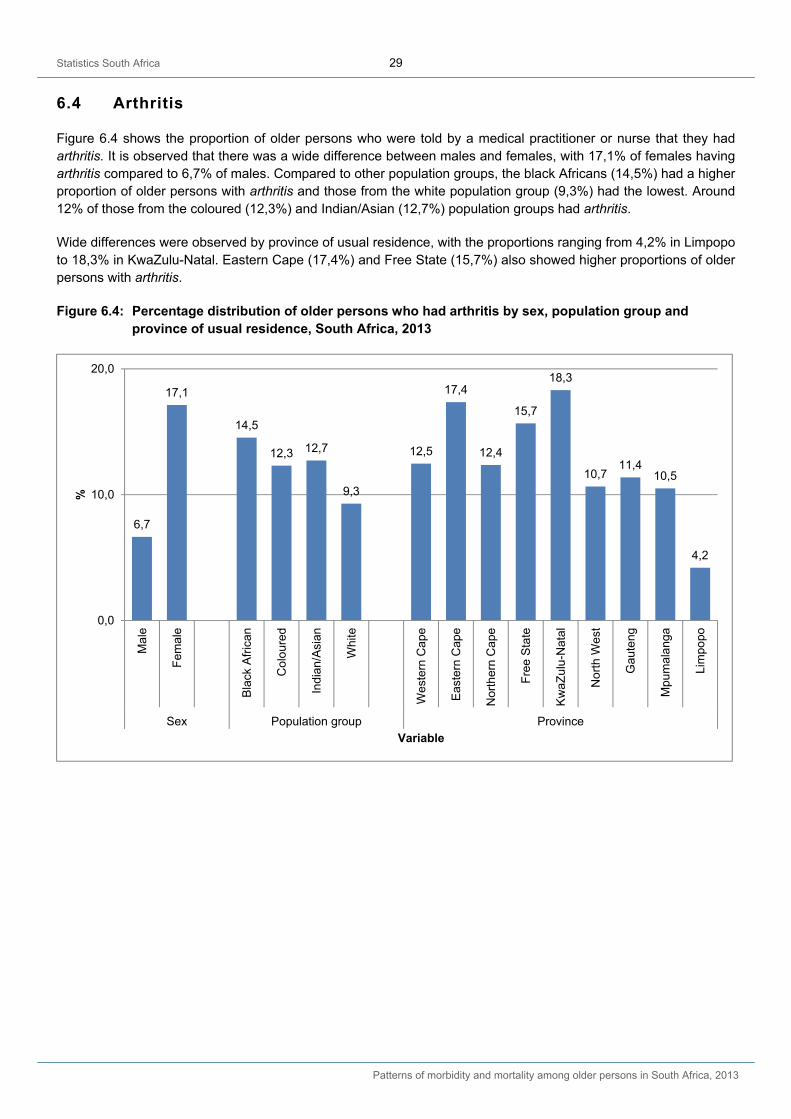
Statistics South Africa 29
Patterns of morbidity and mortality among older persons in South Africa, 2013
6.4 Arthritis
Figure 6.4 shows the proportion of older persons who were told by a medical practitioner or nurse that they had arthritis. It is observed that there was a wide difference between males and females, with 17,1% of females having arthritis compared to 6,7% of males. Compared to other population groups, the black Africans (14,5%) had a higher proportion of older persons with arthritis and those from the white population group (9,3%) had the lowest. Around 12% of those from the coloured (12,3%) and Indian/Asian (12,7%) population groups had arthritis.
Wide differences were observed by province of usual residence, with the proportions ranging from 4,2% in Limpopo to 18,3% in KwaZulu-Natal. Eastern Cape (17,4%) and Free State (15,7%) also showed higher proportions of older persons with arthritis.
Figure 6.4: Percentage distribution of older persons who had arthritis by sex, population group and province of usual residence, South Africa, 2013
6,7
17,1
14,5
12,3 12,7
9,3
12,5
17,4
12,4
15,7
18,3
10,711,4
10,5
4,2
0,0
10,0
20,0
Mal
e
Fem
ale
Bla
ck A
fric
an
Co
lour
ed
Ind
ian
/Asi
an
Whi
te
Wes
tern
Ca
pe
Eas
tern
Cap
e
Nor
ther
n C
ape
Fre
e S
tate
Kw
aZul
u-N
atal
No
rth
Wes
t
Gau
teng
Mpu
mal
ang
a
Lim
popo
Sex Population group Province
%
Variable
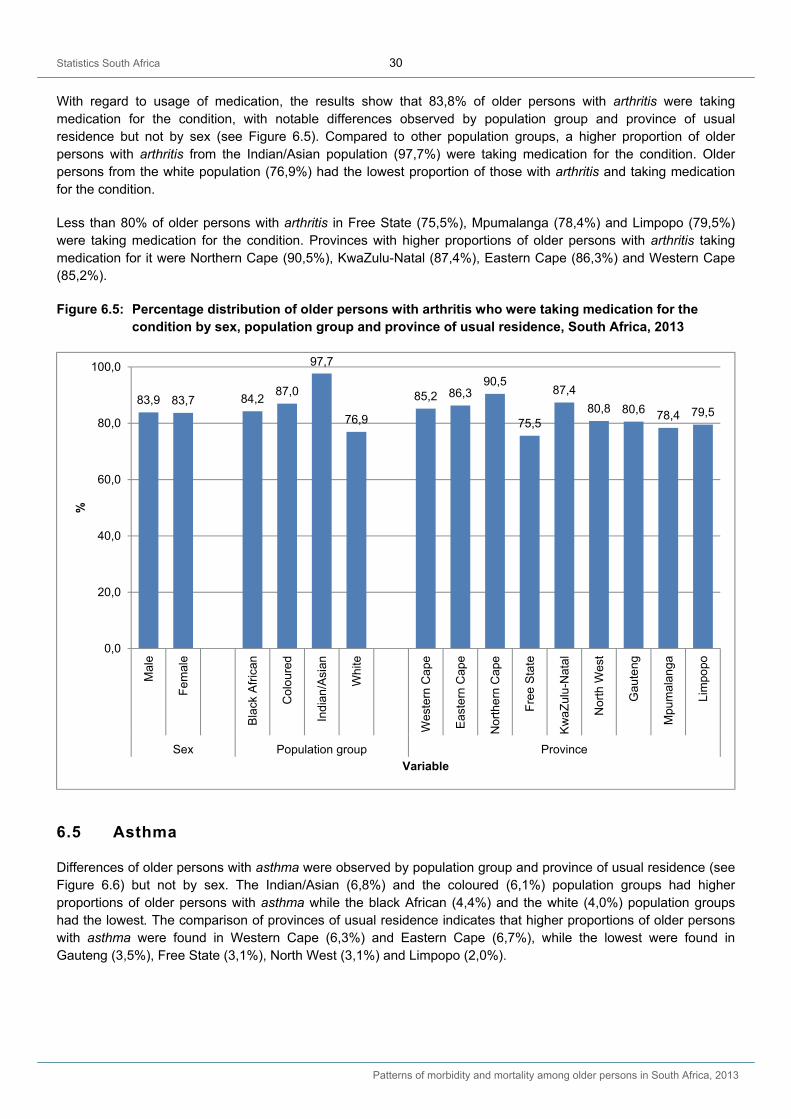
Statistics South Africa 30
Patterns of morbidity and mortality among older persons in South Africa, 2013
With regard to usage of medication, the results show that 83,8% of older persons with arthritis were taking medication for the condition, with notable differences observed by population group and province of usual residence but not by sex (see Figure 6.5). Compared to other population groups, a higher proportion of older persons with arthritis from the Indian/Asian population (97,7%) were taking medication for the condition. Older persons from the white population (76,9%) had the lowest proportion of those with arthritis and taking medication for the condition.
Less than 80% of older persons with arthritis in Free State (75,5%), Mpumalanga (78,4%) and Limpopo (79,5%) were taking medication for the condition. Provinces with higher proportions of older persons with arthritis taking medication for it were Northern Cape (90,5%), KwaZulu-Natal (87,4%), Eastern Cape (86,3%) and Western Cape (85,2%).
Figure 6.5: Percentage distribution of older persons with arthritis who were taking medication for the condition by sex, population group and province of usual residence, South Africa, 2013
6.5 Asthma
Differences of older persons with asthma were observed by population group and province of usual residence (see Figure 6.6) but not by sex. The Indian/Asian (6,8%) and the coloured (6,1%) population groups had higher proportions of older persons with asthma while the black African (4,4%) and the white (4,0%) population groups had the lowest. The comparison of provinces of usual residence indicates that higher proportions of older persons with asthma were found in Western Cape (6,3%) and Eastern Cape (6,7%), while the lowest were found in Gauteng (3,5%), Free State (3,1%), North West (3,1%) and Limpopo (2,0%).
83,9 83,7 84,287,0
97,7
76,9
85,2 86,390,5
75,5
87,4
80,8 80,6 78,4 79,5
0,0
20,0
40,0
60,0
80,0
100,0
Mal
e
Fem
ale
Bla
ck A
fric
an
Co
lour
ed
Ind
ian
/Asi
an
Whi
te
Wes
tern
Ca
pe
Eas
tern
Cap
e
Nor
ther
n C
ape
Fre
e S
tate
Kw
aZul
u-N
atal
No
rth
Wes
t
Gau
teng
Mpu
mal
ang
a
Lim
popo
Sex Population group Province
%
Variable
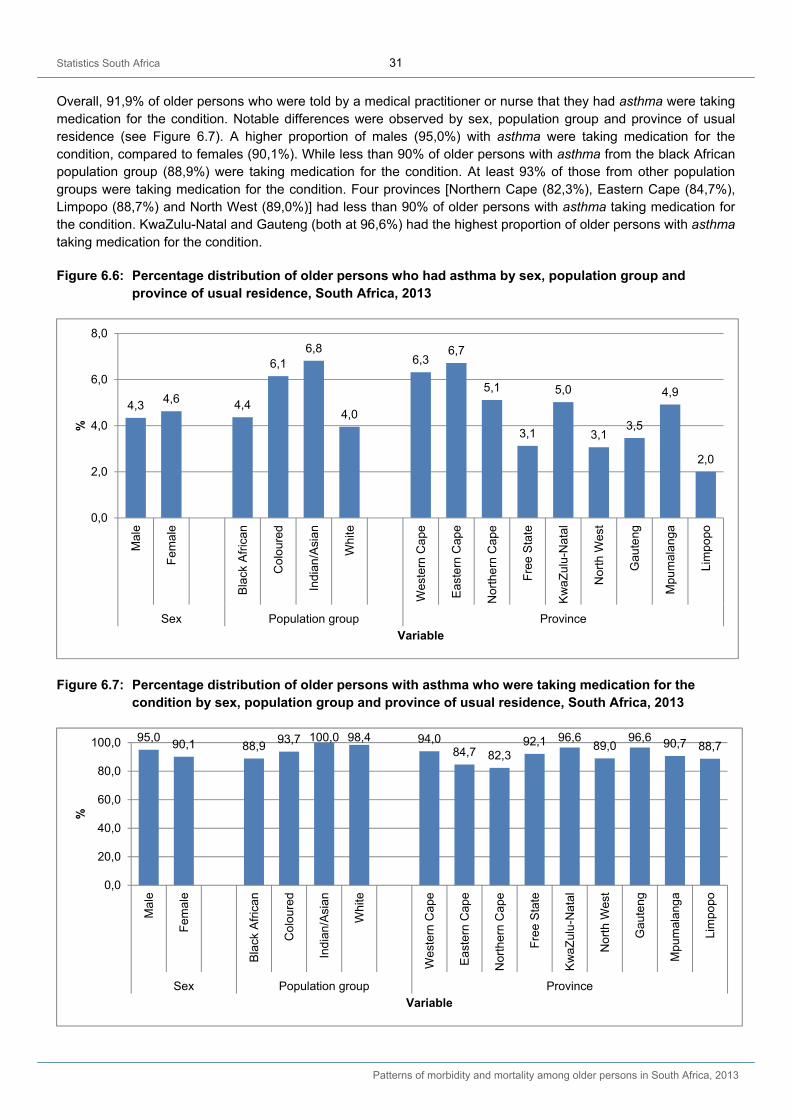
Statistics South Africa 31
Patterns of morbidity and mortality among older persons in South Africa, 2013
Overall, 91,9% of older persons who were told by a medical practitioner or nurse that they had asthma were taking medication for the condition. Notable differences were observed by sex, population group and province of usual residence (see Figure 6.7). A higher proportion of males (95,0%) with asthma were taking medication for the condition, compared to females (90,1%). While less than 90% of older persons with asthma from the black African population group (88,9%) were taking medication for the condition. At least 93% of those from other population groups were taking medication for the condition. Four provinces [Northern Cape (82,3%), Eastern Cape (84,7%), Limpopo (88,7%) and North West (89,0%)] had less than 90% of older persons with asthma taking medication for the condition. KwaZulu-Natal and Gauteng (both at 96,6%) had the highest proportion of older persons with asthma taking medication for the condition.
Figure 6.6: Percentage distribution of older persons who had asthma by sex, population group and province of usual residence, South Africa, 2013
Figure 6.7: Percentage distribution of older persons with asthma who were taking medication for the condition by sex, population group and province of usual residence, South Africa, 2013
4,34,6 4,4
6,16,8
4,0
6,36,7
5,1
3,1
5,0
3,13,5
4,9
2,0
0,0
2,0
4,0
6,0
8,0
Mal
e
Fem
ale
Bla
ck A
fric
an
Co
lour
ed
Ind
ian
/Asi
an
Whi
te
Wes
tern
Ca
pe
Eas
tern
Cap
e
Nor
ther
n C
ape
Fre
e S
tate
Kw
aZul
u-N
atal
No
rth
Wes
t
Gau
teng
Mpu
mal
ang
a
Lim
popo
Sex Population group Province
%
Variable
95,090,1 88,9
93,7 100,0 98,4 94,084,7 82,3
92,1 96,689,0
96,6 90,7 88,7
0,0
20,0
40,0
60,0
80,0
100,0
Mal
e
Fem
ale
Bla
ck A
fric
an
Co
lour
ed
Ind
ian
/Asi
an
Whi
te
Wes
tern
Ca
pe
Eas
tern
Cap
e
Nor
ther
n C
ape
Fre
e S
tate
Kw
aZul
u-N
atal
No
rth
Wes
t
Gau
teng
Mpu
mal
ang
a
Lim
popo
Sex Population group Province
%
Variable
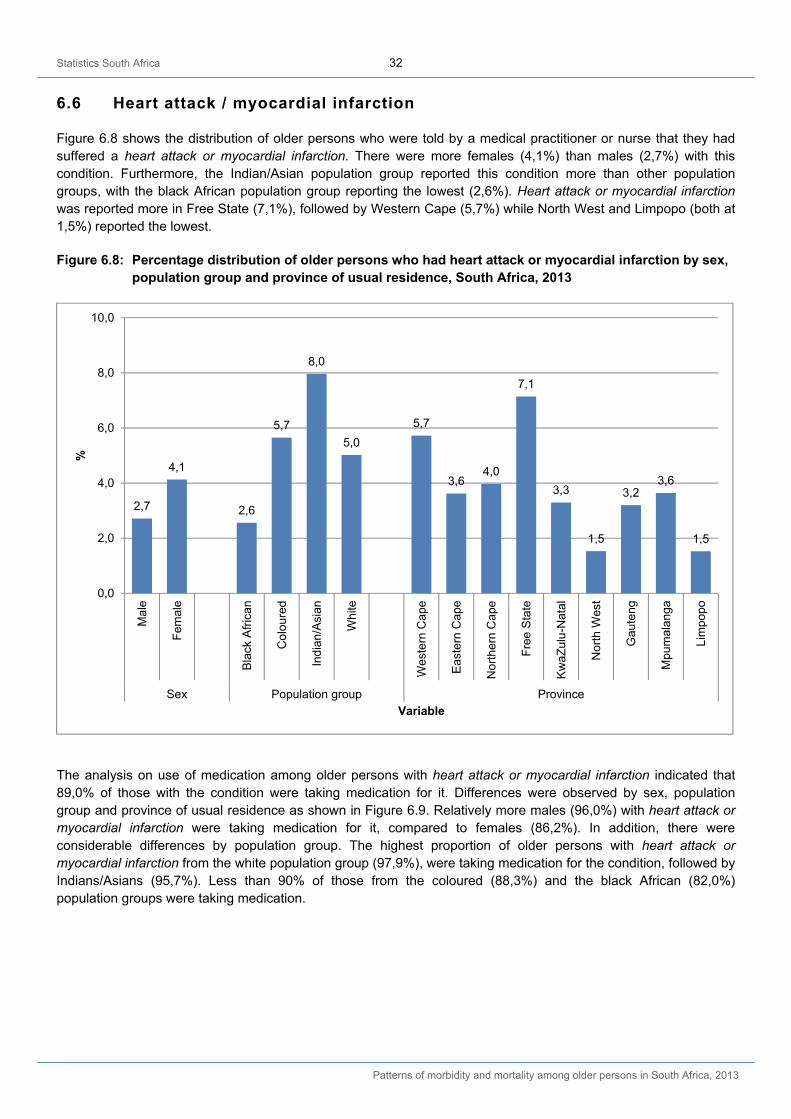
Statistics South Africa 32
Patterns of morbidity and mortality among older persons in South Africa, 2013
6.6 Heart attack / myocardial infarction
Figure 6.8 shows the distribution of older persons who were told by a medical practitioner or nurse that they had suffered a heart attack or myocardial infarction. There were more females (4,1%) than males (2,7%) with this condition. Furthermore, the Indian/Asian population group reported this condition more than other population groups, with the black African population group reporting the lowest (2,6%). Heart attack or myocardial infarction was reported more in Free State (7,1%), followed by Western Cape (5,7%) while North West and Limpopo (both at 1,5%) reported the lowest.
Figure 6.8: Percentage distribution of older persons who had heart attack or myocardial infarction by sex, population group and province of usual residence, South Africa, 2013
The analysis on use of medication among older persons with heart attack or myocardial infarction indicated that 89,0% of those with the condition were taking medication for it. Differences were observed by sex, population group and province of usual residence as shown in Figure 6.9. Relatively more males (96,0%) with heart attack or myocardial infarction were taking medication for it, compared to females (86,2%). In addition, there were considerable differences by population group. The highest proportion of older persons with heart attack or myocardial infarction from the white population group (97,9%), were taking medication for the condition, followed by Indians/Asians (95,7%). Less than 90% of those from the coloured (88,3%) and the black African (82,0%) population groups were taking medication.
2,7
4,1
2,6
5,7
8,0
5,0
5,7
3,64,0
7,1
3,3
1,5
3,23,6
1,5
0,0
2,0
4,0
6,0
8,0
10,0
Mal
e
Fem
ale
Bla
ck A
fric
an
Co
lour
ed
Ind
ian
/Asi
an
Whi
te
Wes
tern
Ca
pe
Eas
tern
Cap
e
Nor
ther
n C
ape
Fre
e S
tate
Kw
aZul
u-N
atal
No
rth
Wes
t
Gau
teng
Mpu
mal
ang
a
Lim
popo
Sex Population group Province
%
Variable
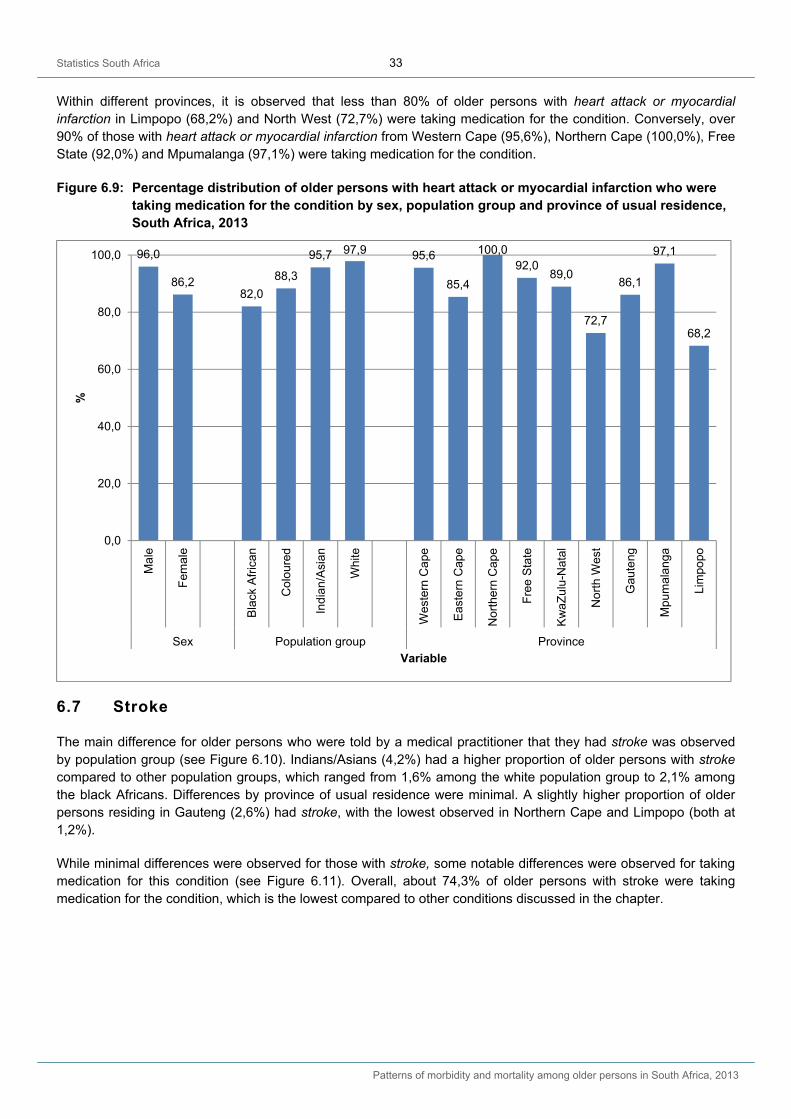
Statistics South Africa 33
Patterns of morbidity and mortality among older persons in South Africa, 2013
Within different provinces, it is observed that less than 80% of older persons with heart attack or myocardial infarction in Limpopo (68,2%) and North West (72,7%) were taking medication for the condition. Conversely, over 90% of those with heart attack or myocardial infarction from Western Cape (95,6%), Northern Cape (100,0%), Free State (92,0%) and Mpumalanga (97,1%) were taking medication for the condition.
Figure 6.9: Percentage distribution of older persons with heart attack or myocardial infarction who were taking medication for the condition by sex, population group and province of usual residence, South Africa, 2013
6.7 Stroke
The main difference for older persons who were told by a medical practitioner that they had stroke was observed by population group (see Figure 6.10). Indians/Asians (4,2%) had a higher proportion of older persons with stroke compared to other population groups, which ranged from 1,6% among the white population group to 2,1% among the black Africans. Differences by province of usual residence were minimal. A slightly higher proportion of older persons residing in Gauteng (2,6%) had stroke, with the lowest observed in Northern Cape and Limpopo (both at 1,2%).
While minimal differences were observed for those with stroke, some notable differences were observed for taking medication for this condition (see Figure 6.11). Overall, about 74,3% of older persons with stroke were taking medication for the condition, which is the lowest compared to other conditions discussed in the chapter.
96,0
86,282,0
88,3
95,7 97,9 95,6
85,4
100,092,0
89,0
72,7
86,1
97,1
68,2
0,0
20,0
40,0
60,0
80,0
100,0
Mal
e
Fem
ale
Bla
ck A
fric
an
Co
lour
ed
Ind
ian
/Asi
an
Whi
te
Wes
tern
Ca
pe
Eas
tern
Cap
e
Nor
ther
n C
ape
Fre
e S
tate
Kw
aZul
u-N
atal
No
rth
Wes
t
Gau
teng
Mpu
mal
ang
a
Lim
popo
Sex Population group Province
%
Variable
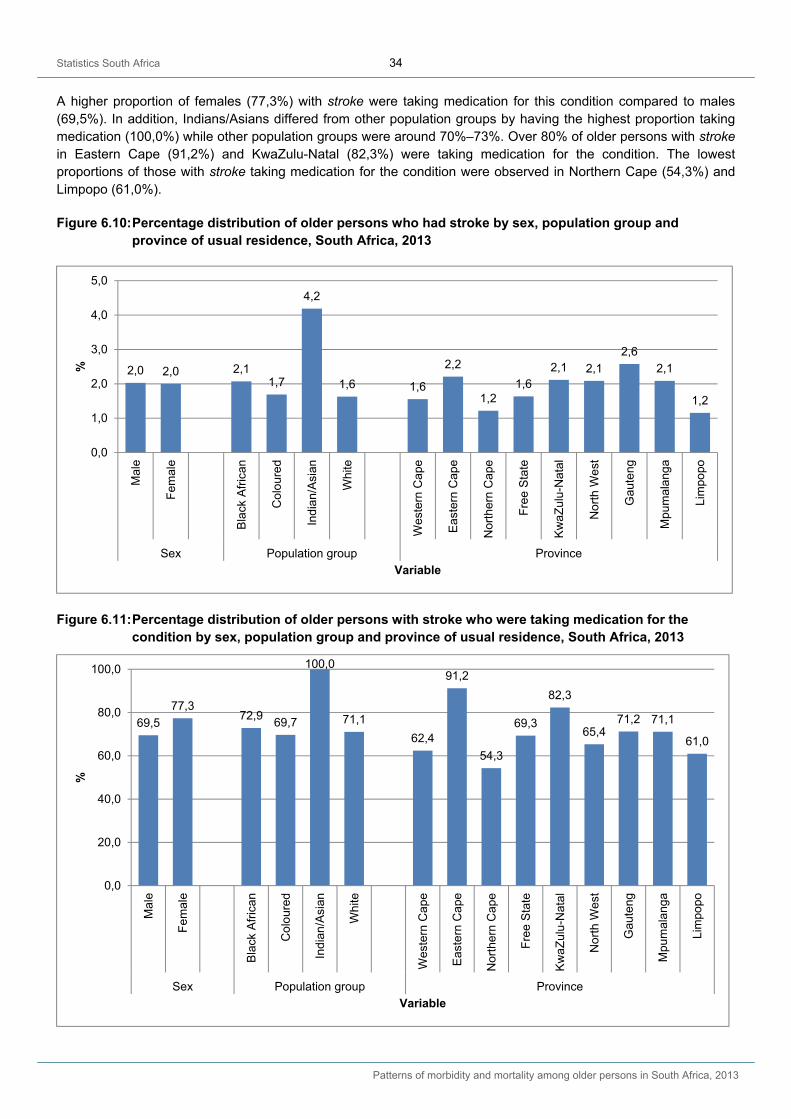
Statistics South Africa 34
Patterns of morbidity and mortality among older persons in South Africa, 2013
A higher proportion of females (77,3%) with stroke were taking medication for this condition compared to males (69,5%). In addition, Indians/Asians differed from other population groups by having the highest proportion taking medication (100,0%) while other population groups were around 70%–73%. Over 80% of older persons with stroke in Eastern Cape (91,2%) and KwaZulu-Natal (82,3%) were taking medication for the condition. The lowest proportions of those with stroke taking medication for the condition were observed in Northern Cape (54,3%) and Limpopo (61,0%).
Figure 6.10: Percentage distribution of older persons who had stroke by sex, population group and province of usual residence, South Africa, 2013
Figure 6.11: Percentage distribution of older persons with stroke who were taking medication for the condition by sex, population group and province of usual residence, South Africa, 2013
2,0 2,0 2,11,7
4,2
1,6 1,6
2,2
1,21,6
2,1 2,1
2,6
2,1
1,2
0,0
1,0
2,0
3,0
4,0
5,0
Mal
e
Fem
ale
Bla
ck A
fric
an
Co
lour
ed
Ind
ian
/Asi
an
Whi
te
Wes
tern
Ca
pe
Eas
tern
Cap
e
Nor
ther
n C
ape
Fre
e S
tate
Kw
aZul
u-N
atal
No
rth
Wes
t
Gau
teng
Mpu
mal
ang
a
Lim
popo
Sex Population group Province
%
Variable
69,5
77,372,9
69,7
100,0
71,1
62,4
91,2
54,3
69,3
82,3
65,471,2 71,1
61,0
0,0
20,0
40,0
60,0
80,0
100,0
Mal
e
Fem
ale
Bla
ck A
fric
an
Co
lour
ed
Ind
ian
/Asi
an
Whi
te
Wes
tern
Ca
pe
Eas
tern
Cap
e
Nor
ther
n C
ape
Fre
e S
tate
Kw
aZul
u-N
atal
No
rth
Wes
t
Gau
teng
Mpu
mal
ang
a
Lim
popo
Sex Population group Province
%
Variable
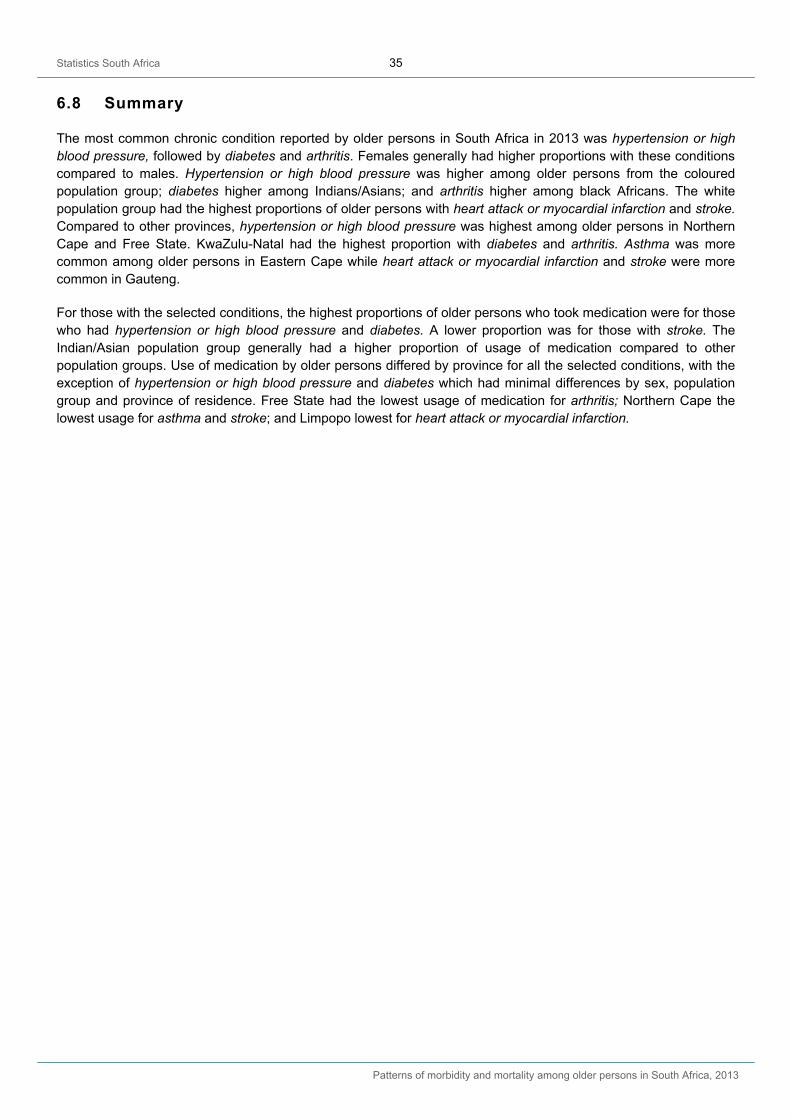
Statistics South Africa 35
Patterns of morbidity and mortality among older persons in South Africa, 2013
6.8 Summary
The most common chronic condition reported by older persons in South Africa in 2013 was hypertension or high blood pressure, followed by diabetes and arthritis. Females generally had higher proportions with these conditions compared to males. Hypertension or high blood pressure was higher among older persons from the coloured population group; diabetes higher among Indians/Asians; and arthritis higher among black Africans. The white population group had the highest proportions of older persons with heart attack or myocardial infarction and stroke. Compared to other provinces, hypertension or high blood pressure was highest among older persons in Northern Cape and Free State. KwaZulu-Natal had the highest proportion with diabetes and arthritis. Asthma was more common among older persons in Eastern Cape while heart attack or myocardial infarction and stroke were more common in Gauteng.
For those with the selected conditions, the highest proportions of older persons who took medication were for those who had hypertension or high blood pressure and diabetes. A lower proportion was for those with stroke. The Indian/Asian population group generally had a higher proportion of usage of medication compared to other population groups. Use of medication by older persons differed by province for all the selected conditions, with the exception of hypertension or high blood pressure and diabetes which had minimal differences by sex, population group and province of residence. Free State had the lowest usage of medication for arthritis; Northern Cape the lowest usage for asthma and stroke; and Limpopo lowest for heart attack or myocardial infarction.
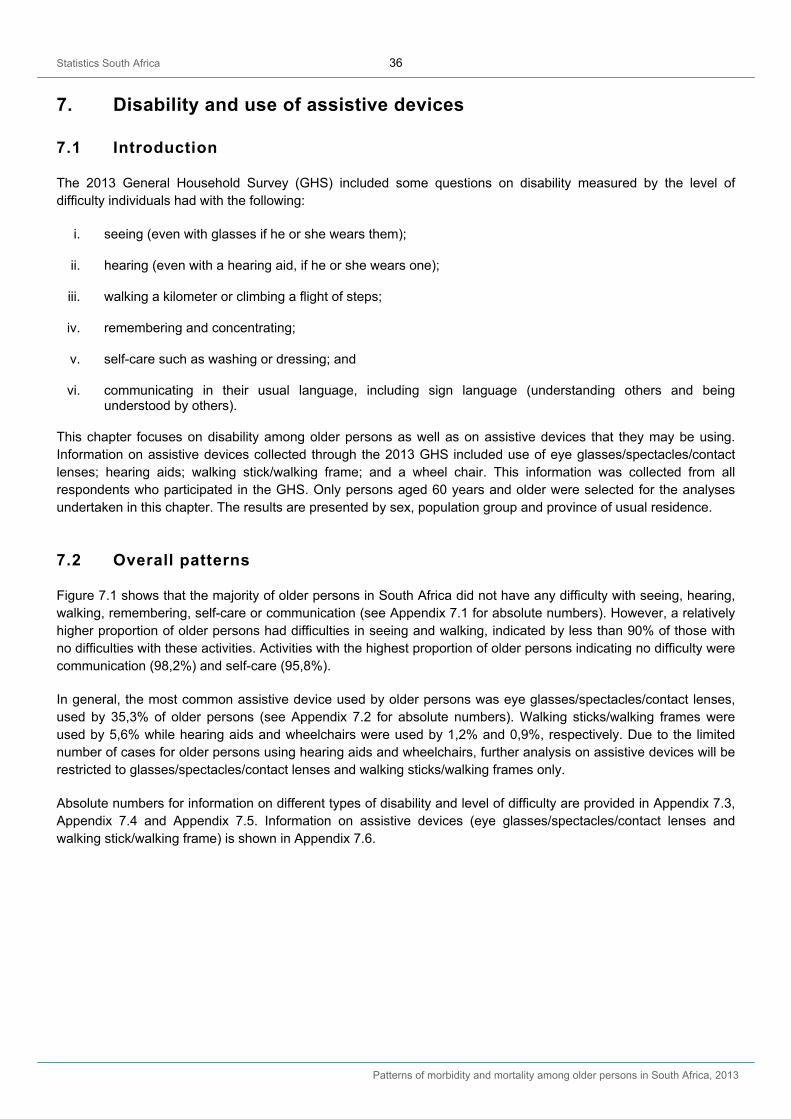
Statistics South Africa 36
Patterns of morbidity and mortality among older persons in South Africa, 2013
7. Disability and use of assistive devices
7.1 Introduction
The 2013 General Household Survey (GHS) included some questions on disability measured by the level of difficulty individuals had with the following:
i. seeing (even with glasses if he or she wears them);
ii. hearing (even with a hearing aid, if he or she wears one);
iii. walking a kilometer or climbing a flight of steps;
iv. remembering and concentrating;
v. self-care such as washing or dressing; and
vi. communicating in their usual language, including sign language (understanding others and being understood by others).
This chapter focuses on disability among older persons as well as on assistive devices that they may be using. Information on assistive devices collected through the 2013 GHS included use of eye glasses/spectacles/contact lenses; hearing aids; walking stick/walking frame; and a wheel chair. This information was collected from all respondents who participated in the GHS. Only persons aged 60 years and older were selected for the analyses undertaken in this chapter. The results are presented by sex, population group and province of usual residence.
7.2 Overall patterns
Figure 7.1 shows that the majority of older persons in South Africa did not have any difficulty with seeing, hearing, walking, remembering, self-care or communication (see Appendix 7.1 for absolute numbers). However, a relatively higher proportion of older persons had difficulties in seeing and walking, indicated by less than 90% of those with no difficulties with these activities. Activities with the highest proportion of older persons indicating no difficulty were communication (98,2%) and self-care (95,8%).
In general, the most common assistive device used by older persons was eye glasses/spectacles/contact lenses, used by 35,3% of older persons (see Appendix 7.2 for absolute numbers). Walking sticks/walking frames were used by 5,6% while hearing aids and wheelchairs were used by 1,2% and 0,9%, respectively. Due to the limited number of cases for older persons using hearing aids and wheelchairs, further analysis on assistive devices will be restricted to glasses/spectacles/contact lenses and walking sticks/walking frames only.
Absolute numbers for information on different types of disability and level of difficulty are provided in Appendix 7.3, Appendix 7.4 and Appendix 7.5. Information on assistive devices (eye glasses/spectacles/contact lenses and walking stick/walking frame) is shown in Appendix 7.6.
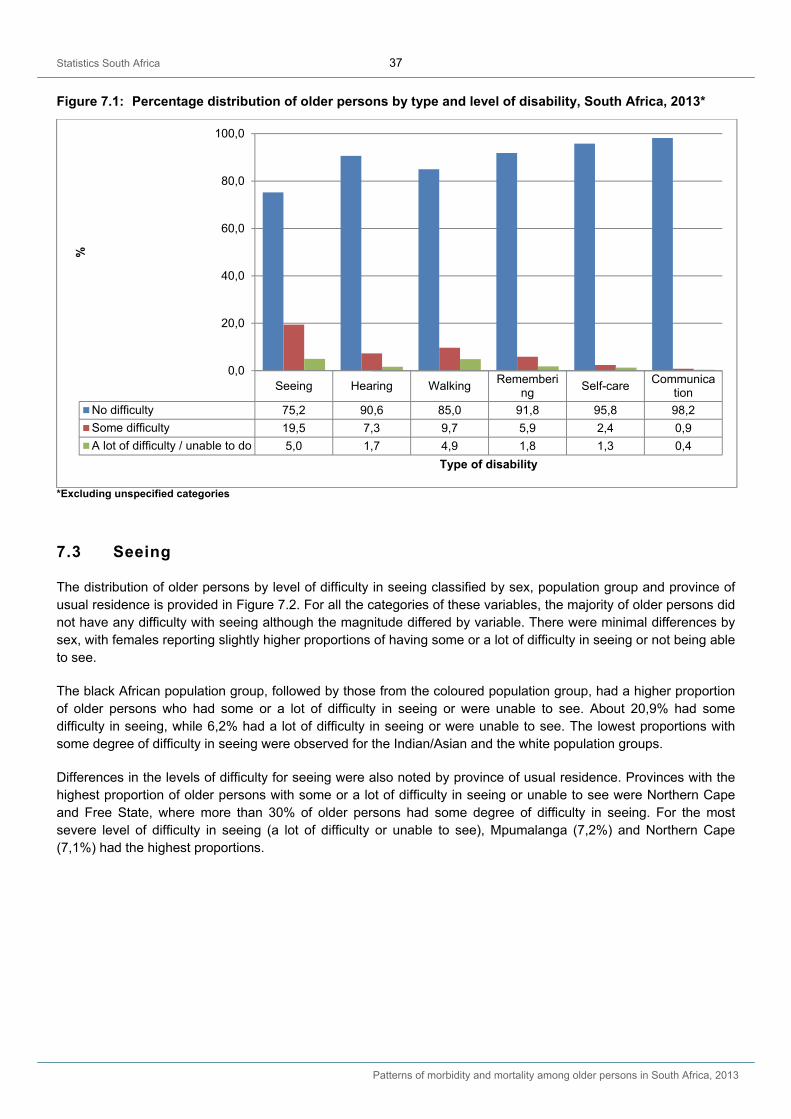
Statistics South Africa 37
Patterns of morbidity and mortality among older persons in South Africa, 2013
Figure 7.1: Percentage distribution of older persons by type and level of disability, South Africa, 2013*
*Excluding unspecified categories
7.3 Seeing
The distribution of older persons by level of difficulty in seeing classified by sex, population group and province of usual residence is provided in Figure 7.2. For all the categories of these variables, the majority of older persons did not have any difficulty with seeing although the magnitude differed by variable. There were minimal differences by sex, with females reporting slightly higher proportions of having some or a lot of difficulty in seeing or not being able to see.
The black African population group, followed by those from the coloured population group, had a higher proportion of older persons who had some or a lot of difficulty in seeing or were unable to see. About 20,9% had some difficulty in seeing, while 6,2% had a lot of difficulty in seeing or were unable to see. The lowest proportions with some degree of difficulty in seeing were observed for the Indian/Asian and the white population groups.
Differences in the levels of difficulty for seeing were also noted by province of usual residence. Provinces with the highest proportion of older persons with some or a lot of difficulty in seeing or unable to see were Northern Cape and Free State, where more than 30% of older persons had some degree of difficulty in seeing. For the most severe level of difficulty in seeing (a lot of difficulty or unable to see), Mpumalanga (7,2%) and Northern Cape (7,1%) had the highest proportions.
Seeing Hearing WalkingRememberi
ngSelf-care
Communication
No difficulty 75,2 90,6 85,0 91,8 95,8 98,2
Some difficulty 19,5 7,3 9,7 5,9 2,4 0,9
A lot of difficulty / unable to do 5,0 1,7 4,9 1,8 1,3 0,4
0,0
20,0
40,0
60,0
80,0
100,0
%
Type of disability
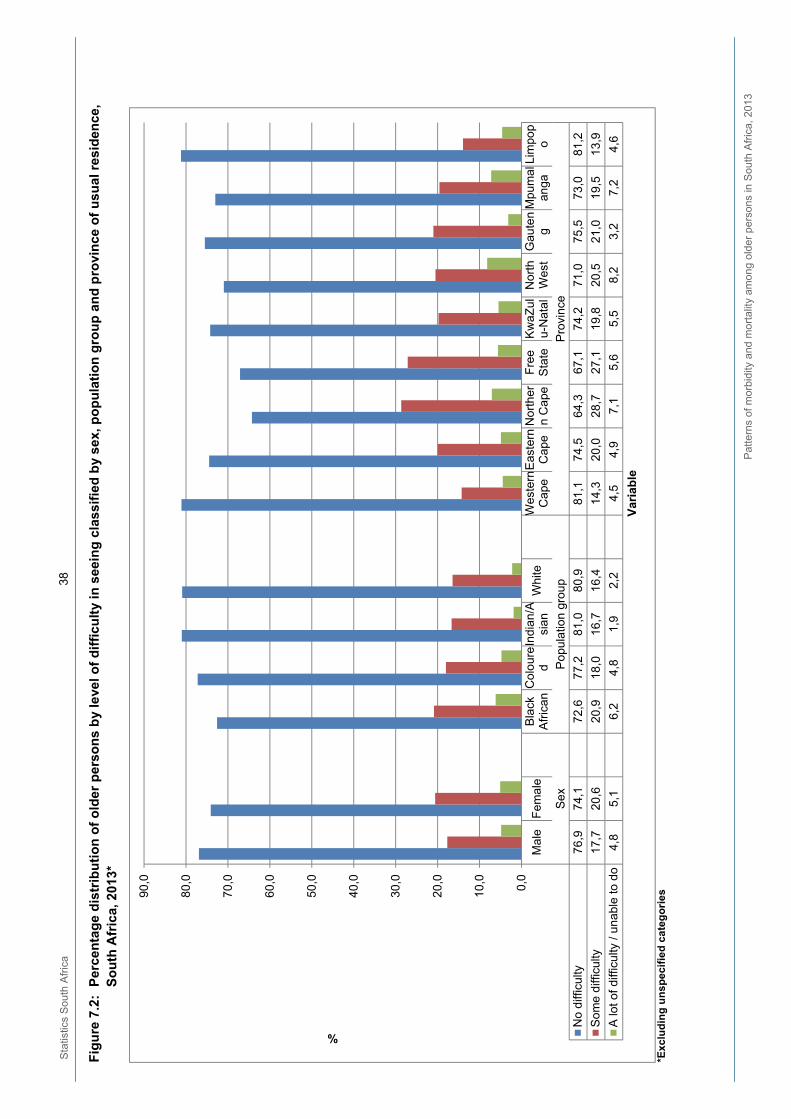
Sta
tistic
s S
outh
Afr
ica
38
P
atte
rns
of m
orbi
dity
and
mo
rtal
ity a
mon
g ol
der
per
sons
in S
outh
Afr
ica,
201
3
Fig
ure
7.2
: P
erce
nta
ge
dis
trib
uti
on
of
old
er p
erso
ns
by
leve
l o
f d
iffi
cult
y in
see
ing
cla
ssif
ied
by
sex,
po
pu
lati
on
gro
up
an
d p
rovi
nce
of
usu
al r
esid
ence
, S
ou
th A
fric
a, 2
013*
*Exc
lud
ing
un
sp
ecif
ied
ca
teg
ori
es
Mal
eF
emal
eB
lack
Afr
ican
Co
lour
ed
Indi
an/A
sian
Whi
teW
este
rnC
ape
Eas
tern
Ca
peN
ort
her
n C
ape
Fre
eS
tate
Kw
aZul
u-N
atal
No
rth
Wes
tG
aute
ng
Mpu
mal
anga
Lim
pop
o
Se
xP
opu
latio
n gr
oup
Pro
vinc
e
No
diff
icul
ty76
,974
,172
,677
,281
,080
,981
,174
,564
,367
,174
,271
,075
,573
,081
,2
Som
e d
iffic
ulty
17,7
20,6
20,9
18,0
16,7
16,4
14,3
20,0
28,7
27,1
19,8
20,5
21,0
19,5
13,9
A lo
t of
diffi
culty
/ u
nabl
e to
do
4,8
5,1
6,2
4,8
1,9
2,2
4,5
4,9
7,1
5,6
5,5
8,2
3,2
7,2
4,6
0,0
10,0
20,0
30,0
40,0
50,0
60,0
70,0
80,0
90,0
%
Var
iab
le
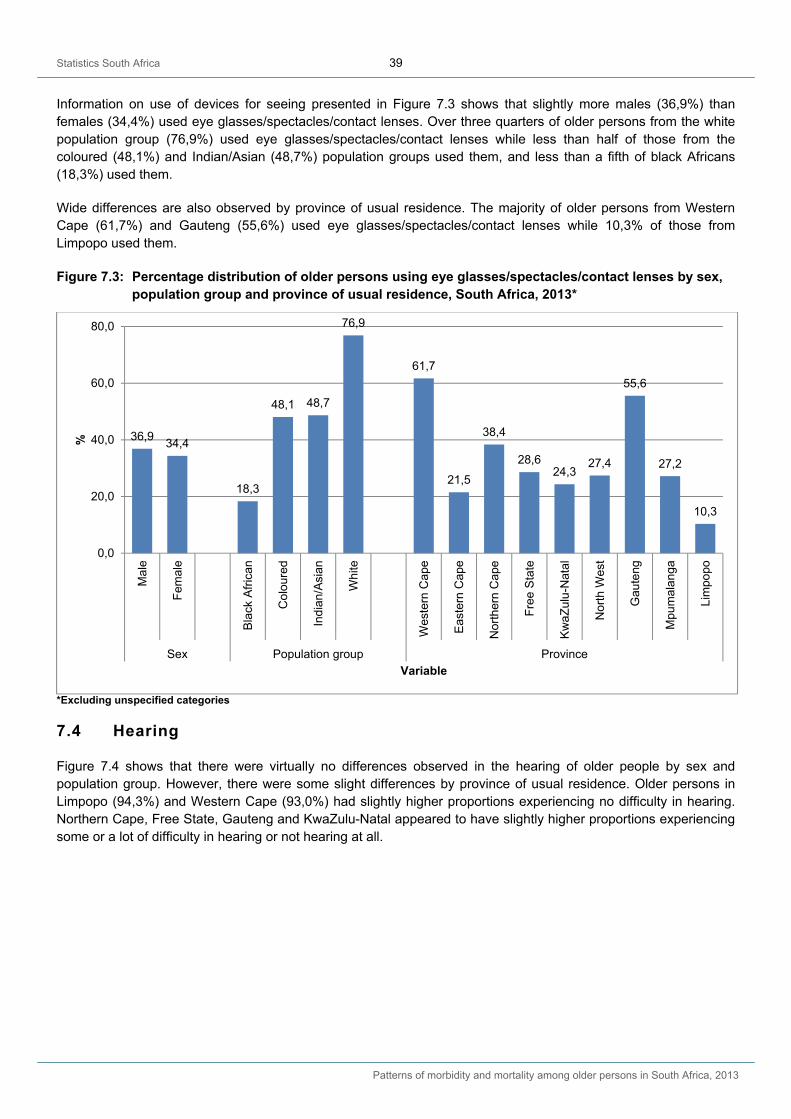
Statistics South Africa 39
Patterns of morbidity and mortality among older persons in South Africa, 2013
Information on use of devices for seeing presented in Figure 7.3 shows that slightly more males (36,9%) than females (34,4%) used eye glasses/spectacles/contact lenses. Over three quarters of older persons from the white population group (76,9%) used eye glasses/spectacles/contact lenses while less than half of those from the coloured (48,1%) and Indian/Asian (48,7%) population groups used them, and less than a fifth of black Africans (18,3%) used them.
Wide differences are also observed by province of usual residence. The majority of older persons from Western Cape (61,7%) and Gauteng (55,6%) used eye glasses/spectacles/contact lenses while 10,3% of those from Limpopo used them.
Figure 7.3: Percentage distribution of older persons using eye glasses/spectacles/contact lenses by sex, population group and province of usual residence, South Africa, 2013*
*Excluding unspecified categories
7.4 Hearing
Figure 7.4 shows that there were virtually no differences observed in the hearing of older people by sex and population group. However, there were some slight differences by province of usual residence. Older persons in Limpopo (94,3%) and Western Cape (93,0%) had slightly higher proportions experiencing no difficulty in hearing. Northern Cape, Free State, Gauteng and KwaZulu-Natal appeared to have slightly higher proportions experiencing some or a lot of difficulty in hearing or not hearing at all.
36,934,4
18,3
48,1 48,7
76,9
61,7
21,5
38,4
28,624,3
27,4
55,6
27,2
10,3
0,0
20,0
40,0
60,0
80,0
Mal
e
Fem
ale
Bla
ck A
fric
an
Co
lour
ed
Ind
ian
/Asi
an
Whi
te
Wes
tern
Ca
pe
Eas
tern
Cap
e
Nor
ther
n C
ape
Fre
e S
tate
Kw
aZul
u-N
atal
No
rth
Wes
t
Gau
teng
Mpu
mal
ang
a
Lim
popo
Sex Population group Province
%
Variable
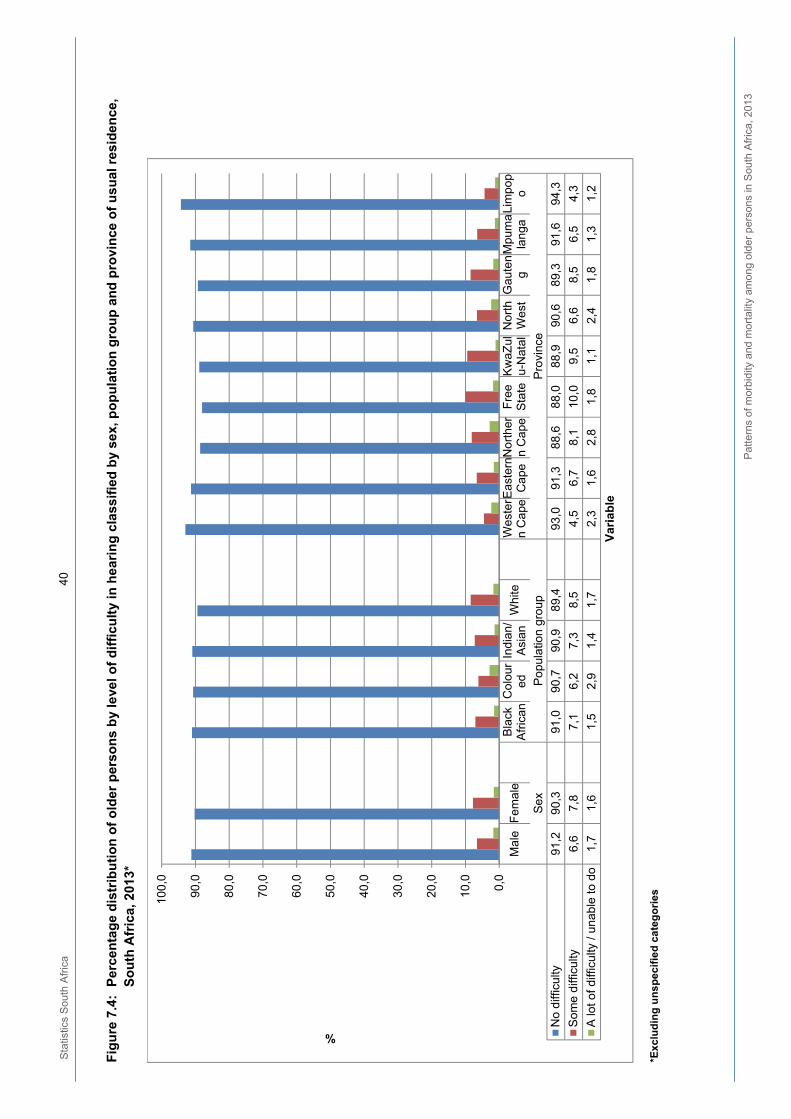
Sta
tistic
s S
outh
Afr
ica
40
P
atte
rns
of m
orbi
dity
and
mo
rtal
ity a
mon
g ol
der
per
sons
in S
outh
Afr
ica,
201
3
Fig
ure
7.4
: P
erce
nta
ge
dis
trib
uti
on
of
old
er p
erso
ns
by
leve
l o
f d
iffi
cult
y in
hea
rin
g c
lass
ifie
d b
y se
x, p
op
ula
tio
n g
rou
p a
nd
pro
vin
ce o
f u
sual
res
iden
ce,
So
uth
Afr
ica,
201
3*
*Exc
lud
ing
un
sp
ecif
ied
ca
teg
ori
es
Mal
eF
emal
eB
lack
Afr
ican
Co
lour
edIn
dian
/A
sian
Whi
teW
este
rn
Ca
peE
aste
rnC
ape
No
rth
ern
Ca
peF
ree
Sta
teK
waZ
ulu-
Nat
alN
ort
hW
est
Gau
ten
gM
pum
ala
nga
Lim
pop
o
Se
xP
opu
latio
n gr
oup
Pro
vinc
e
No
diff
icul
ty91
,290
,391
,090
,790
,989
,493
,091
,388
,688
,088
,990
,689
,391
,694
,3
Som
e d
iffic
ulty
6,6
7,8
7,1
6,2
7,3
8,5
4,5
6,7
8,1
10,0
9,5
6,6
8,5
6,5
4,3
A lo
t of
diffi
culty
/ u
nabl
e to
do
1,7
1,6
1,5
2,9
1,4
1,7
2,3
1,6
2,8
1,8
1,1
2,4
1,8
1,3
1,2
0,0
10,0
20,0
30,0
40,0
50,0
60,0
70,0
80,0
90,0
100,
0
%
Var
iab
le
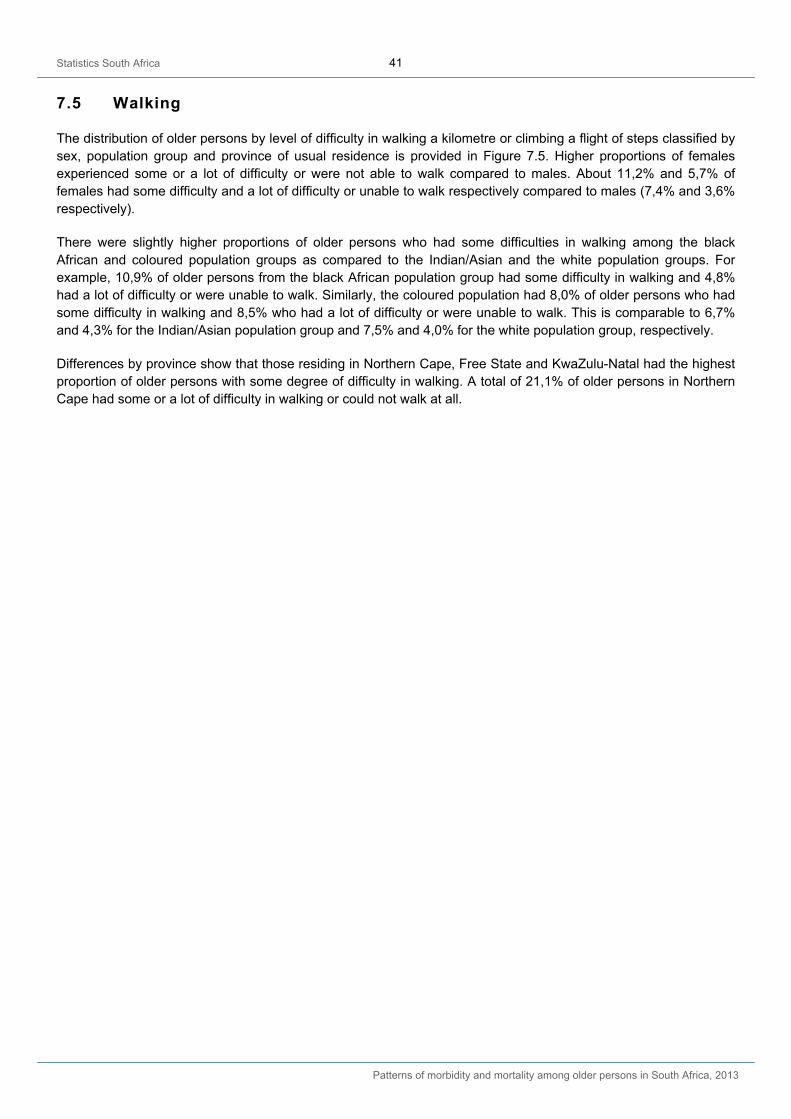
Statistics South Africa 41
Patterns of morbidity and mortality among older persons in South Africa, 2013
7.5 Walking
The distribution of older persons by level of difficulty in walking a kilometre or climbing a flight of steps classified by sex, population group and province of usual residence is provided in Figure 7.5. Higher proportions of females experienced some or a lot of difficulty or were not able to walk compared to males. About 11,2% and 5,7% of females had some difficulty and a lot of difficulty or unable to walk respectively compared to males (7,4% and 3,6% respectively).
There were slightly higher proportions of older persons who had some difficulties in walking among the black African and coloured population groups as compared to the Indian/Asian and the white population groups. For example, 10,9% of older persons from the black African population group had some difficulty in walking and 4,8% had a lot of difficulty or were unable to walk. Similarly, the coloured population had 8,0% of older persons who had some difficulty in walking and 8,5% who had a lot of difficulty or were unable to walk. This is comparable to 6,7% and 4,3% for the Indian/Asian population group and 7,5% and 4,0% for the white population group, respectively.
Differences by province show that those residing in Northern Cape, Free State and KwaZulu-Natal had the highest proportion of older persons with some degree of difficulty in walking. A total of 21,1% of older persons in Northern Cape had some or a lot of difficulty in walking or could not walk at all.
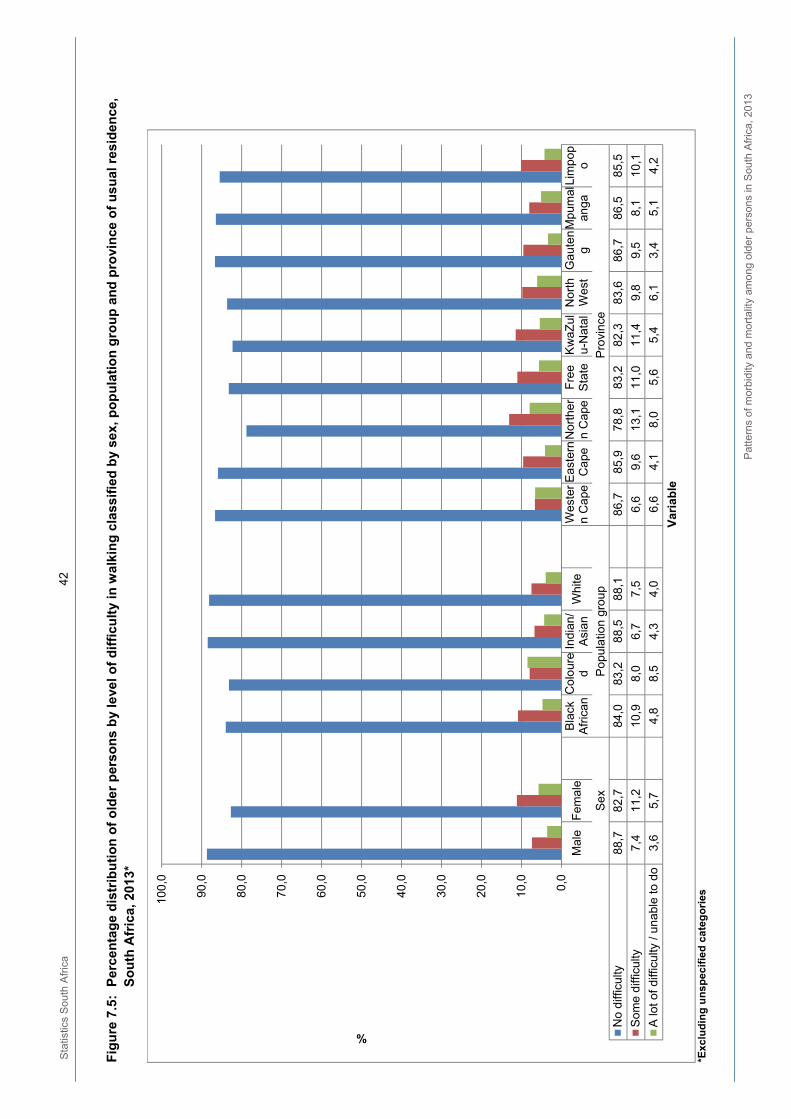
Sta
tistic
s S
outh
Afr
ica
42
P
atte
rns
of m
orbi
dity
and
mo
rtal
ity a
mon
g ol
der
per
sons
in S
outh
Afr
ica,
201
3
Fig
ure
7.5
: P
erce
nta
ge
dis
trib
uti
on
of
old
er p
erso
ns
by
leve
l o
f d
iffi
cult
y in
wal
kin
g c
lass
ifie
d b
y se
x, p
op
ula
tio
n g
rou
p a
nd
pro
vin
ce o
f u
sual
res
iden
ce,
So
uth
Afr
ica,
201
3*
*Exc
lud
ing
un
sp
ecif
ied
ca
teg
ori
es
Mal
eF
emal
eB
lack
Afr
ican
Co
lour
ed
Indi
an/
Asi
anW
hite
Wes
ter
n C
ape
Eas
tern
Ca
peN
ort
her
n C
ape
Fre
eS
tate
Kw
aZul
u-N
atal
No
rth
Wes
tG
au
ten
gM
pum
alan
gaLi
mpo
po
Se
xP
opu
latio
n gr
oup
Pro
vinc
e
No
diff
icul
ty88
,782
,784
,083
,288
,588
,186
,785
,978
,883
,282
,383
,686
,786
,585
,5
Som
e d
iffic
ulty
7,4
11,2
10,9
8,0
6,7
7,5
6,6
9,6
13,1
11,0
11,4
9,8
9,5
8,1
10,1
A lo
t of
diffi
culty
/ u
nabl
e to
do
3,6
5,7
4,8
8,5
4,3
4,0
6,6
4,1
8,0
5,6
5,4
6,1
3,4
5,1
4,2
0,0
10,0
20,0
30,0
40,0
50,0
60,0
70,0
80,0
90,0
100,
0
%
Var
iab
le
Statistics South Africa 43
Patterns of morbidity and mortality among older persons in South Africa, 2013
Figure 7.6 shows that the use of a walking stick/walking frame by older persons was higher among females (6,4%) compared to males (4,4%). It was also higher among black Africans (6,7%) compared to other population groups (around 4% of each population group). The distribution by province of usual residence shows that older persons in North West (10,2%), followed by those in Eastern Cape (7,3%), Free State (6,8%) and Limpopo (6,7%) had the highest proportion using walking stick/walking frame. Older persons in Gauteng (3,3%) and Western Cape (3,6%) had the lowest proportion of older persons using walking sticks/walking frames.
Figure 7.6: Percentage distribution of older persons using a walking stick/walking frame by sex, population group and province of usual residence of usual residence, South Africa, 2013*
*Excluding unspecified categories
7.6 Remembering
Over 90% of each of the categories of sex and population group did not have difficulty in remembering or concentrating (see Figure 7.7). However, slightly more females than males had some difficulty or a lot of difficulty in remembering or concentrating or could not remember or concentrate at all.
The black African and coloured population groups also had slightly higher percentages of older persons who had difficulties in remembering or concentrating as compared to the Indian/Asian and the white population groups. At least a total of 8,7% of the black African and the coloured population groups had some degree of difficulty in remembering or concentrating, while less than 4% had a similar problem among older persons from the white population group.
Older persons in Limpopo (96,9%), Gauteng (95,1%), Western Cape (93,9%) and Mpumalanga (93,8%) had the highest proportion with no difficulty in remembering or concentrating. Those in Northern Cape, North West, Free State and KwaZulu-Natal had a higher proportion with some degree of difficulty in remembering and concentrating.
4,4
6,4 6,7
4,0 4,43,5 3,6
7,3
4,1
6,86,1
10,2
3,3
5,6
6,7
0,0
2,0
4,0
6,0
8,0
10,0
12,0
Mal
e
Fem
ale
Bla
ck A
fric
an
Co
lour
ed
Ind
ian
/Asi
an
Whi
te
Wes
tern
Ca
pe
Eas
tern
Cap
e
Nor
ther
n C
ape
Fre
e S
tate
Kw
aZul
u-N
atal
No
rth
Wes
t
Gau
teng
Mpu
mal
ang
a
Lim
popo
Sex Population group Province
%
Variable
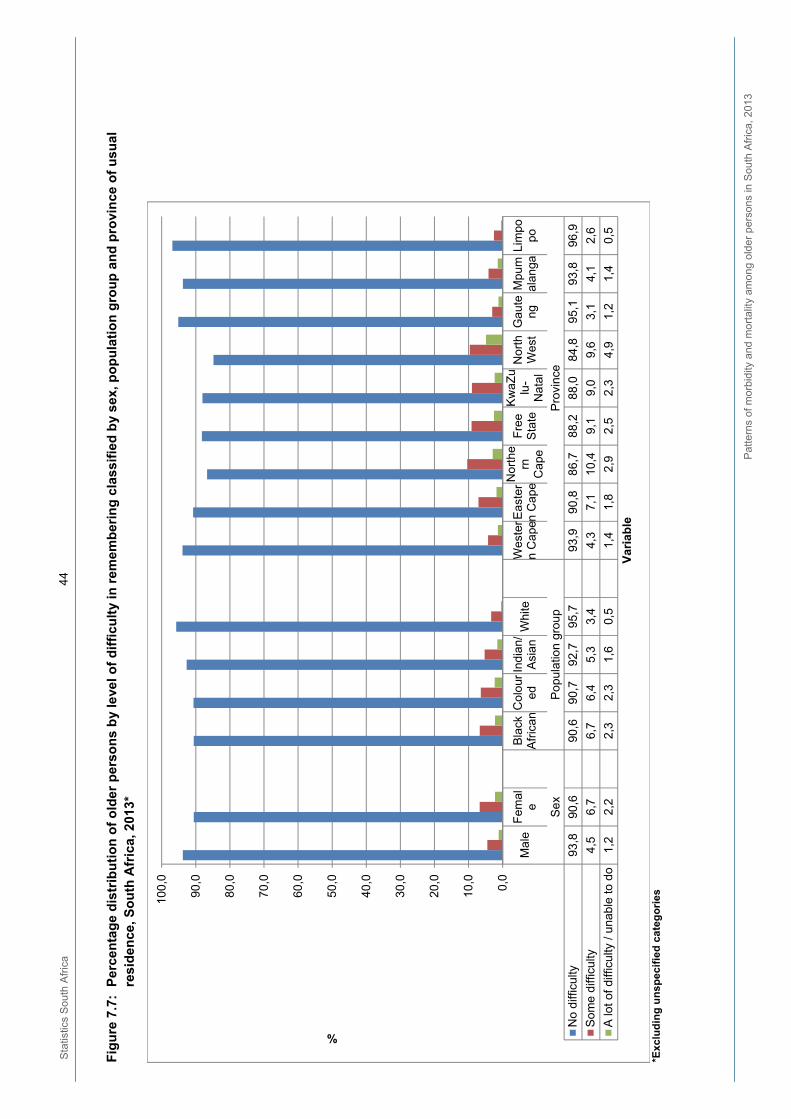
Sta
tistic
s S
outh
Afr
ica
44
P
atte
rns
of m
orbi
dity
and
mo
rtal
ity a
mon
g ol
der
per
sons
in S
outh
Afr
ica,
201
3
Fig
ure
7.7
: P
erce
nta
ge
dis
trib
uti
on
of
old
er p
erso
ns
by
leve
l o
f d
iffi
cult
y in
rem
emb
erin
g c
lass
ifie
d b
y se
x, p
op
ula
tio
n g
rou
p a
nd
pro
vin
ce o
f u
sual
re
sid
ence
, So
uth
Afr
ica,
201
3*
*E
xclu
din
g u
ns
pec
ifie
d c
ate
go
ries
Mal
eF
emal
eB
lack
Afr
ican
Co
lour
edIn
dian
/A
sian
Whi
teW
este
rn
Ca
peE
aste
rn
Ca
pe
No
rth
ern
Ca
pe
Fre
eS
tate
Kw
aZu
lu-
Na
tal
No
rth
Wes
tG
aute
ngM
pum
alan
gaLi
mpo
po
Se
xP
opu
latio
n gr
oup
Pro
vinc
e
No
diff
icul
ty93
,890
,690
,690
,792
,795
,793
,990
,886
,788
,288
,084
,895
,193
,896
,9
Som
e d
iffic
ulty
4,5
6,7
6,7
6,4
5,3
3,4
4,3
7,1
10,4
9,1
9,0
9,6
3,1
4,1
2,6
A lo
t of
diffi
culty
/ u
nabl
e to
do
1,2
2,2
2,3
2,3
1,6
0,5
1,4
1,8
2,9
2,5
2,3
4,9
1,2
1,4
0,5
0,0
10,0
20,0
30,0
40,0
50,0
60,0
70,0
80,0
90,0
100,
0
%
Var
iab
le
Statistics South Africa 45
Patterns of morbidity and mortality among older persons in South Africa, 2013
7.7 Other disabilities
Almost all older persons did not have any difficulty in self-care and communication and there were no notable differences by sex, population group and province of usual residence for these two types of disability. As such, no further information is provided on these two types of disability.
7.8 Summary
The majority of older persons in South Africa did not have any difficulty with seeing, hearing, walking, remembering/concentrating, self-care or communication, although the magnitude differed by type of disability. Disabilities with relatively higher proportions of older persons who had some or a lot of difficulties or could not do at all were seeing and walking.
A larger proportion of females compared to males had more difficulties with seeing, hearing, walking and remembering/concentrating. Older persons from the black African and coloured population groups had higher proportions with some degree of difficulty for seeing, walking and concentrating/remembering than other population groups. Differences were noted by province of usual residence but older persons in Northern Cape, Free State and KwaZulu-Natal appeared to experience more difficulties than those in other provinces.
The most common assistive devices used by older persons were eye glasses/spectacles/contact lenses and walking sticks/walking frames. Compared to others in the same category, males, the white population group, and those residing in Western Cape and Gauteng had higher proportions of older persons using eye glasses/spectacles/contact lenses. For those using walking sticks/walking frames, higher proportions were observed for females, black Africans, and those residing in North West, Eastern Cape, Limpopo and Free State.
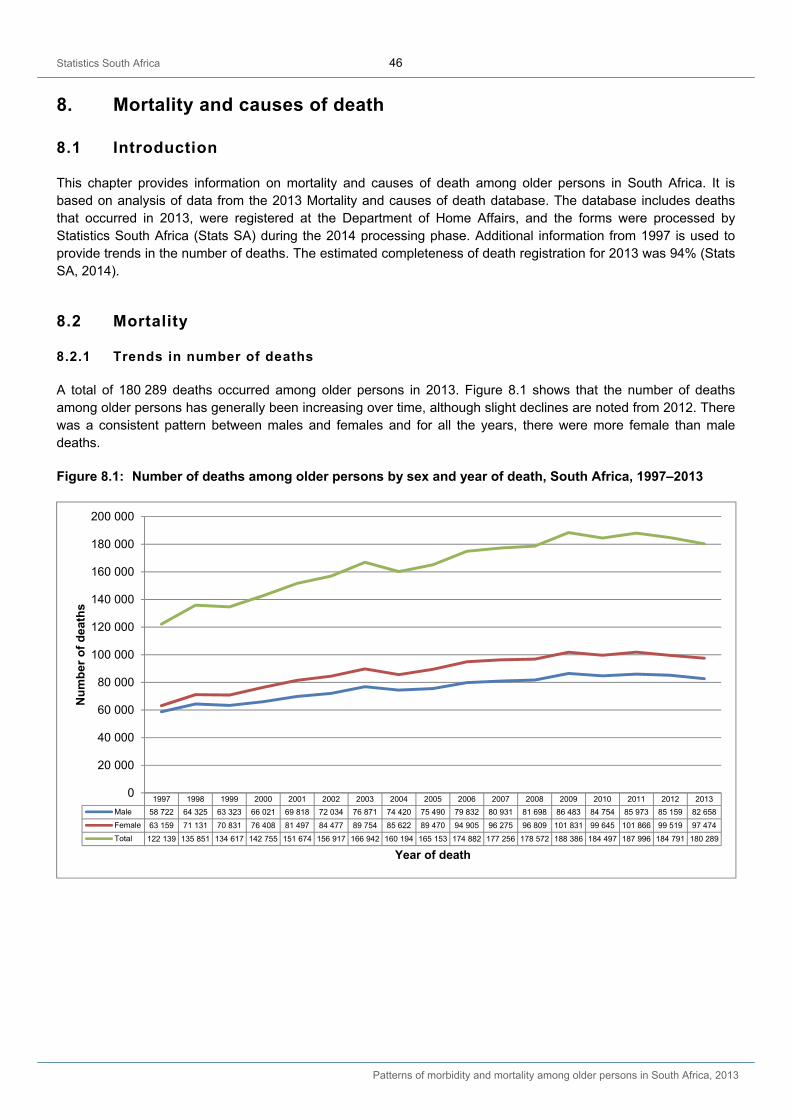
Statistics South Africa 46
Patterns of morbidity and mortality among older persons in South Africa, 2013
8. Mortality and causes of death
8.1 Introduction
This chapter provides information on mortality and causes of death among older persons in South Africa. It is based on analysis of data from the 2013 Mortality and causes of death database. The database includes deaths that occurred in 2013, were registered at the Department of Home Affairs, and the forms were processed by Statistics South Africa (Stats SA) during the 2014 processing phase. Additional information from 1997 is used to provide trends in the number of deaths. The estimated completeness of death registration for 2013 was 94% (Stats SA, 2014).
8.2 Mortality
8.2.1 Trends in number of deaths
A total of 180 289 deaths occurred among older persons in 2013. Figure 8.1 shows that the number of deaths among older persons has generally been increasing over time, although slight declines are noted from 2012. There was a consistent pattern between males and females and for all the years, there were more female than male deaths.
Figure 8.1: Number of deaths among older persons by sex and year of death, South Africa, 1997–2013
1997 1998 1999 2000 2001 2002 2003 2004 2005 2006 2007 2008 2009 2010 2011 2012 2013
Male 58 722 64 325 63 323 66 021 69 818 72 034 76 871 74 420 75 490 79 832 80 931 81 698 86 483 84 754 85 973 85 159 82 658
Female 63 159 71 131 70 831 76 408 81 497 84 477 89 754 85 622 89 470 94 905 96 275 96 809 101 831 99 645 101 866 99 519 97 474
Total 122 139 135 851 134 617 142 755 151 674 156 917 166 942 160 194 165 153 174 882 177 256 178 572 188 386 184 497 187 996 184 791 180 289
0
20 000
40 000
60 000
80 000
100 000
120 000
140 000
160 000
180 000
200 000
Nu
mb
er o
f d
eath
s
Year of death
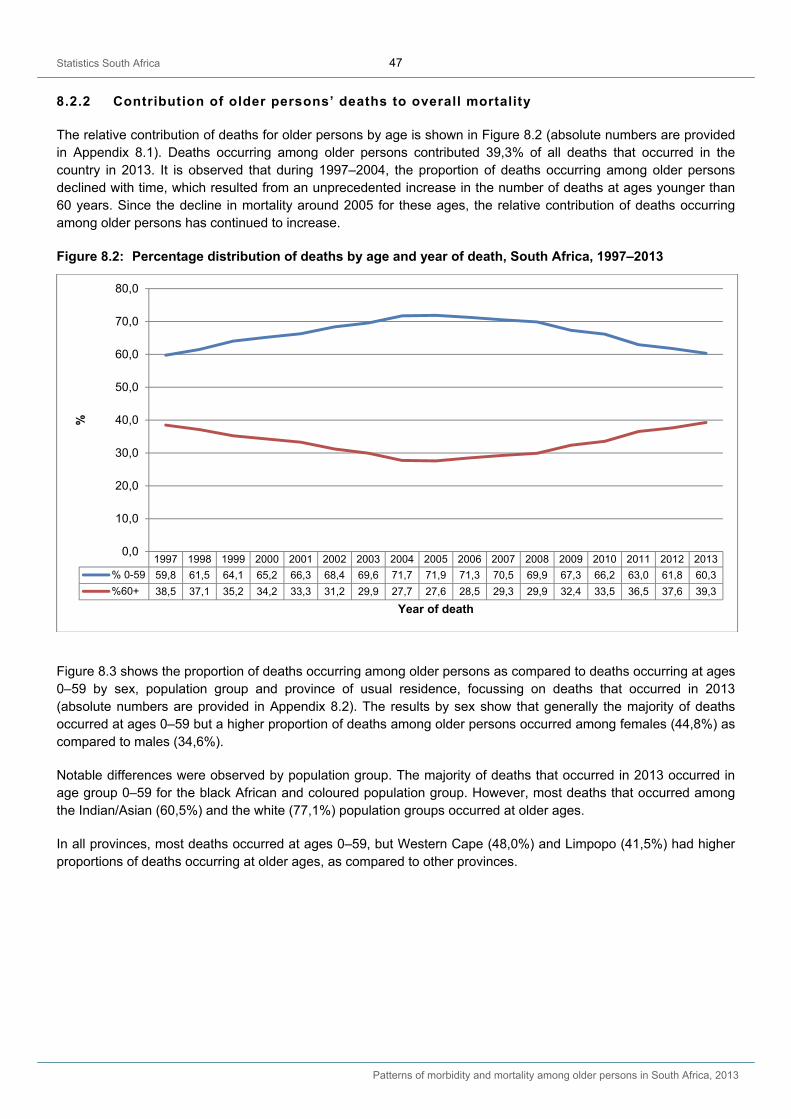
Statistics South Africa 47
Patterns of morbidity and mortality among older persons in South Africa, 2013
8.2.2 Contribution of older persons’ deaths to overall mortality
The relative contribution of deaths for older persons by age is shown in Figure 8.2 (absolute numbers are provided in Appendix 8.1). Deaths occurring among older persons contributed 39,3% of all deaths that occurred in the country in 2013. It is observed that during 1997–2004, the proportion of deaths occurring among older persons declined with time, which resulted from an unprecedented increase in the number of deaths at ages younger than 60 years. Since the decline in mortality around 2005 for these ages, the relative contribution of deaths occurring among older persons has continued to increase.
Figure 8.2: Percentage distribution of deaths by age and year of death, South Africa, 1997–2013
Figure 8.3 shows the proportion of deaths occurring among older persons as compared to deaths occurring at ages 0–59 by sex, population group and province of usual residence, focussing on deaths that occurred in 2013 (absolute numbers are provided in Appendix 8.2). The results by sex show that generally the majority of deaths occurred at ages 0–59 but a higher proportion of deaths among older persons occurred among females (44,8%) as compared to males (34,6%).
Notable differences were observed by population group. The majority of deaths that occurred in 2013 occurred in age group 0–59 for the black African and coloured population group. However, most deaths that occurred among the Indian/Asian (60,5%) and the white (77,1%) population groups occurred at older ages.
In all provinces, most deaths occurred at ages 0–59, but Western Cape (48,0%) and Limpopo (41,5%) had higher proportions of deaths occurring at older ages, as compared to other provinces.
1997 1998 1999 2000 2001 2002 2003 2004 2005 2006 2007 2008 2009 2010 2011 2012 2013
% 0-59 59,8 61,5 64,1 65,2 66,3 68,4 69,6 71,7 71,9 71,3 70,5 69,9 67,3 66,2 63,0 61,8 60,3
%60+ 38,5 37,1 35,2 34,2 33,3 31,2 29,9 27,7 27,6 28,5 29,3 29,9 32,4 33,5 36,5 37,6 39,3
0,0
10,0
20,0
30,0
40,0
50,0
60,0
70,0
80,0
%
Year of death
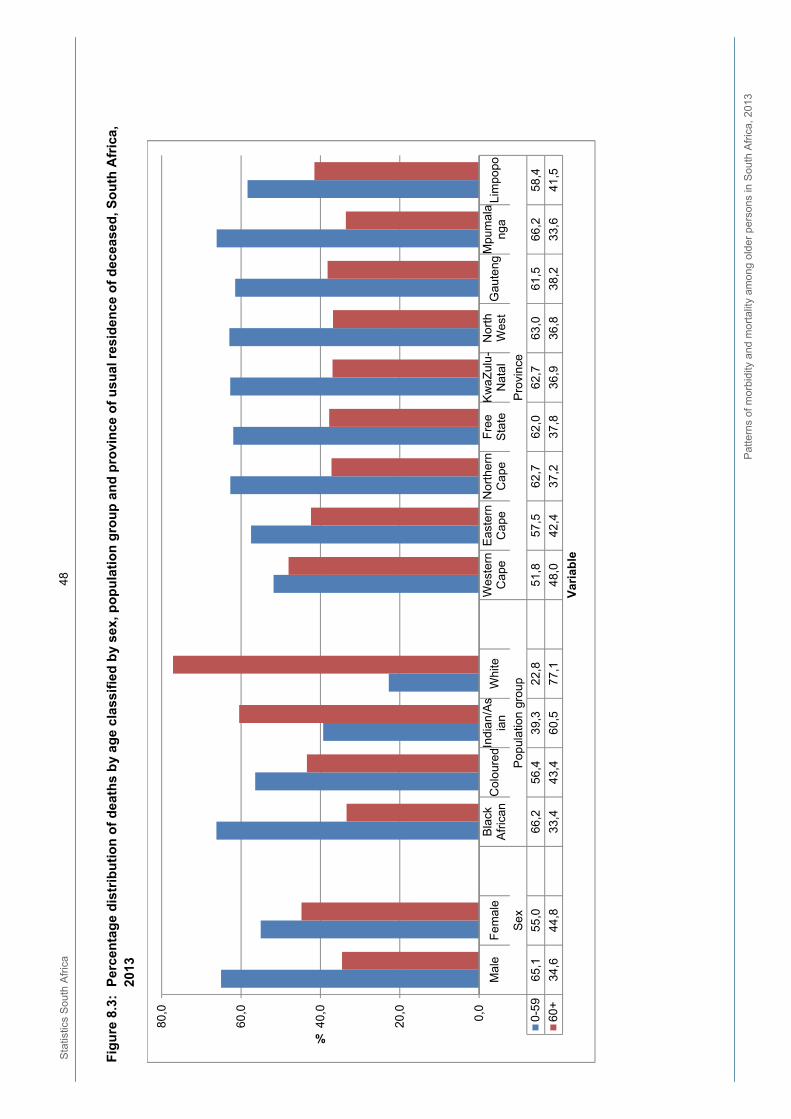
Sta
tistic
s S
outh
Afr
ica
48
P
atte
rns
of m
orbi
dity
and
mo
rtal
ity a
mon
g ol
der
per
sons
in S
outh
Afr
ica,
201
3
Fig
ure
8.3
: P
erce
nta
ge
dis
trib
uti
on
of
dea
ths
by
age
clas
sifi
ed b
y se
x, p
op
ula
tio
n g
rou
p a
nd
pro
vin
ce o
f u
sual
res
iden
ce o
f d
ecea
sed
, So
uth
Afr
ica,
20
13
Mal
eF
emal
eB
lack
Afr
ican
Co
lour
edIn
dian
/As
ian
Whi
teW
este
rnC
ape
Eas
tern
Ca
peN
orth
ern
Ca
peF
ree
Sta
teK
wa
Zul
u-
Na
tal
No
rth
Wes
tG
aute
ngM
pum
ala
nga
Lim
popo
Se
xP
opu
latio
n gr
oup
Pro
vinc
e
0-5
965
,155
,066
,256
,439
,322
,851
,857
,562
,762
,062
,763
,061
,566
,258
,4
60+
34,6
44,8
33,4
43,4
60,5
77,1
48,0
42,4
37,2
37,8
36,9
36,8
38,2
33,6
41,5
0,0
20,0
40,0
60,0
80,0
%
Var
iab
le
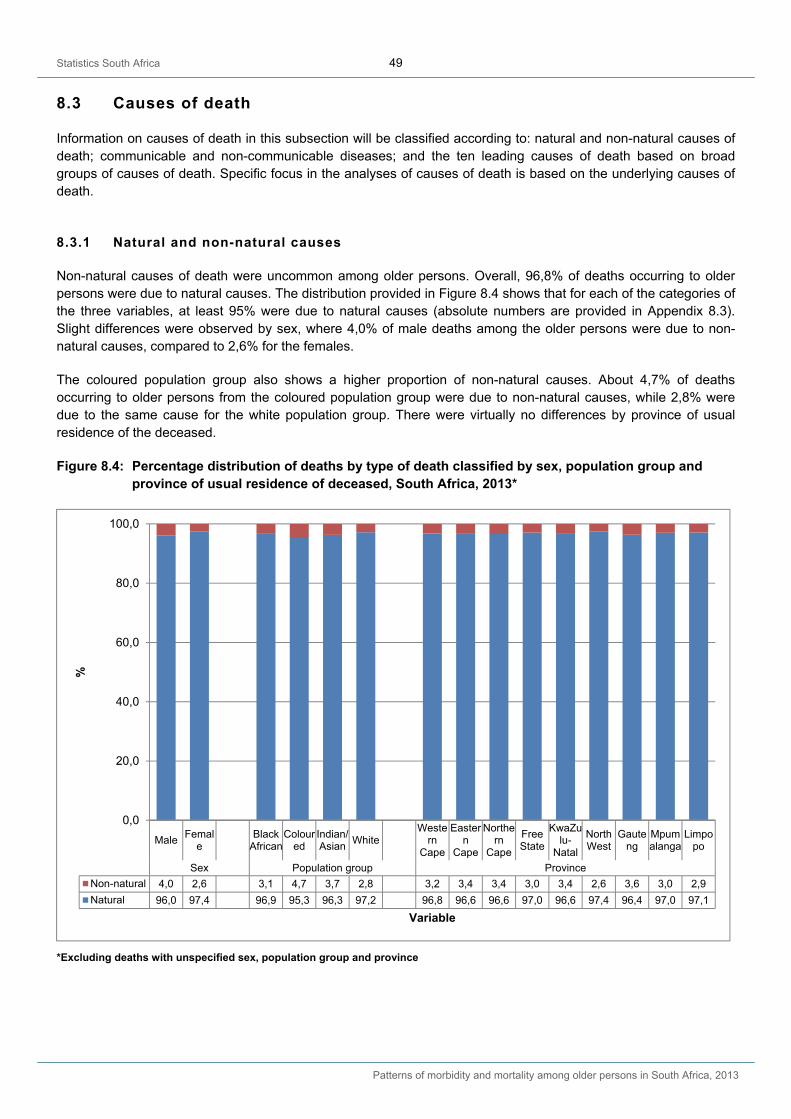
Statistics South Africa 49
Patterns of morbidity and mortality among older persons in South Africa, 2013
8.3 Causes of death
Information on causes of death in this subsection will be classified according to: natural and non-natural causes of death; communicable and non-communicable diseases; and the ten leading causes of death based on broad groups of causes of death. Specific focus in the analyses of causes of death is based on the underlying causes of death.
8.3.1 Natural and non-natural causes
Non-natural causes of death were uncommon among older persons. Overall, 96,8% of deaths occurring to older persons were due to natural causes. The distribution provided in Figure 8.4 shows that for each of the categories of the three variables, at least 95% were due to natural causes (absolute numbers are provided in Appendix 8.3). Slight differences were observed by sex, where 4,0% of male deaths among the older persons were due to non-natural causes, compared to 2,6% for the females.
The coloured population group also shows a higher proportion of non-natural causes. About 4,7% of deaths occurring to older persons from the coloured population group were due to non-natural causes, while 2,8% were due to the same cause for the white population group. There were virtually no differences by province of usual residence of the deceased.
Figure 8.4: Percentage distribution of deaths by type of death classified by sex, population group and province of usual residence of deceased, South Africa, 2013*
*Excluding deaths with unspecified sex, population group and province
MaleFemal
eBlack
AfricanColour
edIndian/Asian
WhiteWeste
rnCape
Eastern
Cape
Northern
Cape
FreeState
KwaZulu-
Natal
NorthWest
Gauteng
Mpumalanga
Limpopo
Sex Population group Province
Non-natural 4,0 2,6 3,1 4,7 3,7 2,8 3,2 3,4 3,4 3,0 3,4 2,6 3,6 3,0 2,9
Natural 96,0 97,4 96,9 95,3 96,3 97,2 96,8 96,6 96,6 97,0 96,6 97,4 96,4 97,0 97,1
0,0
20,0
40,0
60,0
80,0
100,0
%
Variable
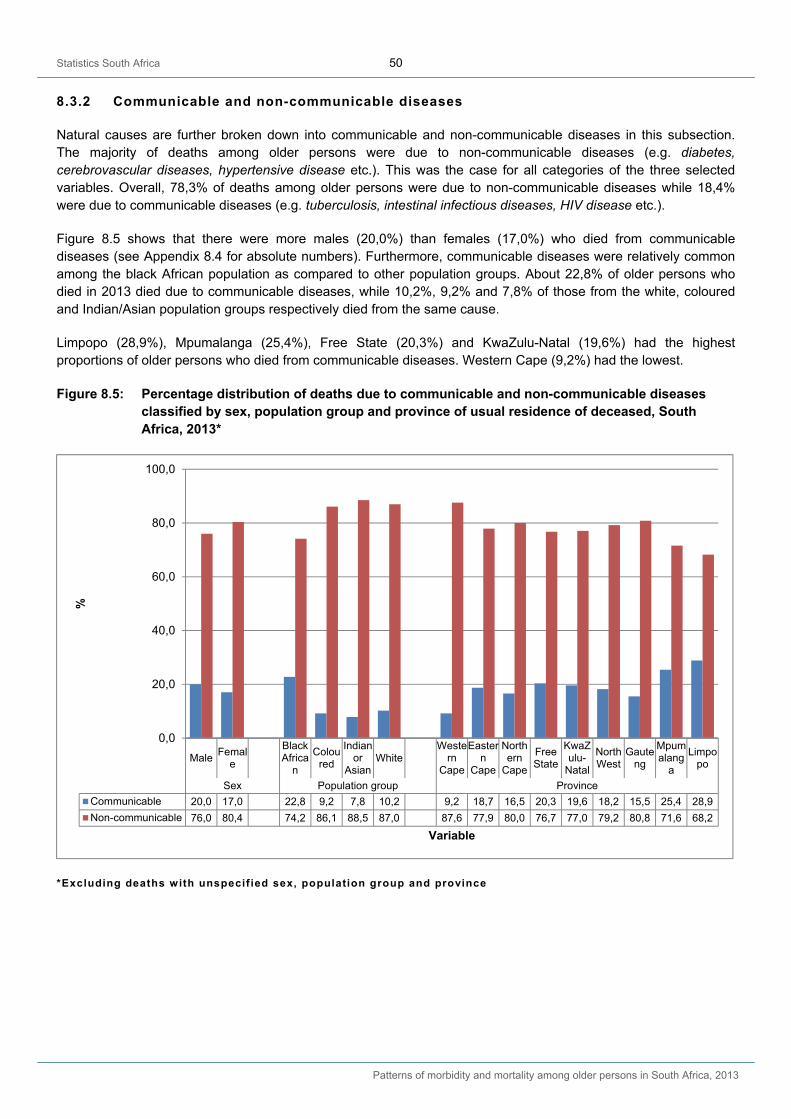
Statistics South Africa 50
Patterns of morbidity and mortality among older persons in South Africa, 2013
8.3.2 Communicable and non-communicable diseases
Natural causes are further broken down into communicable and non-communicable diseases in this subsection. The majority of deaths among older persons were due to non-communicable diseases (e.g. diabetes, cerebrovascular diseases, hypertensive disease etc.). This was the case for all categories of the three selected variables. Overall, 78,3% of deaths among older persons were due to non-communicable diseases while 18,4% were due to communicable diseases (e.g. tuberculosis, intestinal infectious diseases, HIV disease etc.).
Figure 8.5 shows that there were more males (20,0%) than females (17,0%) who died from communicable diseases (see Appendix 8.4 for absolute numbers). Furthermore, communicable diseases were relatively common among the black African population as compared to other population groups. About 22,8% of older persons who died in 2013 died due to communicable diseases, while 10,2%, 9,2% and 7,8% of those from the white, coloured and Indian/Asian population groups respectively died from the same cause.
Limpopo (28,9%), Mpumalanga (25,4%), Free State (20,3%) and KwaZulu-Natal (19,6%) had the highest proportions of older persons who died from communicable diseases. Western Cape (9,2%) had the lowest.
Figure 8.5: Percentage distribution of deaths due to communicable and non-communicable diseases classified by sex, population group and province of usual residence of deceased, South Africa, 2013*
*Excluding deaths with unspecified sex, population group and province
MaleFemal
e
BlackAfrica
n
Coloured
Indianor
AsianWhite
Western
Cape
Eastern
Cape
Northern
Cape
FreeState
KwaZulu-
Natal
NorthWest
Gauteng
Mpumalang
a
Limpopo
Sex Population group Province
Communicable 20,0 17,0 22,8 9,2 7,8 10,2 9,2 18,7 16,5 20,3 19,6 18,2 15,5 25,4 28,9
Non-communicable 76,0 80,4 74,2 86,1 88,5 87,0 87,6 77,9 80,0 76,7 77,0 79,2 80,8 71,6 68,2
0,0
20,0
40,0
60,0
80,0
100,0
%
Variable
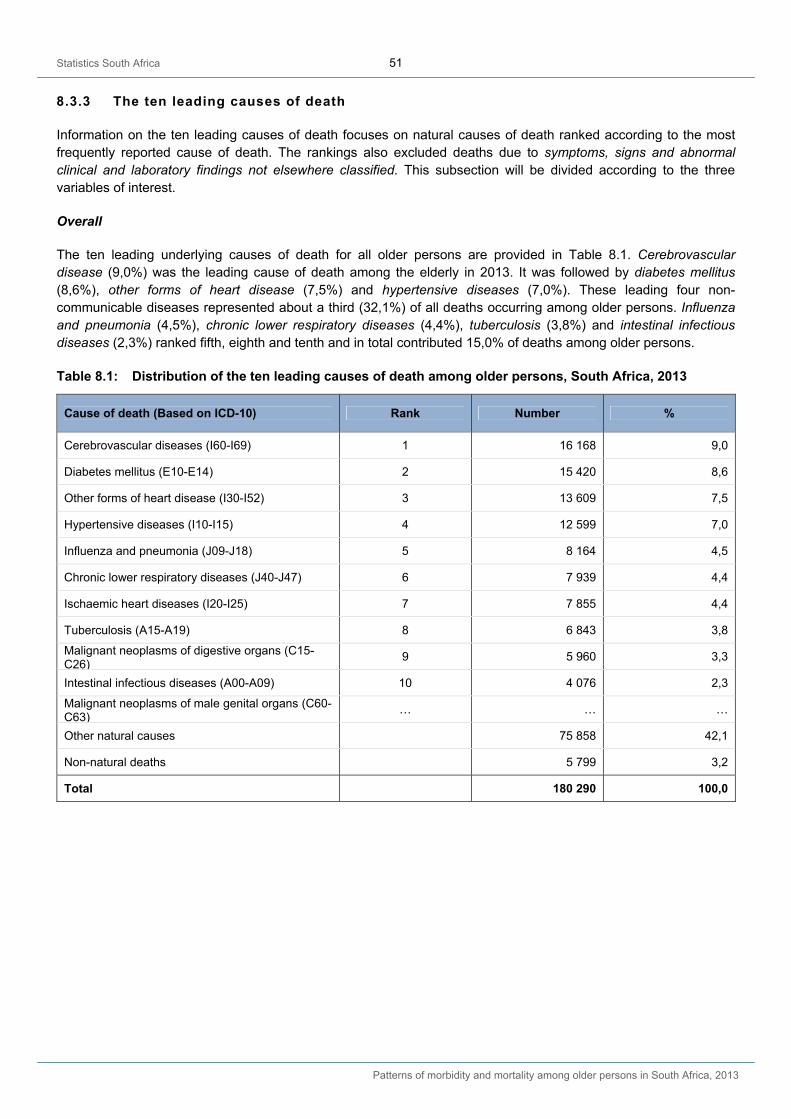
Statistics South Africa 51
Patterns of morbidity and mortality among older persons in South Africa, 2013
8.3.3 The ten leading causes of death
Information on the ten leading causes of death focuses on natural causes of death ranked according to the most frequently reported cause of death. The rankings also excluded deaths due to symptoms, signs and abnormal clinical and laboratory findings not elsewhere classified. This subsection will be divided according to the three variables of interest.
Overall
The ten leading underlying causes of death for all older persons are provided in Table 8.1. Cerebrovascular disease (9,0%) was the leading cause of death among the elderly in 2013. It was followed by diabetes mellitus (8,6%), other forms of heart disease (7,5%) and hypertensive diseases (7,0%). These leading four non-communicable diseases represented about a third (32,1%) of all deaths occurring among older persons. Influenza and pneumonia (4,5%), chronic lower respiratory diseases (4,4%), tuberculosis (3,8%) and intestinal infectious diseases (2,3%) ranked fifth, eighth and tenth and in total contributed 15,0% of deaths among older persons.
Table 8.1: Distribution of the ten leading causes of death among older persons, South Africa, 2013
Cause of death (Based on ICD-10) Rank Number %
Cerebrovascular diseases (I60-I69) 1 16 168 9,0
Diabetes mellitus (E10-E14) 2 15 420 8,6
Other forms of heart disease (I30-I52) 3 13 609 7,5
Hypertensive diseases (I10-I15) 4 12 599 7,0
Influenza and pneumonia (J09-J18) 5 8 164 4,5
Chronic lower respiratory diseases (J40-J47) 6 7 939 4,4
Ischaemic heart diseases (I20-I25) 7 7 855 4,4
Tuberculosis (A15-A19) 8 6 843 3,8
Malignant neoplasms of digestive organs (C15-C26)
9 5 960 3,3
Intestinal infectious diseases (A00-A09) 10 4 076 2,3
Malignant neoplasms of male genital organs (C60-C63)
… … …
Other natural causes 75 858 42,1
Non-natural deaths 5 799 3,2
Total 180 290 100,0
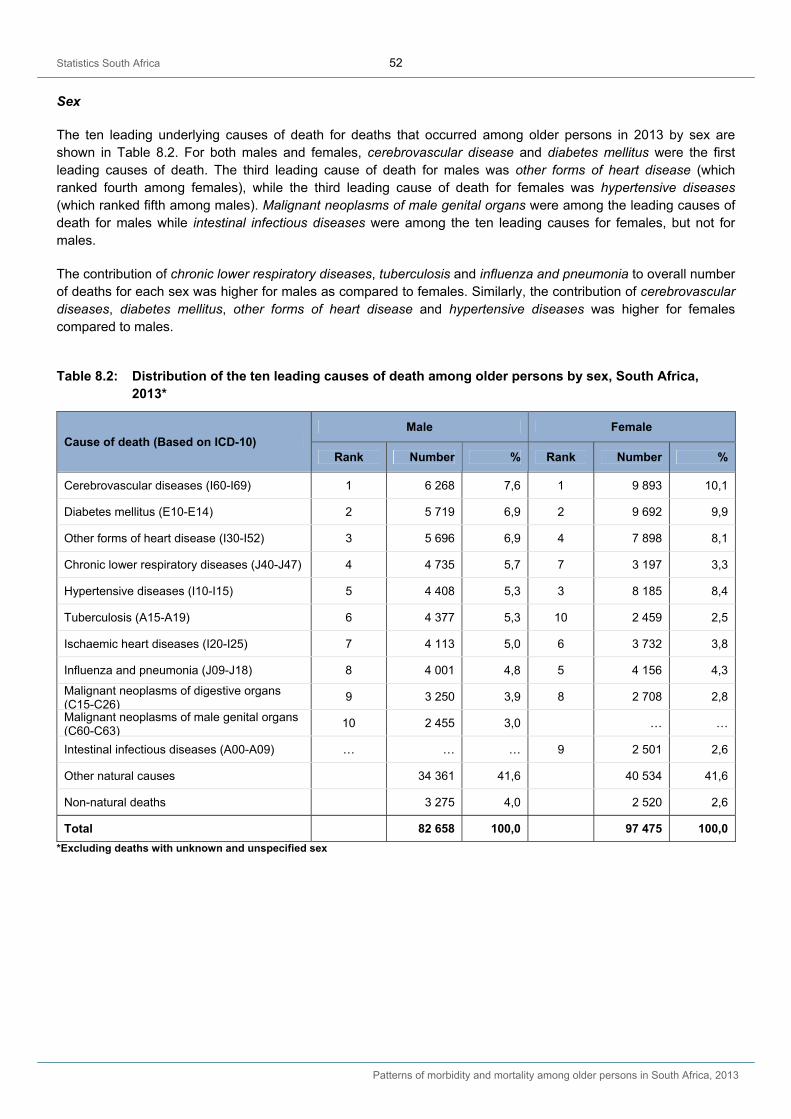
Statistics South Africa 52
Patterns of morbidity and mortality among older persons in South Africa, 2013
Sex
The ten leading underlying causes of death for deaths that occurred among older persons in 2013 by sex are shown in Table 8.2. For both males and females, cerebrovascular disease and diabetes mellitus were the first leading causes of death. The third leading cause of death for males was other forms of heart disease (which ranked fourth among females), while the third leading cause of death for females was hypertensive diseases (which ranked fifth among males). Malignant neoplasms of male genital organs were among the leading causes of death for males while intestinal infectious diseases were among the ten leading causes for females, but not for males.
The contribution of chronic lower respiratory diseases, tuberculosis and influenza and pneumonia to overall number of deaths for each sex was higher for males as compared to females. Similarly, the contribution of cerebrovascular diseases, diabetes mellitus, other forms of heart disease and hypertensive diseases was higher for females compared to males.
Table 8.2: Distribution of the ten leading causes of death among older persons by sex, South Africa, 2013*
Cause of death (Based on ICD-10) Male Female
Rank Number % Rank Number %
Cerebrovascular diseases (I60-I69) 1 6 268 7,6 1 9 893 10,1
Diabetes mellitus (E10-E14) 2 5 719 6,9 2 9 692 9,9
Other forms of heart disease (I30-I52) 3 5 696 6,9 4 7 898 8,1
Chronic lower respiratory diseases (J40-J47) 4 4 735 5,7 7 3 197 3,3
Hypertensive diseases (I10-I15) 5 4 408 5,3 3 8 185 8,4
Tuberculosis (A15-A19) 6 4 377 5,3 10 2 459 2,5
Ischaemic heart diseases (I20-I25) 7 4 113 5,0 6 3 732 3,8
Influenza and pneumonia (J09-J18) 8 4 001 4,8 5 4 156 4,3
Malignant neoplasms of digestive organs (C15-C26)
9 3 250 3,9 8 2 708 2,8
Malignant neoplasms of male genital organs (C60-C63)
10 2 455 3,0
… …
Intestinal infectious diseases (A00-A09) … … … 9 2 501 2,6
Other natural causes 34 361 41,6
40 534 41,6
Non-natural deaths 3 275 4,0
2 520 2,6
Total 82 658 100,0
97 475 100,0
*Excluding deaths with unknown and unspecified sex
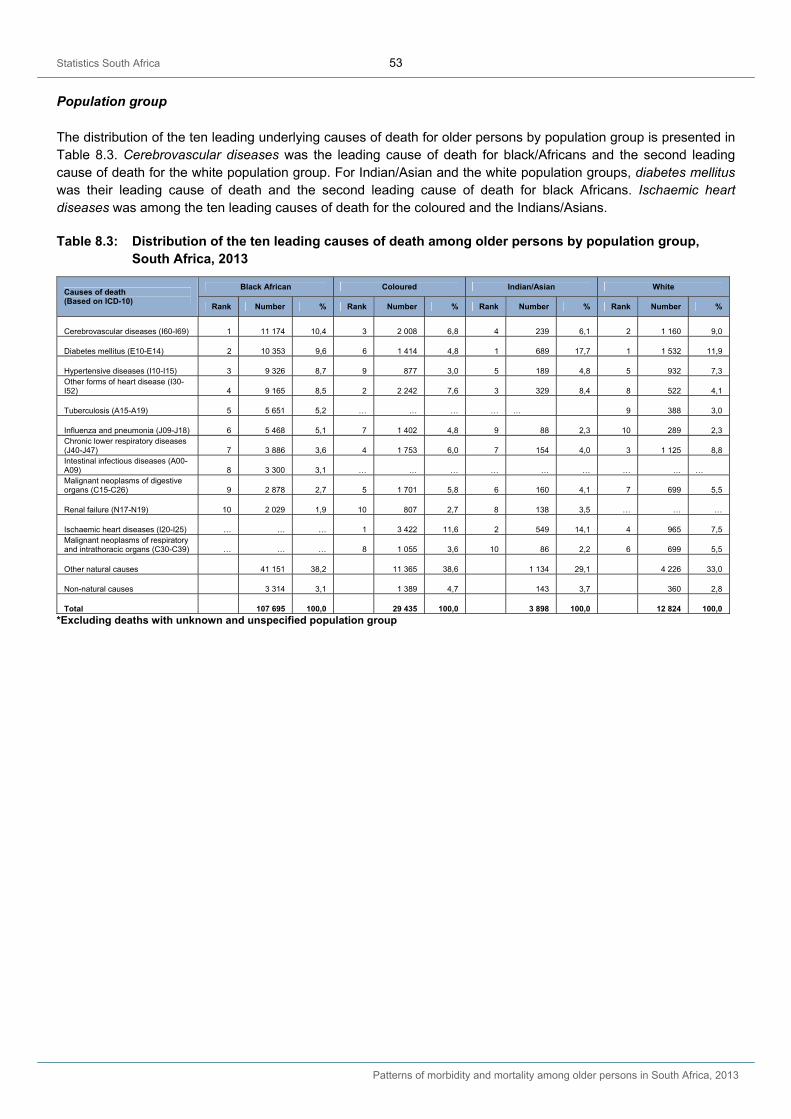
Statistics South Africa 53
Patterns of morbidity and mortality among older persons in South Africa, 2013
Population group The distribution of the ten leading underlying causes of death for older persons by population group is presented in Table 8.3. Cerebrovascular diseases was the leading cause of death for black/Africans and the second leading cause of death for the white population group. For Indian/Asian and the white population groups, diabetes mellitus was their leading cause of death and the second leading cause of death for black Africans. Ischaemic heart diseases was among the ten leading causes of death for the coloured and the Indians/Asians.
Table 8.3: Distribution of the ten leading causes of death among older persons by population group, South Africa, 2013
Causes of death (Based on ICD-10)
Black African Coloured Indian/Asian White
Rank Number % Rank Number % Rank Number % Rank Number %
Cerebrovascular diseases (I60-I69) 1 11 174 10,4 3 2 008 6,8 4 239 6,1 2 1 160 9,0
Diabetes mellitus (E10-E14) 2 10 353 9,6 6 1 414 4,8 1 689 17,7 1 1 532 11,9
Hypertensive diseases (I10-I15) 3 9 326 8,7 9 877 3,0 5 189 4,8 5 932 7,3 Other forms of heart disease (I30-I52) 4 9 165 8,5 2 2 242 7,6 3 329 8,4 8 522 4,1
Tuberculosis (A15-A19) 5 5 651 5,2 … … … … … 9 388 3,0
Influenza and pneumonia (J09-J18) 6 5 468 5,1 7 1 402 4,8 9 88 2,3 10 289 2,3 Chronic lower respiratory diseases (J40-J47) 7 3 886 3,6 4 1 753 6,0 7 154 4,0 3 1 125 8,8 Intestinal infectious diseases (A00-A09) 8 3 300 3,1 … … … … … … … … … Malignant neoplasms of digestive organs (C15-C26) 9 2 878 2,7 5 1 701 5,8 6 160 4,1 7 699 5,5
Renal failure (N17-N19) 10 2 029 1,9 10 807 2,7 8 138 3,5 … … …
Ischaemic heart diseases (I20-I25) … … … 1 3 422 11,6 2 549 14,1 4 965 7,5 Malignant neoplasms of respiratory and intrathoracic organs (C30-C39) … … … 8 1 055 3,6 10 86 2,2 6 699 5,5
Other natural causes 41 151 38,2 11 365 38,6 1 134 29,1 4 226 33,0
Non-natural causes 3 314 3,1 1 389 4,7 143 3,7 360 2,8
Total 107 695 100,0 29 435 100,0 3 898 100,0 12 824 100,0
*Excluding deaths with unknown and unspecified population group
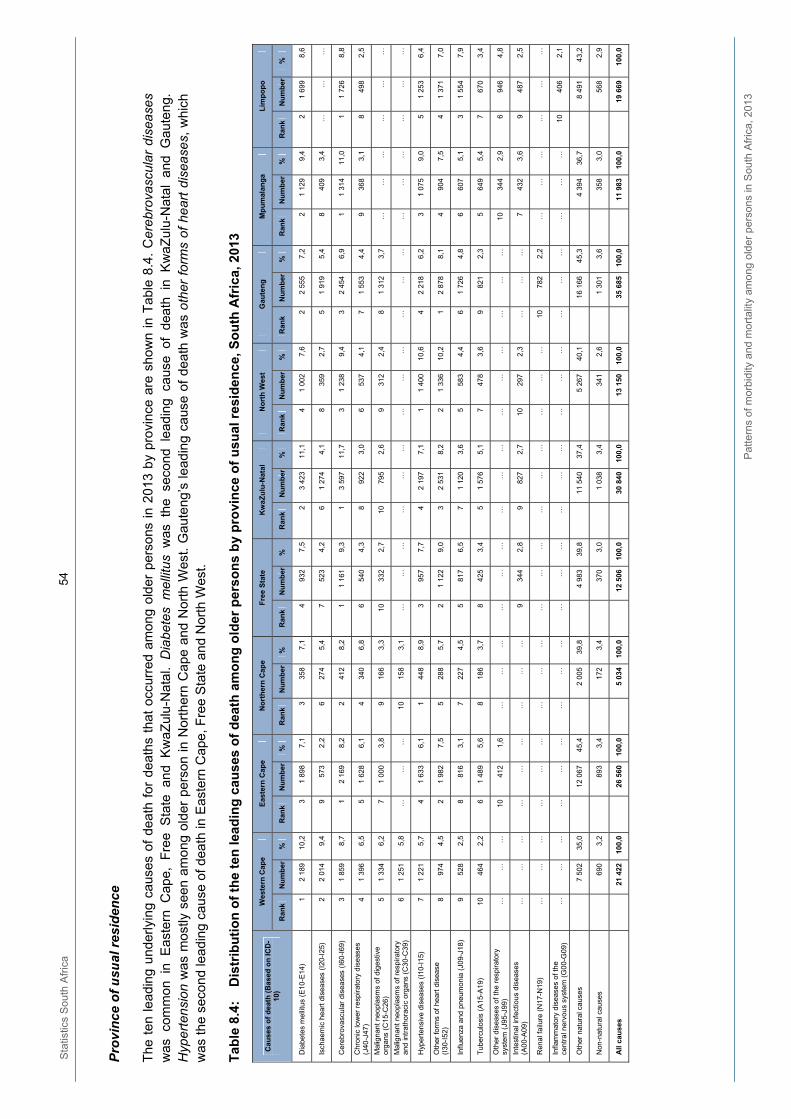
Sta
tistic
s S
outh
Afr
ica
54
P
atte
rns
of m
orbi
dity
and
mo
rtal
ity a
mon
g ol
der
per
sons
in S
outh
Afr
ica,
201
3
Prov
ince
of u
sual
resi
denc
e
The
ten
lea
ding
und
erly
ing
caus
es o
f de
ath
for
deat
hs t
hat
occu
rred
am
ong
olde
r pe
rson
s in
201
3 by
pro
vinc
e ar
e sh
own
in T
able
8.4
. C
ereb
rova
scul
ar d
isea
ses
was
com
mon
in
Eas
tern
Cap
e, F
ree
Sta
te a
nd K
waZ
ulu-
Nat
al.
Dia
bete
s m
ellit
us w
as t
he s
econ
d le
adin
g ca
use
of d
eath
in
Kw
aZul
u-N
atal
and
Gau
teng
. H
yper
tens
ion
was
mos
tly s
een
amon
g ol
der
pers
on in
Nor
ther
n C
ape
and
Nor
th W
est.
Gau
teng
’s le
adin
g ca
use
of d
eath
was
oth
er f
orm
s of
hea
rt d
isea
ses,
whi
ch
was
the
seco
nd le
adin
g ca
use
of d
eath
in E
aste
rn C
ape,
Fre
e S
tate
and
Nor
th W
est.
Tab
le 8
.4:
Dis
trib
uti
on
of
the
ten
lead
ing
cau
ses
of
dea
th a
mo
ng
old
er p
erso
ns
by
pro
vin
ce o
f u
sual
res
iden
ce, S
ou
th A
fric
a, 2
013
Cau
ses
of
dea
th (
Bas
ed o
n IC
D-
10)
Wes
tern
Cap
e E
aste
rn C
ape
No
rth
ern
Cap
e F
ree
Sta
te
Kw
aZu
lu-N
atal
N
ort
h W
est
Gau
ten
g
Mp
um
alan
ga
Lim
po
po
Ran
k N
um
ber
%
R
ank
Nu
mb
er%
R
ank
Nu
mb
er%
R
ank
Nu
mb
er%
R
ank
Nu
mb
er
%
Ran
k N
um
ber
%
Ran
k N
um
ber
%
Ran
k N
um
ber
%
Ran
k N
um
ber
%
Dia
bete
s m
ellit
us (
E10
-E14
) 1
2 18
9 10
,2
3 1
898
7,1
335
87,
14
932
7,5
2 3
423
11,1
41
002
7,6
22
555
7,2
21
129
9,4
2 1
699
8,6
Isch
aem
ic h
eart
dis
ease
s (I
20-I
25)
22
014
9,4
9 57
32,
26
274
5,4
752
34,
26
1 27
4 4,
18
359
2,7
51
919
5,4
840
93,
4…
…
…
Cer
ebro
vasc
ular
dis
ease
s (I
60-I
69)
31
859
8,7
1 2
169
8,2
241
28,
21
1 16
19,
31
3 59
7 11
,73
1 23
89,
43
2 45
46,
91
1 31
411
,01
1 72
6 8,
8
Chr
onic
low
er r
espi
rato
ry d
isea
ses
(J40
-J47
) 4
1 39
6 6,
5 5
1 62
86,
14
340
6,8
654
04,
38
922
3,0
653
74,
17
1 55
34,
49
368
3,1
8 49
8 2,
5
Ma
ligna
nt n
eopl
asm
s of
dig
estiv
e or
gan
s (C
15-C
26)
51
334
6,2
7 1
000
3,8
916
63,
310
332
2,7
10
795
2,6
931
22,
48
1 31
23,
7…
……
…
…
…
Ma
ligna
nt n
eopl
asm
s of
res
pira
tory
an
d in
trat
hora
cic
org
ans
(C30
-C39
) 6
1 25
1 5,
8 …
…
…10
158
3,1
……
……
…
…
……
……
……
……
……
…
…
Hyp
erte
nsiv
e di
seas
es (
I10-
I15)
7
1 22
1 5,
7 4
1 63
36,
11
448
8,9
395
77,
74
2 19
7 7,
11
1 40
010
,64
2 21
86,
23
1 07
59,
05
1 25
3 6,
4
Oth
er fo
rms
of h
eart
dis
ease
(I
30-I
52)
897
4 4,
5 2
1 98
27,
55
288
5,7
21
122
9,0
3 2
531
8,2
21
336
10,2
12
878
8,1
490
47,
54
1 37
1 7,
0
Influ
enza
and
pne
umon
ia (
J09-
J18)
9
528
2,5
8 81
63,
17
227
4,5
581
76,
57
1 12
0 3,
65
583
4,4
61
726
4,8
660
75,
13
1 55
4 7,
9
Tub
ercu
losi
s (A
15-A
19)
1046
4 2,
2 6
1 48
95,
68
186
3,7
842
53,
45
1 57
6 5,
17
478
3,6
982
12,
35
649
5,4
7 67
0 3,
4
Oth
er d
isea
ses
of th
e re
spira
tory
sy
stem
(J9
5-J9
9)
……
…
10
41
21,
6…
……
……
……
…
…
……
……
……
1034
42,
96
946
4,8
Inte
stin
al in
fect
ious
dis
ease
s (A
00-A
09)
……
…
…
…
……
……
934
42,
89
827
2,7
1029
72,
3…
……
743
23,
69
487
2,5
Ren
al f
ailu
re (
N17
-N19
) …
…
…
…
……
……
……
……
…
…
……
……
1078
22,
2…
……
…
…
…
Infla
mm
ator
y di
seas
es o
f th
e ce
ntra
l ner
vous
sys
tem
(G
00-G
09)
……
…
…
…
……
……
……
……
…
…
……
……
……
……
…10
40
6 2,
1
Oth
er n
atur
al c
ause
s
7 50
2 35
,0
12
067
45,4
2
005
39,8
4
983
39,8
11
540
37
,4
5 26
740
,1
16 1
6645
,3
4 39
436
,7
8 49
1 43
,2
Non
-nat
ural
cau
ses
69
0 3,
2
893
3,4
17
23,
4
370
3,0
1
038
3,4
34
12,
6
1 30
13,
6
358
3,0
56
8 2,
9
All
cau
ses
21
422
10
0,0
26
560
100,
0
5 03
410
0,0
12
506
100,
0
30 8
40
100,
0
13 1
5010
0,0
35
685
100,
0
11 9
8310
0,0
19
669
10
0,0
Statistics South Africa 55
Patterns of morbidity and mortality among older persons in South Africa, 2013
8.4 Summary
A total of 180 289 deaths occurred among older persons in 2013, contributing 39,3% of all deaths in the country. There was an increase in the number of deaths over time, with a slight decline eminent from 2011. The pattern of deaths between males and females was consistent for all the years, with more female than male deaths.
The majority of deaths occurred at ages 0–59 but deaths from the Indian/Asian and white population groups, and those in Western Cape and Limpopo, occurred at older ages. Most deaths occurring to older persons were due to natural causes, but the coloured population group showed a higher proportion of non-natural causes. In terms of communicable and non-communicable diseases, the majority of deaths among older persons were due to non-communicable diseases such as diabetes, cerebrovascular diseases and hypertensive disease.
Regarding communicable diseases, there were more male deaths than female deaths. Deaths due to communicable diseases were common among the black African population group and older persons residing in Limpopo, Mpumalanga, Free State and KwaZulu-Natal. Western Cape had the lowest in terms of communicable diseases. Cerebrovascular disease was the leading cause of death among the elderly in 2013, followed by diabetes mellitus, other forms of heart disease and hypertensive diseases. Cerebrovascular disease and diabetes mellitus were the first leading causes of death for both males and females.
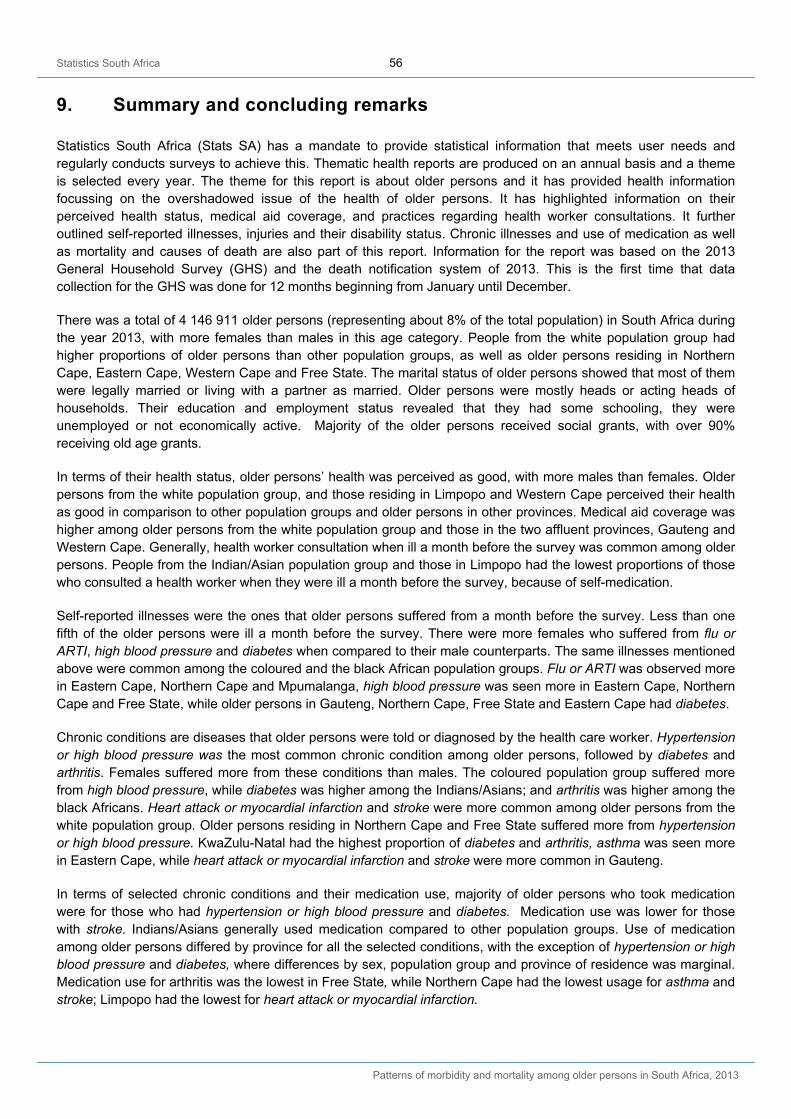
Statistics South Africa 56
Patterns of morbidity and mortality among older persons in South Africa, 2013
9. Summary and concluding remarks
Statistics South Africa (Stats SA) has a mandate to provide statistical information that meets user needs and regularly conducts surveys to achieve this. Thematic health reports are produced on an annual basis and a theme is selected every year. The theme for this report is about older persons and it has provided health information focussing on the overshadowed issue of the health of older persons. It has highlighted information on their perceived health status, medical aid coverage, and practices regarding health worker consultations. It further outlined self-reported illnesses, injuries and their disability status. Chronic illnesses and use of medication as well as mortality and causes of death are also part of this report. Information for the report was based on the 2013 General Household Survey (GHS) and the death notification system of 2013. This is the first time that data collection for the GHS was done for 12 months beginning from January until December.
There was a total of 4 146 911 older persons (representing about 8% of the total population) in South Africa during the year 2013, with more females than males in this age category. People from the white population group had higher proportions of older persons than other population groups, as well as older persons residing in Northern Cape, Eastern Cape, Western Cape and Free State. The marital status of older persons showed that most of them were legally married or living with a partner as married. Older persons were mostly heads or acting heads of households. Their education and employment status revealed that they had some schooling, they were unemployed or not economically active. Majority of the older persons received social grants, with over 90% receiving old age grants.
In terms of their health status, older persons’ health was perceived as good, with more males than females. Older persons from the white population group, and those residing in Limpopo and Western Cape perceived their health as good in comparison to other population groups and older persons in other provinces. Medical aid coverage was higher among older persons from the white population group and those in the two affluent provinces, Gauteng and Western Cape. Generally, health worker consultation when ill a month before the survey was common among older persons. People from the Indian/Asian population group and those in Limpopo had the lowest proportions of those who consulted a health worker when they were ill a month before the survey, because of self-medication.
Self-reported illnesses were the ones that older persons suffered from a month before the survey. Less than one fifth of the older persons were ill a month before the survey. There were more females who suffered from flu or ARTI, high blood pressure and diabetes when compared to their male counterparts. The same illnesses mentioned above were common among the coloured and the black African population groups. Flu or ARTI was observed more in Eastern Cape, Northern Cape and Mpumalanga, high blood pressure was seen more in Eastern Cape, Northern Cape and Free State, while older persons in Gauteng, Northern Cape, Free State and Eastern Cape had diabetes.
Chronic conditions are diseases that older persons were told or diagnosed by the health care worker. Hypertension or high blood pressure was the most common chronic condition among older persons, followed by diabetes and arthritis. Females suffered more from these conditions than males. The coloured population group suffered more from high blood pressure, while diabetes was higher among the Indians/Asians; and arthritis was higher among the black Africans. Heart attack or myocardial infarction and stroke were more common among older persons from the white population group. Older persons residing in Northern Cape and Free State suffered more from hypertension or high blood pressure. KwaZulu-Natal had the highest proportion of diabetes and arthritis, asthma was seen more in Eastern Cape, while heart attack or myocardial infarction and stroke were more common in Gauteng.
In terms of selected chronic conditions and their medication use, majority of older persons who took medication were for those who had hypertension or high blood pressure and diabetes. Medication use was lower for those with stroke. Indians/Asians generally used medication compared to other population groups. Use of medication among older persons differed by province for all the selected conditions, with the exception of hypertension or high blood pressure and diabetes, where differences by sex, population group and province of residence was marginal. Medication use for arthritis was the lowest in Free State, while Northern Cape had the lowest usage for asthma and stroke; Limpopo had the lowest for heart attack or myocardial infarction.
Statistics South Africa 57
Patterns of morbidity and mortality among older persons in South Africa, 2013
The disability status of older persons in South Africa indicated that the majority of them did not have any of the disabilities, although the magnitude differed by type of disability. Higher proportions of older persons with a level of some or a lot of difficulties or could not do at all were for seeing and walking. More females had more difficulties with seeing, hearing, walking and remembering/concentrating compared to males. The black Africans and coloureds had some degree of difficulty in seeing, walking and concentrating/remembering than other population groups, older persons in Northern Cape, Free State and KwaZulu-Natal had more difficulties than those in other provinces.
Eye glasses/spectacles/contact lenses and walking sticks/walking frames were the most common assistive devices used by older persons. The white population group, males and older persons in Western Cape and Gauteng used eye glasses/spectacles/contact lenses more than the others in the same category. The use of walking sticks/walking frames was observed more among females, black Africans and older persons residing in North West, Eastern Cape, Limpopo and Free State.
A total of 180 289 deaths occurred among older persons in 2013, contributing 39,3% to all deaths in the country. Majority of deaths occurred at ages 0–59 with the exception of deaths from the Indian/Asian and white population groups, and those in Western Cape and Limpopo, which occurred at older ages (60 years and above). Most older persons died due to natural causes, except for the coloured population group who died of non-natural causes. Older persons died mostly of non-communicable diseases such as diabetes, cerebrovascular diseases and hypertensive disease.
There were more male deaths than female deaths due to communicable diseases. Deaths due to communicable diseases were common among the black African population group and older persons in Limpopo, Mpumalanga, Free State and KwaZulu-Natal. Cerebrovascular disease was the leading cause of death among older persons, followed by diabetes mellitus, other forms of heart disease and hypertensive diseases. Cerebrovascular disease and diabetes mellitus were the number one leading causes of death for both males and females.
This report has demonstrated that Statistics South Africa can produce useful information that can be used by programme managers in the health sector to monitor their programmes. The information in this report indicates that interventions for certain diseases should be directed to a particular sex, population group and province.
Statistics South Africa 58
Patterns of morbidity and mortality among older persons in South Africa, 2013
10. References
Department of Justice. 1996. The Constitution of South Africa (Act No. 108 of 1996). http://www.justice.gov.za/legislationacts/.pdf. Accessed 23 January 2015.
Department of Justice. 2010. Older Persons Act (Act No. 13 of 2006). http://www.justice.gov.za/legislationacts/2006-013_olderpersons.pdf. Accessed 23 January 2015.
Department of Health. 2011. Health Data Advisory and coordination Committee Report. Department of Health, Pretoria.
International Longevity Centre. 2011. Non-communicable Diseases in an Ageing World. A report from the ILC-UK, HelpAge International and Alzheimer’s, Disease International lunch debate. http://ncdalliance.org/sites/default/files/resource_files/NCDs-in-an-ageing-world.pdf. Accessed: 23 January 2015.
Joubert, J.D., Bradshaw, D. 2006. Population ageing and health challenges in South Africa. In (Eds)
Steyn, K., Fourie, J., Temple, N. Chronic diseases of lifestyle in South Africa: 1995–2005. Technical Report. Cape Town: South African Medical Research Council, 2005.
Statistics South Africa (Stats SA). 2012. Census, 2011. Statistical Release P0301.4 Stats SA, Pretoria
Statistics South Africa (Stats SA). 2013. General Household Survey, 2012. Statistical Release P0318, Stats SA, Pretoria
Statistics South Africa (Stats SA). 2013. Mid-year population estimates, 2012. Statistical Release P0302, Stats SA, Pretoria
Statistics South Africa (Stats SA). 2013. Social profile of South Africa, 2002-2012. Report 03-19-00, Stats SA, Pretoria
Statistics South Africa (Stats SA). 2013. Census 2011: Profile of older persons in South Africa. Report 03-01-60, Stats SA, Pretoria
United Nations (UN). Universal declaration of Human Rights. 1948. http://www.supremecourt.ge/files/upload-file/pdf/act3.pdf
United Nations (UN). 2002. Political declaration and Madrid plan of action on ageing. New York. http://www.un.org/en/events/pastevents/pdfs/Madrid_plan.pdf. Accessed 23 January 2015.
World Health Organization (WHO). 2009. World Health Statistics, http://www.who.int/gho/publications/world_health_statistics/EN_WHS09_Full.pdf
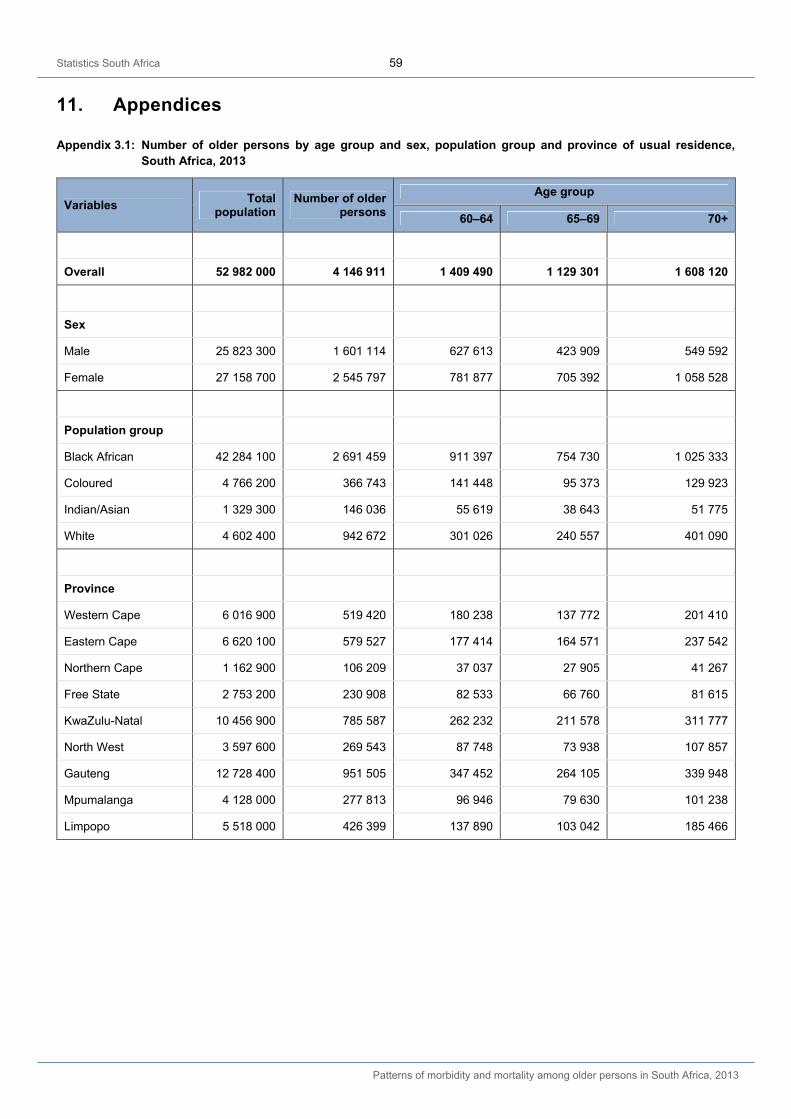
Statistics South Africa 59
Patterns of morbidity and mortality among older persons in South Africa, 2013
11. Appendices
Appendix 3.1: Number of older persons by age group and sex, population group and province of usual residence, South Africa, 2013
Variables Total
population Number of older
persons
Age group
60‒64 65‒69 70+
Overall 52 982 000 4 146 911 1 409 490 1 129 301 1 608 120
Sex
Male 25 823 300 1 601 114 627 613 423 909 549 592
Female 27 158 700 2 545 797 781 877 705 392 1 058 528
Population group
Black African 42 284 100 2 691 459 911 397 754 730 1 025 333
Coloured 4 766 200 366 743 141 448 95 373 129 923
Indian/Asian 1 329 300 146 036 55 619 38 643 51 775
White 4 602 400 942 672 301 026 240 557 401 090
Province
Western Cape 6 016 900 519 420 180 238 137 772 201 410
Eastern Cape 6 620 100 579 527 177 414 164 571 237 542
Northern Cape 1 162 900 106 209 37 037 27 905 41 267
Free State 2 753 200 230 908 82 533 66 760 81 615
KwaZulu-Natal 10 456 900 785 587 262 232 211 578 311 777
North West 3 597 600 269 543 87 748 73 938 107 857
Gauteng 12 728 400 951 505 347 452 264 105 339 948
Mpumalanga 4 128 000 277 813 96 946 79 630 101 238
Limpopo 5 518 000 426 399 137 890 103 042 185 466
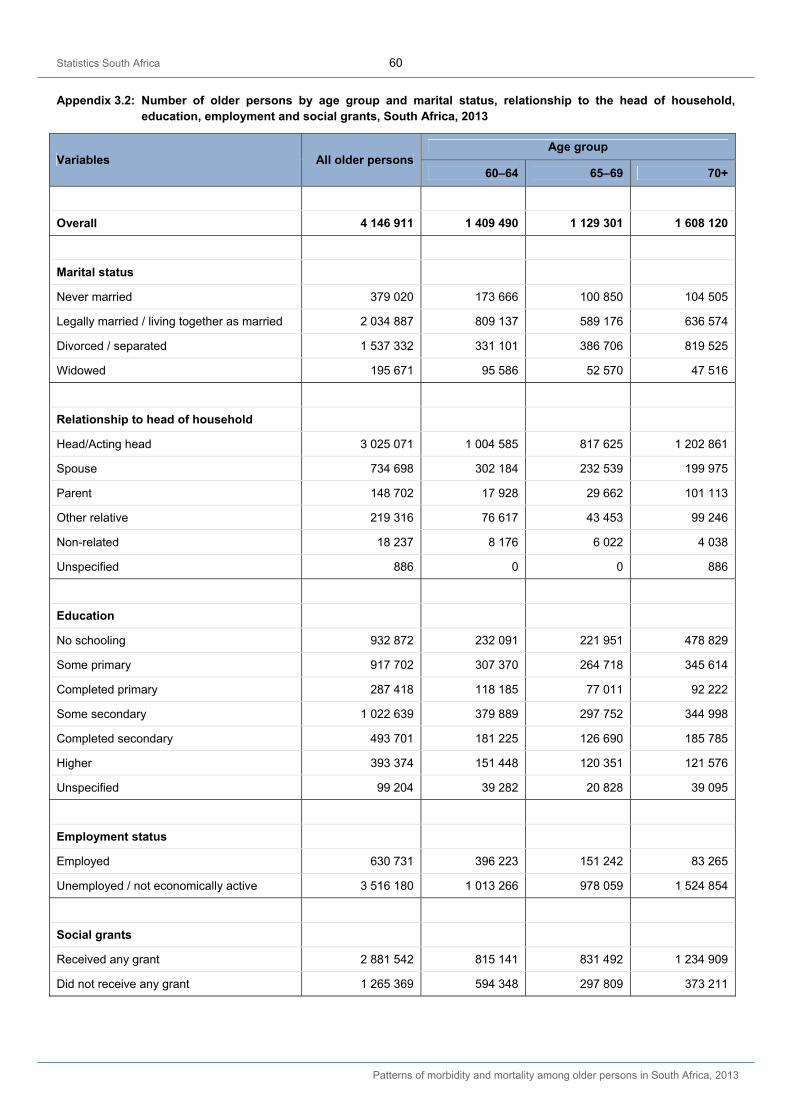
Statistics South Africa 60
Patterns of morbidity and mortality among older persons in South Africa, 2013
Appendix 3.2: Number of older persons by age group and marital status, relationship to the head of household, education, employment and social grants, South Africa, 2013
Variables All older persons Age group
60‒64 65‒69 70+
Overall 4 146 911 1 409 490 1 129 301 1 608 120
Marital status
Never married 379 020 173 666 100 850 104 505
Legally married / living together as married 2 034 887 809 137 589 176 636 574
Divorced / separated 1 537 332 331 101 386 706 819 525
Widowed 195 671 95 586 52 570 47 516
Relationship to head of household
Head/Acting head 3 025 071 1 004 585 817 625 1 202 861
Spouse 734 698 302 184 232 539 199 975
Parent 148 702 17 928 29 662 101 113
Other relative 219 316 76 617 43 453 99 246
Non-related 18 237 8 176 6 022 4 038
Unspecified 886 0 0 886
Education
No schooling 932 872 232 091 221 951 478 829
Some primary 917 702 307 370 264 718 345 614
Completed primary 287 418 118 185 77 011 92 222
Some secondary 1 022 639 379 889 297 752 344 998
Completed secondary 493 701 181 225 126 690 185 785
Higher 393 374 151 448 120 351 121 576
Unspecified 99 204 39 282 20 828 39 095
Employment status
Employed 630 731 396 223 151 242 83 265
Unemployed / not economically active 3 516 180 1 013 266 978 059 1 524 854
Social grants
Received any grant 2 881 542 815 141 831 492 1 234 909
Did not receive any grant 1 265 369 594 348 297 809 373 211
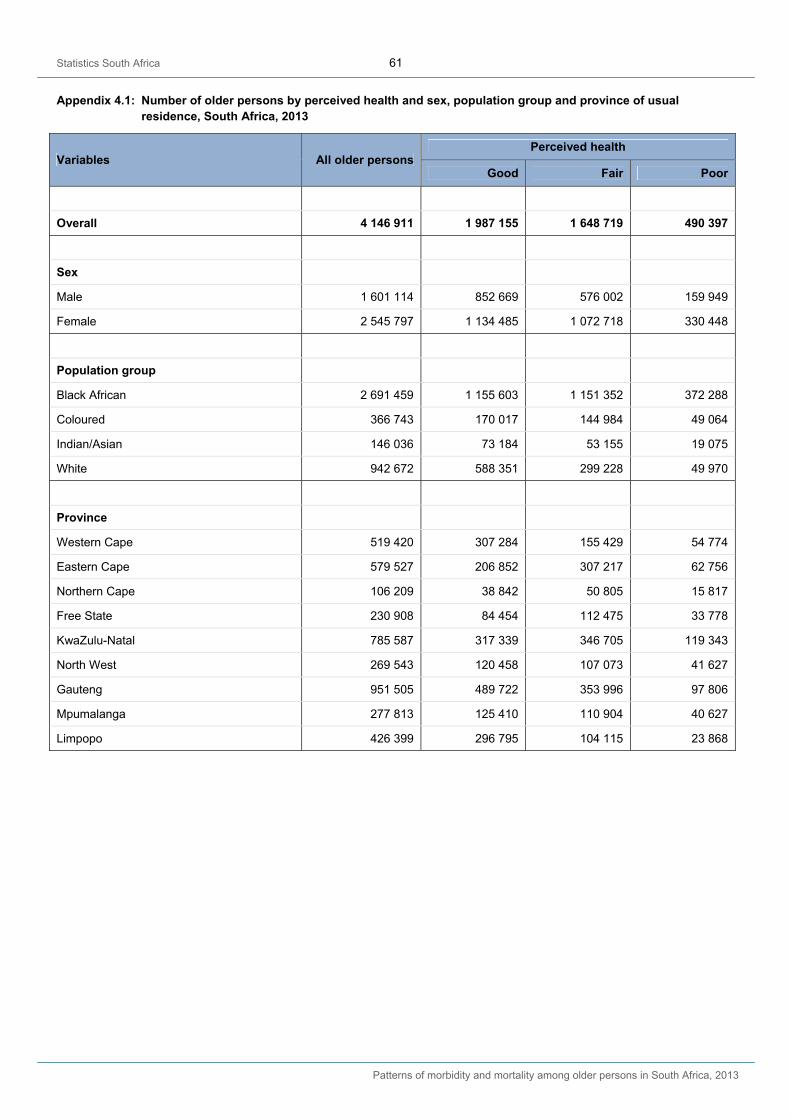
Statistics South Africa 61
Patterns of morbidity and mortality among older persons in South Africa, 2013
Appendix 4.1: Number of older persons by perceived health and sex, population group and province of usual residence, South Africa, 2013
Variables All older persons Perceived health
Good Fair Poor
Overall 4 146 911 1 987 155 1 648 719 490 397
Sex
Male 1 601 114 852 669 576 002 159 949
Female 2 545 797 1 134 485 1 072 718 330 448
Population group
Black African 2 691 459 1 155 603 1 151 352 372 288
Coloured 366 743 170 017 144 984 49 064
Indian/Asian 146 036 73 184 53 155 19 075
White 942 672 588 351 299 228 49 970
Province
Western Cape 519 420 307 284 155 429 54 774
Eastern Cape 579 527 206 852 307 217 62 756
Northern Cape 106 209 38 842 50 805 15 817
Free State 230 908 84 454 112 475 33 778
KwaZulu-Natal 785 587 317 339 346 705 119 343
North West 269 543 120 458 107 073 41 627
Gauteng 951 505 489 722 353 996 97 806
Mpumalanga 277 813 125 410 110 904 40 627
Limpopo 426 399 296 795 104 115 23 868
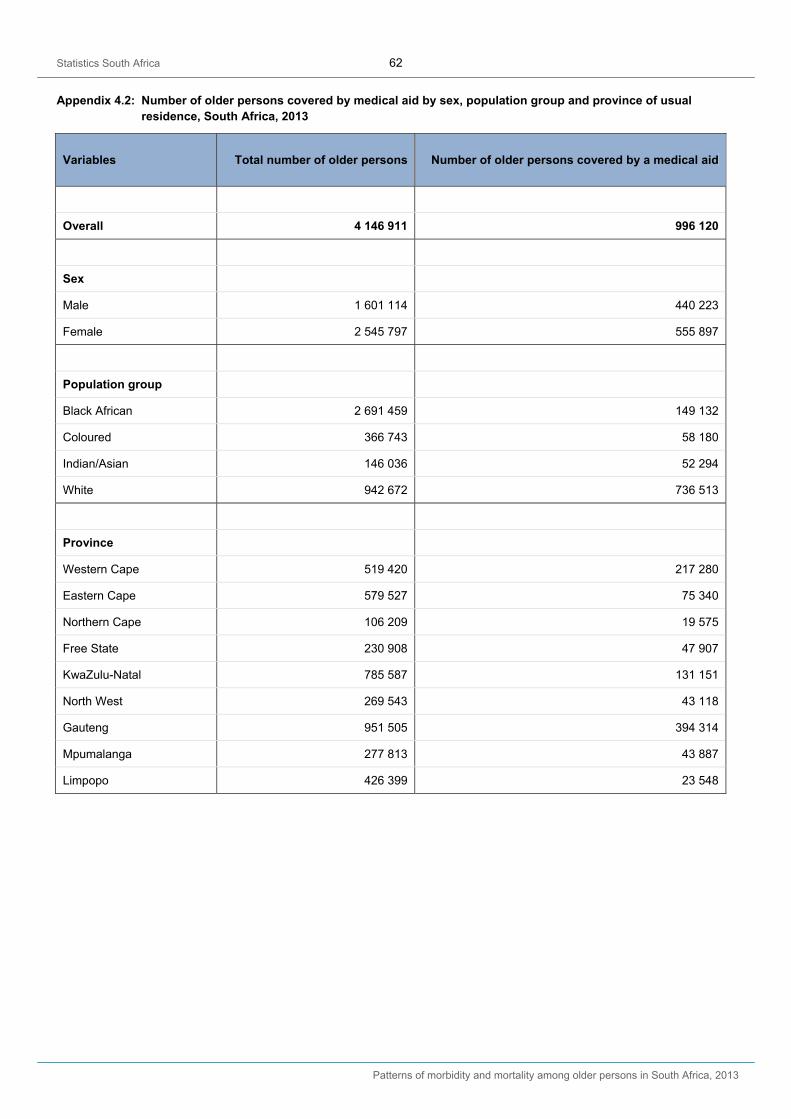
Statistics South Africa 62
Patterns of morbidity and mortality among older persons in South Africa, 2013
Appendix 4.2: Number of older persons covered by medical aid by sex, population group and province of usual residence, South Africa, 2013
Variables Total number of older persons Number of older persons covered by a medical aid
Overall 4 146 911 996 120
Sex
Male 1 601 114 440 223
Female 2 545 797 555 897
Population group
Black African 2 691 459 149 132
Coloured 366 743 58 180
Indian/Asian 146 036 52 294
White 942 672 736 513
Province
Western Cape 519 420 217 280
Eastern Cape 579 527 75 340
Northern Cape 106 209 19 575
Free State 230 908 47 907
KwaZulu-Natal 785 587 131 151
North West 269 543 43 118
Gauteng 951 505 394 314
Mpumalanga 277 813 43 887
Limpopo 426 399 23 548
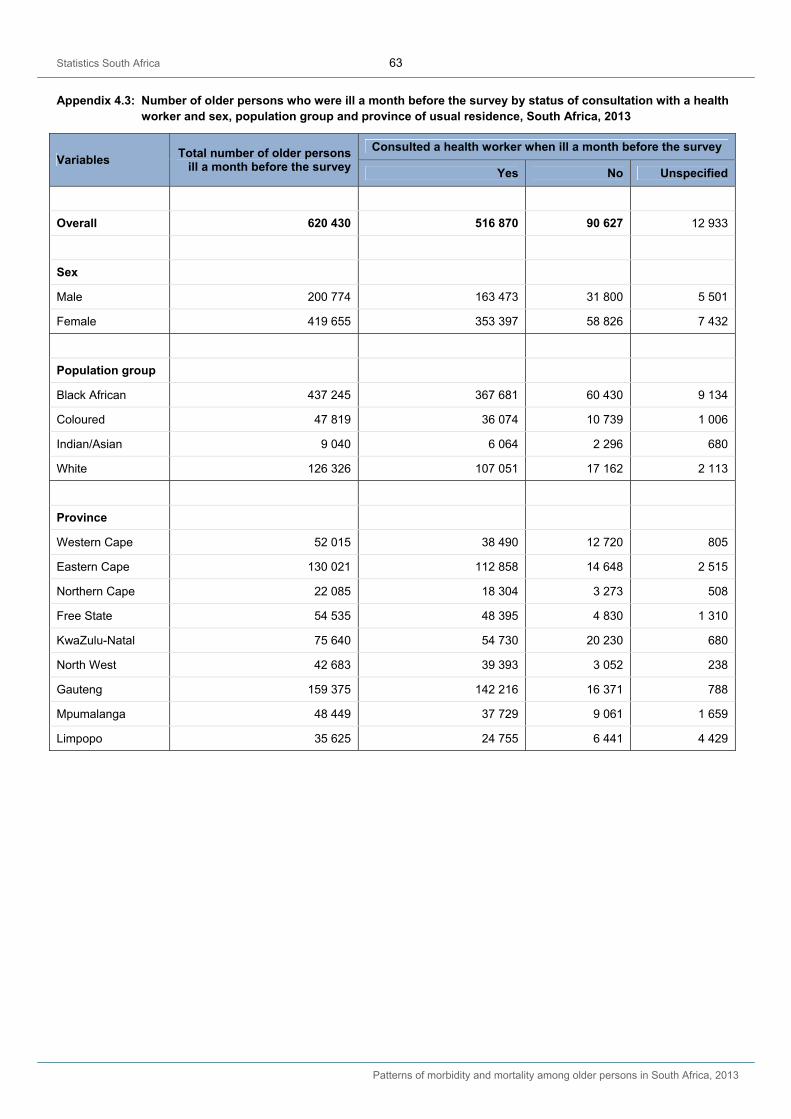
Statistics South Africa 63
Patterns of morbidity and mortality among older persons in South Africa, 2013
Appendix 4.3: Number of older persons who were ill a month before the survey by status of consultation with a health worker and sex, population group and province of usual residence, South Africa, 2013
Variables Total number of older persons
ill a month before the survey
Consulted a health worker when ill a month before the survey
Yes No Unspecified
Overall 620 430 516 870 90 627 12 933
Sex
Male 200 774 163 473 31 800 5 501
Female 419 655 353 397 58 826 7 432
Population group
Black African 437 245 367 681 60 430 9 134
Coloured 47 819 36 074 10 739 1 006
Indian/Asian 9 040 6 064 2 296 680
White 126 326 107 051 17 162 2 113
Province
Western Cape 52 015 38 490 12 720 805
Eastern Cape 130 021 112 858 14 648 2 515
Northern Cape 22 085 18 304 3 273 508
Free State 54 535 48 395 4 830 1 310
KwaZulu-Natal 75 640 54 730 20 230 680
North West 42 683 39 393 3 052 238
Gauteng 159 375 142 216 16 371 788
Mpumalanga 48 449 37 729 9 061 1 659
Limpopo 35 625 24 755 6 441 4 429
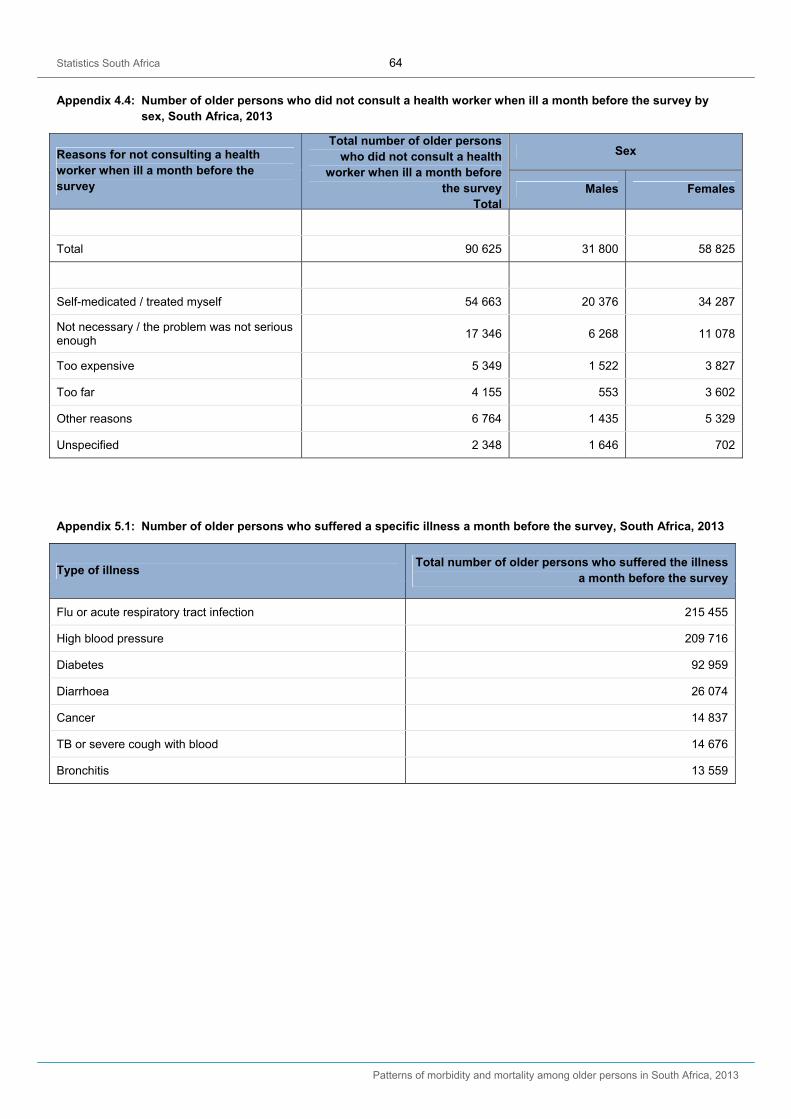
Statistics South Africa 64
Patterns of morbidity and mortality among older persons in South Africa, 2013
Appendix 4.4: Number of older persons who did not consult a health worker when ill a month before the survey by sex, South Africa, 2013
Reasons for not consulting a health worker when ill a month before the survey
Total number of older persons who did not consult a health
worker when ill a month before the survey
Total
Sex
Males Females
Total 90 625 31 800 58 825
Self-medicated / treated myself 54 663 20 376 34 287
Not necessary / the problem was not serious enough
17 346 6 268 11 078
Too expensive 5 349 1 522 3 827
Too far 4 155 553 3 602
Other reasons 6 764 1 435 5 329
Unspecified 2 348 1 646 702
Appendix 5.1: Number of older persons who suffered a specific illness a month before the survey, South Africa, 2013
Type of illness Total number of older persons who suffered the illness
a month before the survey
Flu or acute respiratory tract infection 215 455
High blood pressure 209 716
Diabetes 92 959
Diarrhoea 26 074
Cancer 14 837
TB or severe cough with blood 14 676
Bronchitis 13 559
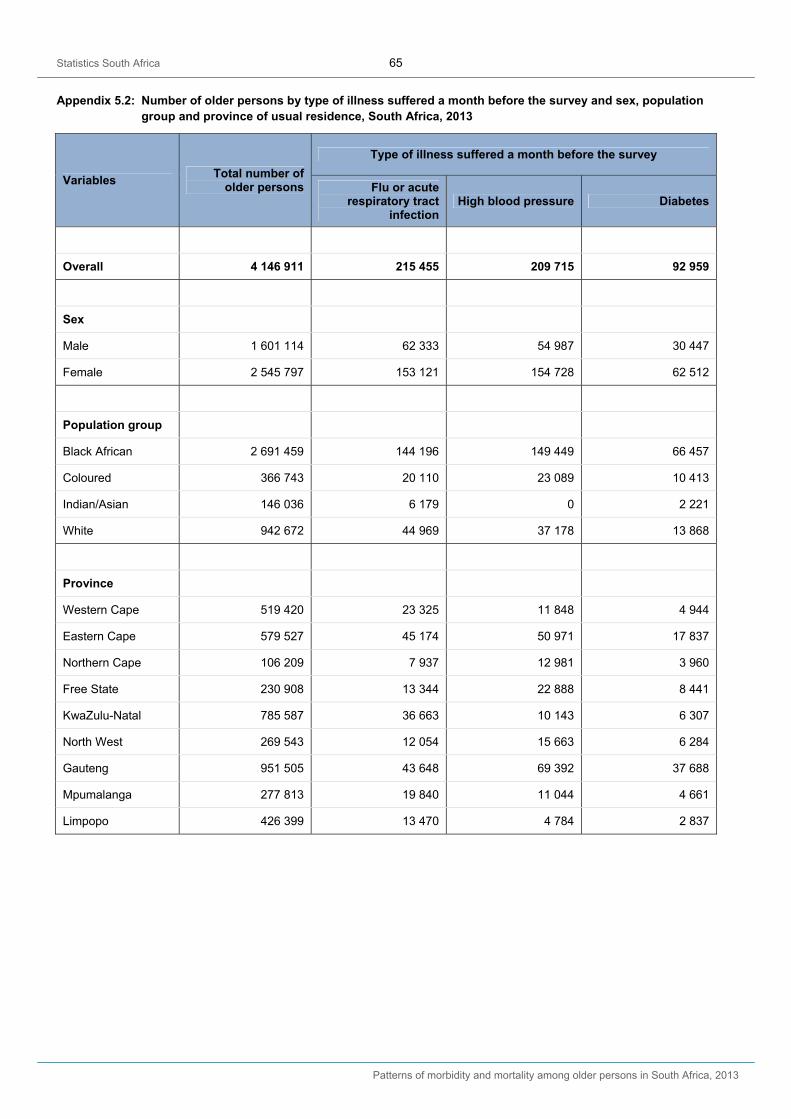
Statistics South Africa 65
Patterns of morbidity and mortality among older persons in South Africa, 2013
Appendix 5.2: Number of older persons by type of illness suffered a month before the survey and sex, population group and province of usual residence, South Africa, 2013
Variables Total number of
older persons
Type of illness suffered a month before the survey
Flu or acute respiratory tract
infection High blood pressure Diabetes
Overall 4 146 911 215 455 209 715 92 959
Sex
Male 1 601 114 62 333 54 987 30 447
Female 2 545 797 153 121 154 728 62 512
Population group
Black African 2 691 459 144 196 149 449 66 457
Coloured 366 743 20 110 23 089 10 413
Indian/Asian 146 036 6 179 0 2 221
White 942 672 44 969 37 178 13 868
Province
Western Cape 519 420 23 325 11 848 4 944
Eastern Cape 579 527 45 174 50 971 17 837
Northern Cape 106 209 7 937 12 981 3 960
Free State 230 908 13 344 22 888 8 441
KwaZulu-Natal 785 587 36 663 10 143 6 307
North West 269 543 12 054 15 663 6 284
Gauteng 951 505 43 648 69 392 37 688
Mpumalanga 277 813 19 840 11 044 4 661
Limpopo 426 399 13 470 4 784 2 837
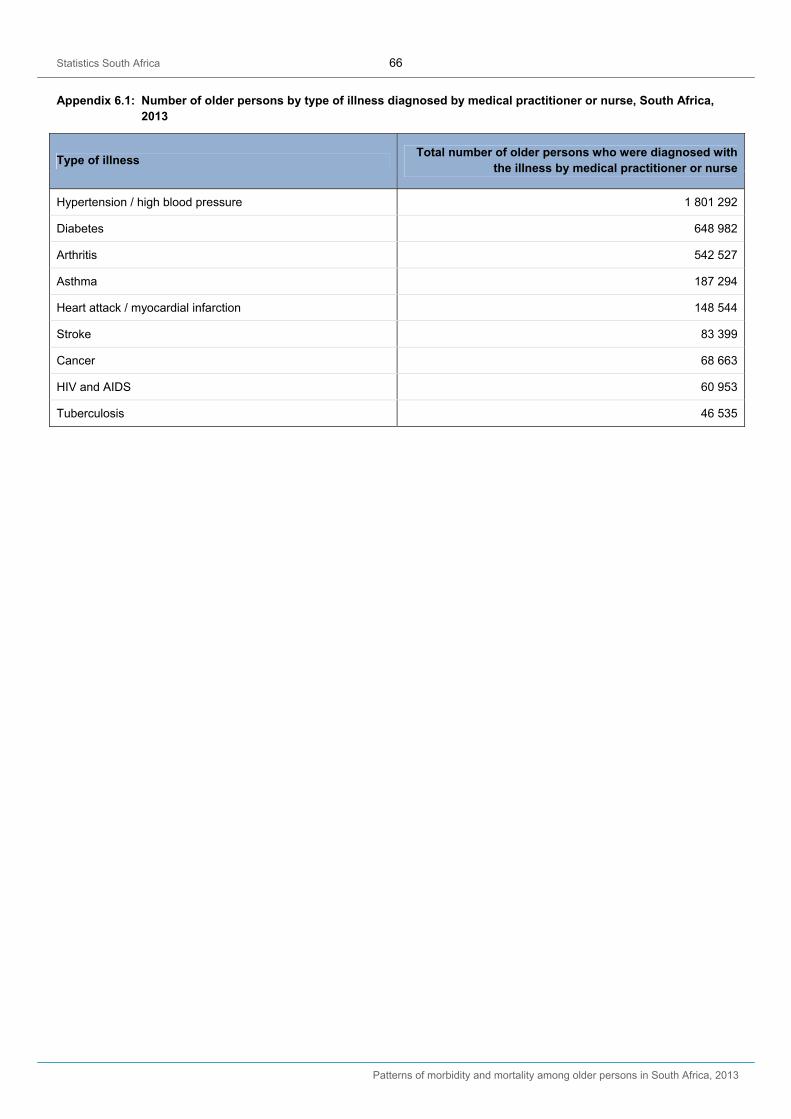
Statistics South Africa 66
Patterns of morbidity and mortality among older persons in South Africa, 2013
Appendix 6.1: Number of older persons by type of illness diagnosed by medical practitioner or nurse, South Africa, 2013
Type of illness Total number of older persons who were diagnosed with
the illness by medical practitioner or nurse
Hypertension / high blood pressure 1 801 292
Diabetes 648 982
Arthritis 542 527
Asthma 187 294
Heart attack / myocardial infarction 148 544
Stroke 83 399
Cancer 68 663
HIV and AIDS 60 953
Tuberculosis 46 535
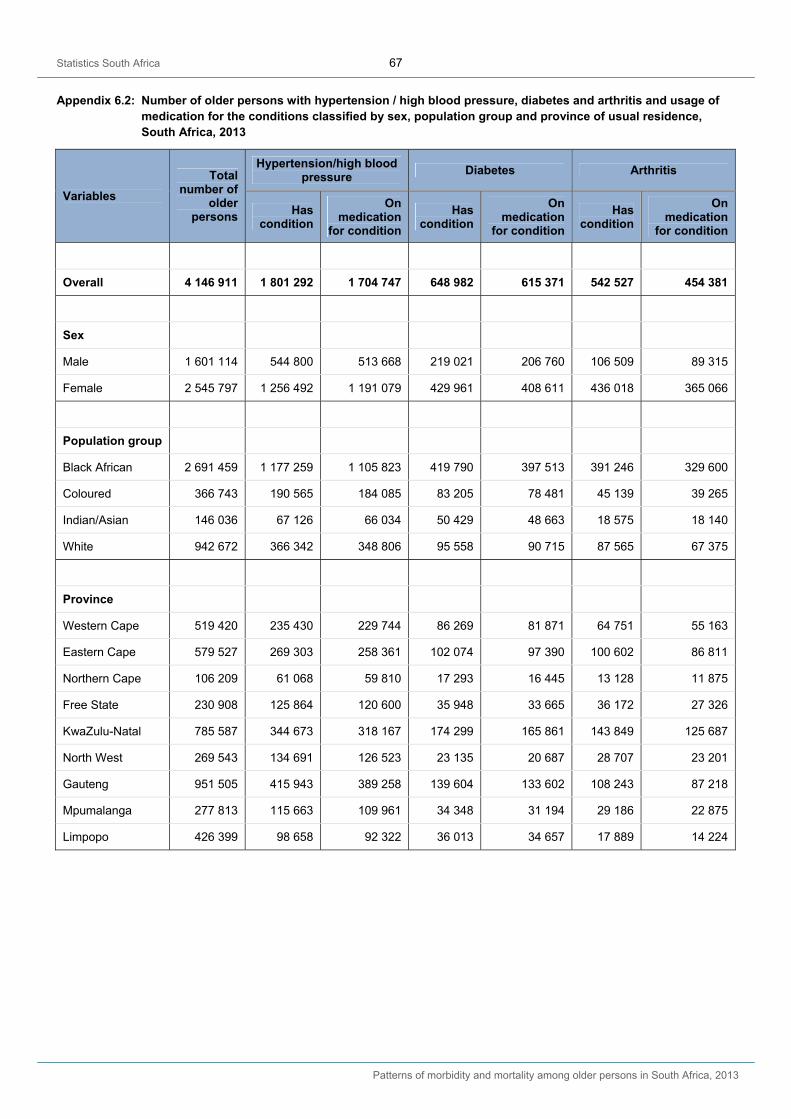
Statistics South Africa 67
Patterns of morbidity and mortality among older persons in South Africa, 2013
Appendix 6.2: Number of older persons with hypertension / high blood pressure, diabetes and arthritis and usage of medication for the conditions classified by sex, population group and province of usual residence, South Africa, 2013
Variables
Total number of
older persons
Hypertension/high blood pressure
Diabetes Arthritis
Has condition
On medication
for condition
Has condition
On medication
for condition
Has condition
On medication
for condition
Overall 4 146 911 1 801 292 1 704 747 648 982 615 371 542 527 454 381
Sex
Male 1 601 114 544 800 513 668 219 021 206 760 106 509 89 315
Female 2 545 797 1 256 492 1 191 079 429 961 408 611 436 018 365 066
Population group
Black African 2 691 459 1 177 259 1 105 823 419 790 397 513 391 246 329 600
Coloured 366 743 190 565 184 085 83 205 78 481 45 139 39 265
Indian/Asian 146 036 67 126 66 034 50 429 48 663 18 575 18 140
White 942 672 366 342 348 806 95 558 90 715 87 565 67 375
Province
Western Cape 519 420 235 430 229 744 86 269 81 871 64 751 55 163
Eastern Cape 579 527 269 303 258 361 102 074 97 390 100 602 86 811
Northern Cape 106 209 61 068 59 810 17 293 16 445 13 128 11 875
Free State 230 908 125 864 120 600 35 948 33 665 36 172 27 326
KwaZulu-Natal 785 587 344 673 318 167 174 299 165 861 143 849 125 687
North West 269 543 134 691 126 523 23 135 20 687 28 707 23 201
Gauteng 951 505 415 943 389 258 139 604 133 602 108 243 87 218
Mpumalanga 277 813 115 663 109 961 34 348 31 194 29 186 22 875
Limpopo 426 399 98 658 92 322 36 013 34 657 17 889 14 224
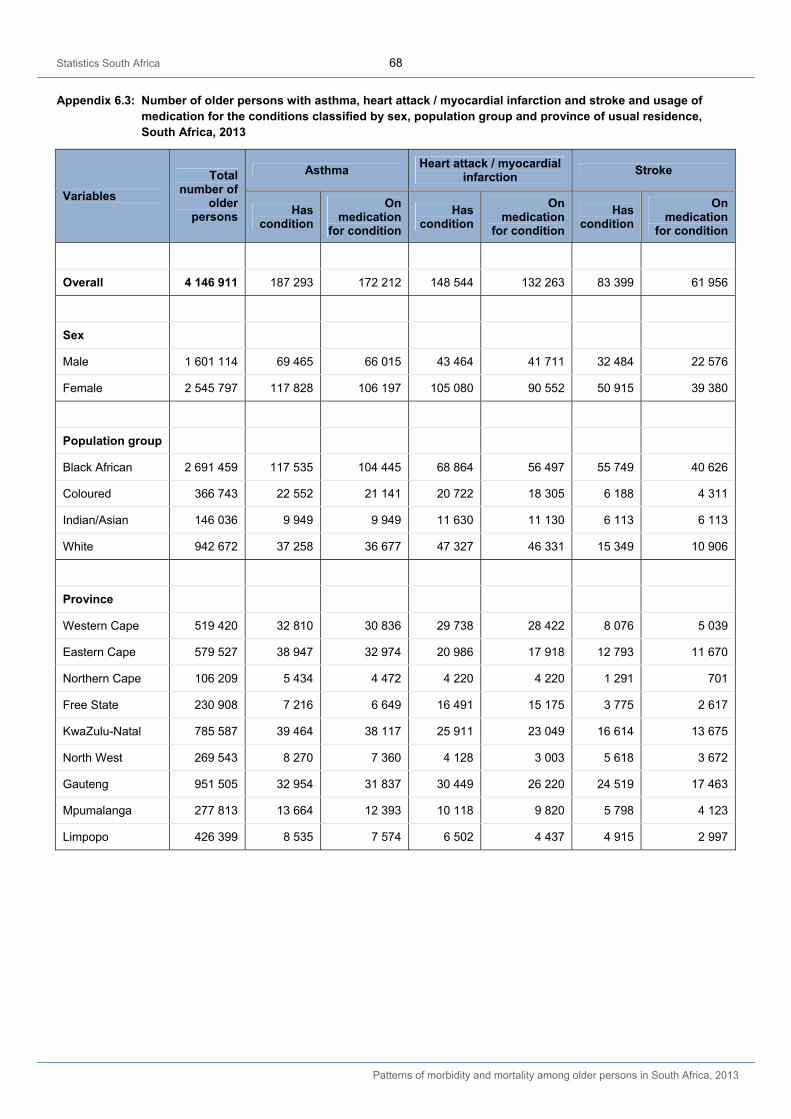
Statistics South Africa 68
Patterns of morbidity and mortality among older persons in South Africa, 2013
Appendix 6.3: Number of older persons with asthma, heart attack / myocardial infarction and stroke and usage of medication for the conditions classified by sex, population group and province of usual residence, South Africa, 2013
Variables
Total number of
older persons
Asthma Heart attack / myocardial
infarction Stroke
Has condition
On medication
for condition
Has condition
On medication
for condition
Has condition
On medication
for condition
Overall 4 146 911 187 293 172 212 148 544 132 263 83 399 61 956
Sex
Male 1 601 114 69 465 66 015 43 464 41 711 32 484 22 576
Female 2 545 797 117 828 106 197 105 080 90 552 50 915 39 380
Population group
Black African 2 691 459 117 535 104 445 68 864 56 497 55 749 40 626
Coloured 366 743 22 552 21 141 20 722 18 305 6 188 4 311
Indian/Asian 146 036 9 949 9 949 11 630 11 130 6 113 6 113
White 942 672 37 258 36 677 47 327 46 331 15 349 10 906
Province
Western Cape 519 420 32 810 30 836 29 738 28 422 8 076 5 039
Eastern Cape 579 527 38 947 32 974 20 986 17 918 12 793 11 670
Northern Cape 106 209 5 434 4 472 4 220 4 220 1 291 701
Free State 230 908 7 216 6 649 16 491 15 175 3 775 2 617
KwaZulu-Natal 785 587 39 464 38 117 25 911 23 049 16 614 13 675
North West 269 543 8 270 7 360 4 128 3 003 5 618 3 672
Gauteng 951 505 32 954 31 837 30 449 26 220 24 519 17 463
Mpumalanga 277 813 13 664 12 393 10 118 9 820 5 798 4 123
Limpopo 426 399 8 535 7 574 6 502 4 437 4 915 2 997
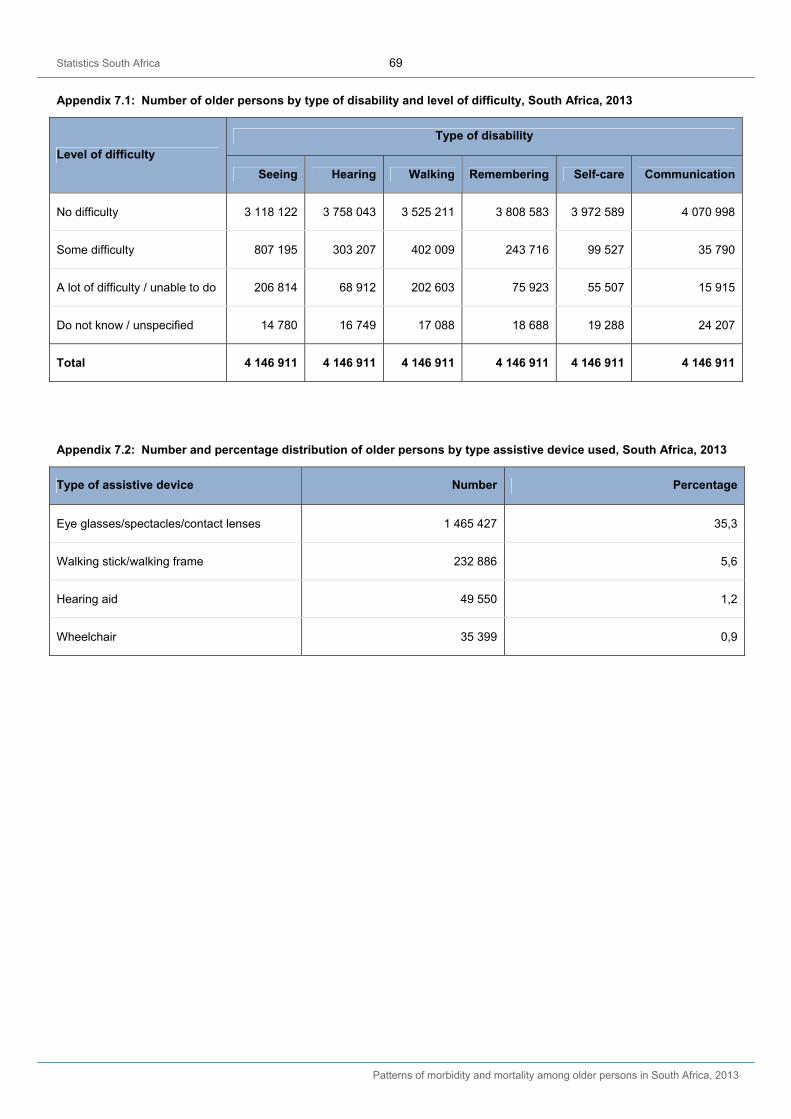
Statistics South Africa 69
Patterns of morbidity and mortality among older persons in South Africa, 2013
Appendix 7.1: Number of older persons by type of disability and level of difficulty, South Africa, 2013
Level of difficulty
Type of disability
Seeing Hearing Walking Remembering Self-care Communication
No difficulty 3 118 122 3 758 043 3 525 211 3 808 583 3 972 589 4 070 998
Some difficulty 807 195 303 207 402 009 243 716 99 527 35 790
A lot of difficulty / unable to do 206 814 68 912 202 603 75 923 55 507 15 915
Do not know / unspecified 14 780 16 749 17 088 18 688 19 288 24 207
Total 4 146 911 4 146 911 4 146 911 4 146 911 4 146 911 4 146 911
Appendix 7.2: Number and percentage distribution of older persons by type assistive device used, South Africa, 2013
Type of assistive device Number Percentage
Eye glasses/spectacles/contact lenses 1 465 427 35,3
Walking stick/walking frame 232 886 5,6
Hearing aid 49 550 1,2
Wheelchair 35 399 0,9
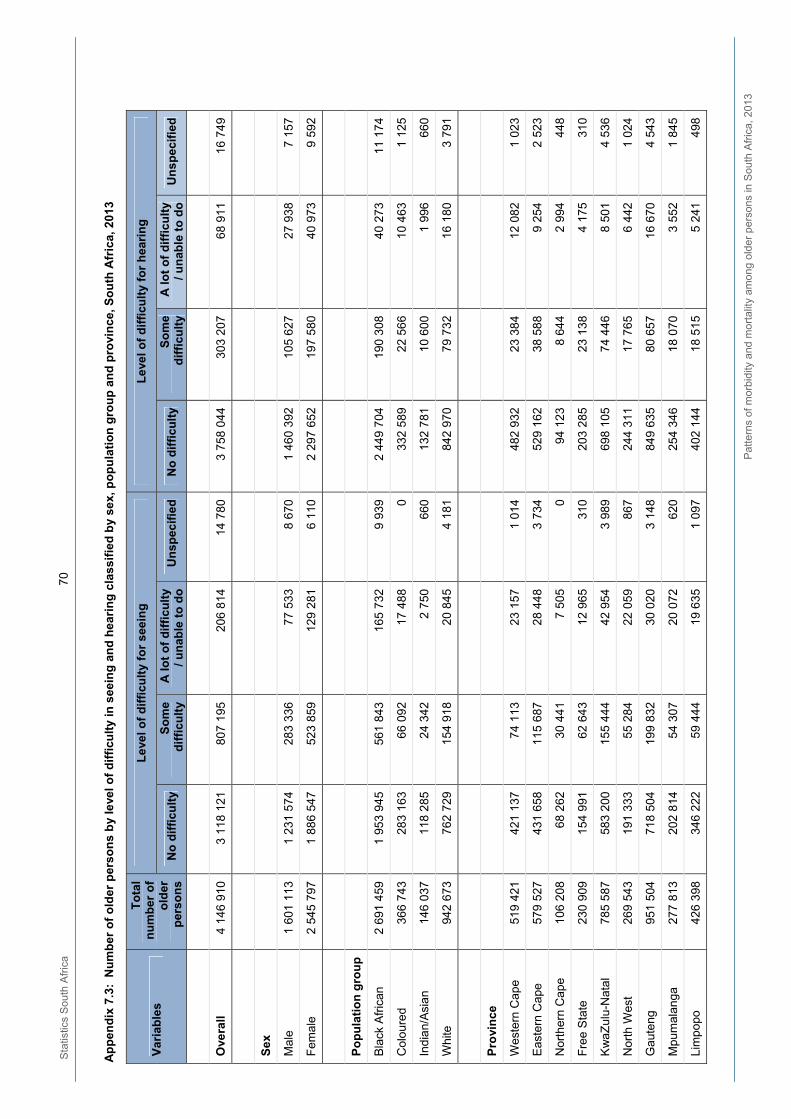
Sta
tistic
s S
outh
Afr
ica
70
P
atte
rns
of m
orbi
dity
and
mo
rtal
ity a
mon
g ol
der
per
sons
in S
outh
Afr
ica,
201
3
Ap
pen
dix
7.3
: N
um
ber
of
old
er p
erso
ns
by
leve
l o
f d
iffi
cult
y in
see
ing
an
d h
eari
ng
cla
ssif
ied
by
sex,
po
pu
lati
on
gro
up
an
d p
rovi
nc
e, S
ou
th A
fric
a, 2
013
Var
iab
les
To
tal
nu
mb
er o
f o
lder
p
erso
ns
Le
vel o
f d
iffi
cult
y fo
r se
ein
g
Lev
el
of
dif
ficu
lty
for
hea
rin
g
No
dif
ficu
lty
So
me
dif
ficu
lty
A l
ot
of
dif
ficu
lty
/ u
nab
le t
o d
o
Un
spec
ifie
d
No
dif
ficu
lty
So
me
dif
ficu
lty
A l
ot
of
dif
ficu
lty
/ u
nab
le t
o d
o
Un
spec
ifie
d
Ove
rall
4
146
910
3
118
121
80
7 1
95
206
814
14
78
0
3 75
8 0
44
303
207
68
91
1
16 7
49
Sex
Mal
e
1 60
1 1
13
1 23
1 5
74
283
336
77
53
3
8 67
0
1 46
0 3
92
105
627
27
93
8
7 15
7
Fem
ale
2
545
797
1
886
547
52
3 8
59
129
281
6
110
2
297
652
19
7 5
80
40 9
73
9
592
Po
pu
lati
on
gro
up
Bla
ck A
fric
an
2 69
1 4
59
1 95
3 9
45
561
843
16
5 7
32
9 93
9
2 44
9 7
04
190
308
40
27
3
11 1
74
Col
our
ed
36
6 7
43
283
163
66
09
2
17 4
88
0
332
589
22
56
6
10 4
63
1
125
Indi
an/
Asi
an
14
6 0
37
118
285
24
34
2
2 75
0
660
13
2 7
81
10 6
00
1
996
66
0
Whi
te
942
673
76
2 7
29
154
918
20
84
5
4 18
1
842
970
79
73
2
16 1
80
3
791
Pro
vin
ce
Wes
tern
Cap
e
519
421
42
1 1
37
74 1
13
23
15
7
1 01
4
482
932
23
38
4
12 0
82
1
023
Eas
tern
Ca
pe
579
527
43
1 6
58
115
687
28
44
8
3 73
4
529
162
38
58
8
9 25
4
2 52
3
Nor
ther
n C
ape
10
6 2
08
68 2
62
30
44
1
7 50
5
0 94
12
3
8 64
4
2 99
4
448
Fre
e S
tate
23
0 9
09
154
991
62
64
3
12 9
65
31
0
203
285
23
13
8
4 17
5
310
Kw
aZul
u-N
ata
l 78
5 5
87
583
200
15
5 4
44
42 9
54
3
989
69
8 1
05
74 4
46
8
501
4
536
Nor
th W
est
269
543
19
1 3
33
55 2
84
22
05
9
867
24
4 3
11
17 7
65
6
442
1
024
Gau
teng
95
1 5
04
718
504
19
9 8
32
30 0
20
3
148
84
9 6
35
80 6
57
16
67
0
4 54
3
Mpu
mal
anga
27
7 8
13
202
814
54
30
7
20 0
72
62
0
254
346
18
07
0
3 55
2
1 84
5
Lim
pop
o
426
398
34
6 2
22
59 4
44
19
63
5
1 09
7
402
144
18
51
5
5 24
1
498
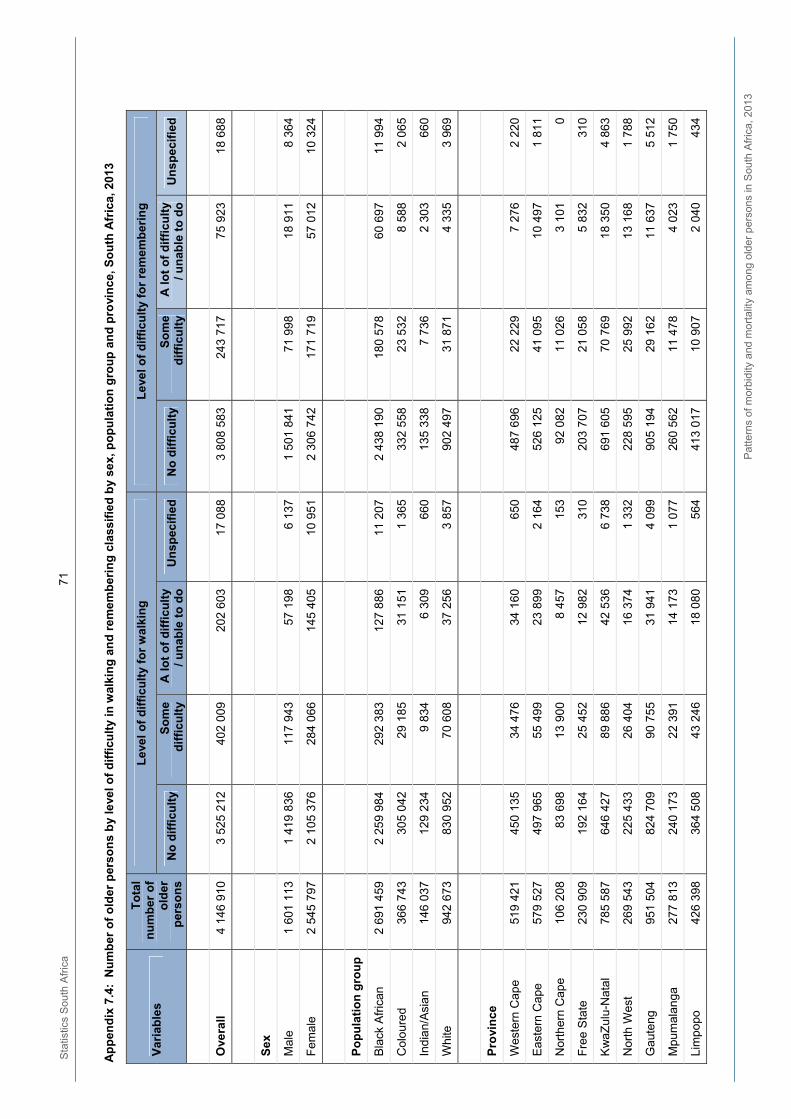
Sta
tistic
s S
outh
Afr
ica
71
P
atte
rns
of m
orbi
dity
and
mo
rtal
ity a
mon
g ol
der
per
sons
in S
outh
Afr
ica,
201
3
Ap
pen
dix
7.4
: N
um
ber
of
old
er p
erso
ns
by
leve
l of
dif
ficu
lty
in w
alki
ng
an
d r
emem
ber
ing
cla
ssif
ied
by
sex,
po
pu
lati
on
gro
up
an
d p
rovi
nc
e, S
ou
th A
fric
a, 2
013
Var
iab
les
To
tal
nu
mb
er o
f o
lder
p
erso
ns
Lev
el
of
dif
ficu
lty
for
wal
kin
g
Lev
el
of
dif
ficu
lty
for
rem
emb
erin
g
No
dif
ficu
lty
So
me
dif
ficu
lty
A l
ot
of
dif
ficu
lty
/ u
nab
le t
o d
o
Un
spec
ifie
d
No
dif
ficu
lty
So
me
dif
ficu
lty
A l
ot
of
dif
ficu
lty
/ u
nab
le t
o d
o
Un
spec
ifie
d
Ove
rall
4
146
910
3
525
212
40
2 0
09
202
603
17
08
8
3 80
8 5
83
243
717
75
92
3
18 6
88
Sex
Mal
e
1 60
1 1
13
1 41
9 8
36
117
943
57
19
8
6 13
7
1 50
1 8
41
71 9
98
18
91
1
8 36
4
Fem
ale
2
545
797
2
105
376
28
4 0
66
145
405
10
95
1
2 30
6 7
42
171
719
57
01
2
10 3
24
Po
pu
lati
on
gro
up
Bla
ck A
fric
an
2 69
1 4
59
2 25
9 9
84
292
383
12
7 8
86
11 2
07
2
438
190
18
0 5
78
60 6
97
11
99
4
Col
our
ed
36
6 7
43
305
042
29
18
5
31 1
51
1
365
33
2 5
58
23 5
32
8
588
2
065
Indi
an/
Asi
an
14
6 0
37
129
234
9
834
6
309
66
0
135
338
7
736
2
303
66
0
Whi
te
942
673
83
0 9
52
70 6
08
37
25
6
3 85
7
902
497
31
87
1
4 33
5
3 96
9
Pro
vin
ce
Wes
tern
Cap
e
519
421
45
0 1
35
34 4
76
34
16
0
650
48
7 6
96
22 2
29
7
276
2
220
Eas
tern
Ca
pe
579
527
49
7 9
65
55 4
99
23
89
9
2 16
4
526
125
41
09
5
10 4
97
1
811
Nor
ther
n C
ape
10
6 2
08
83 6
98
13
90
0
8 45
7
153
92
08
2
11 0
26
3
101
0
Fre
e S
tate
23
0 9
09
192
164
25
45
2
12 9
82
31
0
203
707
21
05
8
5 83
2
310
Kw
aZul
u-N
ata
l 78
5 5
87
646
427
89
88
6
42 5
36
6
738
69
1 6
05
70 7
69
18
35
0
4 86
3
Nor
th W
est
269
543
22
5 4
33
26 4
04
16
37
4
1 33
2
228
595
25
99
2
13 1
68
1
788
Gau
teng
95
1 5
04
824
709
90
75
5
31 9
41
4
099
90
5 1
94
29 1
62
11
63
7
5 51
2
Mpu
mal
anga
27
7 8
13
240
173
22
39
1
14 1
73
1
077
26
0 5
62
11 4
78
4
023
1
750
Lim
pop
o
426
398
36
4 5
08
43 2
46
18
08
0
564
41
3 0
17
10 9
07
2
040
43
4
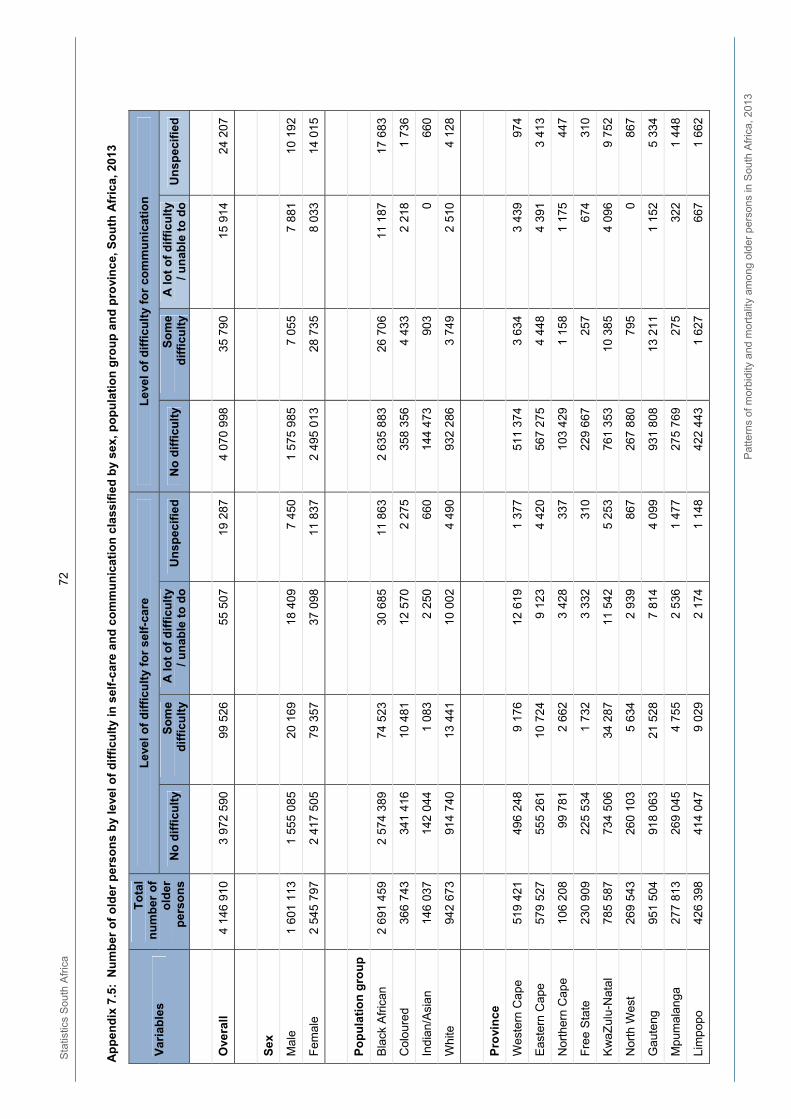
Sta
tistic
s S
outh
Afr
ica
72
P
atte
rns
of m
orbi
dity
and
mo
rtal
ity a
mon
g ol
der
per
sons
in S
outh
Afr
ica,
201
3
Ap
pen
dix
7.5
: N
um
ber
of
old
er p
erso
ns
by
leve
l o
f d
iffi
cult
y in
sel
f-ca
re a
nd
co
mm
un
icat
ion
cla
ssif
ied
by
sex,
po
pu
lati
on
gro
up
an
d p
rovi
nce
, So
uth
Afr
ica,
201
3
Var
iab
les
To
tal
nu
mb
er o
f o
lder
p
erso
ns
Lev
el
of
dif
ficu
lty
for
self
-car
e L
eve
l o
f d
iffi
cult
y fo
r co
mm
un
icat
ion
No
dif
ficu
lty
So
me
dif
ficu
lty
A l
ot
of
dif
ficu
lty
/ u
nab
le t
o d
o
Un
spec
ifie
d
No
dif
ficu
lty
So
me
dif
ficu
lty
A l
ot
of
dif
ficu
lty
/ u
nab
le t
o d
o
Un
spec
ifie
d
Ove
rall
4
146
910
3
972
590
99
52
6
55 5
07
19
28
7
4 07
0 9
98
35 7
90
15
91
4
24 2
07
Sex
Mal
e
1 60
1 1
13
1 55
5 0
85
20 1
69
18
40
9
7 45
0
1 57
5 9
85
7 05
5
7 88
1
10 1
92
Fem
ale
2
545
797
2
417
505
79
35
7
37 0
98
11
83
7
2 49
5 0
13
28 7
35
8
033
14
01
5
Po
pu
lati
on
gro
up
Bla
ck A
fric
an
2 69
1 4
59
2 57
4 3
89
74 5
23
30
68
5
11 8
63
2
635
883
26
70
6
11 1
87
17
68
3
Col
our
ed
36
6 7
43
341
416
10
48
1
12 5
70
2
275
35
8 3
56
4 43
3
2 21
8
1 73
6
Indi
an/
Asi
an
14
6 0
37
142
044
1
083
2
250
66
0
144
473
90
3
0 66
0
Whi
te
942
673
91
4 7
40
13 4
41
10
00
2
4 49
0
932
286
3
749
2
510
4
128
Pro
vin
ce
Wes
tern
Cap
e
519
421
49
6 2
48
9 17
6
12 6
19
1
377
51
1 3
74
3 63
4
3 43
9
974
Eas
tern
Ca
pe
579
527
55
5 2
61
10 7
24
9
123
4
420
56
7 2
75
4 44
8
4 39
1
3 41
3
Nor
ther
n C
ape
10
6 2
08
99 7
81
2
662
3
428
33
7
103
429
1
158
1
175
44
7
Fre
e S
tate
23
0 9
09
225
534
1
732
3
332
31
0
229
667
25
7
674
31
0
Kw
aZul
u-N
ata
l 78
5 5
87
734
506
34
28
7
11 5
42
5
253
76
1 3
53
10 3
85
4
096
9
752
Nor
th W
est
269
543
26
0 1
03
5 63
4
2 93
9
867
26
7 8
80
795
0
867
Gau
teng
95
1 5
04
918
063
21
52
8
7 81
4
4 09
9
931
808
13
21
1
1 15
2
5 33
4
Mpu
mal
anga
27
7 8
13
269
045
4
755
2
536
1
477
27
5 7
69
275
32
2
1 44
8
Lim
pop
o
426
398
41
4 0
47
9 02
9
2 17
4
1 14
8
422
443
1
627
66
7
1 66
2
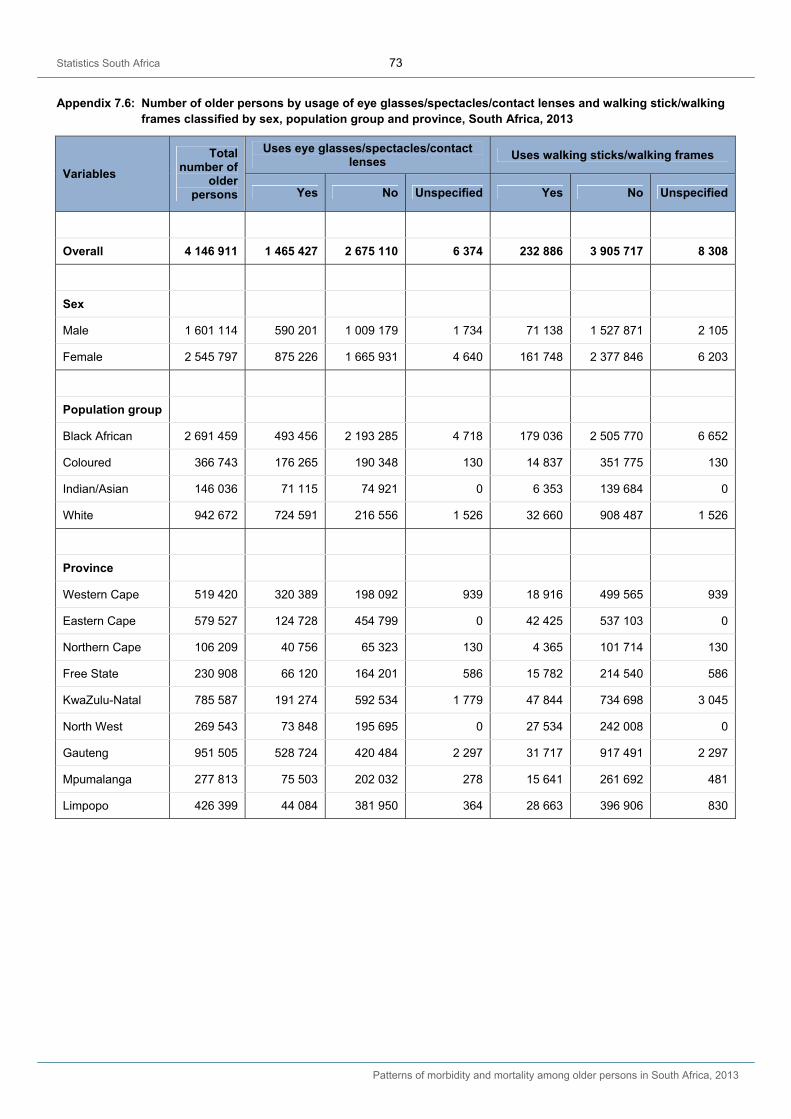
Statistics South Africa 73
Patterns of morbidity and mortality among older persons in South Africa, 2013
Appendix 7.6: Number of older persons by usage of eye glasses/spectacles/contact lenses and walking stick/walking frames classified by sex, population group and province, South Africa, 2013
Variables
Total number of
older persons
Uses eye glasses/spectacles/contact lenses
Uses walking sticks/walking frames
Yes No Unspecified Yes No Unspecified
Overall 4 146 911 1 465 427 2 675 110 6 374 232 886 3 905 717 8 308
Sex
Male 1 601 114 590 201 1 009 179 1 734 71 138 1 527 871 2 105
Female 2 545 797 875 226 1 665 931 4 640 161 748 2 377 846 6 203
Population group
Black African 2 691 459 493 456 2 193 285 4 718 179 036 2 505 770 6 652
Coloured 366 743 176 265 190 348 130 14 837 351 775 130
Indian/Asian 146 036 71 115 74 921 0 6 353 139 684 0
White 942 672 724 591 216 556 1 526 32 660 908 487 1 526
Province
Western Cape 519 420 320 389 198 092 939 18 916 499 565 939
Eastern Cape 579 527 124 728 454 799 0 42 425 537 103 0
Northern Cape 106 209 40 756 65 323 130 4 365 101 714 130
Free State 230 908 66 120 164 201 586 15 782 214 540 586
KwaZulu-Natal 785 587 191 274 592 534 1 779 47 844 734 698 3 045
North West 269 543 73 848 195 695 0 27 534 242 008 0
Gauteng 951 505 528 724 420 484 2 297 31 717 917 491 2 297
Mpumalanga 277 813 75 503 202 032 278 15 641 261 692 481
Limpopo 426 399 44 084 381 950 364 28 663 396 906 830

Statistics South Africa 74
Patterns of morbidity and mortality among older persons in South Africa, 2013
Appendix 8.1: Number of deaths by year of death and age, South Africa, 2013
Year of death Total number of
deaths
Age of deceased
0–59 years 60 years and older Unspecified
1997 317 412 189 689 122 139 5 584
1998 366 124 225 155 135 851 5 118
1999 382 121 244 788 134 617 2 716
2000 416 818 271 826 142 755 2 237
2001 455 656 302 038 151 674 1 944
2002 502 797 343 824 156 917 2 056
2003 557 792 387 988 166 942 2 862
2004 577 823 414 503 160 194 3 126
2005 598 866 430 398 165 153 3 315
2006 613 691 437 403 174 882 1 406
2007 605 448 426 889 177 256 1 303
2008 597 016 417 263 178 572 1 181
2009 582 024 391 869 188 386 1 769
2010 549 925 363 867 184 497 1 561
2011 514 486 323 888 187 996 2 602
2012 491 100 303 454 184 791 2 855
2013 458 933 276 860 180 289 1 784
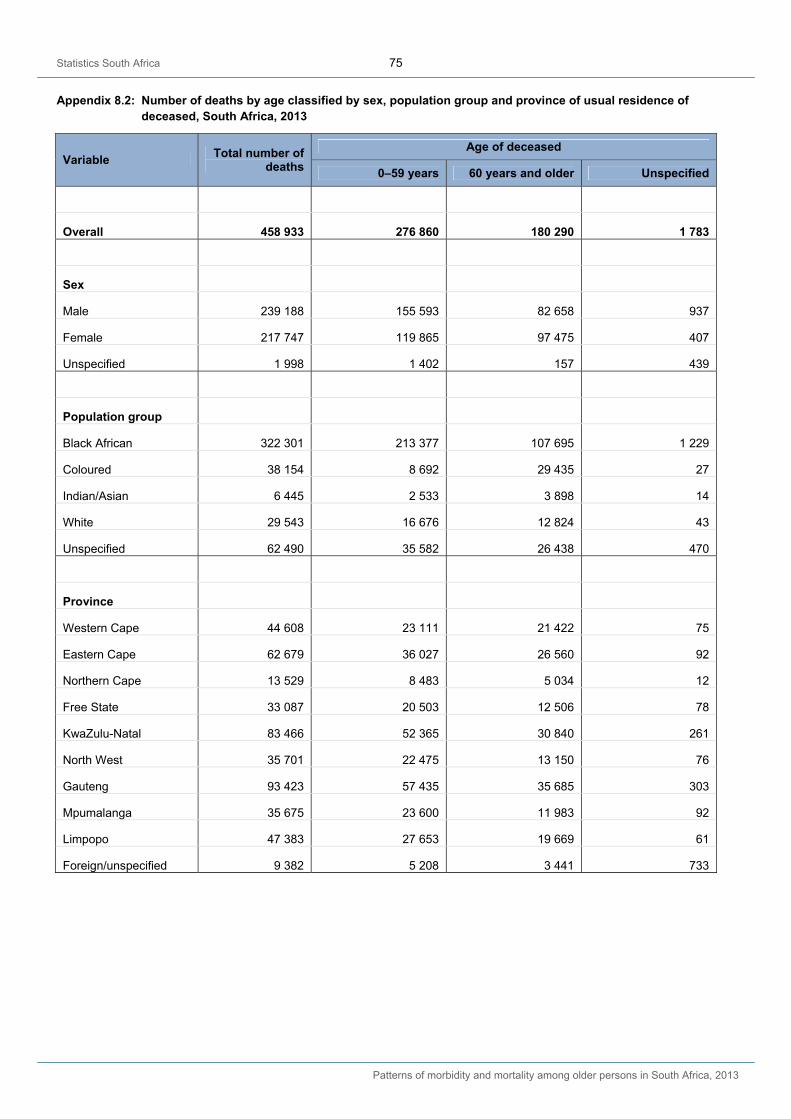
Statistics South Africa 75
Patterns of morbidity and mortality among older persons in South Africa, 2013
Appendix 8.2: Number of deaths by age classified by sex, population group and province of usual residence of deceased, South Africa, 2013
Variable Total number of
deaths
Age of deceased
0–59 years 60 years and older Unspecified
Overall 458 933 276 860 180 290 1 783
Sex
Male 239 188 155 593 82 658 937
Female 217 747 119 865 97 475 407
Unspecified 1 998 1 402 157 439
Population group
Black African 322 301 213 377 107 695 1 229
Coloured 38 154 8 692 29 435 27
Indian/Asian 6 445 2 533 3 898 14
White 29 543 16 676 12 824 43
Unspecified 62 490 35 582 26 438 470
Province
Western Cape 44 608 23 111 21 422 75
Eastern Cape 62 679 36 027 26 560 92
Northern Cape 13 529 8 483 5 034 12
Free State 33 087 20 503 12 506 78
KwaZulu-Natal 83 466 52 365 30 840 261
North West 35 701 22 475 13 150 76
Gauteng 93 423 57 435 35 685 303
Mpumalanga 35 675 23 600 11 983 92
Limpopo 47 383 27 653 19 669 61
Foreign/unspecified 9 382 5 208 3 441 733
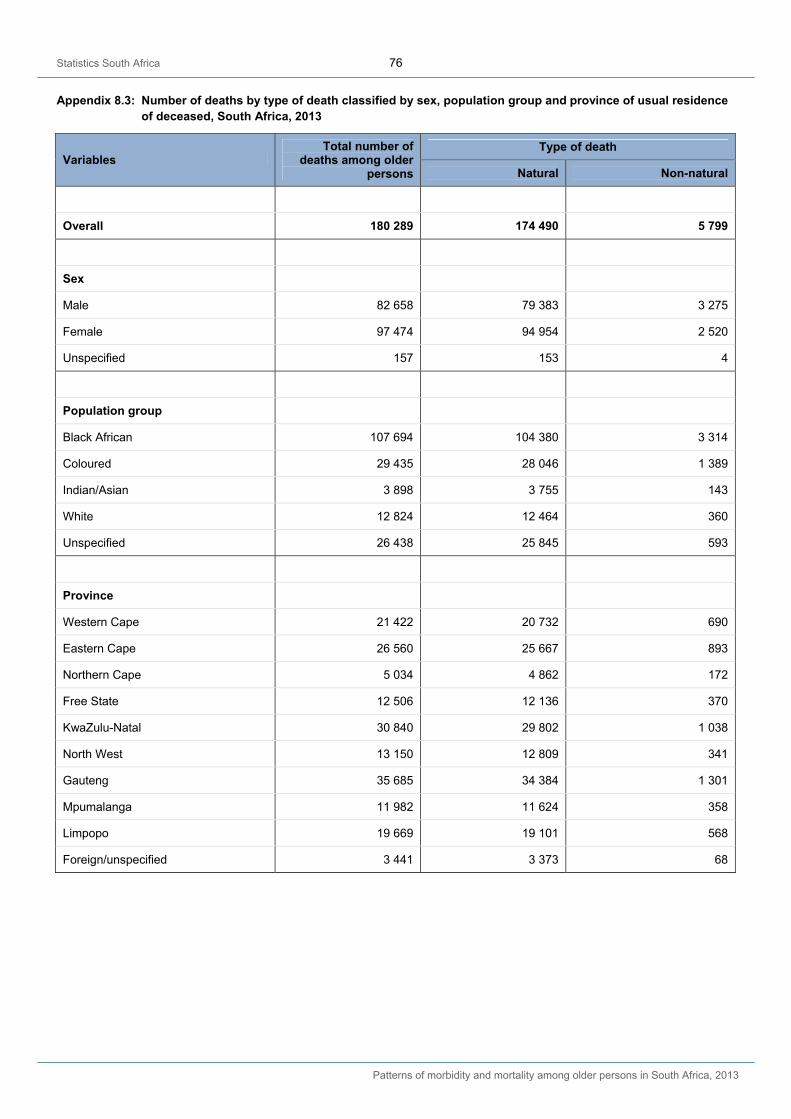
Statistics South Africa 76
Patterns of morbidity and mortality among older persons in South Africa, 2013
Appendix 8.3: Number of deaths by type of death classified by sex, population group and province of usual residence of deceased, South Africa, 2013
Variables Total number of
deaths among older persons
Type of death
Natural Non-natural
Overall 180 289 174 490 5 799
Sex
Male 82 658 79 383 3 275
Female 97 474 94 954 2 520
Unspecified 157 153 4
Population group
Black African 107 694 104 380 3 314
Coloured 29 435 28 046 1 389
Indian/Asian 3 898 3 755 143
White 12 824 12 464 360
Unspecified 26 438 25 845 593
Province
Western Cape 21 422 20 732 690
Eastern Cape 26 560 25 667 893
Northern Cape 5 034 4 862 172
Free State 12 506 12 136 370
KwaZulu-Natal 30 840 29 802 1 038
North West 13 150 12 809 341
Gauteng 35 685 34 384 1 301
Mpumalanga 11 982 11 624 358
Limpopo 19 669 19 101 568
Foreign/unspecified 3 441 3 373 68
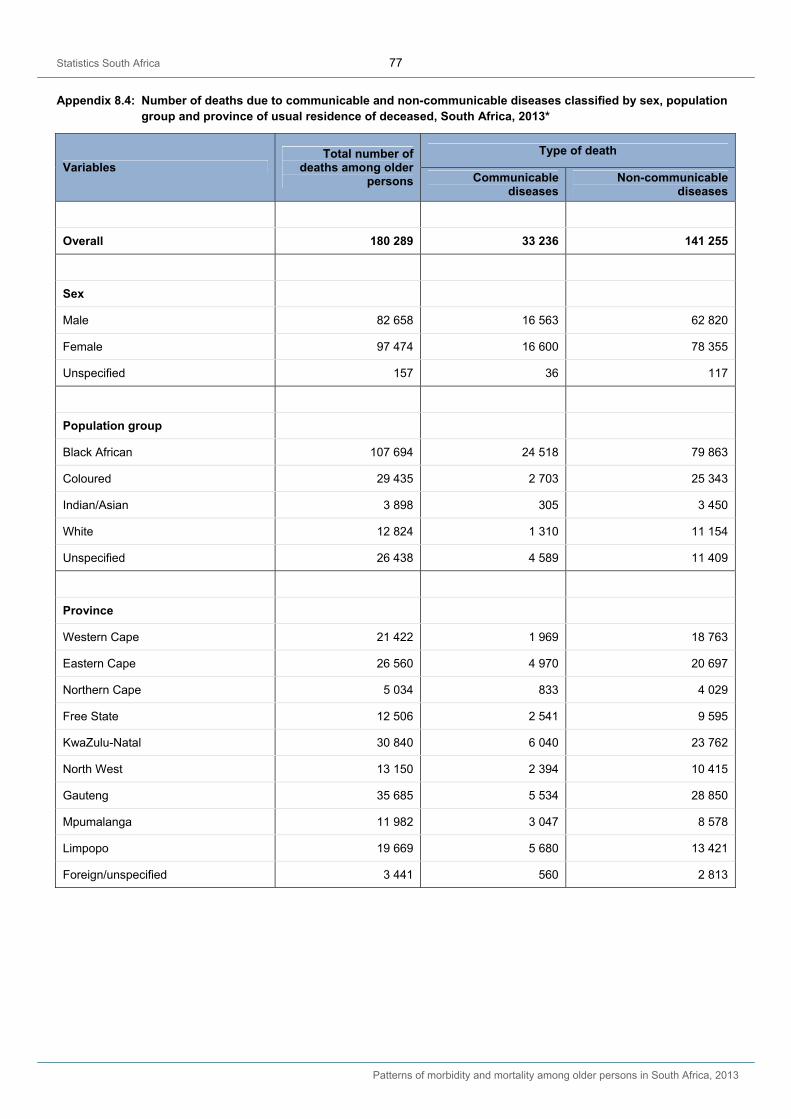
Statistics South Africa 77
Patterns of morbidity and mortality among older persons in South Africa, 2013
Appendix 8.4: Number of deaths due to communicable and non-communicable diseases classified by sex, population group and province of usual residence of deceased, South Africa, 2013*
Variables Total number of
deaths among older persons
Type of death
Communicable diseases
Non-communicable diseases
Overall 180 289 33 236 141 255
Sex
Male 82 658 16 563 62 820
Female 97 474 16 600 78 355
Unspecified 157 36 117
Population group
Black African 107 694 24 518 79 863
Coloured 29 435 2 703 25 343
Indian/Asian 3 898 305 3 450
White 12 824 1 310 11 154
Unspecified 26 438 4 589 11 409
Province
Western Cape 21 422 1 969 18 763
Eastern Cape 26 560 4 970 20 697
Northern Cape 5 034 833 4 029
Free State 12 506 2 541 9 595
KwaZulu-Natal 30 840 6 040 23 762
North West 13 150 2 394 10 415
Gauteng 35 685 5 534 28 850
Mpumalanga 11 982 3 047 8 578
Limpopo 19 669 5 680 13 421
Foreign/unspecified 3 441 560 2 813
Top Related