


Languages
Pages
Legal


Drying Panel

Panel Discussion: Wax vs Mold Surface Dryness Presented by:Julie MarkeeKey Process Innovations
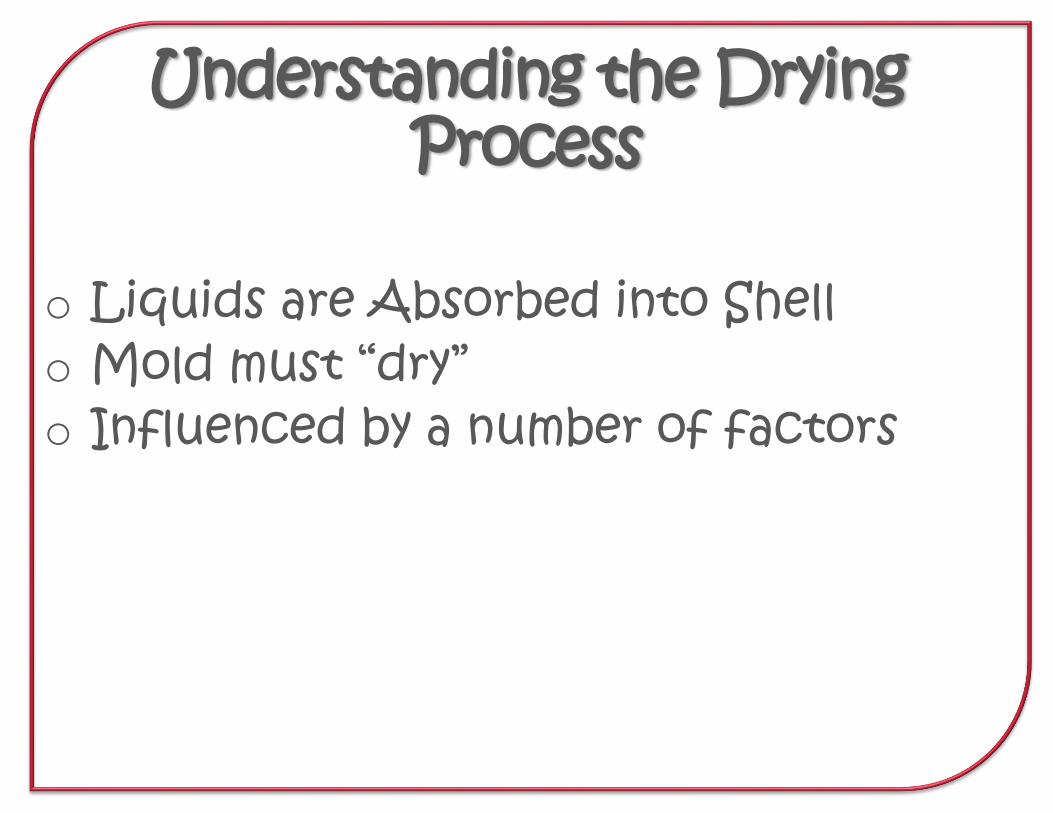
Understanding the Drying Process
o Liquids are Absorbed into Shello Mold must “dry”o Influenced by a number of factors

After a mold is dipped

Liquids move from the mold surface to the wax surface
Degree of soak back is dependent on numerous factors
Liquid Migration
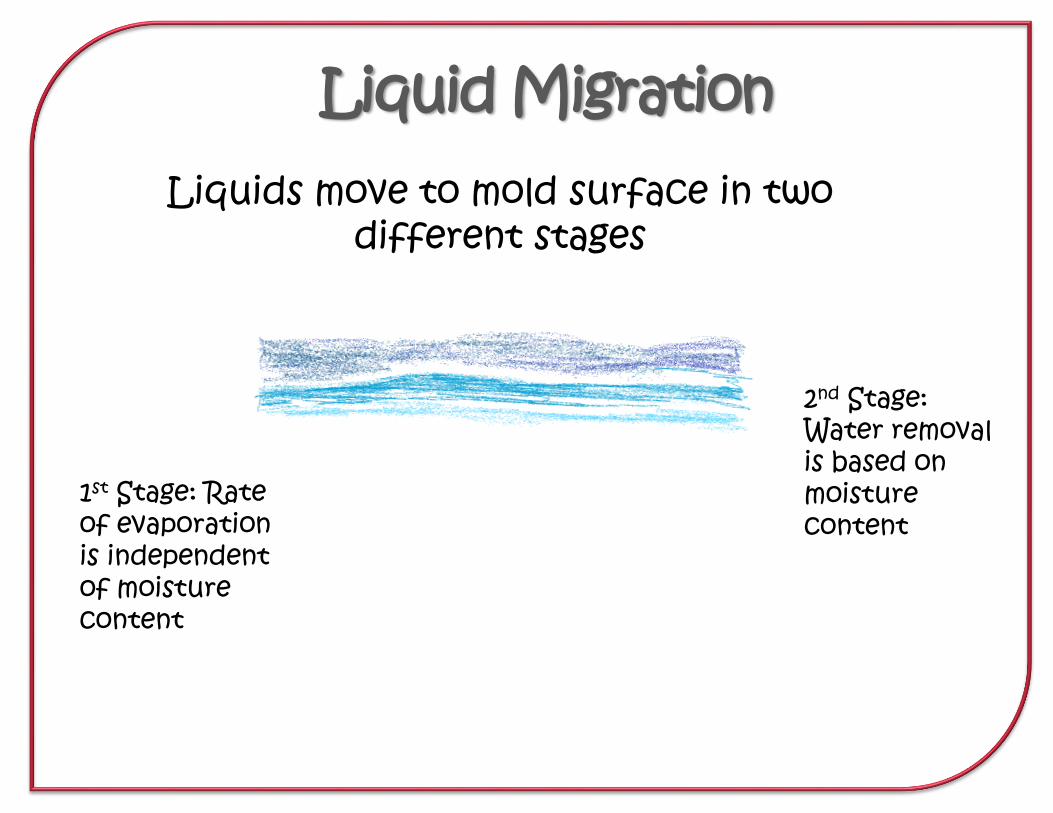
Liquids move to mold surface in two different stages
1st Stage: Rate of evaporation is independent of moisture content
2nd Stage: Water removal is based on moisture content
Liquid Migration

The Million Dollar Question
Which area of the mold has more moisture at the end of the drying
process?
Mold Surface Or Wax Surface

Quest for the AnswerThe Slurry
120/200 Fused Silica Slurry Small particle binder Viscosity – 20 seconds on #5 EZ
The Shell: 7 Layers were applied 2 with Fine Sand, 5 with Coarse
2 Locations were Measured: Wax and Mold Surface
Dips were applied when Mold Surface reached 65% RHUsed kpi-dry® system

Kpi-dry® System

Mold Set-Up
Sensor remained on Wax Surface
Moved sensor just prior to each layer

In Between Dips
Sensor at Mold Surface

At Conclusion of DippingSensor at Wax Surface
Sensor at Mold Surface

The Test

Room Environment
0
20
40
60
80
100
120
0
10
20
30
40
50
60
70
80
1:02:0
0
2:14:0
0
3:26:0
0
4:38:0
0
5:50:0
0
7:02:0
0
8:14:0
0
9:26:0
0
10:38:0
0
11:50:0
0
13:02:0
0
14:14:0
0
15:26:0
0
16:38:0
0
17:50:0
0
19:02:0
0
20:14:0
0
21:26:0
0
22:38:0
0
Air
Flo
w (
fpm
)
Tem
pe
ratu
re/R
ela
tive
Hu
mid
ity
Elapsed Time
Room Environment
Temperature (F) Relative Humidity (%) Air Flow (fpm)

Initial Test Data
50
55
60
65
70
75
0:00
1:59
7:16
8:19
9:19
10:19
11:19
12:19
13:19
14:19
15:19
16:19
17:19
18:19
19:19
20:19
21:19
22:19
23:19
Tem
per
atu
re (
F)
Elapsed Time (min)
Temperature - Initial Test
Wax Surface Temp Shell Surface Temp Room Temperature
3-4 ºF difference between Wax and Shell Surface
Initial Test Data
30
40
50
60
70
80
90
100
30
40
50
60
70
80
90
100
0:00
2:11
7:30
8:40
9:47
10:54
12:01
13:08
14:15
15:22
16:29
17:36
18:43
19:50
20:57
22:04
23:11
Ro
om
Rel
ativ
e H
um
idit
y (%
)
Rel
ativ
e H
um
idit
y (%
)
Elapsed Time (min)
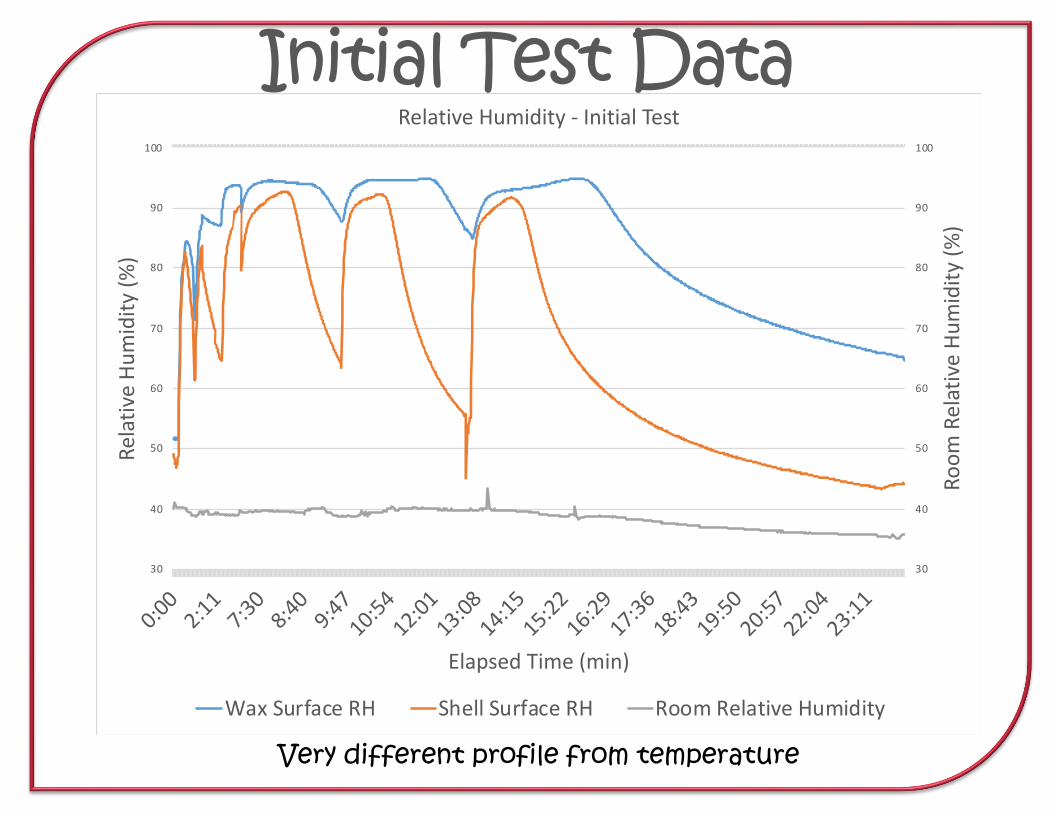
Relative Humidity - Initial Test
Wax Surface RH Shell Surface RH Room Relative Humidity
Very different profile from temperature
Initial Test Data
30
40
50
60
70
80
90
100
30
40
50
60
70
80
90
100
0:00
2:11
7:30
8:40
9:47
10:54
12:01
13:08
14:15
15:22
16:29
17:36
18:43
19:50
20:57
22:04
23:11
Ro
om
Rel
ativ
e H
um
idit
y (%
)
Rel
ativ
e H
um
idit
y (%
)
Elapsed Time (min)
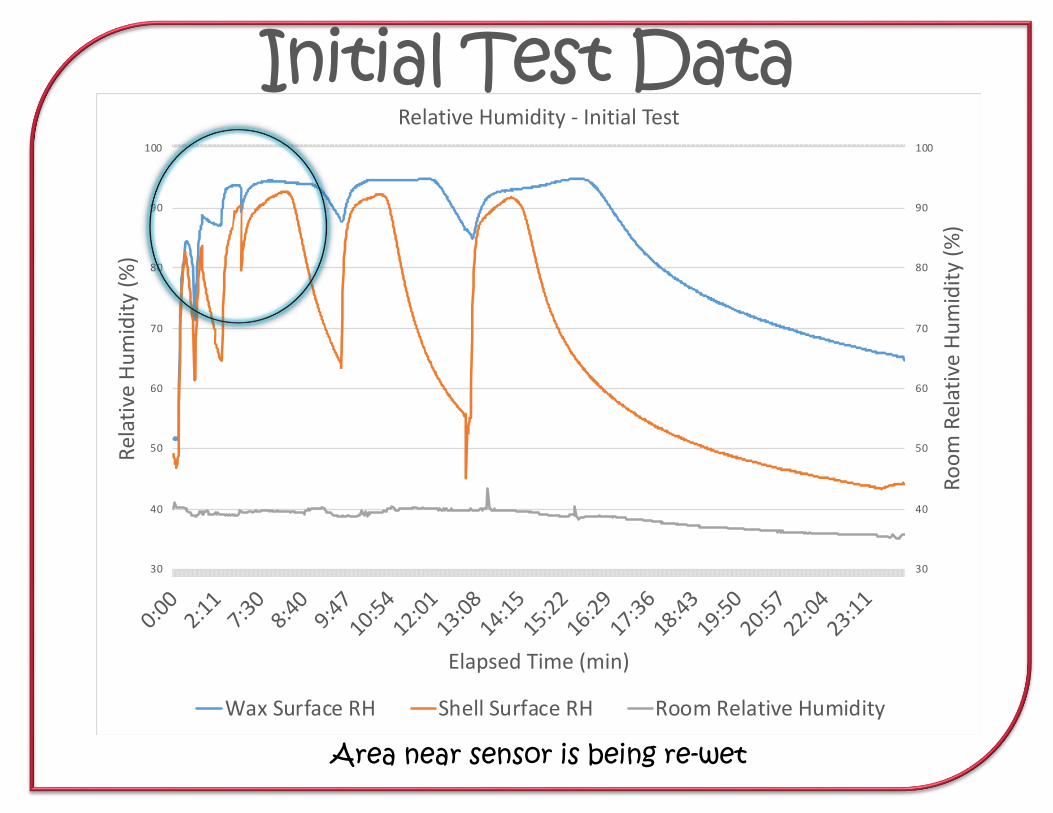
Relative Humidity - Initial Test
Wax Surface RH Shell Surface RH Room Relative Humidity
Area near sensor is being re-wet

Room Environment – 2nd Test
0
50
100
150
200
250
300
350
0
10
20
30
40
50
60
70
80
0:00:0
0
2:33:0
0
5:06:0
0
7:39:0
0
10:12:0
0
12:45:0
0
15:18:0
0
17:51:0
0
20:24:0
0
22:57:0
0
25:30:0
0
28:03:0
0
30:36:0
0
33:09:0
0
35:42:0
0
38:15:0
0
40:48:0
0
43:21:0
0
Air
Flo
w (
fpm
)
Tem
pe
ratu
re (
F)/R
H (
%)
Elapsed Time (min)
ROOM ENVIRONMENT
Temperature (F) Relative Humidity (%) Air Flow (ft/min)

Second Test Data
50
55
60
65
70
75
80
0:00:0
0
3:07:0
3
6:07:0
1
8:33:0
5
10:53:0
4
13:11:0
4
15:31:0
5
18:00:0
5
20:17:0
5
22:33:0
6
24:49:1
2
27:06:1
6
29:24:1
9
31:40:2
3
33:56:2
3
36:13:2
3
38:29:2
3
40:48:2
3
43:05:2
3
Tem
pe
ratu
re (
F)
Elapsed Time (min)
Temperature - Second Test
Wax Surface Temp Shell Surface Temp
Temperature is much closer with additional air movement

Second Test Data
40
50
60
70
80
90
100
0:00:0
0
3:07:0
3
6:07:0
1
8:33:0
5
10:53:0
4
13:11:0
4
15:31:0
5
18:00:0
5
20:17:0
5
22:33:0
6
24:49:1
2
27:06:1
6
29:24:1
9
31:40:2
3
33:56:2
3
36:13:2
3
38:29:2
3
40:48:2
3
43:05:2
3
Re
lati
ve H
um
idit
y (%
)
Elapsed Time (min)
Relative Humidity - Second Test
Wax Surface RH Shell Surface RH
Profile starts to change at as additional layers are added

Conclusionso The wax surface has a higher level of
moisture than the mold surface (as measured by relative humidity)
o Difference in moisture levels increases as more layers are applied
o The amount of air flow can impact the difference in the temperature and relative humidity between the wax and mold surface
o Next step correlate wax cracking to mold dryness

Appreciation to:
Top Related