


Languages
Pages
Legal

www.steel-research.de
FULL
PAPER
Numerical Investigation of Fluid Flow and HeatTransfer Phenomenon Inside a Single StrandTundish of Slab Caster
Anurag Tripathi,� Anil Kumar, Satish Kumar Ajmani, J. B. Singh, and Vinay V. Mahashabde
The tundish design is an important factor which governs the steel quality. An effectivetundish design can enhance inclusion flotation through development of required liquid steelflow pattern. The well-shaped bottom is one of the developments in the area of tundishdesign. This tundish is in practice and has significantly contributed towards improving theproductivity of the steel plants. The current work investigates the liquid steel flowphenomenon in this type of tundish. The 3D CFD model was used for present investigation.The results obtained shows that well-shaped bottom tundish produces better performanceas compared to tundishes having flat bottom. The effect of bath height, throughput anddepth of well on flow behavior inside the tundish having well-shaped bottom was studied inthe current work. The results of RTD analysis show the need to optimize these parameters.CFD simulations were also performed to capture the non isothermal phenomenon in awell-shaped bottom tundish.
1. Introduction
The increase in productivity without affecting the
quality is a major challenge among the steel makers.
The separation of inclusion frommolten steel is required
to achieve the superior quality of steel. The tundish is a
steel refining metallurgical vessel used as a buffer during
continuous casting. The liquid steel flow phenomenon
in a tundish governs the inclusion flotation charecter-
istics. RTD (Residence time distribution) characteristic
is an established criterion for predicting the inclusion
separation in the tundish. Ahuja and Sahai[1] have
postulated that surface directed flow enhances the
inclusion separation ratio. It is expected that flow
without hindrances facilitate the inclusion flotation.
Plug volume in RTD analysis represents the hindrances
free flow region of the tundish. Estimation of dead
volume in RTD analysis gives the percentage of
unutilized volume of the tundish. Inclusion trapped in
dead volume can not float out.
There are various studies reported in the literature
about the effect of operating parameters on inclusion
separation characteristics.[2–4] The increase in production
results in an enhanced throughput for tundish. Here,
[�] A. Tripathi, A. Kumar, S. K. Ajmani, J. B. Singh, V. V. MahashabdeResearch and Development, Tata Steel, Jamshedpur 831001, IndiaEmail: [email protected]
DOI: 10.1002/srin.201400530
1558 steel research int. 86 (2015) No. 12
throughput means rate at which the liquid steel flows out
of the tundish. Throughput in steel plant is generally
measured in tonnes/minute (tpm). Hence, increase in
throughput leads to a loss of residence time for fluid
elements inside the tundish. The bath height of liquid steel
in the tundish can drop below optimum level during ladle
change over operation, due to rise in throughput. The
change in throughput can also affect the fluid flow
characteristics of tundish. Thus, metallurgical and refrac-
tory performance of tundish can detoriate with increase in
productivity. The increase in volume of tundish is required
to compensate the loss in residence time. The volume
increase can either be incorporated through change in
shape or dimensions of tundish.
Investigators have reported various studies on fluid
flow behavior using physical and mathematical modeling
in a tundish.[5–9] They came up with the various designs of
tundish, such as rectangular tundish, tundish with
sloping sides, curved shape tundish, wedge shaped
tundish, etc.
The well-shaped bottom is another innovation in the
area of tundish design. It is being used, successfully, by the
steelmakers around the world. However, the different
aspects of this tundish design are still unexplored in the
research community. The merits of the well-shaped
bottom design and its effectiveness at higher throughput
is still an area of research among steel making commun-
ity.[10–12] The investigations were performed in the present
work to understand the flow phenomenon in this type of
tundish. Its comparative analysis was performed with
� 2015 WILEY-VCH Verlag GmbH & Co. KGaA, Weinheim
www.steel-research.de
FULL
PAPER
conventional flat bottom tundish, which confirms the
superior performance of former. The parametric inves-
tigation performed for this tundish shows the need to
optimize its dimensions.
Research is currently going on to understand the non-
isothermal flow behavior inside the tundish. Researchers
are trying to capture the effect of change in inlet
temperature on flow behavior.[13,14] Induction heating
inside the tundish is another area where recent research
investigations are being performed.[15,16] Thus, simula-
tions were performed to capture the non-isothermal effect
in the present work.
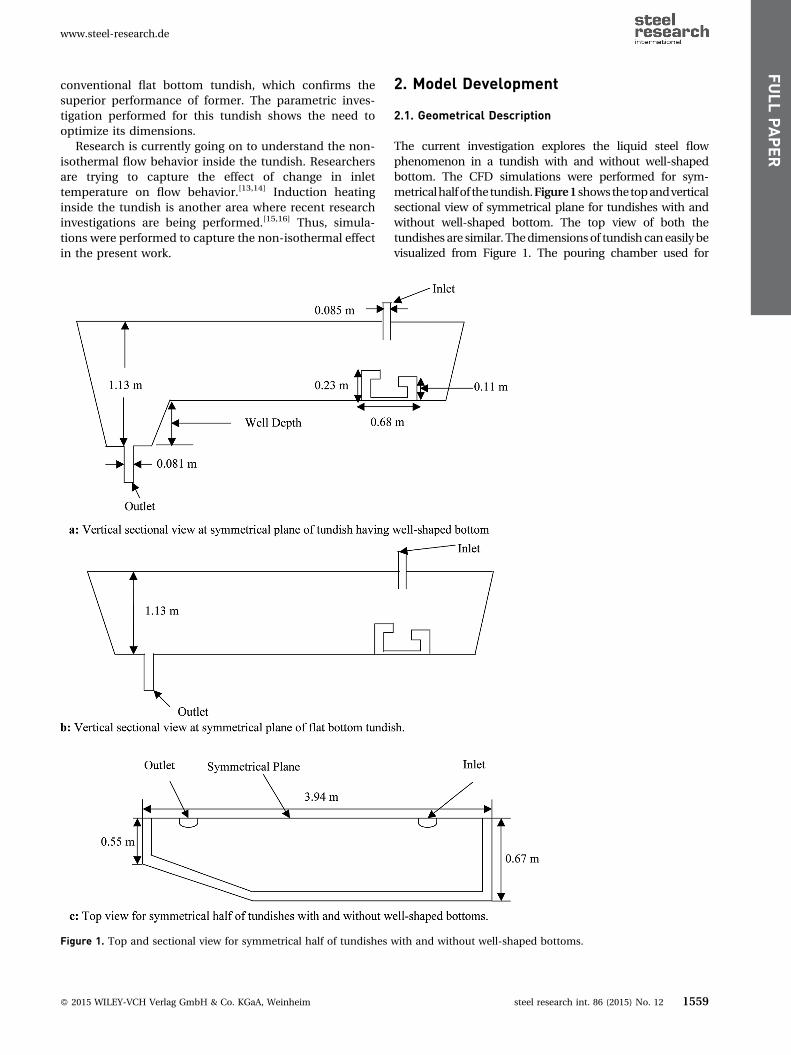
Figure 1. Top and sectional view for symmetrical half of tundishes
� 2015 WILEY-VCH Verlag GmbH & Co. KGaA, Weinheim
2. Model Development
2.1. Geometrical Description
The current investigation explores the liquid steel flow
phenomenon in a tundish with and without well-shaped
bottom. The CFD simulations were performed for sym-
metricalhalfof thetundish.Figure1showsthetopandvertical
sectional view of symmetrical plane for tundishes with and
without well-shaped bottom. The top view of both the
tundishesare similar. Thedimensionsof tundishcaneasilybe
visualized from Figure 1. The pouring chamber used for
with and without well-shaped bottoms.
steel research int. 86 (2015) No. 12 1559

www.steel-research.de
FULL
PAPER
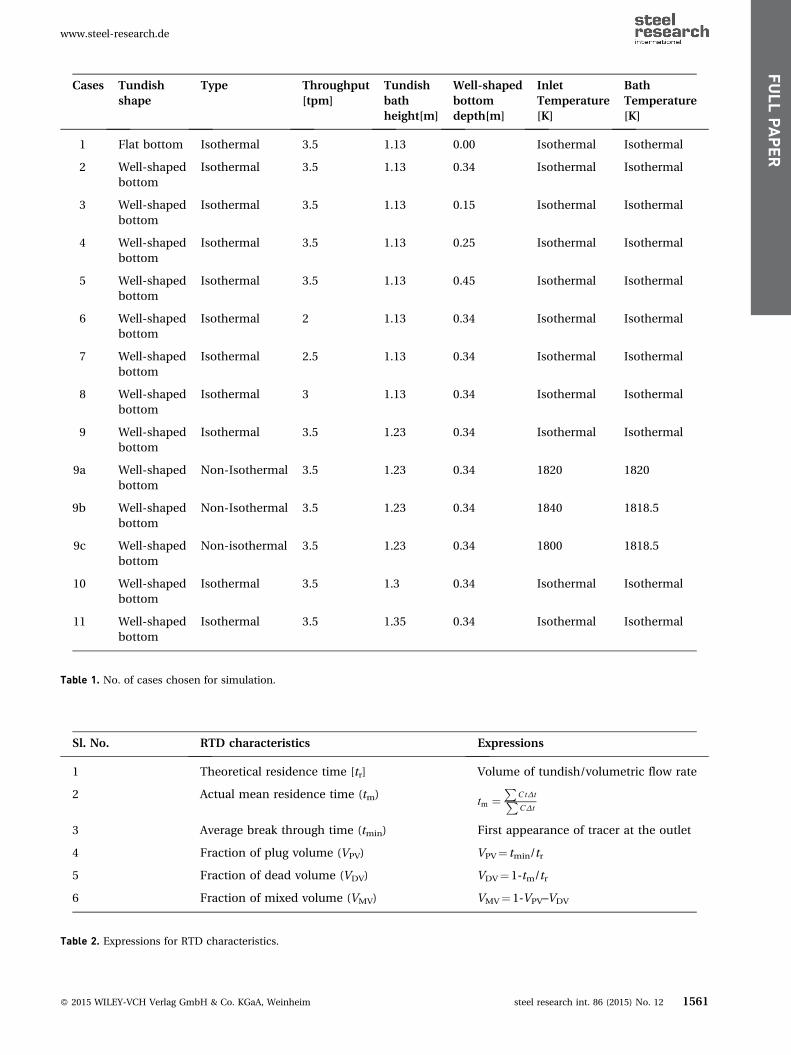
present simulation and its dimensions can be seen fromdifferentviewsinFigure2.Table1showsthesetofsimulations
performed for isothermal and non-isothermal cases.
2.2. Governing Equations
The 3D CFD model was used to compute the flow field in
the tundish. The tracer dispersion equation was solved for
Figure 2. Top and sectional view of pouring chamber.
1560 steel research int. 86 (2015) No. 12
computed velocity field to calculate RTD characteristics.
Table 2 shows the expression for the RTD characteristics
used in the present work. The expression of dead volume
assumes that flow in dead region is almost stagnant and
entry of flowing fluid in this region is negligible. The
calculation of plug volume is done using the expression
shown in Table 2. Dispersed plug volume is another
parameter used in some of the research investigations to
� 2015 WILEY-VCH Verlag GmbH & Co. KGaA, Weinheim
Cases Tundish
shape
Type Throughput
[tpm]
Tundish
bath
height[m]
Well-shaped
bottom
depth[m]
Inlet
Temperature
[K]
Bath
Temperature
[K]
1 Flat bottom Isothermal 3.5 1.13 0.00 Isothermal Isothermal
2 Well-shaped
bottom
Isothermal 3.5 1.13 0.34 Isothermal Isothermal
3 Well-shaped
bottom
Isothermal 3.5 1.13 0.15 Isothermal Isothermal
4 Well-shaped
bottom
Isothermal 3.5 1.13 0.25 Isothermal Isothermal
5 Well-shaped
bottom
Isothermal 3.5 1.13 0.45 Isothermal Isothermal
6 Well-shaped
bottom
Isothermal 2 1.13 0.34 Isothermal Isothermal
7 Well-shaped
bottom
Isothermal 2.5 1.13 0.34 Isothermal Isothermal
8 Well-shaped
bottom
Isothermal 3 1.13 0.34 Isothermal Isothermal
9 Well-shaped
bottom
Isothermal 3.5 1.23 0.34 Isothermal Isothermal
9a Well-shaped
bottom
Non-Isothermal 3.5 1.23 0.34 1820 1820
9b Well-shaped
bottom
Non-Isothermal 3.5 1.23 0.34 1840 1818.5
9c Well-shaped
bottom
Non-isothermal 3.5 1.23 0.34 1800 1818.5
10 Well-shaped
bottom
Isothermal 3.5 1.3 0.34 Isothermal Isothermal
11 Well-shaped
bottom
Isothermal 3.5 1.35 0.34 Isothermal Isothermal
Table 1. No. of cases chosen for simulation.
Sl. No. RTD characteristics Expressions
1 Theoretical residence time [tr] Volume of tundish/volumetric flow rate
2 Actual mean residence time (tm) tm ¼P
CtDtPCDt
3 Average break through time (tmin) First appearance of tracer at the outlet
4 Fraction of plug volume (VPV) VPV¼ tmin/tr
5 Fraction of dead volume (VDV) VDV¼ 1-tm/tr
6 Fraction of mixed volume (VMV) VMV¼ 1-VPV–VDV
Table 2. Expressions for RTD characteristics.
www.steel-research.de
� 2015 WILEY-VCH Verlag GmbH & Co. KGaA, Weinheim steel research int. 86 (2015) No. 12 1561
FULL
PAPER

www.steel-research.de
FULL
PAPER
characterize the plug flow region in the tundish. However,researchers have recommended the use of dispersed plug
volume in cases where there is a significant deviation from
ideally expected RTD curve.
The RTD analysis in present work was only performed
for isothermal conditions. The details of the model
equation were already published in our previous paper.[8]
The momentum and heat transfer equation for non-
isothermal behavior is added to the previously developed
model. The steady state isothermal equation was solved to
obtain the flow field for RTD analysis. The transient heat
transfer equation was solved to get the thermal response
for hot and cold steel input.
The governing equations solved for simulation are
presented below:
Continuity:
@r
@tþr:r �U ¼ 0 ð1Þ
Isothermal Momentum equation:
rD�U iDt ¼ � @�P
@xi� @
@xjðtlij þ ttijÞ þ rgi þ Si (2)
where laminar shear stress, tlij is given by:
tlij ¼ �m @�U i
@xjþ @
�U j
@xiÞ
�ð3Þ
and Reynolds shear stress, ttij is expressed as:
ttij ¼ � �ru}i u}j ¼ �mt @
�U i
@xjþ @
�U j
@xiÞ
�ð4Þ
Here �U i is the ith component velocity vector, and i & j
vary for x, y,and z direction.
Si in Equation (2) is a momentum source term in ith
direction.
Tracer dispersion:
r@ �C
@tþ r
@ð �U i�CÞ
@xi¼ @
@xi
meff
sC
@ �C
@xi
� �ð5Þ
Turbulent Kinetic energy:
rDk
Dt¼ Dk þ G � re ð6Þ
Rate of dissipation:
rDe
Dt¼ De þ C1G
e
k� C2r
e2
kð7Þ
where
1562 steel research int. 86 (2015) No. 12
Dw ¼ @
@xjmþ mt
sw
� �@w
@xj
� �ð8Þ
Here w is k for (6) and e for (7)mt ¼ rCmk2
eand G ¼ ttij@
�U i@xj
(9)
Here, C1¼ 1.44, C2¼ 1.92, Cm¼ 0.09, sc¼ 1, sk¼ 1,
se¼ 1.3
Non isothermal momentum equation:
rD�U i
Dt¼ � @�P
@xi� @
@xjðtlij þ ttijÞ þ rgið1� bðT � T ref ÞÞ ð10Þ
Here, b (Thermal expansion coefficient) is 0.0002 (1/K)
Energy equation:
r@h
@tþ r
@ð �U ihÞ@xi
¼ @
@xiKeff
@�T
@xi
� �ð11Þ
2.3. Boundary Conditions
The boundary conditions were similar to one used in
published papers.[8,9] No-slip and standard wall function
was used at the walls. Symmetry boundary condition (zero
gradients for all the variables normal to plane) was applied
at the symmetry plane. The turbulent intensity of 2% was
defined at the inlet. Zero shear stress at the free surface and
pressure of 1 atm at the outlets was fixed for present
simulation. A zero gradient for tracer concentration was
applied on the walls, free surface and outlets.
The heat loss from the outer surface of the tundish wall
and top surface takes place through convection and
radiation. The net heat flux at the wall can be calculated
through Equation (12). Here, TWL and Text represents
tundish wall temperature (outer surface) and ambient
temperature, respectively. The radiation losses from
tundish walls and top surface are neglected in the present
work.
q ¼ hextðT ext � TWLÞ ð12Þ
The heat transfer coefficient in Equation (12) was
obtained by tuning the model with temperature of
liquid steel measured in the plant. The inlet temper-
ature of the liquid steel was taken from the LD2 plant of
Tata Steel Ltd.
2.4. Numerical Procedure
The computational domain was constructed through
gambit software. This domain was then discretized into
� 2015 WILEY-VCH Verlag GmbH & Co. KGaA, Weinheim
www.steel-research.de
FULL
PAPER
small cells. The finite volume technique was used to solve
the set of governing equations in these cells. The
commercial CFD package (FLUENT) was used to solve
the discretized equation. The velocity profile was
generated inside the computational domain. The tracer
dispersion equation was then solved to get the data for
RTD analysis. SIMPLE algorithm was used for pressure–
velocity coupling and higher order schemes were used for
discretization of equations. The density and viscosity of
molten was kept constant at 7100 kgm�3 and 0.006482 kg
ms�1, respectively, throughout the computational
domain for isothermal simulations. The specific heat
and thermal conductivity used for non-isothermal
simulations are 750 J kg-K�1 and 41W m-K�1,
respectively.
3. Model Validation
The validation of the computational method was estab-
lished with the experiment data reported in the literature.
The matching between experiment and computation was
reported in our previous papers.[8]
The model validation was also performed by carrying
out the water modeling experiment for the well-shaped
bottom tundish shown in Figure 1. Figure 3a shows the
experimental set-up used for performing the experi-
ment. The tundish used in the experimental setup is 0.6
scale down model of the industrial tundish. Exper-
imental setup is composed of a model tundish, a ladle,
two water tanks, a water supply, a water pump, a digital
flow meter, a tracer injector, a conductivity meter
probe, a conductivity meter, a data logger interface, and
a desktop computer. Water was transferred from the
water tank to ladle through water pump and then from
ladle to the tundish. Once the readings and tundish
level were stable, 36 g of KCl solution was injected as a
pulse into the inlet stream. The data recorded from
conductivity meter as a function of time were then
converted into concentration profile. The concentra-
tion and time data were converted into their dimen-
sionless form to get RTD curve.
The comparison of computationally obtained results
with experiments was done for throughput of 2.5 tpm.
Figure 3b shows the comparison of predicted and
experimentally obtained RTD curves. The plug volume
and dead volume computed at 2.5 tpm were 19 and 7%,
respectively, however from experiment these volumes
came to be 20 and 6%, respectively. Thus, the predictions
appear to be in good agreement with water modeling
experiments. The plant observation shows 1–2 8C temper-
ature drop between inlet and outlet due to heat losses from
walls and top surfaces. The prediction made by non-
isothermal model was found to be in agreement with the
plant observations.
� 2015 WILEY-VCH Verlag GmbH & Co. KGaA, Weinheim
4. Results and Discussion
The flow patterns were developed through 3D CFD
simulation for all the cases shown in Table 1. The RTD
analysis was then performed for the computed velocity
field. This RTD analysis was correlated with the flow
patterns to conclude the comparative study of tundishes
with and without well-shaped bottom. The analysis was
also done to investigate the effect of tundish dimensions
and throughput. The results obtained from the simulation
are presented in the subsequent steps.
4.1. Comparison of Tundishes With and Without Well-Shaped Bottom
The liquid steel flow inside the tundish is altered by the
change in the shape of tundish. Thus, the analysis was
performed for flow patterns developed in the tundishes
(shown in Figure 1). Simulations were carried out for
Cases 1 and 2 shown in Table 1 to compare the
performance of tundishes with and without well-shaped
bottom. Figure 4a shows the comparison of flow patterns
at vertical symmetrical plane for Cases 1 and 2. The flow
phenomenon for Case 2 appears to be gradual and
smooth as compared to intense flow for Case 1. The
development of circulatory flow near the pouring region
of the tundish is desired in a tundish. However, the type of
large eye circulatory flow developed in the tundish of Case
1 can also lead to dead zone formation. The high velocity
flow vectors occupy comparatively larger region for Case
1 in Figure 4a. The circulatory loop observed for flat
bottom tundish of Case 1 was not seen in tundish of Case
2. The movement of flow vectors towards the pouring
region can be seen for Case 2 in Figure 4a. The flow
vectors appear to be captured in the pouring region for
this tundish. This leads to reduction in velocity magni-
tude of flow vectors moving towards the outlet. The
presence of well-shaped bottom in tundish of Case 2
results in further reduction of flow velocity near the outlet
and leads to smooth discharge of liquid steel.
Figure 4b shows the comparison of flow vectors at
meniscus for tundishes with and without well-shaped
bottom. The velocitymagnitude appears to be quite high in
most of the region for tundish of Case 1 as compared to
that of Case 2. The similarity in the circulatory cell
developed above the outlet for both the tundishes can be
seen from Figure 4b. However, the eye of the circulatory
cell appears to be large for flat bottom tundish of Case 1.
The comparison of flow patterns in Figure 4a,b shows that
flow phenomenon in tundish of Case 2 is comparatively
closer to desired fluid flow characteristics.
The RTD analysis of flow patterns described in
Figure 4a,b was required to draw inferences about the
superior performance of tundish having well-shaped
bottom. Figure 5a shows the comparison of RTD curve
of tundishes with and without well-shaped bottom. The
steel research int. 86 (2015) No. 12 1563

Figure 3. a) Experimental setup used to perform water modeling experiment for well-shaped tundish. b) Comparison of Predicted RTDcurve with the one obtained from water modeling experiment.
www.steel-research.de
FULL
PAPER
sharp peak for tundish of Case 1 reflects the presence of
short circuiting. The lower tmin for this tundish results in
reduced percentage of plug volume as compared to one
obtained for tundish of Case 2. The shift in peak of the
curve towards the centre for tundish of Case 2 leads to
reduced dead volume as compared to that of Case 1.
1564 steel research int. 86 (2015) No. 12
Table 3 shows the RTD characteristics of all the cases
described in Table 1. The high ratio of plug to dead volume
for tundish of Case 2 as compared to that of Case 1 can be
noticed from Table 3. Thus, RTD analysis confirms the
superiority of tundish with well-shaped bottom over
conventional flat bottom tundish.
� 2015 WILEY-VCH Verlag GmbH & Co. KGaA, Weinheim

Figure 4. a) Flow pattern at vertical symmetrical plane (Z¼ 0) for tundish (without well-shaped bottom) and tundish (with well-shapedbottom). b) Flow pattern at top surface for tundish (without well-shaped bottom) and tundish (with well-shaped bottom).
www.steel-research.de
FULL
PAPER
4.2. Effect of Well Depth on Flow Patterns in a Tundish
The well-shaped bottom of tundish, acts as a flow
modifier near the outlet. Its strong role in improving the
flow characteristics within well-shaped tundish was
� 2015 WILEY-VCH Verlag GmbH & Co. KGaA, Weinheim
already established in previous section. It was felt that
investigation of well depth is required for further
improvement of flow characteristics in this type of
tundish. The well depth was varied from 0.15 to 0.45m to
explore its effect on flow characteristics. Cases 2–5 in
steel research int. 86 (2015) No. 12 1565

Figure 5. RTD curves obtained from simulation of different conditions.
Cases
Sl. No. RTD characteristics 1 2 3 4 5 6 7 8 9 10 Case 11
1 Mean residence time [s] 536 475 468 505 384 837 670 552 570 585 557
2 Theoretical residence time [s] 700 500 600 555 480 900 720 600 600 636 671
3 VPV 0.12 0.16 0.13 0.12 0.15 0.19 0.19 0.17 0.15 0.13 0.12
4 VMV 0.64 0.79 0.65 0.79 0.65 0.74 0.74 0.75 0.80 0.80 0.72
5 VDV 0.24 0.05 0.22 0.09 0.20 0.07 0.07 0.08 0.05 0.07 0.16
6 VPV/VDV 0.51 3.2 0.59 1.33 0.73 2.7 2.7 2.1 3 1.9 0.75
Table 3. RTD characteristics for all the isothermal cases.
www.steel-research.de
1566 steel research int. 86 (2015) No. 12 � 2015 WILEY-VCH Verlag GmbH & Co. KGaA, Weinheim
FULL
PAPER
www.steel-research.de
FULL
PAPER
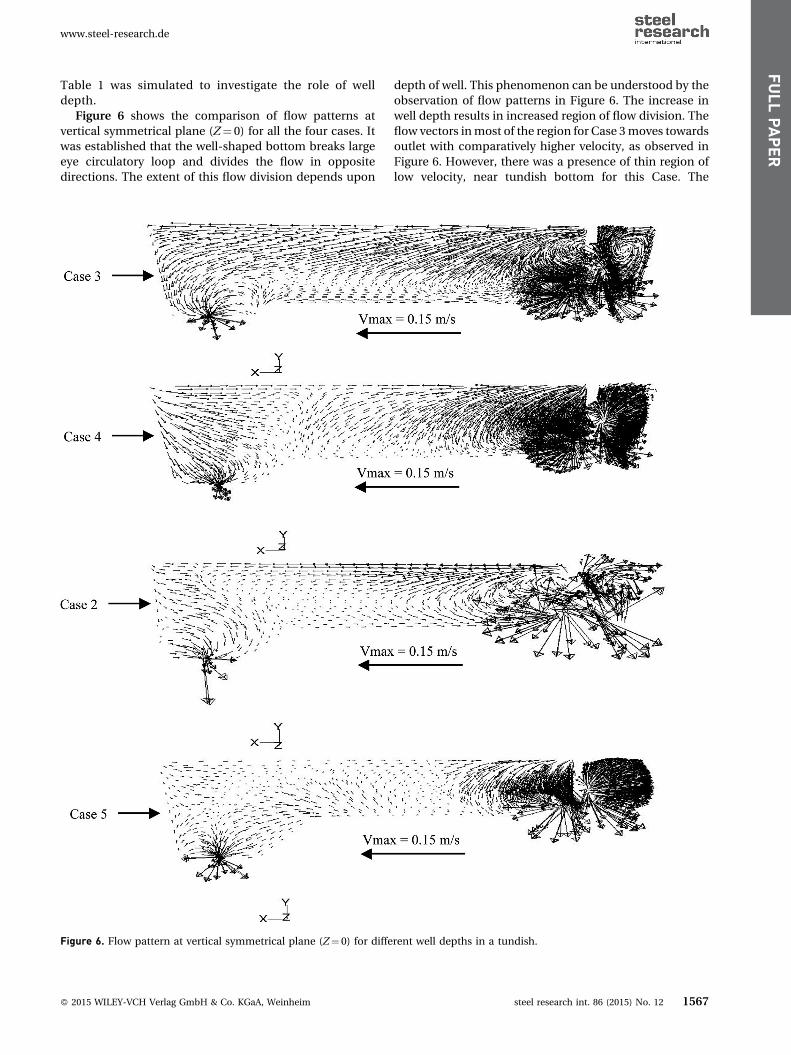
Table 1 was simulated to investigate the role of well
depth.
Figure 6 shows the comparison of flow patterns at
vertical symmetrical plane (Z¼ 0) for all the four cases. It
was established that the well-shaped bottom breaks large
eye circulatory loop and divides the flow in opposite
directions. The extent of this flow division depends upon
Figure 6. Flow pattern at vertical symmetrical plane (Z¼ 0) for diffe
� 2015 WILEY-VCH Verlag GmbH & Co. KGaA, Weinheim
depth of well. This phenomenon can be understood by the
observation of flow patterns in Figure 6. The increase in
well depth results in increased region of flow division. The
flow vectors inmost of the region for Case 3moves towards
outlet with comparatively higher velocity, as observed in
Figure 6. However, there was a presence of thin region of
low velocity, near tundish bottom for this Case. The
rent well depths in a tundish.
steel research int. 86 (2015) No. 12 1567

www.steel-research.de
FULL
PAPER
velocity vectors in this region moves towards the pouringregion. The relatively lowmagnitude velocity of this region
can lead to dead zone formation.
The flow pattern developed for Case 4 shows the effect
of increase in well depth. The rise in well depth results in
increased number of flow vectors moving towards the
pouring region. It also leads to reduction in velocity
magnitude of flow vectors towards outlet. The reduced
difference between high and low magnitude velocity can
be noticed for Case 4 as compared to Case 3. Thus, the
dead zone formation will be reduced for this case. Case 2
in Figure 6 shows the flow pattern for further increase in
well depth. The increased well depth again leads to
increase in flow diversion towards the pouring region.
The difference between two extremes of velocity magni-
tude was found to be further reduced for Case 2 in
Figure 6.
The improvement in flow patterns inside the tundish
with rise in well depth inspires us to perform CFD
simulation for further increase in depth. Case 5 in Table 1
presents the well depth simulated for this study. The flow
pattern for Case 5 in Figure 6 confirms our earlier
investigation about flow diversion and velocity magnitude.
However, the velocity magnitude appears to be reduced to
a level of stagnant zone. Hence, the increase in well depth
beyond certain optimum level can lead to enhanced region
of dead volume.
It can be further noticed from the Figure 6 that flow
pattern near the meniscus for Cases 3 and 2 show some
similarity. Cases 4 & 5 in Figure 6 also show some similarity
in flow pattern near meniscus with regard to location of
flow division. The momentum losses of the streams due to
increase in well depth appears to be the reason behind
such type of observation. The drop in velocity with
increase in well depth results in collision of two opposite
streams at the centre as seen for Case 4 in Figure 6. The
further increase in well depth leads to comparatively
higher momentum loss for the stream coming from region
above outlet. Therefore, flow division in Case 2 was
observed farther from the centre (near the outlet). It was
found that even further increase in well depth (Case 5 in
Figure 6) results in comparatively larger drop in momen-
tum for the stream coming from pouring region. Therefore
flow division was again observed at centre for Case 5 in
Figure 6.
The RTD analysis was performed for these four cases to
conclude the well depth investigation. Figure 5b shows the
RTD curve for all the four cases. The RTD characteristic for
these curves can be seen from Table 3. The sharp and high
peak concentration can be noticed for Cases 3and 5 in
Figure 5b. This reflects the presence of larger dead volume
for these cases as compared to Cases 2 and 4. Table 3
confirms our observation. The two peaks in RTD curve for
Case 4 shows the degradation of its flow characteristics as
compared to Case 2. The high ratio of plug to dead volume
for Case 2 in Table 3 confirms its superiority over other
cases simulated for well depth investigation.
1568 steel research int. 86 (2015) No. 12
4.3. Effect of Throughput on Flow Phenomenon in aTundish Having Well-Shaped Bottom
The steel industry is increasing its productivity to meet the
continuous rise in demand of its product. It is a challenge
for the steel makers to increase production and maintain
the desired steel quality within the existing setup. Thus, the
present designs of metallurgical vessels needs to be
evaluated with respect to throughput.
The fluid flow investigation was performed for through-
put range of 2–3.5 tpm in a tundish having well-shaped
bottom. Cases 2, 6, 7, and 8 in Table 1 were simulated for
this investigation. Figure 7 shows the flow vectors at
meniscus for all the four cases having different through-
puts. Though, the flow pattern appears to be almost similar
for all the cases in Figure 7. However, the small increase in
size of eye developed above outlet was noticed with
increase in the throughputs from 2.0 to 3.5 (Figure 7). The
velocity scale in Figure 7 for different cases represents the
maximum velocity obtained at meniscus for particular
case. The rise in the magnitude of the maximum velocity
with increased throughput can be noticed in Figure 7. The
RTD analysis for different throughputs strengthens our
earlier discussion. The RTD curve in Figure 5c appears to
be almost similar for all the throughputs. The value of RTD
characteristics in Table 3 was found to be close for all the
cases. The minor difference in the ratio of plug to dead
volume was noticed for all the cases. However, there was a
significant difference in the values of theoretical residence
time for different throughputs. The change in velocity
magnitude and theoretical residence time was found to be
the whole effect of throughput.
4.4. Effect of Bath Height on Flow Characteristics inTundish Having Well-Shaped Bottom
The impact of rising demand of steel on its quality was
already discussed in previous section. The loss in
theoretical residence time due to increased throughput
can only be compensated through increase in capacity of
tundish. The superiority of well-shaped bottom tundish
over that of conventional flat bottom tundish was already
discussed. Therefore, it was felt that tundish capacity
should be increased through change in dimensions of well-
shaped bottom tundish. The tundish bath height needs to
be maintained at the desired level during ladle changeover
operation. Hence, bath height was found to be an ideal
parameter to incorporate dimension change. Though,
theoretical residence time will be enhanced through
increased bath height, but flow characteristics of tundish
can be affected.
CFD simulation was performed to investigate the effect
of bath height on flow phenomenon in well-shaped
bottom tundish. Cases 2, 9, 10, and 11 of Table 1 present
the bath height simulated for this study. Figure 8 shows the
flow patterns at vertical symmetrical plane (Z¼ 0) for
� 2015 WILEY-VCH Verlag GmbH & Co. KGaA, Weinheim
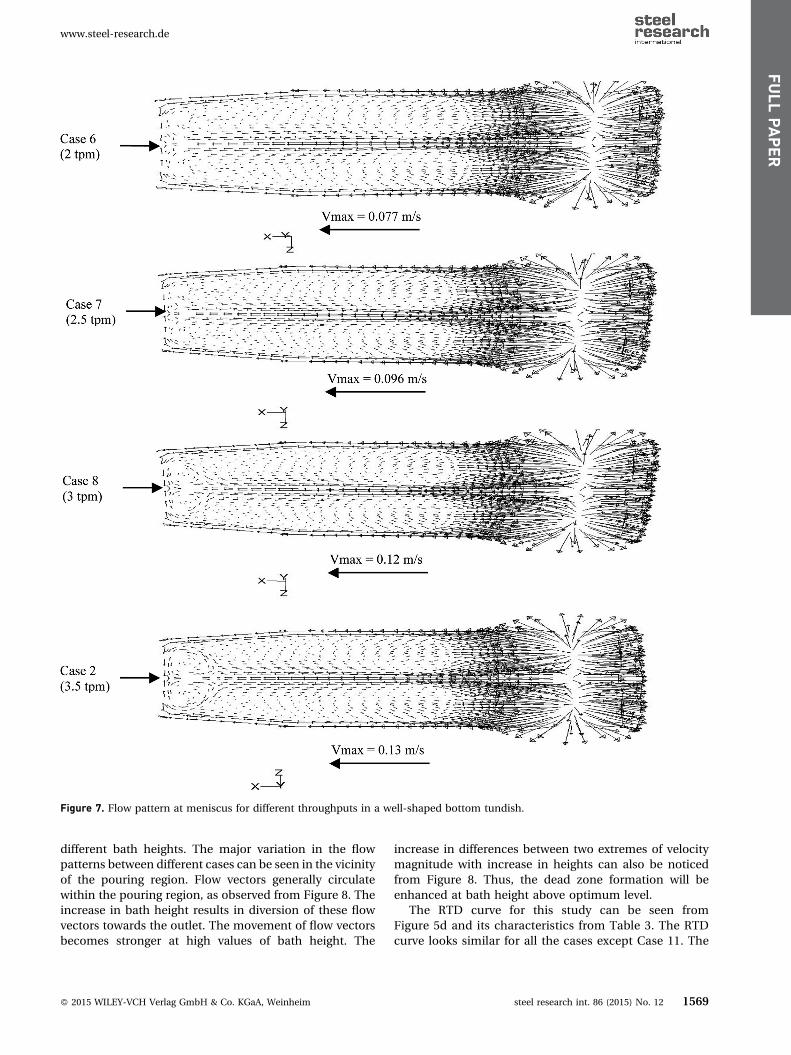
Figure 7. Flow pattern at meniscus for different throughputs in a well-shaped bottom tundish.
www.steel-research.de
FULL
PAPER
different bath heights. The major variation in the flow
patterns between different cases can be seen in the vicinity
of the pouring region. Flow vectors generally circulate
within the pouring region, as observed from Figure 8. The
increase in bath height results in diversion of these flow
vectors towards the outlet. The movement of flow vectors
becomes stronger at high values of bath height. The
� 2015 WILEY-VCH Verlag GmbH & Co. KGaA, Weinheim
increase in differences between two extremes of velocity
magnitude with increase in heights can also be noticed
from Figure 8. Thus, the dead zone formation will be
enhanced at bath height above optimum level.
The RTD curve for this study can be seen from
Figure 5d and its characteristics from Table 3. The RTD
curve looks similar for all the cases except Case 11. The
steel research int. 86 (2015) No. 12 1569
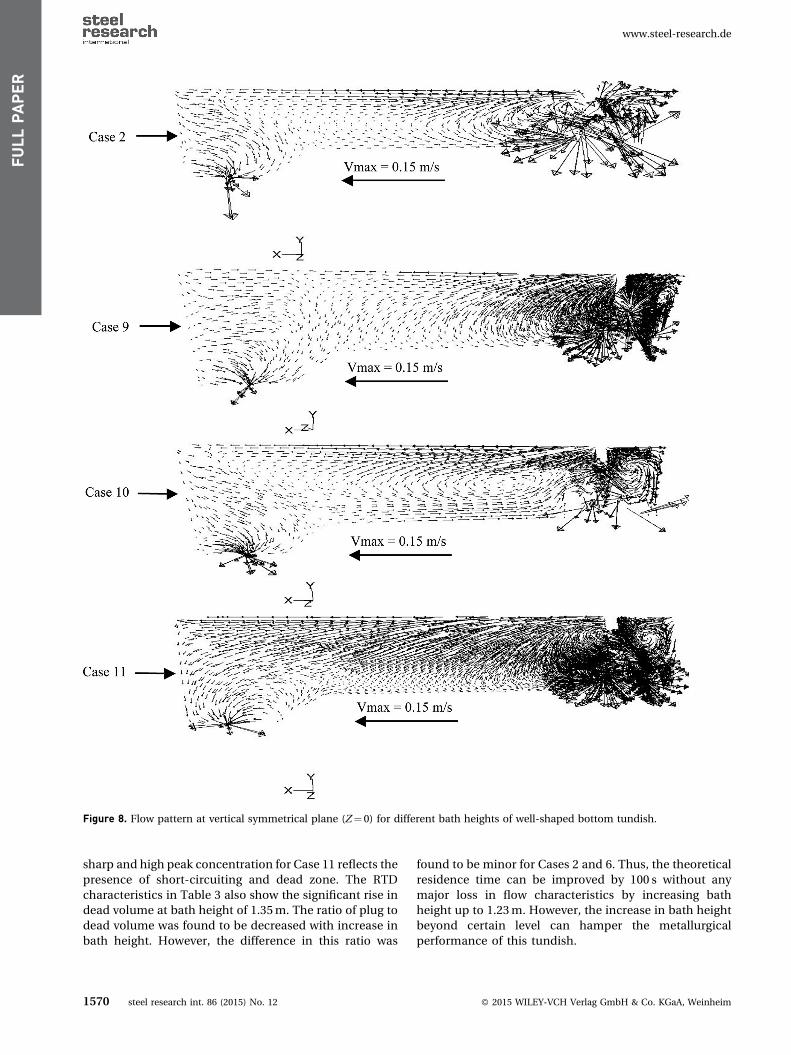
Figure 8. Flow pattern at vertical symmetrical plane (Z¼ 0) for different bath heights of well-shaped bottom tundish.
www.steel-research.de
FULL
PAPER
sharp and high peak concentration for Case 11 reflects the
presence of short-circuiting and dead zone. The RTD
characteristics in Table 3 also show the significant rise in
dead volume at bath height of 1.35m. The ratio of plug to
dead volume was found to be decreased with increase in
bath height. However, the difference in this ratio was
1570 steel research int. 86 (2015) No. 12
found to be minor for Cases 2 and 6. Thus, the theoretical
residence time can be improved by 100 s without any
major loss in flow characteristics by increasing bath
height up to 1.23m. However, the increase in bath height
beyond certain level can hamper the metallurgical
performance of this tundish.
� 2015 WILEY-VCH Verlag GmbH & Co. KGaA, Weinheim
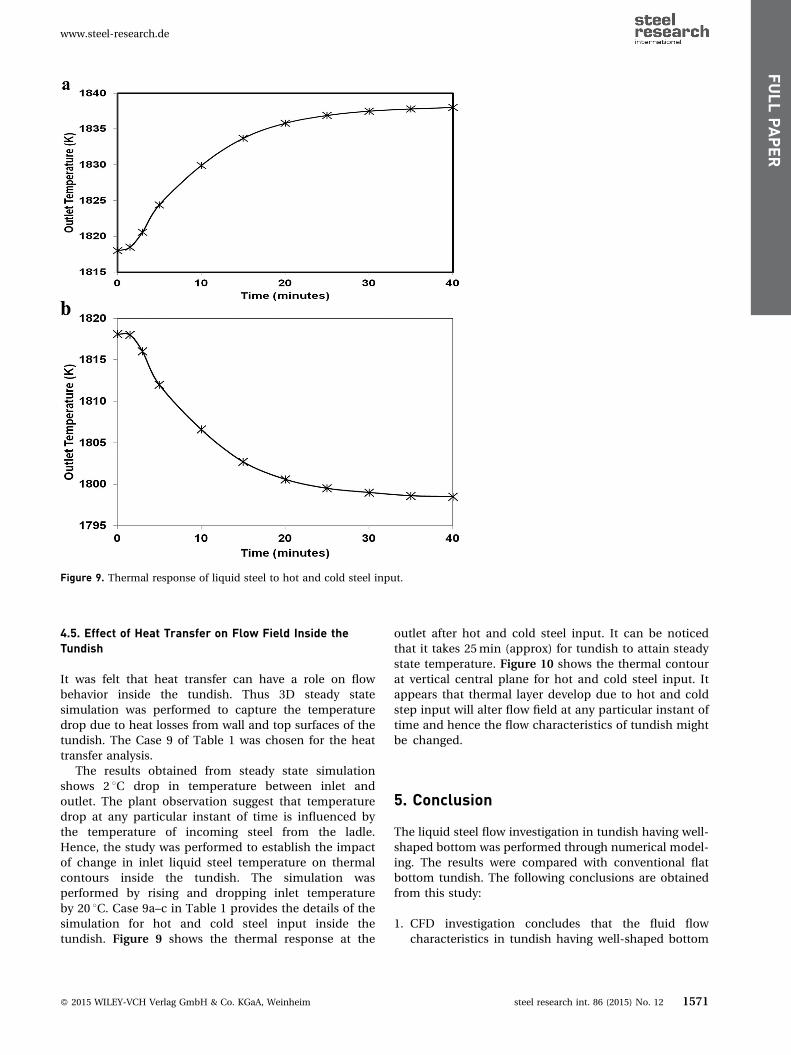
Figure 9. Thermal response of liquid steel to hot and cold steel input.
www.steel-research.de
FULL
PAPER
4.5. Effect of Heat Transfer on Flow Field Inside theTundish
It was felt that heat transfer can have a role on flow
behavior inside the tundish. Thus 3D steady state
simulation was performed to capture the temperature
drop due to heat losses from wall and top surfaces of the
tundish. The Case 9 of Table 1 was chosen for the heat
transfer analysis.
The results obtained from steady state simulation
shows 2 8C drop in temperature between inlet and
outlet. The plant observation suggest that temperature
drop at any particular instant of time is influenced by
the temperature of incoming steel from the ladle.
Hence, the study was performed to establish the impact
of change in inlet liquid steel temperature on thermal
contours inside the tundish. The simulation was
performed by rising and dropping inlet temperature
by 20 8C. Case 9a–c in Table 1 provides the details of the
simulation for hot and cold steel input inside the
tundish. Figure 9 shows the thermal response at the
� 2015 WILEY-VCH Verlag GmbH & Co. KGaA, Weinheim
outlet after hot and cold steel input. It can be noticed
that it takes 25min (approx) for tundish to attain steady
state temperature. Figure 10 shows the thermal contour
at vertical central plane for hot and cold steel input. It
appears that thermal layer develop due to hot and cold
step input will alter flow field at any particular instant of
time and hence the flow characteristics of tundish might
be changed.
5. Conclusion
The liquid steel flow investigation in tundish having well-
shaped bottom was performed through numerical model-
ing. The results were compared with conventional flat
bottom tundish. The following conclusions are obtained
from this study:
1.
CFD investigation concludes that the fluid flowcharacteristics in tundish having well-shaped bottom
steel research int. 86 (2015) No. 12 1571

Figure 10. Thermal contours at vertical sectional plane for hot and cold steel input.
www.steel-research.de
15
FULL
PAPER
are superior as compared to conventional flat bottom
tundish. The well-shape bottom has an effective role in
the performance of tundish.
2.
CFD investigation shows that the well depth should beoptimized for better performance of tundish.
3.
The flow patterns and RTD curve in well-shapedbottom tundish were found to be similar for all the
throughputs. It can be concluded that change in
throughput can only alter the velocity magnitude and
theoretical residence time.
4.
It was found that loss in residence time due to increasedthroughput in well-shaped bottom tundish can be
recovered through increase in bath height. However,
the increase in bath height beyond certain optimum
level will hamper the flow characteristics inside the
tundish.
5.
The heat transfer analysis of well-shaped bottomtundish shows that tundish will take sufficient amount
of time to attain a new steady state after step input of
hot and cold steel. The thermal stratification will
result in a flow driven by natural convection. There-
fore the flow field will be influenced by thermal field.
The future investigation will try to quantify the
influence of thermal effect on flow characteristics of
the tundish.
72 steel research int. 86 (2015) No. 12
5.1. Nomenclature
�C: Mass fraction of the injected tracer
C Average concentration of tracer from outlet (kg/m3)
H Bath height of the tundish (m)
L Length of half tundish (m)
k Turbulent kinetic energy (m2/s2)
P Pressure (Pascal)
RTD Residence time distribution (s)
t Time (s)
tm Actual mean residence time (s)
tmin Average breakthrough time (s)
tr Theoretical mean residence time (s)�U : Velocity (m/s)
u0 Velocity fluctuation (m/s)
V Volume (m3)
Text External temperature (K)
TWL Outside surface temperature of Tundish wall (K)
hext Heat transfer coefficient (Watt/m2K)
q Heat flux (W/m2)
5.2. Greek Symbols
r Density of steel (kg/m3)
m Molecular viscosity of steel (kg/ms)
� 2015 WILEY-VCH Verlag GmbH & Co. KGaA, Weinheim
www.steel-research.de
FULL
PAPER
mt Turbulent viscosity of steel (kg/ms)
meff Effective viscosity of steel (kg/ms)
sC Turbulent Schmidt number
e Rate of dissipation of turbulent kinetic energy (m2/s3)
tl Laminar shear stress
tt Turbulent shear stress
5.3. Suffix
i, j, k Three Cartesian coordinate directions x, y, and z
DV Dead volume
MV Mixed volume
PV Plug Volume
Received: November 17, 2014;
Published online: February 25, 2015
Keywords: well-shaped bottom; plug volume; dead
volume; mean residence time
References
[1] Y. Sahai, R. Ahuja, Ironmaking Steelmaking 1986, 13, 241.
� 2015 WILEY-VCH Verlag GmbH & Co. KGaA, Weinheim
[2] S. Singh, S. C. Koria, ISIJ Int. 1993, 33, 1228.
[3] S. Singh, S. C. Koria, Ironmaking Steelmaking 1993,
20, 221.
[4] S. Singh, S. C. Koria, ISIJ Int. 1994, 34, 784.
[5] D. Mazumdar, G. Yamanoglu, R. I. L. Guthrie, Steel
Res. 1995, 66, 14.
[6] D. Mazumdar, G. Yamanoglu, R. I. L. Guthrie, Steel
Res. 1997, 68, 293.
[7] Y. He, Y. Sahai, Metall. Trans. 1987, 18B, 81.
[8] A. Tripathi, S. K. Ajmani, ISIJ Int. 2005, 45, 1616.
[9] P. K. Jha, S. K. Dash, S. Kumar, ISIJ Int. 2001, 41,
1437.
[10] A. Cwudzinski, Steel Res. Int. 2014, 85, 902.
[11] A. Cwudzinski, Steel Res. Int. 2014, 85, 623.
[12] A. Cwudzinski, Steel Res. Int. 2010, 81, 123.
[13] A. Zamora, R. D. Morales, M. Diaz_Cruz, J. Palafox-
Ramos, L. Gascia Demedices, Int. J. Heat. Mass Trans.
2003, 46, 3029.
[14] R. D. Morales, S. Lopez Ramirez, J. Palafox-Ramos,
D. Zacharias, ISIJ Int. 1999, 39, 455.
[15] Q. Wang, B. K. Li, F. Tsukihashi, ISIJ Int. 2014, 54,
311.
[16] Q. Wang, F. S. Qi, B. K. Li, F. Tsukihashi, ISIJ Int. 2014,
54, 2796.
steel research int. 86 (2015) No. 12 1573
Top Related