


Languages
Pages
Legal


1 ― NORTH AMERICA - CITI― April, 2013
April, 2013
NORTH AMERICACITI

2 ― NORTH AMERICA - CITI― April, 2013
► 1st quarter in line with the annual outlook presented in February
►Carefully managed pricing policy
►Demand seems to be firming up in April
► 2013 guidance confirmed
Key Takeaways
3 ― NORTH AMERICA - CITI― April, 2013
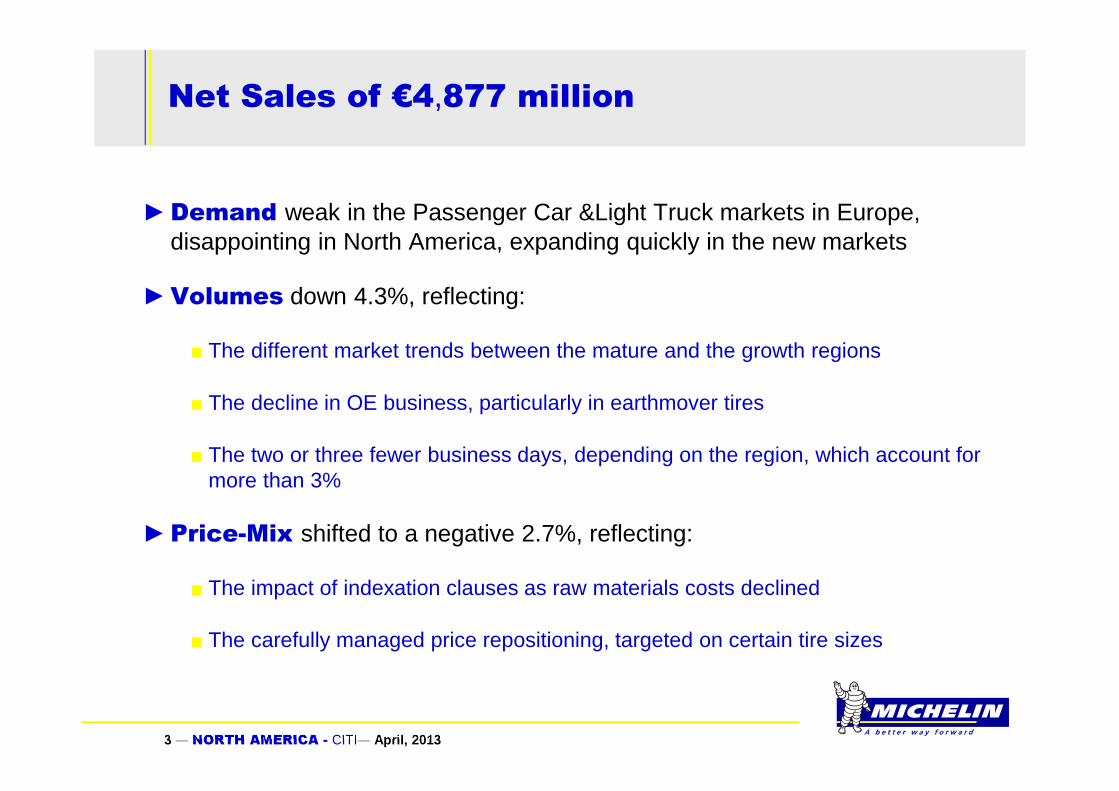
►Demand weak in the Passenger Car &Light Truck markets in Europe, disappointing in North America, expanding quickly in the new markets
►Volumes down 4.3%, reflecting:
■ The different market trends between the mature and the growth regions
■ The decline in OE business, particularly in earthmover tires
■ The two or three fewer business days, depending on the region, which account for more than 3%
►Price-Mix shifted to a negative 2.7%, reflecting:
■ The impact of indexation clauses as raw materials costs declined
■ The carefully managed price repositioning, targeted on certain tire sizes
Net Sales of €4,877 million

4 ― NORTH AMERICA - CITI― April, 2013
April 22, 2013
NET SALES
1 CONTRASTED, LACKLUSTER MARKETS
2 NET SALES IN LINE WITH ANNUAL OUTLOOK
3 REPORTING SEGMENTS
4 2013 GUIDANCE

5 ― NORTH AMERICA - CITI― April, 2013
April 22, 2013
NET SALES
CONTRASTED, LACKLUSTER MARKETS
1
6 ― NORTH AMERICA - CITI― April, 2013
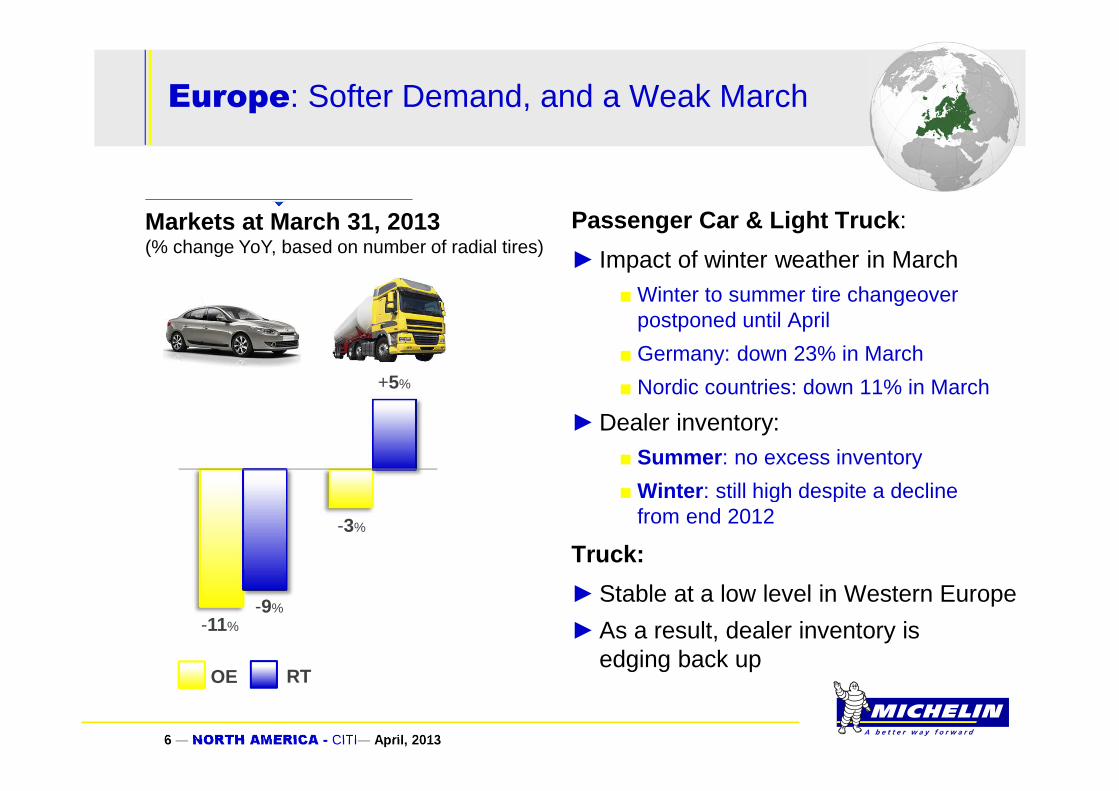
Passenger Car & Light Truck :
► Impact of winter weather in March■Winter to summer tire changeover
postponed until April
■ Germany: down 23% in March
■ Nordic countries: down 11% in March
►Dealer inventory:■ Summer : no excess inventory
■Winter : still high despite a decline from end 2012
Truck:
►Stable at a low level in Western Europe
►As a result, dealer inventory is edging back up
Europe: Softer Demand, and a Weak March
-11%-9%
+5%
-3%
OE RT
Markets at March 31, 2013(% change YoY, based on number of radial tires)

7 ― NORTH AMERICA - CITI― April, 2013
North America: Disappointing Markets
Passenger Car & Light Truck:
►Dealers carefully managing inventory■ Sell in < Sell out
■ Low dealer inventory
Truck:
►Dealer inventory stable
►OE impacted by slowing truckmakeroutput and comparison with the upturn in 1Q-2012
+1%
-2%-1%
-12%
OE RT
Markets at March 31, 2013(% change YoY, based on number of radial tires)

8 ― NORTH AMERICA - CITI― April, 2013
Asia excluding India: as Expected, Demand is Generally Trending Upwards
►Return to long-term growth trends
►Replacement Truck tires in China:
■ Demand low during the New Year; improvement in March
+5%
+7%
-5%
+5%
OE RT
Markets at March 31, 2013(% change YoY, based on number of radial tires)

9 ― NORTH AMERICA - CITI― April, 2013
South America: Robust Market Growth
►More favorable economic environment
►Demand trending upwards across the region
►OE Truck boosted by prior-year comparatives impacted by the introduction of Euro V standards
+7%+6%
+5%
+23%
OE RT
Markets at March 31, 2013(% change YoY, based on number of radial tires)
10 ― NORTH AMERICA - CITI― April, 2013
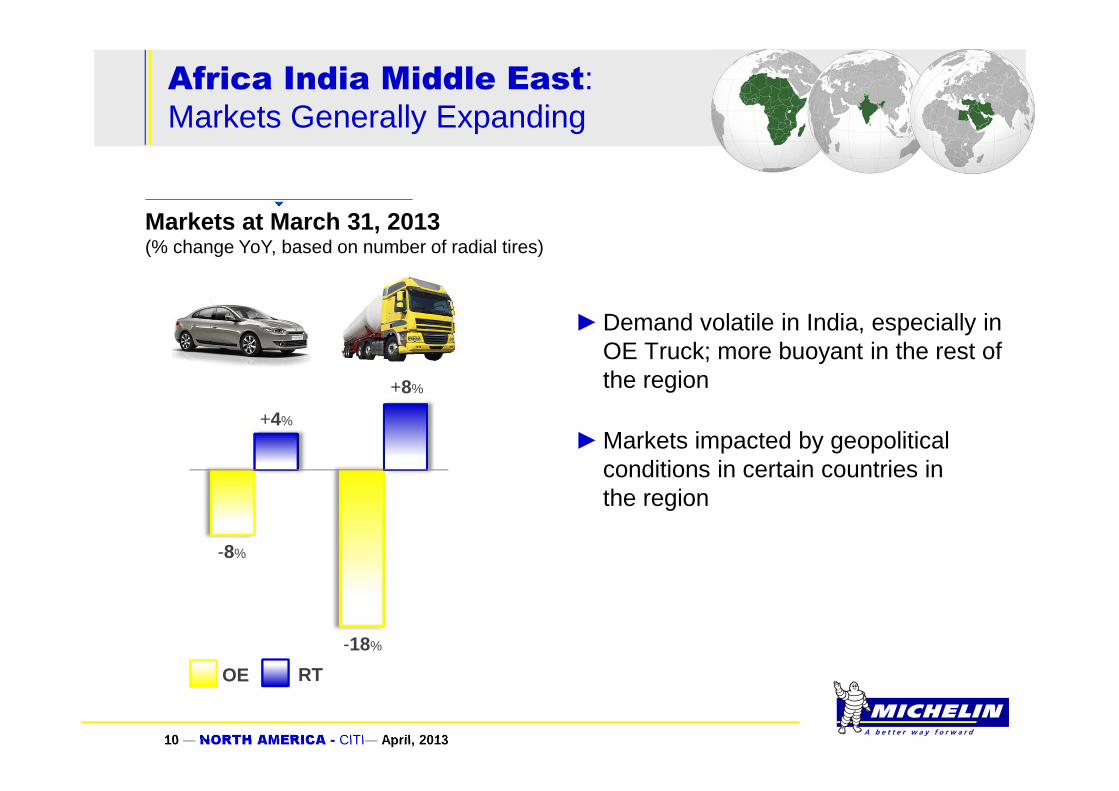
Africa India Middle East: Markets Generally Expanding
►Demand volatile in India, especially in OE Truck; more buoyant in the rest of the region
►Markets impacted by geopolitical conditions in certain countries in the region
-8%
+4%
+8%
-18%
OE RT
Markets at March 31, 2013(% change YoY, based on number of radial tires)

11 ― NORTH AMERICA - CITI― April, 2013
►Demand varied by region:
■Weak in Europe in Passenger Car & Light Truck
■ Disappointing in North America
■ Growing in the new markets, without fully offsetting the weakness in mature regions
A Contracting Global Market
OE RT
Markets at March 31, 2013(% change YoY, based on number of radial tires)
-1%-2%
+0%
-1%
12 ― NORTH AMERICA - CITI― April, 2013
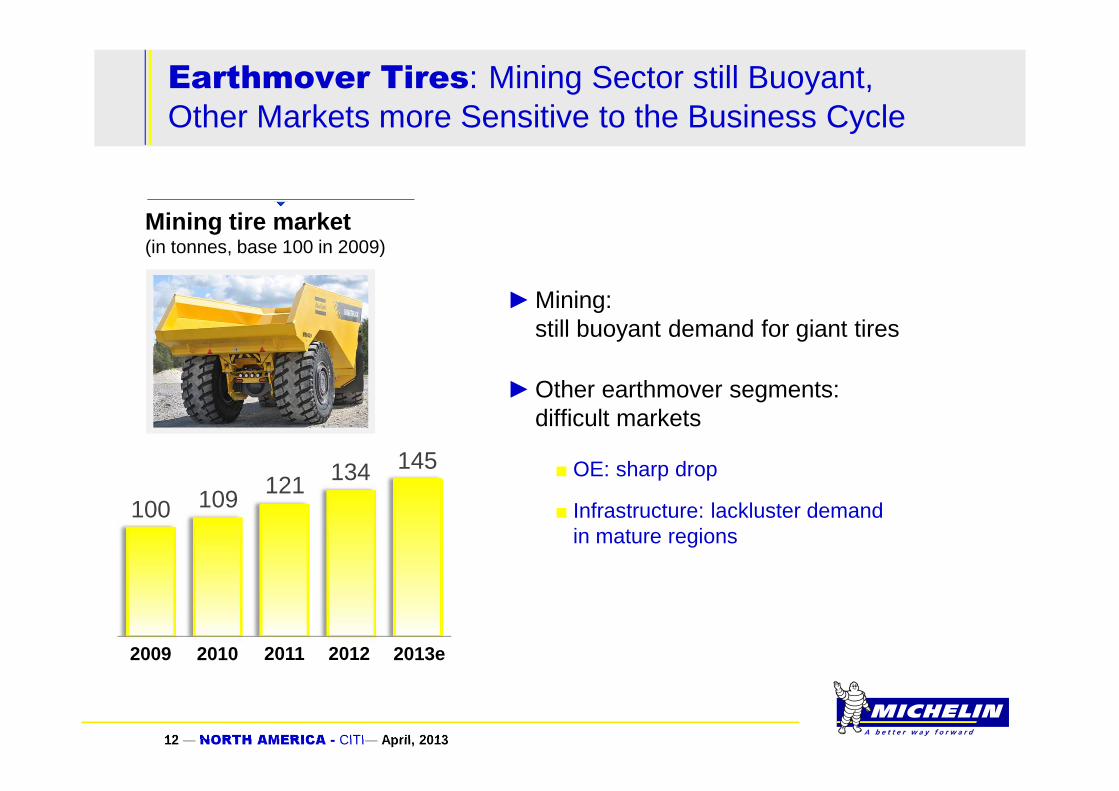
2009 2010 2011 2012 2013e
100 109121 134 145
Earthmover Tires: Mining Sector still Buoyant, Other Markets more Sensitive to the Business Cycle
►Mining: still buoyant demand for giant tires
►Other earthmover segments: difficult markets
■ OE: sharp drop
■ Infrastructure: lackluster demand in mature regions
Mining tire market(in tonnes, base 100 in 2009)
13 ― NORTH AMERICA - CITI― April, 2013
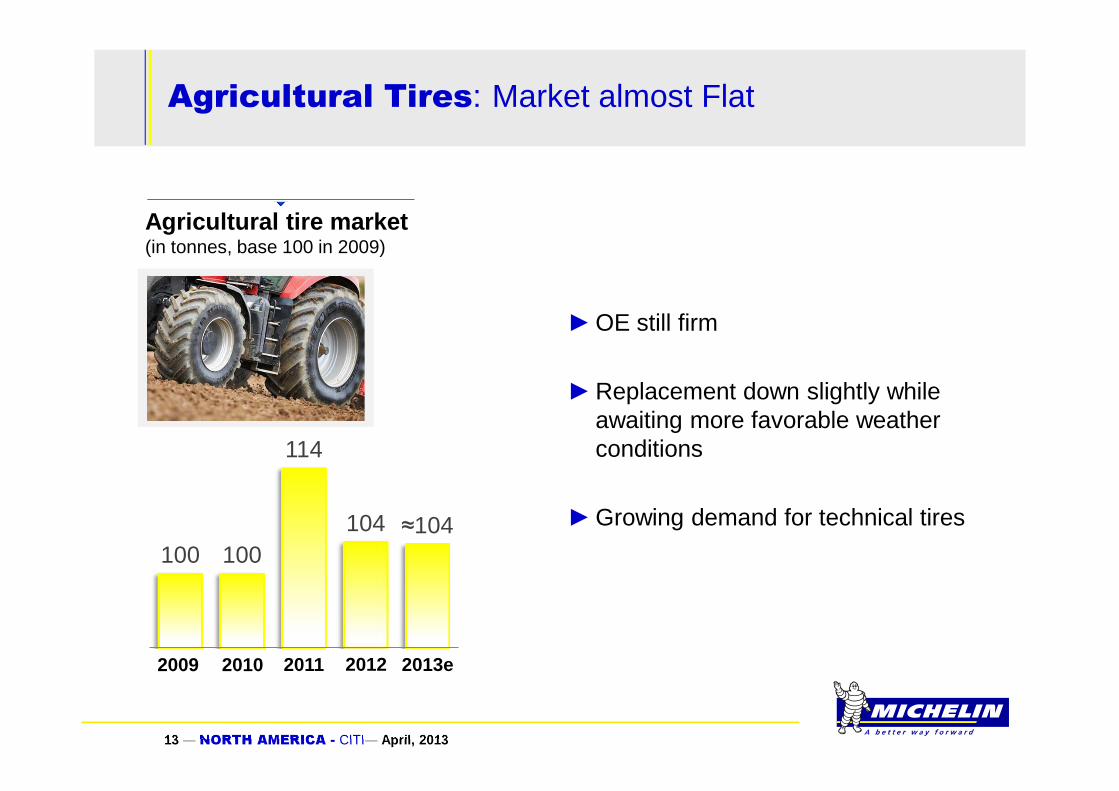
Agricultural Tires: Market almost Flat
100 100
114
104 ≈104
2013e2009 2010 2011 2012
►OE still firm
►Replacement down slightly while awaiting more favorable weather conditions
►Growing demand for technical tires
Agricultural tire market(in tonnes, base 100 in 2009)

14 ― NORTH AMERICA - CITI― April, 2013
April 22, 2013
NET SALES
NET SALES IN LINE WITH ANNUAL OUTLOOK2

15 ― NORTH AMERICA - CITI― April, 2013
Net sales in Line with Annual Outlook
Q1 2012Net Sales
Q1 2013Net Sales
5,304 - 227
Volumes(-4.3%)
+35,9%
4,877
-138-61
Price-Mix(-2.7%)
o/w mix: -€5mCurrency
(-1.2%)
-8.1%
YoY change(in € millions)
16 ― NORTH AMERICA - CITI― April, 2013
2012
Q1 Q3Q2 Q4 Q1
2013
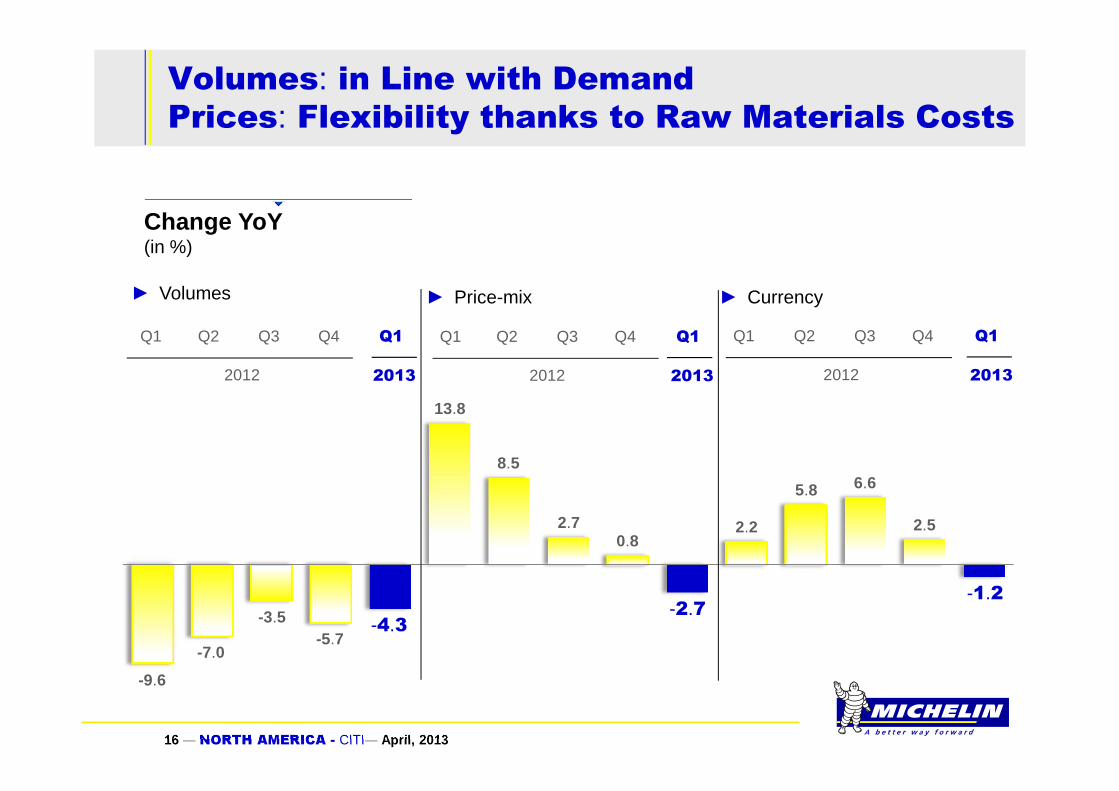
Volumes: in Line with DemandPrices: Flexibility thanks to Raw Materials Costs
-9.6
13.8
2.2
8.5
5.8
► Volumes ► Price-mix ► Currency
Q1 Q3Q2 Q4
2012
Q1
2013
-4.3
2.70.8
6.6
2.5
-7.0
-3.5-5.7
Q1 Q3Q2 Q4
2012
Q1
2013
-2.7-1.2
Change YoY(in %)
17 ― NORTH AMERICA - CITI― April, 2013
April 22, 2013
NET SALES
REPORTING SEGMENTS3
18 ― NORTH AMERICA - CITI― April, 2013
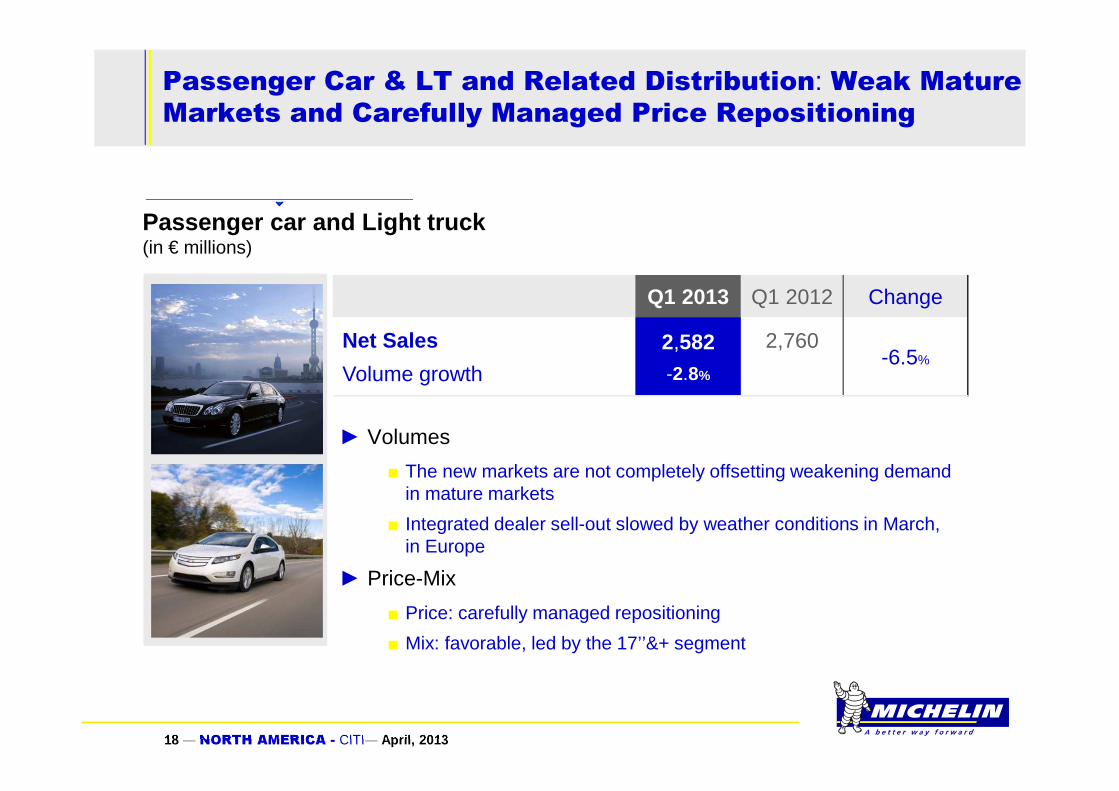
Passenger Car & LT and Related Distribution: Weak Mature Markets and Carefully Managed Price Repositioning
Q1 2013 Q1 2012 Change
Net Sales
Volume growth
2,582-2.8%
2,760-6.5%
► Volumes
■ The new markets are not completely offsetting weakening demand in mature markets
■ Integrated dealer sell-out slowed by weather conditions in March, in Europe
► Price-Mix
■ Price: carefully managed repositioning
■ Mix: favorable, led by the 17’’&+ segment
Passenger car and Light truck (in € millions)

19 ― NORTH AMERICA - CITI― April, 2013
Truck and Associated Distribution:Stabilizing over Q4 2012
Q1 2013 Q1 2012 Change
Net Sales
Volume growth
1,477-5.6%
1,604-7.9%
► Priority focus on turning around the Truck tire business and restoring its margins
► Integrated dealer sell-out slowed by the economic environment, notably in Europe
► Unfavorable currency effect
Truck (in € millions)

20 ― NORTH AMERICA - CITI― April, 2013
Specialty: Mining still Buoyant but Other Segments more Sensitive to the Business Cycle
Q1 2013 Q1 2012 Change
Net Sales
Volume growth
818-6.9%
940-13.0%
► Weak demand in OE Earthmover and the infrastructure segment
► Contractual price adjustments in the mining segment and in Earthmover and Agricultural OE
► Unfavorable currency effect
Specialty Businesses (in € millions)

21 ― NORTH AMERICA - CITI― April, 2013
April 22, 2013
NET SALES
2013 GUIDANCE4
22 ― NORTH AMERICA - CITI― April, 2013
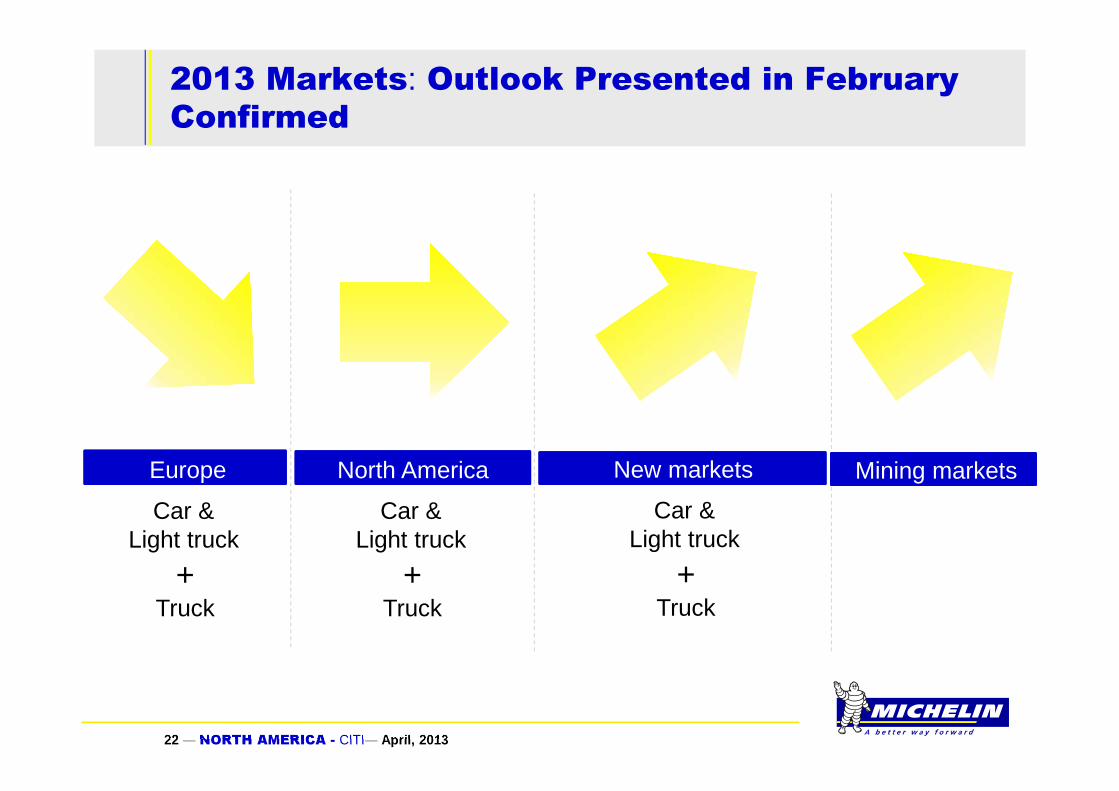
2013 Markets: Outlook Presented in February Confirmed
North America New marketsEurope Mining markets
Truck
Car & Light truck
+Truck
Car & Light truck
+Truck
Car & Light truck
+

23 ― NORTH AMERICA - CITI― April, 2013
►Stable volumes
►Disciplined margin: still favorable price-mix/raw materials combo, at around €250-€300 million
■ Unfavorable price-mix mainly due to raw materials clauses and carefully managed strategic price repositioning
■ Around €550-million favorable impact from raw materials
►Stable operating income before non-recurring items
►Positive FCF
■ Around €2 billion in capex
► > 10% ROCE
2013 Guidance Confirmed
24 ― NORTH AMERICA - CITI― April, 2013
► 1st quarter in line with the annual outlook presented in February
►Carefully managed pricing policy
►Demand seems to be firming up in April
► 2013 guidance confirmed
►October 2, 2013: Investor Day in the United States
Key Takeaways

25 ― NORTH AMERICA - CITI― April, 2013
April 22, 2013
NET SALES
APPENDICES5
26 ― NORTH AMERICA - CITI― April, 2013
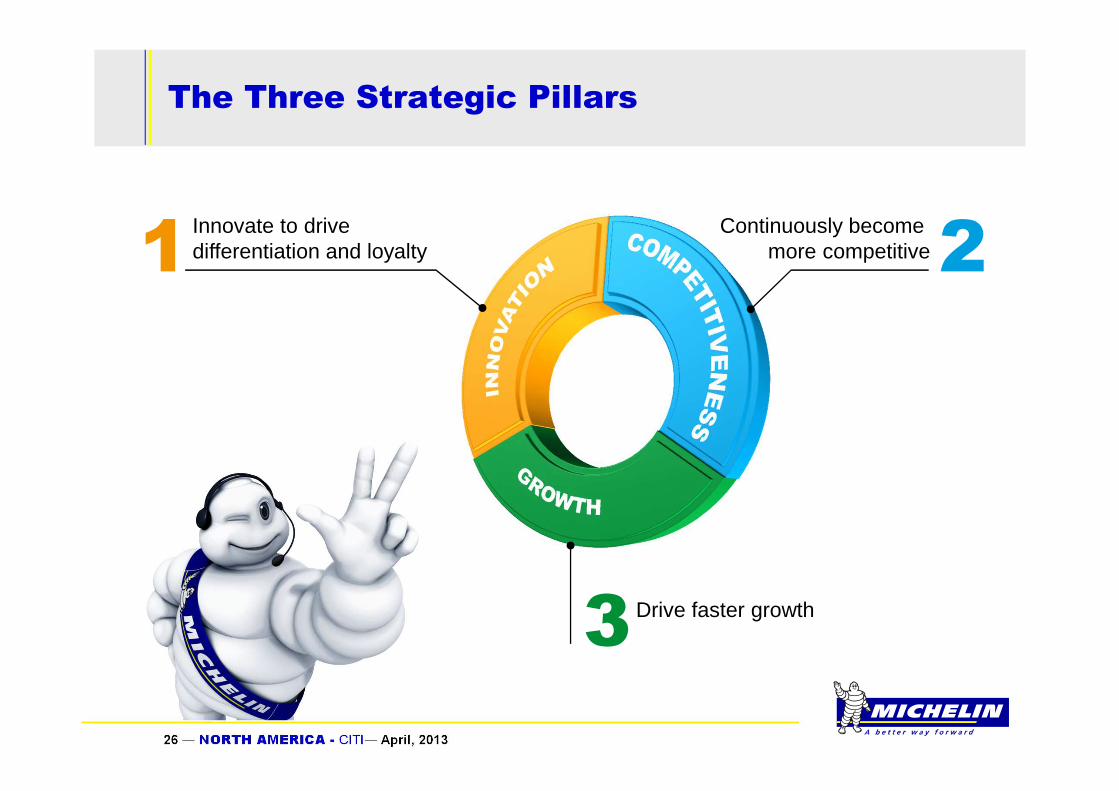
The Three Strategic Pillars
Innovate to drive differentiation and loyalty
Drive faster growth
Continuously become more competitive1 2
3

27 ― NORTH AMERICA - CITI― April, 2013
Solid balance sheetStructural FCF > €500mNet debt/equity: 12%
Comprehensive range of products and services
Passenger Car, Light Truck, Truck, Specialty
Upstream integration 30% of cables and 70% of synthetic rubber internally
sourced
THE
MICHELIN
BRAND
GROWTH
Product mixMore than 70% increase in 17”&+ capacity by 2015
Geographic mix2/3 of capacity investments
in the new markets
Technology leader €625m in R&D expenditure
Premium tire leader35% of car tire sales >17”
Specialty tire leaderWorld leader in radial
Earthmover tiresWorld leader in radial
Agricultural tiresWorld leader in radial
Aviation tires
Industrial productivity30% improvement by 2015
OPE business management application€250m reduction in inventory€200 million reduction in costs
Competitiveness program€1bn over the 2011-2015 period
INNOVATION COMPETITIVENESS
Global presence1/3 of sales in Europe1/3 in North America
1/3 in the rest of the world
A Strategy Built on Solid Competitive Strengths
28 ― NORTH AMERICA - CITI― April, 2013
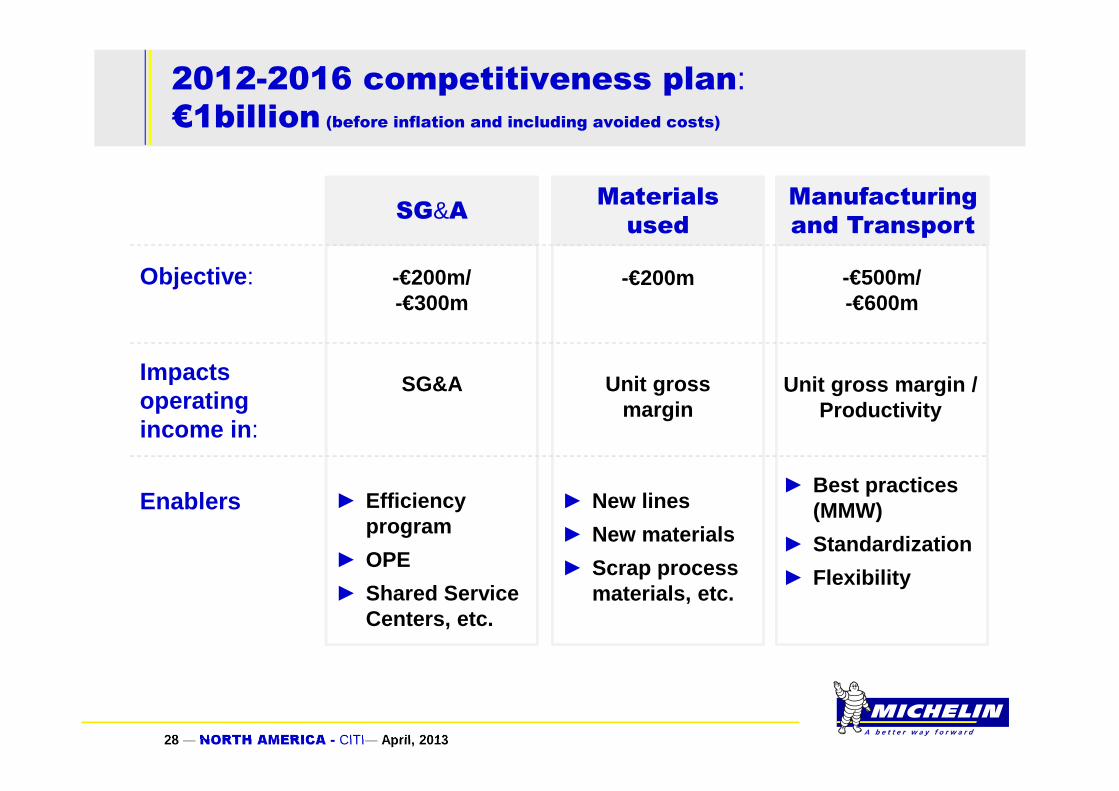
2012-2016 competitiveness plan:€1billion (before inflation and including avoided costs)
SG&A
Objective :
Impacts operating income in :
Enablers ► Efficiencyprogram
► OPE
► Shared Service Centers, etc.
► New lines
► New materials
► Scrap processmaterials, etc.
► Best practices (MMW)
► Standardization
► Flexibility
SG&A Unit grossmargin
Unit gross margin / Productivity
-€200m/-€300m
-€200m -€500m/-€600m
Materials
used
Manufacturing
and Transport

29 ― NORTH AMERICA - CITI― April, 2013
Competitiveness Plan: €190 million in Gains in 2012, Held Back by Weak Volumes
SG&ASG&A MaterialsMaterials Manufacturing –transport
Manufacturing –transport
2012 Annualobjectives
2012 Annualobjectives
2012 Annualobjectives
€50m
€30m
€110m
€152m
€35m
€3m
30 ― NORTH AMERICA - CITI― April, 2013
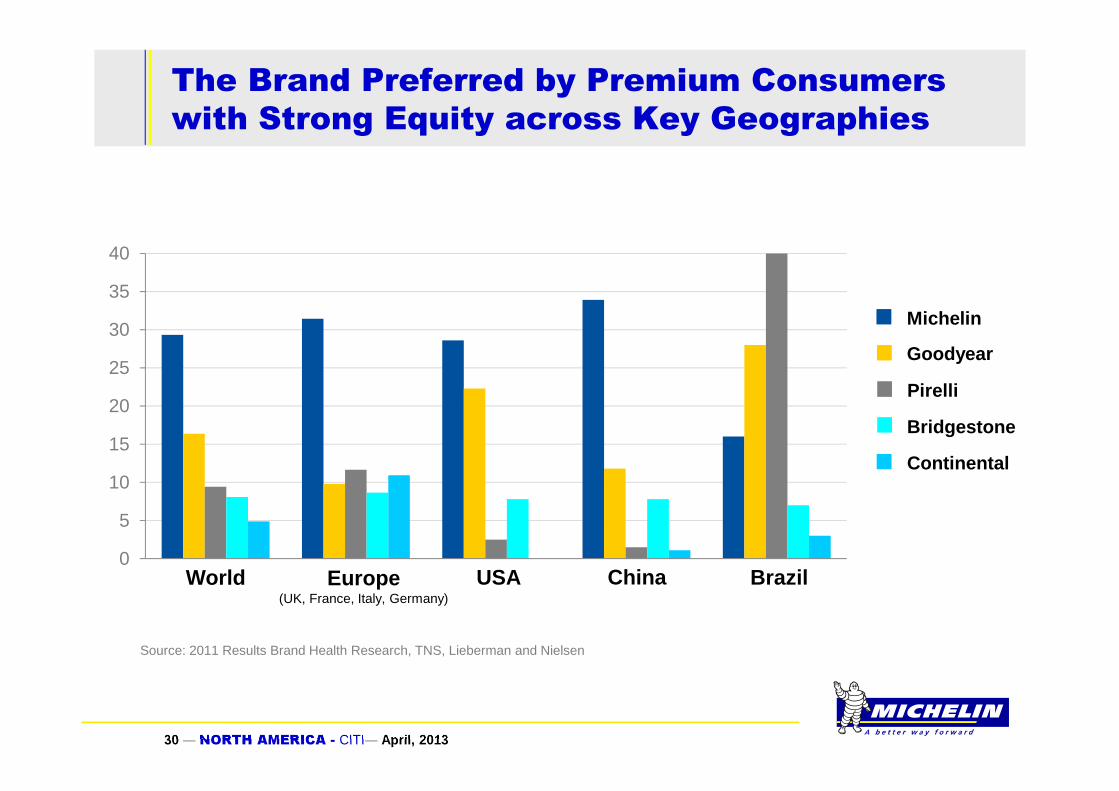
The Brand Preferred by Premium Consumers
with Strong Equity across Key Geographies
0
5
10
15
20
25
30
35
40
Continental
Bridgestone
Pirelli
Goodyear
Michelin
World Europe(UK, France, Italy, Germany)
USA China Brazil
Source: 2011 Results Brand Health Research, TNS, Lieberman and Nielsen

31 ― NORTH AMERICA - CITI― April, 2013
Ideal target
Car Design Drives Tire Premiumization:Trend for Bigger Wheel Diameter
☺Luxury cars
����Small vehicles and MPV

32 ― NORTH AMERICA - CITI― April, 2013
Consumers are Ready to Premiumize
Price Expectations Reflect Market Upgrading
Source: Perceived value Survey Europe G5
Price expectationIndex 100 = 14’’
Question : On average, what price would you be prepared to pay for a tyre? We are talking about the tyre alone, not including f itting, balancing or valve-fitting .
Premium
Mass
100
120
140
160
180
200
220
240
14" 15" 16" 17" 18"

33 ― NORTH AMERICA - CITI― April, 2013
PC/LT Premium: Strong Growth Opportunity Seized by Michelin
Source: Michelin
Europe North America
China Brazil
-10-5
4
-2
46
4
2936
3 4
29
Michelin sales≥ 17"
Michelin sales≥ 17"
Market ≥ 17"Marché totalTotal marketMichelin sales≥ 17"
Michelin sales≥ 17"
Market ≥ 17"Total market
Growth in the replacement Car & Light truck market(2012 vs. 2011 in %)

34 ― NORTH AMERICA - CITI― April, 2013
MICHELIN: Leading the Market in Premium
Tires
2012 Passenger Car and Light Truck tire market by size(in number of tires)
Global market
21% 79%
MICHELIN brand
35% 65%
≤16’’≥17’’
≤16’’≥17’’

35 ― NORTH AMERICA - CITI― April, 2013
A Vast Network of Franchised Dealers:2,000 Points of Sale Today to 5,000 by 2017
TYREPLUS Franchise
1,385►3,540EUROMASTER Franchise
628►1,700
3 Pilot ►500South
America
50►120North
America
100►400AfricaIndia
Middle-East 219►600ASEAN
840►1,700China
173►220EasternEurope

36 ― NORTH AMERICA - CITI― April, 2013
► 1st tire: February 9, 2012
►Capacity late 2013: 17,000 tonnes
Itatiaia - Brazil
Car & Light Truck

37 ― NORTH AMERICA - CITI― April, 2013
Shenyang 2 - China
Truck and Car & Light Truck
► 1st Truck tire: January 26, 2013
► 1st Car & Light Truck tire: mid-2013
► 2013 capacity: 25,000 tonnes

38 ― NORTH AMERICA - CITI― April, 2013
Chennai – India
Truck
► 1st Truck tire: 2nd half 2013
39 ― NORTH AMERICA - CITI― April, 2013
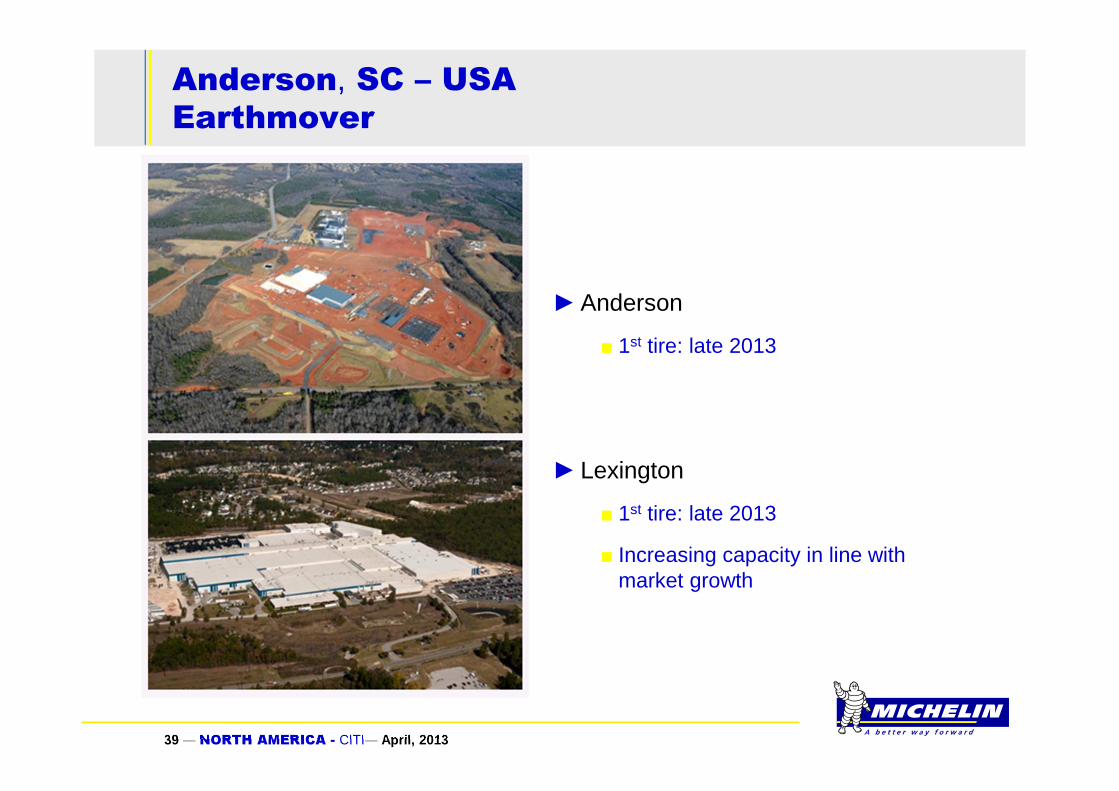
►Anderson
■ 1st tire: late 2013
► Lexington
■ 1st tire: late 2013
■ Increasing capacity in line withmarket growth
Anderson, SC – USAEarthmover

40 ― NORTH AMERICA - CITI― April, 2013
0%
20%
40%
60%
80%
100%
0 1 2 3 4 5 6 7 8 9 10
Towards a profitable growth
Construction
EBIT>04-5 years
AnnualFCF>0
5-6 years
ROCE>9%7-8 years
1st Tire: 2-2.5 years
Return on a 200 KT greenfield project
CapexCapacity
41 ― NORTH AMERICA - CITI― April, 2013
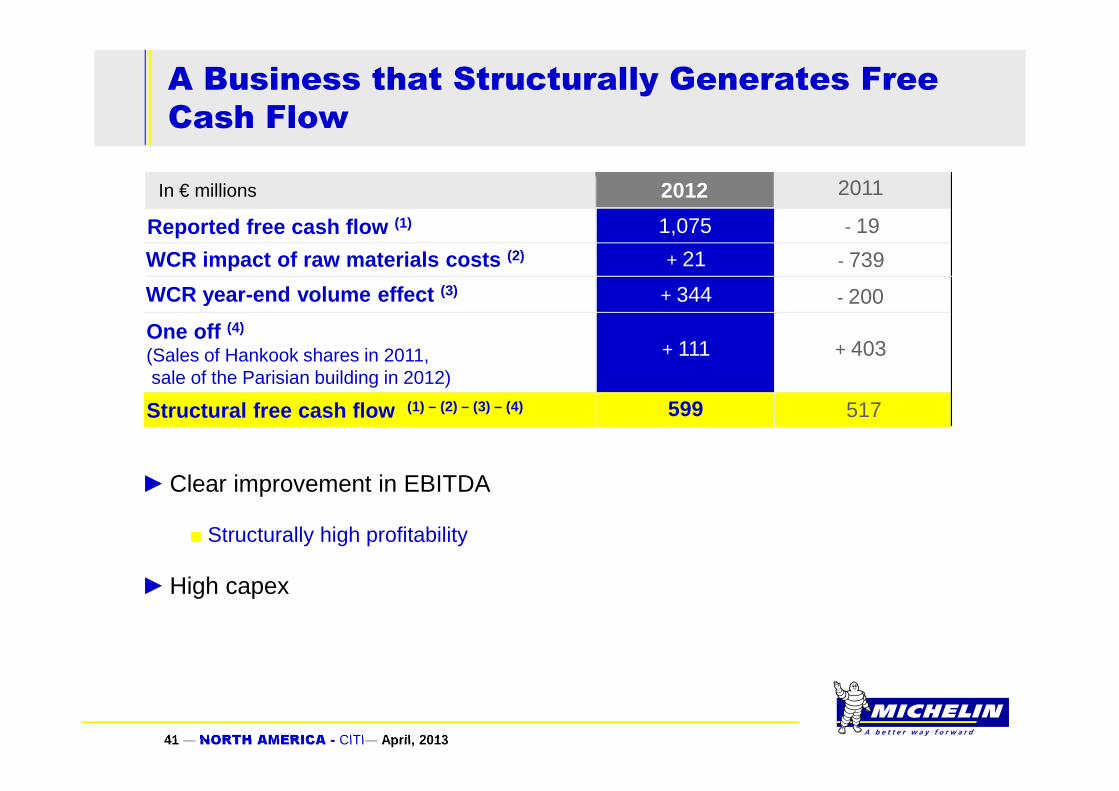
►Clear improvement in EBITDA
■ Structurally high profitability
►High capex
A Business that Structurally Generates Free
Cash Flow
WCR impact of raw materials costs (2)
One off (4)
(Sales of Hankook shares in 2011, sale of the Parisian building in 2012)
2012
Reported free cash flow (1)
2011
517
1,075
+ 21
- 19
- 739
WCR year-end volume effect (3)
599
+ 344 - 200
Structural free cash flow (1) – (2) – (3) – (4)
+ 111 + 403
In € millions

42 ― NORTH AMERICA - CITI― April, 2013
► 2015 Operating Income before non-recurring items: around €2.9bn
►Normalized Segment performance:
■ Car & Light truck operating margin before NR items: 10% -12%
■ Truck operating margin before NR items: 7% - 9%
■ Specialty operating margin before NR items: 20% - 24%
►2013-2015 capex: €1.8bn - €2.2bn per year
►Positive free cash flow every year
►ROCE > 10% each year
2015 Outlook Confirmed
43 ― NORTH AMERICA - CITI― April, 2013
Contacts
Valérie MagloireAlban de Saint Martin
+33 (0) 1 78 76 45 36
27, cours de l’île Seguin92100 Boulogne-Billancourt - France
Investor Relations
44 ― NORTH AMERICA - CITI― April, 2013
Disclaimer
"This presentation is not an offer to purchase or a solicitat ion torecommend the purchase of Michelin shares. To obtain more de tailedinformation on Michelin, please consult the documentation publishedin France by Autorité des marchés financiers available from thewww.michelin.com website.
This presentation may contain a number of forward-lookingstatements. Although the Company believes that these state ments arebased on reasonable assumptions at the time of the publicati on of thisdocument, they are by nature subject to risks and contingenc ies liableto translate into a difference between actual data and the fo recastsmade or induced by these statements."
Top Related