


Languages
Pages
Legal


JAKARTA, 12 JUNE 2013
NATIONAL ENERGY COUNCIL
INDONESIA ENERGY POLICY TO SECURE SUTAINABLE
DEVELOPMENT
INAGA – IIGCE 2013
Presented by: Dr. Ir. Tumiran, M. Eng.
Member of National Energy Council

DEWAN ENERGI NASIONAL
1
NATIONAL ENERGY COUNCIL

DEWAN ENERGI NASIONAL
2
CHAIRMAN
Chairman : President
Vice Chairman : Vice President
Executive Chairman : Minister of Energy and Mineral Resources
MEMBERS
STRUCTURE of NEC
Government Representatives Stakeholders Representatives
1. Minister of Finance
2. Minister of National Development
Planning
3. Minister of Transportation
4. Minister of Industry
5. Minister of Agriculture
6. Minister of Research and Technology
7. Minister of Environment
1. Ir. Agusman Effendi (Consumer)
2. Prof. Ir. Rinaldy Dalimi, M.Sc, Ph. D
(Academics)
3. Dr. Ir. Herman Darnel Ibrahim, M.Sc
(Industry)
4. Dr. Ir. Tumiran, M.Eng (Academics)
5. Prof.Dr. Ir. Mukhtasor, M. Eng. Ph.D
(Environment Expert)
6. Prof. Dr. Herman Agustiawan (Consumer)

DEWAN ENERGI NASIONAL
3
The ROLE OF NEC
Monitoring and Supervising
the Implementation of Cross –
Sectoral Energy Policies
Preparing and Formulating
National Energy Policy (KEN)
Determining
National Energy General Plan
(RUEN)
Determining
Guidelines in Addressing Energy
Crisis and Emergency Situation
N
E
C
NEC VISION
To Ensure Energy
Security that
Support Sustainable
National
Development

DEWAN ENERGI NASIONAL
4
Law Num. 30/2007 on
Energy
NATIONAL ENERGY
POLICY to 2050
RUEN RUKN RUED
Province
RUPTL RUED
Distric/city
University,
Society,
Local
Government,
Scientist,
Industry sector,
Other
Stakeholders
Law No. 30/2009 On
Electricity
RELATION OF NEP - NATIONAL ENERGY PLANNING
It Has been
delivered to DPR
by The president
as NEC Chairman

DEWAN ENERGI NASIONAL
5
ENERGY SOURCES
Sources exploited
from Mining :
Resources are
limited
Sources come
from many type:
continuous,
recycling and
sustain
Human being,
environmental
security,
sustainability ,
energy security,
economic
consideration

DEWAN ENERGI NASIONAL
6
Aplication of Energy
1. Industrial Sector: Cement, textile, otomotive, garment, stell
processing, food, manufactures, others.
2. Office and management: Building, hotel, goverment and
private office, education.
3. Transportation: cars, bus, trucks, train, private car,
4. Lighting: office, hotel, building, housing, road,
5. Housing : cooking, cooling system, heating, lighting
others.
6. feedstock

DEWAN ENERGI NASIONAL
7
Factors affecting energy demand growth:
1. Population Growth
2. Economic growth
3. Industrial Growth
4. Administration , office and Hotel
5. Human welfare
6. Change of Daily activities habit
Growth of Energy Demand

DEWAN ENERGI NASIONAL
8
World Energy Demand World economic growth is clearly linked to the increasing availability of
energy sources. Three fuels, oil, coal and natural gas dominate the world’s
primary energy market. According to IEA in 2011, world marketed energy
consumption grows by 53 percent from 2008 to 2035. Total world energy
use rises from 505 quadrillion British thermal units (Btu) in 2008 to 619
quadrillion Btu in 2020 and 770 quadrillion Btu in 2035.Much of the
growth in energy consumption occurs in countries outside the Organization
for Economic Cooperation and Development (non-OECD nations), where
demand is driven by strong long-term economic growth. Energy use in
non-OECD nations increases by 85 percent in the Reference case, as
compared with an increase of 18 percent for the OECD economies
DEWAN ENERGI NASIONAL
9
WORLD ENERGY DEMAND GROWTH

DEWAN ENERGI NASIONAL
10
WORLD ENERGY DEMAND AND GROWTH
DEWAN ENERGI NASIONAL
11
NATIONAL ENERGY CONDITION

DEWAN ENERGI NASIONAL
12
Indonesia gas production,
consumption and export

DEWAN ENERGI NASIONAL
13
INDONESIA COAL PRODUCTION AND
EXPORT
DEWAN ENERGI NASIONAL
14
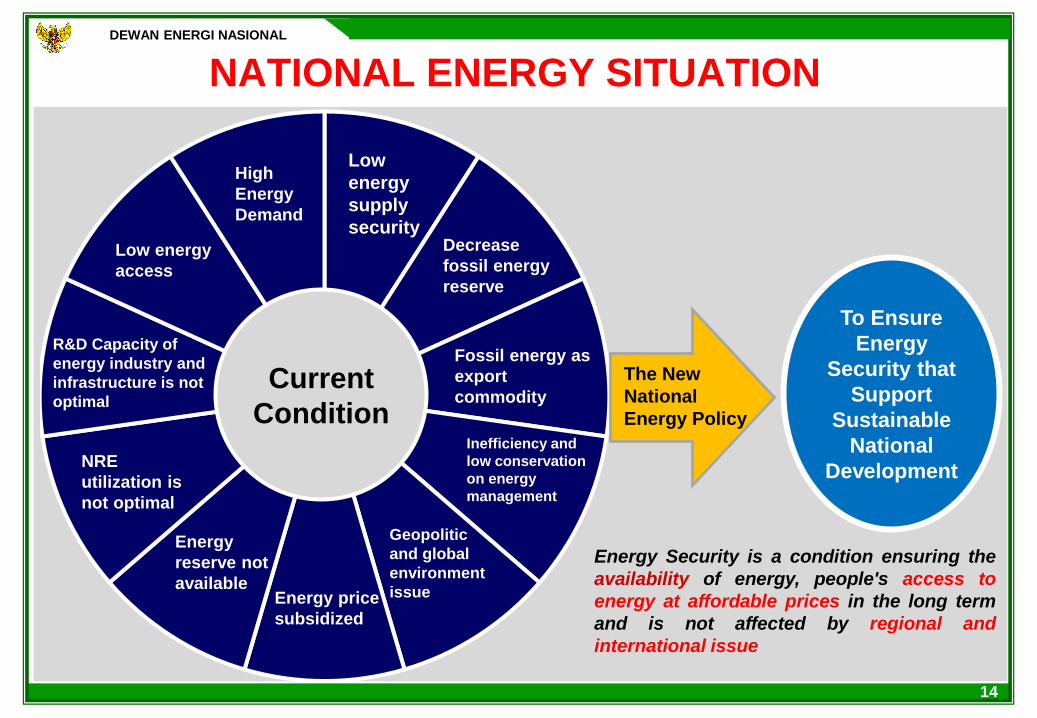
NATIONAL ENERGY SITUATION
To Ensure
Energy
Security that
Support
Sustainable
National
Development
High
Energy
Demand
Low
energy
supply
security Decrease
fossil energy
reserve
Fossil energy as
export
commodity
Inefficiency and
low conservation
on energy
management
NRE
utilization is
not optimal
R&D Capacity of
energy industry and
infrastructure is not
optimal
Low energy
access
Energy price
subsidized
Energy
reserve not
available
Current
Condition
Geopolitic
and global
environment
issue
The New
National
Energy Policy
Energy Security is a condition ensuring the
availability of energy, people's access to
energy at affordable prices in the long term
and is not affected by regional and
international issue

DEWAN ENERGI NASIONAL
15
No. INDICATOR INDONESIA JAPAN CHINA
1 Population (thousand people) 241.134 127.360 1.344.130
2 GDP (million US$) 846.832 5.867.154 7.318.499
3 GDP/Capita (thousand US$) 3.512 46.067 5.445
4 Final Energy Consumption
(million TOE) 119,2 334,7 2.613
5 Energy Consumption/Capita
(TOE/Capita) 0,5 2,6 1,94
6 Power Plant Capacity(GW) 34,5 287 1.073
7 Electricity Consumption/Capita
(kwh/Capita) 655,2 8.746 3.488
8 Share Renewable Energy in
Energy Mix 4,05% 16% 11%
ECONOMIC AND ENERGY INDICATORS 2011

DEWAN ENERGI NASIONAL
16
No. Country Population
(Million)
Power Plant
(Billion kWh)
GDP/
Capita
Electricity per Capita
(kWh/Capita)
1 Brunei
Darussalam 0.39 3 54,400 8,308
2 Singapore 4.66 41 48,500 8,185
3 Malaysia 25.72 103 14,200 3,490
4 Thailand 65.91 148 7,900 2,079
5 Vietnam 86.97 61 2,500 799
6 Indonesia 240.27 142 3,500 591
7 Filipina 97.98 57 3,100 588
8 Laos 6.83 2 1,900 178
9 Cambodia 14.49 1 1,800 113
10 Myanmar 48.14 6 1,100 97
COMPARISON OF ELECTRICITY CONSUMPTION
IN ASEAN COUNTRIES 2010

DEWAN ENERGI NASIONAL
17
POWER PLANT GENERATION BY PLN 2011
Sumber : Diolah dari berbagai sumber
source: PT. PLN

DEWAN ENERGI NASIONAL
18

DEWAN ENERGI NASIONAL
19
Sumber : Diolah dari berbagai sumber
ENERGY SUBSIDIES
2006 2007 2008 2009 2010 2011 2012
Oil Price in APBN
(US$/barel) 63,8 69,7 97,0 61,6 80,0 110,0 90,0
Fuel Subsidies (trillion Rp) 64,2 83,8 139,1 45,0 88,9 165,2 211,9
Electricity Subsidies
(trilion Rp) 30,4 33,1 83,9 49,5 55,1 93,4
94,6
(103)
Source: Kementerian ESDM

DEWAN ENERGI NASIONAL
20
ENERGY DEMAND FORCAST TO 2050

DEWAN ENERGI NASIONAL
21
KEY ASSUMPTION
2010 2015 2020 2025 2030 2040 2050
Population million 238 250 261 271 280 299 307
Growth % 1,5 1,0 0,9 0,8 0,7 0,7 0,3
World
Population million 6.900 7.284 7.650 8.011 8.300 8.850 9.200
GDP billion
USD 711 1.335 2.416 4.257 6.793
12.98
9
20.16
9
Growth GDP % 6,6 13,4 12,6 12 9,8 6,7 4,5
GDP/Cap USD 2.987 5.340 9.257 15.70
8
24.26
1
43.44
1
65.69
7

DEWAN ENERGI NASIONAL
22
ENERGY SUPPLY AND DEMAND TO 2050
Target:
Energy Elasticity< 1 (year 2025)
Electrification Ratio : 100% (year 2020)
TARGET SATUAN 2015 2020 2025 2050
Primary Energy Supply MTOE 215 290 400 1.000
Primary Energy Supply per
Capita TOE 0,9 1,1 1,4 3,2
Power Plant Generation GW 49 79 115 430
Electricity Consumption per
Capita KWh 832 1308 2.500 7.000

DEWAN ENERGI NASIONAL
23
NATIONAL ENERGY POLICY

DEWAN ENERGI NASIONAL
24
1. Changing paradigm in Energy Policy: Natural Resources from commodity to
be National Development Assets.
2. Improving efficiency, conservation, and special attention for sustainable
development in the national energy management policy
3. To increase the contribution of renewable energy in the national energy mix
continuously.
4. To increase the fossil energy resources and proven reserved , and reduce it
contribution (percentage) in the national energy mix.
5. To improve independency in the National Energy Management, accelerating
to open job creation, accelerating the role and participation of domestic
industry in energy sector, and to boast research and development in energy
sector.
6. To accelerate opening energy access for all people
7. To secure energy supply, especially electricity, oil and gas.
8. To optimize the using of Natural Energy Resources for Economic Development of the
Nation based on “ Economic Added value Process”
9. To improve the understanding that the fossil energy must be stored as long as
possible to guaranty the security of the Nation to the all stake holders.
10. To declare and securing The strategic National Energy reserved
The Macro View of Energy Policy

DEWAN ENERGI NASIONAL
25
NATIONAL ENERGY POLICY DIRECTION
1. Availability of Energy
2. Priority of Energy Development
3. National energy resources utilization
4. National energy reserve
5. Conservation and diversification
6. Environment and Safety
7. Price, subsidy, and incentive
8. Energy infrastructure and industry
9. Energy research and development
10. Institution and Financing

DEWAN ENERGI NASIONAL
26
CONTRIBUTIONS OF ENERGY IN NATIONAL ECONOMY
DEVELOPMENT
OTHERS
INPUT ENERGY
ECONOMIC
OUTPUT
Energy is one of the important input in economic development
DEWAN ENERGI NASIONAL
27
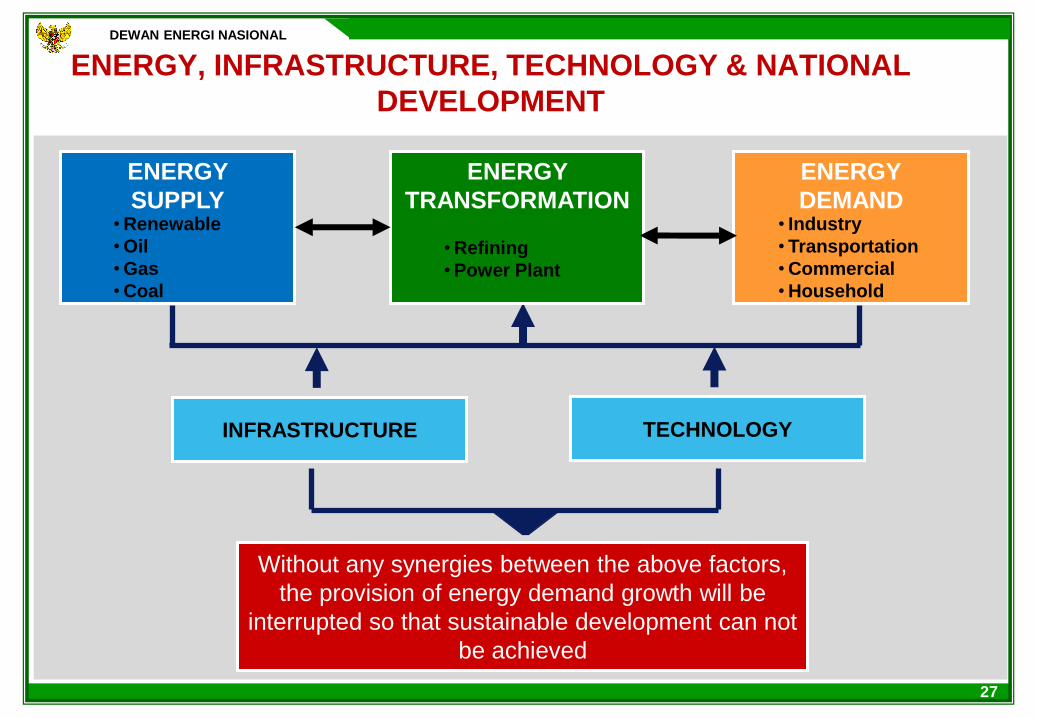
ENERGY, INFRASTRUCTURE, TECHNOLOGY & NATIONAL
DEVELOPMENT
ENERGY
SUPPLY
Without any synergies between the above factors,
the provision of energy demand growth will be
interrupted so that sustainable development can not
be achieved
ENERGY
TRANSFORMATION
ENERGY
DEMAND
INFRASTRUCTURE TECHNOLOGY
•Renewable
•Oil
•Gas
•Coal
•Refining
•Power Plant
• Industry
• Transportation
•Commercial
•Household
DEWAN ENERGI NASIONAL
28
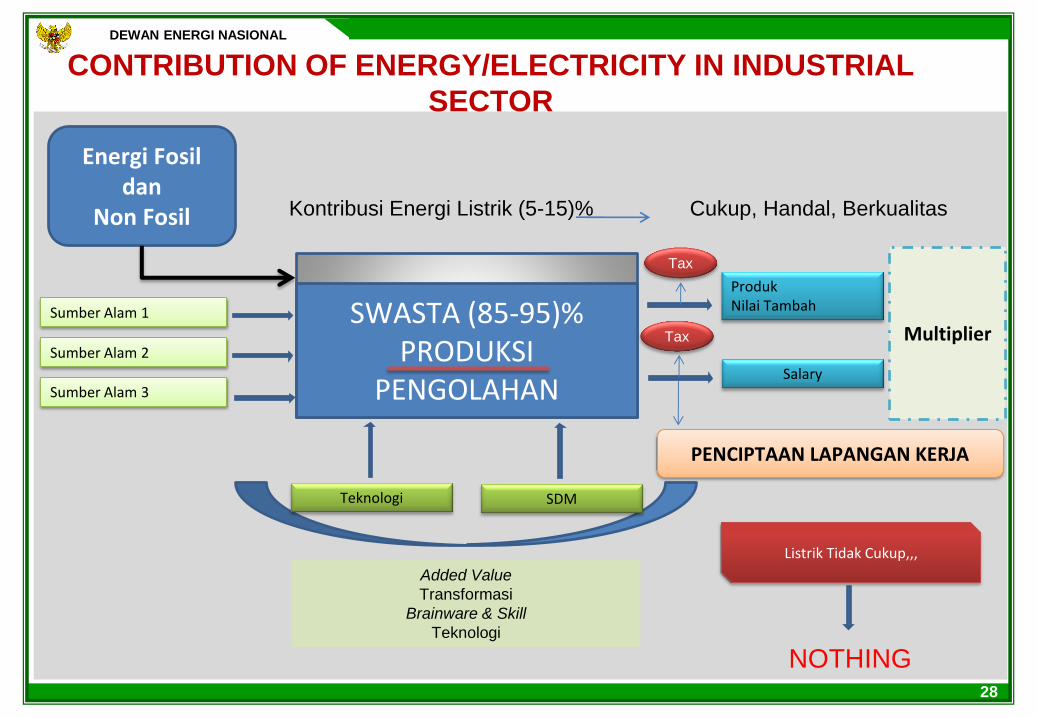
Energi Fosil dan
Non Fosil Kontribusi Energi Listrik (5-15)% Cukup, Handal, Berkualitas
SWASTA (85-95)% PRODUKSI
PENGOLAHAN
Sumber Alam 1
Sumber Alam 3
Sumber Alam 2
Produk Nilai Tambah
Salary
Tax
Tax
Multiplier
PENCIPTAAN LAPANGAN KERJA
Teknologi SDM
Added Value
Transformasi
Brainware & Skill
Teknologi
Listrik Tidak Cukup,,,
NOTHING
CONTRIBUTION OF ENERGY/ELECTRICITY IN INDUSTRIAL
SECTOR

DEWAN ENERGI NASIONAL
29
ROLE OF RENEWABLE ENERGY TO SUPPORT ENERGY
SECURITY

DEWAN ENERGI NASIONAL
30
2030
2010 2025
2050
(%)
Gas Bumi
Batubara
EBT
22%
23% 30%
25% 20%
24% 25%
31%
Realisasi tahun 2010, Pusdatin, KESDM
ENERGY MIX
Minyak Bumi
49% 22%
24%
5%
25%
22% 30%
23%

DEWAN ENERGI NASIONAL
31
Installed
Ready to be developed
Detailed Survey
Preliminary Survey
Source: Badan Geologi KESDM (2011)
PLTP SIBAYAK: 12 MW
PLTP GUNUNG SALAK: 377 MW
PLTP WAYANG WINDU: 227 MW
PLTP DARAJAT: 270 MW PLTP DIENG: 60 MW
PLTP LAHENDONG: 80 MW
No. Island Total Location Potency (MW)
1 Sumatera 86 13,470
2 Jawa & Bali 76 10,013
3 Nusa Tenggara 22 1,471
4 Kalimantan 12 145
5 Sulawesi 56 2,939
6 Maluku & Papua 33 1,126 TOTAL 285 29,164
PLTP ULUBELU: 110 MW
PLTP ULUMBU: 5 MW
GEOTHERMAL POTENTIAL
PLTP KAMOJANG: 200 MW
31

DEWAN ENERGI NASIONAL
32
GEOTHERMAL DEVELOPMENT ROAD MAP (2008 –
2025)
1442 MW
EXISTING MINING WORK AREA
958 MW
EXISTING MINING WORK AREA
1158 MW
EXISTING MINING WORK
AREA + NEW
1400 MW
NEW MINING WORK AREA
3500 MW
NEW MINING WORK AREA
Presented by Minister ESDM in Bali
2010

DEWAN ENERGI NASIONAL
33
2015 2020 2025 2030 2040 2050
Geothermal Capacity 2 5 6 7 8 13
National Capacity 49 79 115 159 270 430
-
50
100
150
200
250
300
350
400
450
500
GW
POWER GENERATION CAPACITY FORCAST

DEWAN ENERGI NASIONAL
34
The Important in accelerating Geothermal
1. To increase the security of Electric supply
2. To Reduce the contribution of Oil for power plant
3. To reduce Electricity Production Cost
4. To bost Economic Growth in Geothermal Power Plant
Region and area connected to electricity grid
5. To create new Job
6. To increase the contribution of Renewable Energy
All the obstacle for implementing it must be over
come

DEWAN ENERGI NASIONAL
35
THANK YOU
DEWAN ENERGI NASIONAL
4th fl. Badiklat ESDM Building, Jl. Jenderal Gatot Subroto Kav 49
Jakarta Selatan
Tel. (+6221) 52921621
Fax. (+6221) 52920190
www.den.go.id
Top Related