


Languages
Pages
Legal

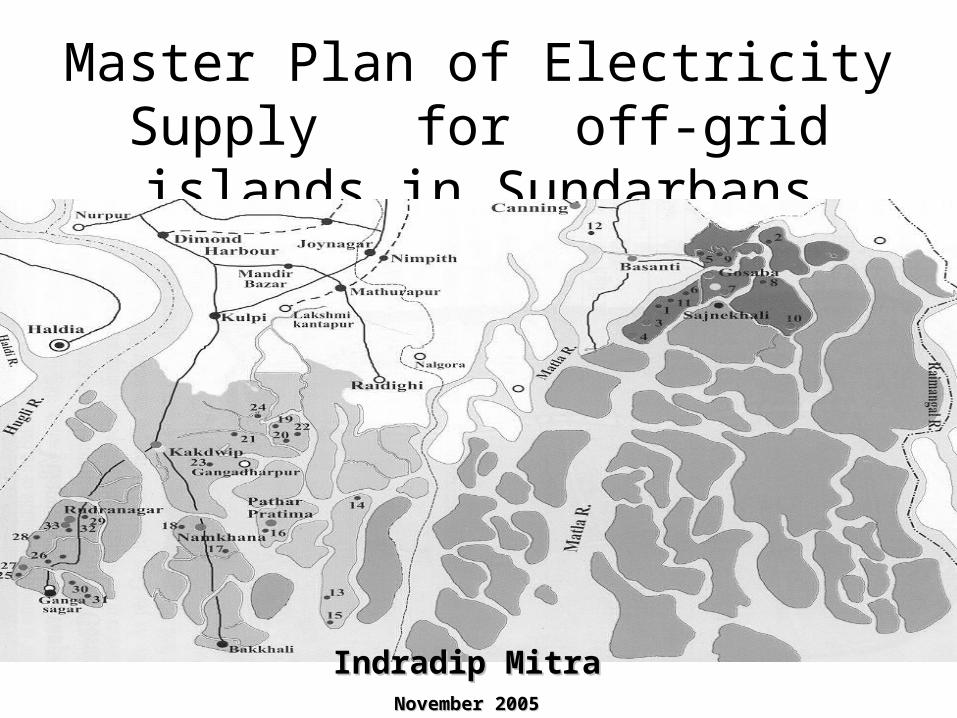
Master Plan of Electricity Supply for off-grid islands in Sundarbans
Indradip MitraIndradip MitraNovember 2005November 2005

Contents
• Background-Sundarbans• Project objective• Major Project components
-Survey-Analysis through HOMER-Plant configurations
• Proposed Measures
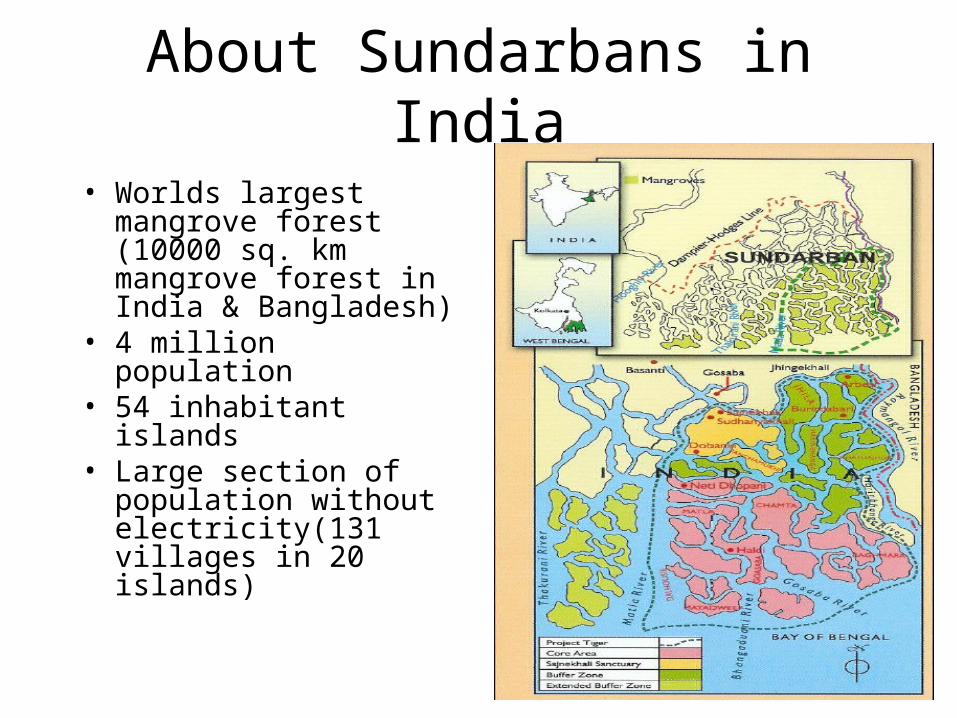
About Sundarbans in India
• Worlds largest mangrove forest (10000 sq. km mangrove forest in India & Bangladesh)
• 4 million population • 54 inhabitant islands• Large section of
population without electricity(131 villages in 20 islands)

RE Resources
• Solar- avg 4.91 kWh/sq. m/day
• Wind- avg 4.77m/s at Gangasagar(25m sensor); avg 4.8m/s at Frazerganj(20 m sensor)
• Good biomass resource potential

Electricity so far in Islands (as on November,2005)
RE Projects
Number Aggregate Capacity
Benefited Household
Population Covered
Solar Power Plant
13 707 kWp 3,450 18,400
Solar Home Lighting System
35,000 35 Wp to 74 Wp
35,000 2,00,000
Biomass Gasifier Power Plant
2 1000 kW 1,500 9,000
Wind Diesel Hybrid System
1 510 kW 1,000 5,000
Total 40,950 232,400

Project Objective
To formulate the Master Plan for WBREDA for ‘Electrification of off-grid Islands of Sunderbans region through Renewable Sources of Energy’ by 2008

Activities
• Secondary information collection• Primary survey of all off-grid islands
– Location and load for power plants
• Analysis by HOMER– Configuration of individual plants
• Preparation of project profiles• Tariff, revenue, institutional models• Final report

Primary Survey
• Primary survey in 31 islands• Finalizing project areas in 20 islands• Estimating load requirements
– Markets– Households
• Estimating load requirements• Narrowing down to proposed plant sites
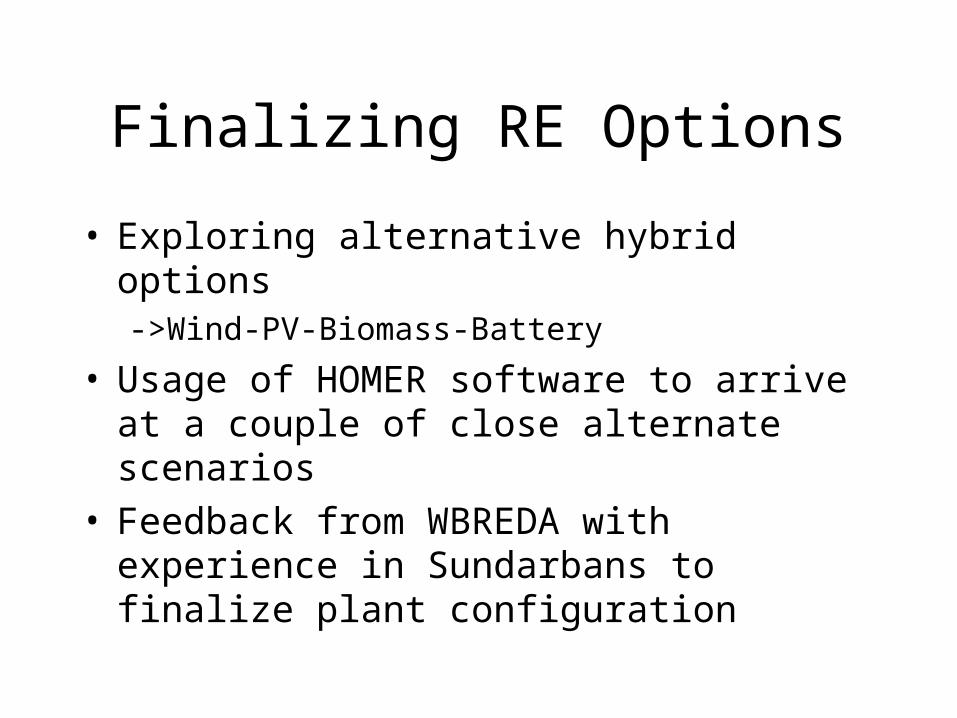
Finalizing RE Options
• Exploring alternative hybrid options->Wind-PV-Biomass-Battery
• Usage of HOMER software to arrive at a couple of close alternate scenarios
• Feedback from WBREDA with experience in Sundarbans to finalize plant configuration

Plant sizing with HOMER
• Software developed by NREL,USA• to evaluate the economic and technical
feasibility of a number of technology options
• Energy balance calculations performed on hourly basis
• results in the least cost combination of components that meet electrical loads by simulating a large number of system configurations.
HOMER Version 2.19 (June 2005)

A glimpse

Example-Bally
Total No. of
Shops
Total No. of estimated consumer
s
Estimated annual
average electricity demand
Estimated peak load
Estimated load
factor
80 480 417 kWh/day 59.4 kW 0.293

Power Plant Configuration
Type of proposed
plant
Electricity generating
components
Battery bank
Power condition-ing unit
Estimated Annual
electricityDelivery(kWh/yr)
Initial capital
cost (INR)
PV-Biomass hybrid
45 kWp PV + 40 kWe biomass
electricity generator
(100% producer
gas)
240 nos.
2VDC, 800 AH battery
60 kW
Inverter 142129 24849,
675

Bally-Contribution from different RE sources
PV 78,418 kWh (48%)
Biomass 85,397 kWh (52%)
PV Biomass

Proposed Measures• 35 proposed hybrid power plants• All 131 villages in 20 islands covered• Households covered -11275• Shops covered-3200• PV: 1.59 MWp• Biomass: 1.12 MWe• Wind: 20 KW• SHS(37Wp): 38934 for scattered houses • Capital cost involved-(INR)1316 million

Thank You
Top Related