Ensuring ecosystem integrity in Indian Sundarbans
26
Ensuring ecosystem integrity in Indian Sundarbans © Debmalya Roy Choudhury / WWF-India Digital Artifact
-
Upload
aranyermajhe -
Category
Environment
-
view
38 -
download
1
Transcript of Ensuring ecosystem integrity in Indian Sundarbans

Ensuring ecosystem integrity in Indian Sundarbans
© D
ebm
aly
a R
oy
Ch
oudh
ury
/ W
WF
-Ind
ia
Digital Artifact

Presentation title cango here
Secondary information
XX-XX Month, Year
Additional information can run
Underneath if neccessary
Topic can go here
A creek in Sundarban with mangrove
Mangroves are basically found in river deltas, lagoons and estuarine complexes.
Mangrove forests comprises of taxonomically diverse plant groups which are salt-tolerant trees, shrubs, ferns and palms.
© C
hira
njib
Cha
krab
orty
/ W
WF
-In
dia

Indian Sundarbans and protection regime

Ecological Significance of the Sundarbans
• Amongst the largest mangrove patches in the world
• Globally, 4.3% of mangroves are in the Sundarbans
• Rich biodiversity; flora, fauna, terrestrial and aquatic
• Only coastal tiger habitat with a large population of tigers
• World Heritage Site
• Biosphere Reserve

Endowed Ecosystem and Dependency
3% of faunal species in India
Mammals: 12%Aves: 19%
Reptiles:15%Fish:14%
Spiders:11%Polychaetes:11%Crustacea:10%
Directly supports about 1.3 million people
through subsistence activities

15 April 2023 - 6
Resource Base
• Nursery for the commercial fisheries of
Bay of Bengal.
• Annual marine fish catch amounts to
60, 000 tons a year.
• West Bengal contributes significantly to
the total marine fish landings in country.
• Pelagic species form the bulk of the
state’s total landing tonnage.
• 1000-1400 tons of mud crabs are
landed annually.
• 80% shrimp farming from the state and
second largest prawn producer after
Andhra Pradesh.
• 308685 kg honey valuing INR 16112084
was collected over a period of 14 years.

Vulnerability context in Sundarbans
• Climate change impacts
• High Population growth
• Development constraints
• High Eco resource dependence
• High Human wildlife conflict
• Recurring disasters and impact on humans
Population in Indian Sundarbans Delta
0
1000000
2000000
3000000
4000000
5000000
1981 1991 2001 2010(projected)
The externalities in which people exist

The Relative Comprehensiveness ofIPCC WG1 AR5
• The IPCC assess scientific, technical and socio-economic information concerning climate change, its potential effects and options for adaptation and mitigation.
• Fifth Assessment Report (AR5): AR5 provides a clear and up to date view of the current state of scientific knowledge relevant to climate change.
Global context: IPCC AR5- How warm will it get?
• Likely to exceed 1.5°C (and 2°C) for all new IPCC scenarios except the lowest (called RCP2.6)
• Warming will continue beyond 2100 under all RCP scenarios except RCP2.6
• Warming likely to exceed 4°C by 2100 for highest of new IPCC scenarios (RCP8.5)
• If carbon cycle feedbacks include range of warming is higher
• 2.5-5.6°C in 2081-2100 above 1986-2005 or 3.1-6.2°C above pre-industrial

15 April 2023 - 10
Global context: IPCC AR5- Sea level rise
• Global mean sea level will continue to rise during the 21st century– Under all RCP scenarios the rate of sea level rise will very
likely exceed that observed during 1971–2010
– 0.5 to 1m rise by 2100 projected for highest IPCC scenario (RCP8.5)
– 0.26 to 0.55m rise by 2100 projected for lowest IPCC scenario (RCP2.6)

• Among the eight key threats identified with high confidence by the IPCC in WGII AR5, five pose clear and present danger. Each of these key risks contributes to one or more RFCs (reasons for concern),
Situation analysis in Sundarbans
i. Risk of death, injury, ill-health, or disrupted livelihoods in low-lying coastal zones and small island developing states and other small islands, due to storm surges, coastal flooding, and sea-level rise. [RFC 1-5]
ii. Systemic risks due to extreme weather events leading to breakdown of infrastructure networks and critical services such as electricity, water supply, and health and emergency services. [RFC 2-4]
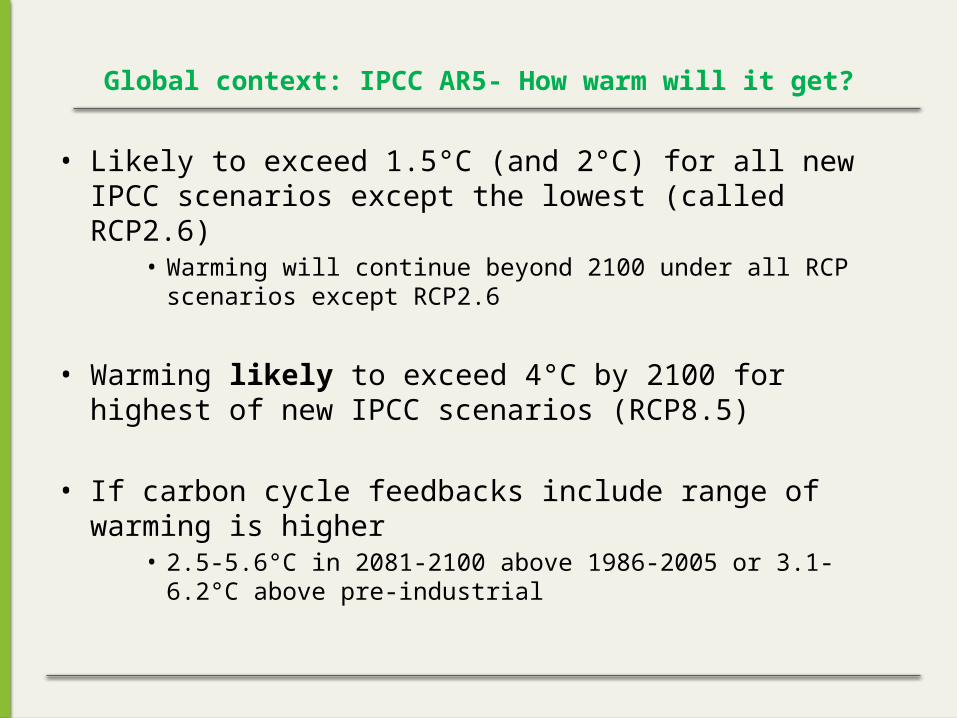
Situation analysis contd.
iii. Risk of food insecurity and the breakdown of food systems linked to warming, drought, flooding, and precipitation variability and extremes, particularly for poorer populations in urban and rural settings. [RFC 2-4]
iv. Risk of loss of rural livelihoods and income due to insufficient access to drinking and irrigation water and reduced agricultural productivity, particularly for farmers … with minimal capital. [RFC 2 and 3]
v. Risk of loss of marine and coastal ecosystems, biodiversity, and the ecosystem goods, functions, and services they provide for coastal livelihoods, especially for fishing communities. [RFC 1, 2, and 4]

15 April 2023 - 13
Vulnerability context / Climate Change Impacts in Sundarbans
• Sea level rise 1990-2000: 3.14 mm/year
• Sea level rise 2000-2009: 8 mm/year
• Net land loss 2000-2009: 65 sq.km
• 26% rise in frequency of high to very high intensity cyclones:1881-2001

Vulnerability context / Ecological Threats in Sundarbans: Ocean acidification
1. Sea surface temperature: Rising trend at a
rate of 0.0453 °C/Yr, almost doubled the rate
observed (0.019 °C/Yr) during the period
1985-2000.
2. Ongoing decrease in the pH of the
Earth's oceans, caused by their uptake
of anthropogenic carbon dioxide from
the atmosphere.
3. Acid-base imbalance.
4. Direct impact on Phytoplankton & Fish.
Birds: 75
Herpetofauna: 41
Crustacea: 288
Indirect Im
pact on

Negative reinforcement in Sundarbans
15 April 2023 - 15
To catch 1 tiger prawn seed: collectors destroy
161 juveniles of other prawns,
7 fishes30 crabs
1 molluscs 8 unidentified
meroplanktons
Destructive prawn seed collection

Offences registered in connection with natural
resource extraction
Sl No. Registered Offence 00-01 01-02 02-03 03-04 04-05 05-06 06-07 07-08 08-09 09-10 10-11 11-12
1Prosecution Offence Reports (in Nos)
24 14 15 22 12 14 14 13 4 11 16 6
2Compound Offence Reports (in Nos)
361 384 640 679 983 1462 2427 2086 1490 1684 1957 2221
3Unidentified Offence Reports (in Nos)
106 177 189 173 149 150 121 82 91 69 72 81
4Quantity of Timber Seized (Sawn and Log) m3
90.12 49.25 55.62 26.13 33.41 5.52 7.90 5.11 3.13 0.5 nil225
Quintals of Fuel wood.
2000
-200
1
2001
-200
2
2002
-200
3
2003
-200
4
2004
-200
5
2005
-200
6
2006
-200
7
2007
-200
8
2008
-200
9
2009
-201
0
2010
-201
1
2011
-201
2
0
500
1000
1500
2000
2500
3000
COR (in Nos)
Negative reinforcement in Sundarbans

Downward spiral of environment in Sundarbans
• The state of West Bengal, India contributed just under 7% of the total marine landings in 2007
• Reduced: 5% in 2011-2012

Sundarbans Biodiversity: Threat matrix
ThreatsMicrobes
Algae
Phytoplanktons
Lichens
Mangrove
Non-Mangrove
Mollusca
Protozoa
Polychaetes
Crustacea
Xiphosurans
Insects
Mites
Spiders Fish Herpet
ofaunaAve
s
Mammals
Pollution
Prawn seed collection
Resource extraction within PA
Upstream Fresh water diversion and extraction
Lack of baseline data for sustainable utilization
Relative sea level rise & Net land loss
Ocean acidification due to increased CO2
High intensity events

Sundarbans: Business as usual scenario
Threat Category Ecosystems Large Fauna Small Fauna (including aquatic)
Vegetation Microbes
Sea Level Rise Loss of Coastal mangroves
Inward/Upland Migration
Local Extinctions Loss of vegetated habitats
Local Extinctions
Increased Atmospheric CO2
Fertilization effect -- Depletion in fish stocks
Changes in community structure and composition; reduced primary productivity
Life cycle changes/ local extinctions
Reduced freshwater inflow
Alteration of ecological patterns and processes
Aquatic fauna may change its range
Local Extinctions Changes in mangrove composition and distribution
--
Encroachment/ land use change
Loss of ecosystems Impact on breeding Restricted distribution; local extinctions
Loss of carbon sequestration potential
Local extinctions
High intensity events
Damage to ecosystems
Migration Migration Partial loss to vegetation
Population decline
Resource extraction
-- Disturbance Disturbance Partial damage to vegetated habitats
--
Wildlife harvesting -- Endangered populations
Local extinctions -- --
KeySevere ImpactModerate ImpactLow Impact

Food security threatened: Severe decrease in per capita calories availability
-
500
1,000
1,500
2,000
2,500
3,000
2010
2050 (no climate change)
2050 (with climate change)
Pro
du
cti
on
in
00
0,0
00
to
ns
P
er
ca
pit
a c
alo
rie
s a
va
ila
bil
ity
-21,4%
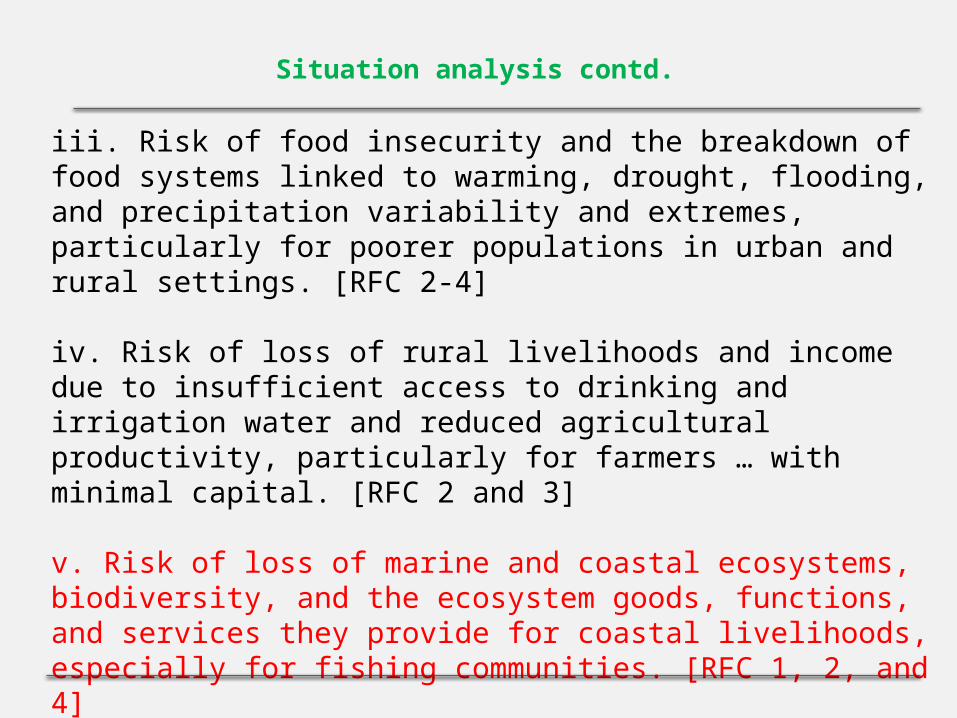
Identify Ecosystem Linkers and prepare Species Adaptation Plan for Sundarbans

Expanding the asset base
• Diversification of crops over space and time
• Intensive poultry and fishery management
• Water & Energy efficiency
• Access to energy
Agro ecosystem resilience

Expanding the asset base
• Introduce community-based mangrove restoration programs
• Value addition
• Improved access to material assets
• Improved capacity of households to turn assets into income
• Access to health and sanitation
Livelihood resilience

Expanding the asset base
• Links between producers and /or regional markets and capacities for marketing
• Introduce economic incentives based on carbon financing
• Alignment with national programs and policies
• Improved capacity to learn and innovate
• Effective information channels
Institutional resilience

Reference
• Turn Down The Heat: Why a 4oC World Must Be Avoided. Bill Hare, CEO of Climate Analytics, gGmbH, Berlin. http://www.slideshare.net/theclimateinstitute/turn-down-the-heat-why-a-4c-warmer-world-must-be-avoided?next_slideshow=1
• Key Findings of the IPCC WG1 AR5. Fredolin Tangang, IPCC WG1 Vice-Chair. https://www.ipcc.ch/pdf/presentations/ar5/wg1/WGIAR5_IPCC_Jakarta2.pdf
• World Bank. 2014. Building resilience for sustainable development of the sundarbans : strategy report. Washington, DC: World Bank Group. http://documents.worldbank.org/curated/en/2014/01/20162806/building-resilience-sustainable-development-sundarbans-strategy-report
• Rest data and photographs have been generated from the authors incumbency in Indian Sundarbans for last five years.

Thank you
© P
anka
j Kum
ar S
ark
ar/
WW
F-I
ndi
a