


Languages
Pages
Legal

Loss Reserving Approaches for
Mortgage Guaranty Insurance
2003 CAS Annual MeetingNew Orleans Marriott
John F. Gibson, FCAS, MAAAPrincipal
PricewaterhouseCoopers, LLP
2
Outline of Presentation
• Loss Reserving Distinctives• Factors that Influence Ultimate Losses• Data to Analyze• Contingency Reserves• Industry Loss Reserving Approach• Problems with Traditional Loss Development Methods• Loss Reserving Approaches• Current and Future Trends
3
Loss Reserving Distinctives
• Claim = Loan that has defaulted as of the statement date
• Not a reserve for the life of the loan
• Type and amount of coverage
• Amounts paid can exceed theoretical coverage
4
Factors that Influence Ultimate Losses
• Housing Values
• Unemployment
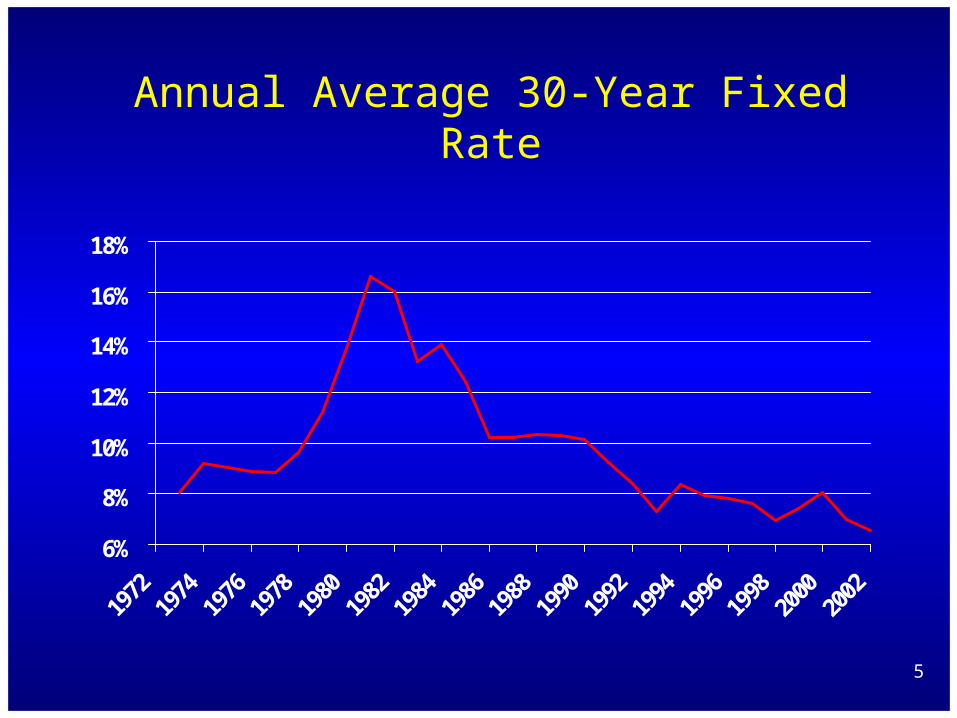
• Interest Rates
• Claim Settlement Practices
5
Annual Average 30-Year Fixed Rate
6%
8%
10%
12%
14%
16%
18%
6
Data to Analyze
• Analysis by region or state
• Analysis by type of loan – LTV
• Analysis by size of loan
• Analysis by age of loan
• Analysis of Pool Insurance and other higher risk segments
7
Contingency Reserves – Need
•Premiums and losses have mismatched timing
•Losses realized when loans become delinquent
•But economic catastrophes can drive 100+% loss ratios for a number of consecutive years
•Mortgage insurers are monoline

8
Contingency Reserves - Determination
50% of premium each year is set aside into a contingency reserve and held for 10 years
Losses in excess of a 35% loss ratio in a calendar year can be removed on a FIFO basis
After 10 years, remaining funds, if any, can be moved to free surplus

9
Industry Loss Reserving Approach
• Identification of claims by status – for example:
1. Delinquent
2. Pending Foreclosure
3. Foreclosure
4. Claim Filed
• Severity Factor – Percentage of exposure to be paid – greater than 100% for filed claim

10
Industry Loss Reserving Approach
• IBNR Provision = % of reported
• Regional analysis
• Pool business analysis
• Recent runoff history very favorable

11
Recent Runoff History(in $ millions)
YearOriginal
Loss Reserve
Developed Reserves Thru ’02
Developed to Original
1997 1,152 621 (46%)
1998 1,260 504 (60%)
1999 1,307 530 (60%)
2000 1,337 642 (52%)
2001 1,477 1,098 (26%)

12
Problems with Traditional Loss Development Methods
• Leverage effect of economic cycle on number of defaults, cure rates and amounts paid can produce significant volatility
• Economic cycle operates on a calendar year, not an accident year
13
Loss Reserving ApproachProjection of Ultimate Reported Delinquencies
• Delinquencies are reported quickly – 85% at 12 months, more that 99% at 24 months
• Eliminates need for separate IBNR provision

14
Loss Reserving ApproachDelinquency Rate
2.0%
2.5%
3.0%
3.5%
4.0%
1999 2000 2001 2002 2003 2004

15
Loss Reserving ApproachProjections of Ultimate Claims Paid - Approaches
• Project directly – very volatile
• Project Closed Without Payment (Cured) claims and subtract from ultimate reported
• Bornhuetter – Ferguson method using a priori ratio of closed with payment (CWP) to loan balances
16
Loss Reserving ApproachDetermining Paid Claims by Payment Year
• Subtract cumulative CWP claims from ultimate CWP claim to derive remaining CWP claims by accident year
• Using CWP pattern, determine distribution of remaining CWP claim for each accident year to each payment year
• Sum for each payment year

17
Loss Reserving ApproachCure Rate
65%
70%
75%
80%
85%
90%
95%

18
Distribution of Outstanding Closed Claims with Payments to Closure Year
As of 12/31/02 Outstanding Closed Claims with Closure Year Accident Payments
Year at 12/31/02 2003 2004 2005 2006 2007 2008 2009 2010 2011 2012 2013 (1) (2) (3) (4) (5) (6) (7) (8) (9) (10) (11) (12)
1991 0 0 0 0 0 0 0 0 0 0 0 0 1992 0 0 0 0 0 0 0 0 0 0 0 0 1993 1 1 0 0 0 0 0 0 0 0 0 0 1994 6 3 3 0 0 0 0 0 0 0 0 0 1995 13 4 4 4 0 0 0 0 0 0 0 0 1996 25 13 4 4 4 0 0 0 0 0 0 0 1997 31 14 8 3 3 3 0 0 0 0 0 0 1998 57 31 12 7 2 2 2 0 0 0 0 0 1999 67 30 20 8 5 2 2 2 0 0 0 0 2000 192 113 36 23 9 5 2 2 2 0 0 0 2001 1,258 916 201 64 42 16 10 3 3 3 0 0 2002 3,831 2,215 1,177 258 82 53 21 12 4 4 4 0
Total 5,481 3,341 1,466 372 146 81 36 19 9 7 4 0
Closed Claim With Months Developed Payment Pattern 12 24 36 48 60 72 84 96 108 120 132
(13) Cumulative 6.6% 60.6% 89.3% 95.6% 97.6% 98.9% 99.4% 99.7% 99.8% 99.9% 100.0% (14) Incremental 6.6% 54.0% 28.7% 6.3% 2.0% 1.3% 0.5% 0.3% 0.1% 0.1% 0.1%
19
Loss Reserving ApproachDetermination of Severity
• Review calendar year severity – has been declining since 1996
• Determine selected average loss payment for future calendar years
– Trend of prior years– Relate to average coverage amounts – Balance recent favorable results with
leveraged effect of economic change

20
0
5,000
10,000
15,000
20,000
25,000
Loss Reserving ApproachAverage Paid Severity by Calendar Year

21
Loss Reserving ApproachReserve Estimates
• Loss reserve by payment year is projected claims to be closed by payment year times projected loss payment by payment year
• Supplement with traditional loss development methods

22
Loss Reserving ApproachDetermination of Reserve Range
• Based on conservative and optimistic assumptions for defaults, cure rates and severity
• Reserve range is much wider than most P&C lines of business

23
Current & Future Trends
• Impact of the Economic Cycle
• Refinance Cycle
• House Price Appreciation
• Deterioration of Credit Quality
Top Related