
Loss Reserving Approaches for Mortgage Guaranty Insurance
23
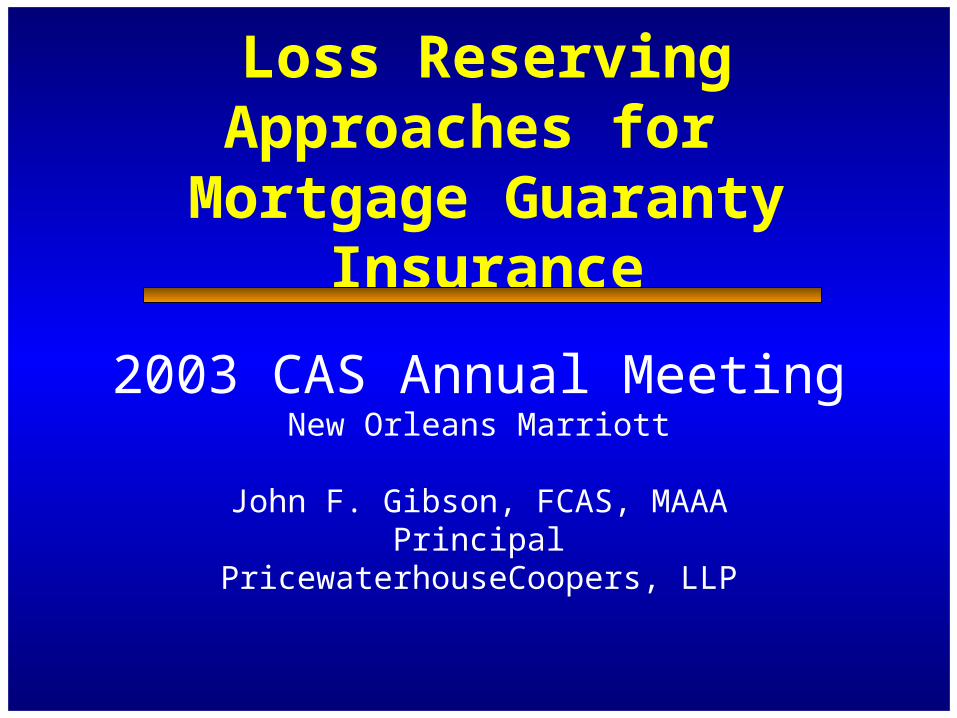
Loss Reserving Approaches for Mortgage Guaranty Insurance 2003 CAS Annual Meeting New Orleans Marriott John F. Gibson, FCAS, MAAA Principal PricewaterhouseCoopers, LLP
-
Upload
melinda-chapman -
Category
Documents
-
view
24 -
download
4
description
Loss Reserving Approaches for Mortgage Guaranty Insurance. 2003 CAS Annual Meeting New Orleans Marriott John F. Gibson, FCAS, MAAA Principal PricewaterhouseCoopers, LLP. Outline of Presentation. Loss Reserving Distinctives Factors that Influence Ultimate Losses Data to Analyze - PowerPoint PPT Presentation
Transcript of Loss Reserving Approaches for Mortgage Guaranty Insurance
Loss Reserving Approaches for
Mortgage Guaranty Insurance
2003 CAS Annual MeetingNew Orleans Marriott
John F. Gibson, FCAS, MAAAPrincipal
PricewaterhouseCoopers, LLP
2
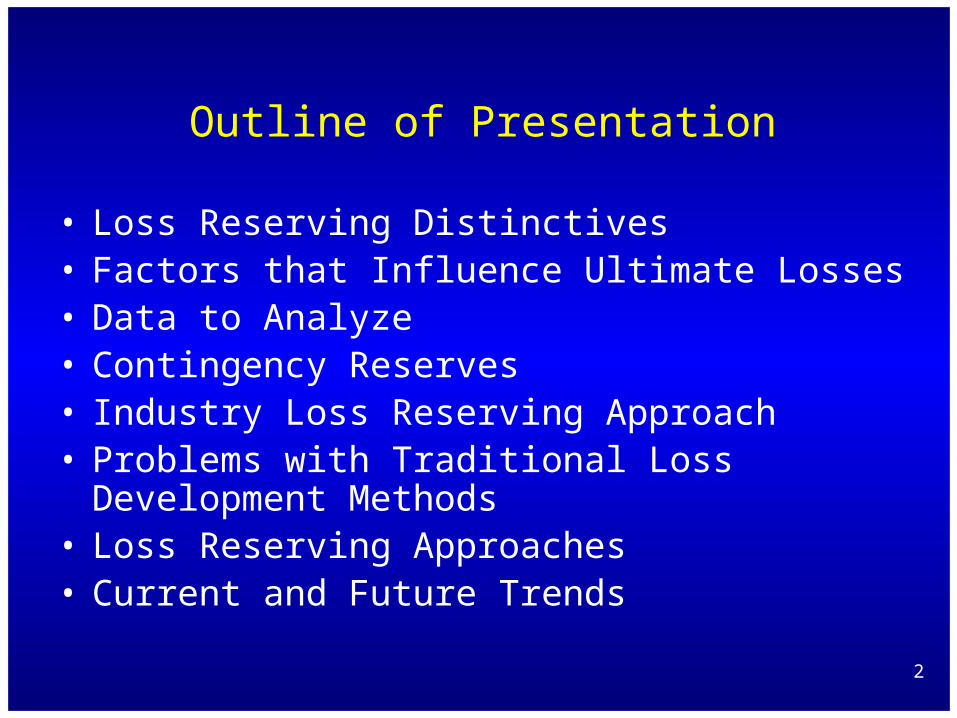
Outline of Presentation
• Loss Reserving Distinctives• Factors that Influence Ultimate Losses• Data to Analyze• Contingency Reserves• Industry Loss Reserving Approach• Problems with Traditional Loss Development Methods• Loss Reserving Approaches• Current and Future Trends
3
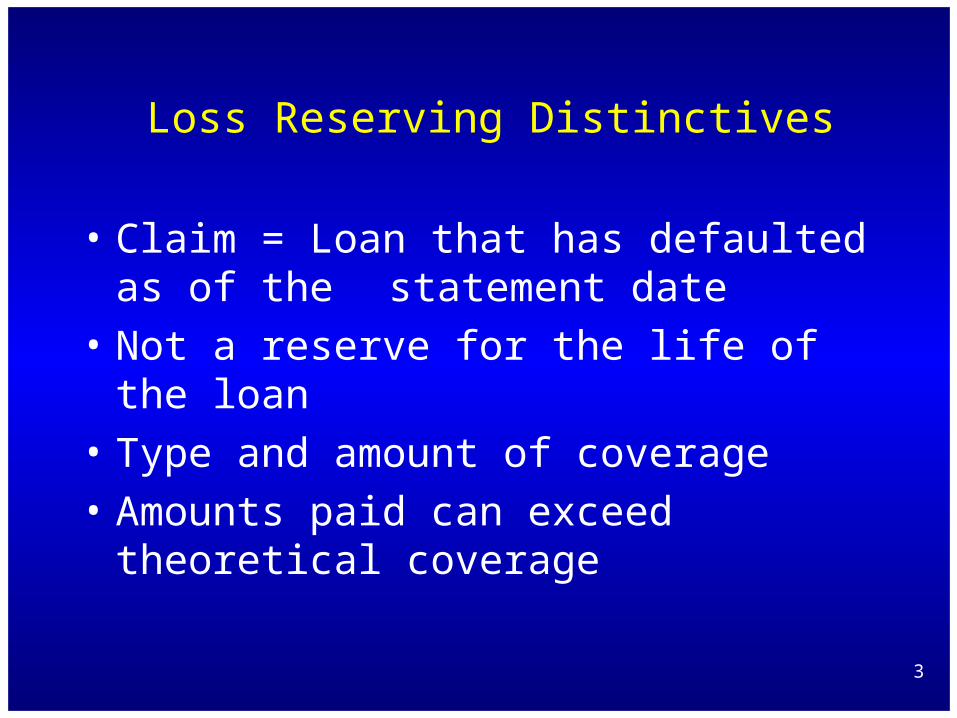
Loss Reserving Distinctives
• Claim = Loan that has defaulted as of the statement date
• Not a reserve for the life of the loan
• Type and amount of coverage
• Amounts paid can exceed theoretical coverage
4
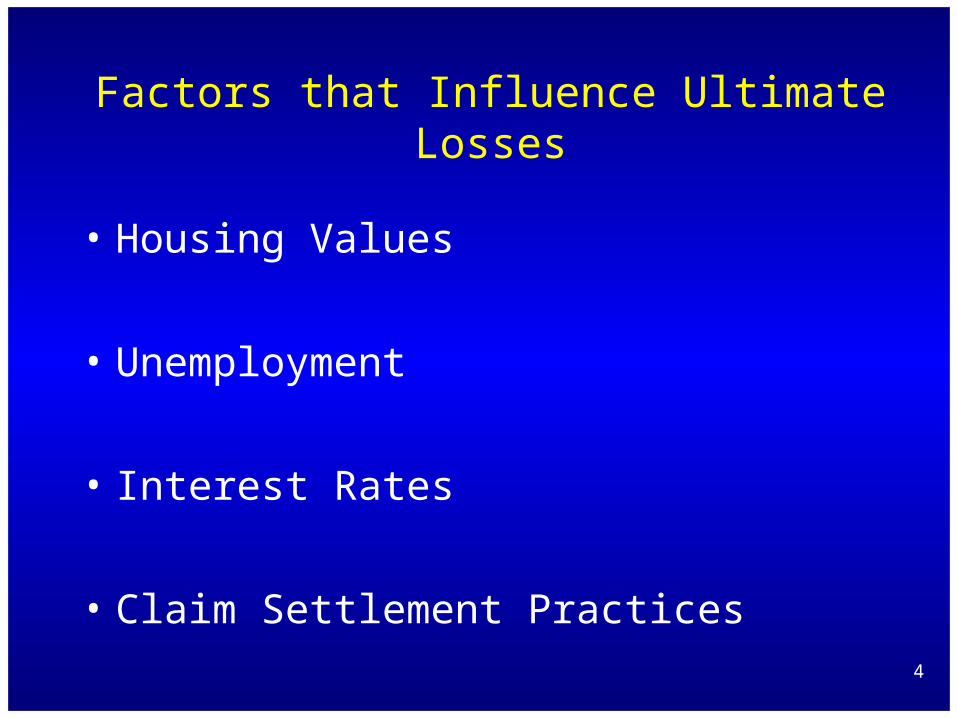
Factors that Influence Ultimate Losses
• Housing Values
• Unemployment
• Interest Rates
• Claim Settlement Practices
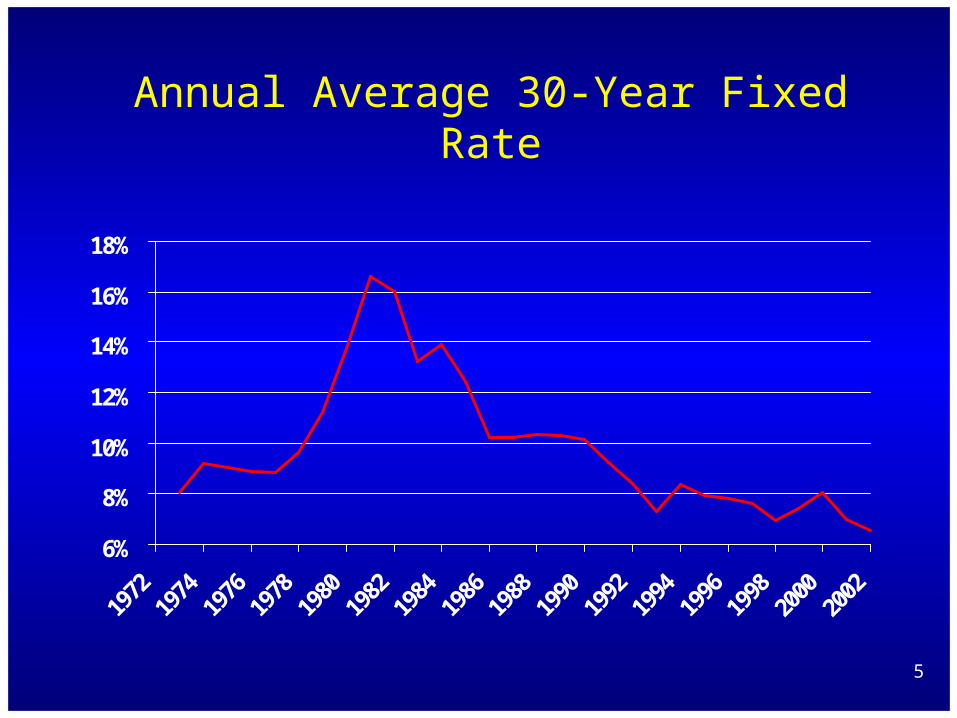
5
Annual Average 30-Year Fixed Rate
6%
8%
10%
12%
14%
16%
18%
6
Data to Analyze
• Analysis by region or state
• Analysis by type of loan – LTV
• Analysis by size of loan
• Analysis by age of loan
• Analysis of Pool Insurance and other higher risk segments
7
Contingency Reserves – Need
•Premiums and losses have mismatched timing
•Losses realized when loans become delinquent
•But economic catastrophes can drive 100+% loss ratios for a number of consecutive years
•Mortgage insurers are monoline

8
Contingency Reserves - Determination
50% of premium each year is set aside into a contingency reserve and held for 10 years
Losses in excess of a 35% loss ratio in a calendar year can be removed on a FIFO basis
After 10 years, remaining funds, if any, can be moved to free surplus

9
Industry Loss Reserving Approach
• Identification of claims by status – for example:
1. Delinquent
2. Pending Foreclosure
3. Foreclosure
4. Claim Filed
• Severity Factor – Percentage of exposure to be paid – greater than 100% for filed claim

10
Industry Loss Reserving Approach
• IBNR Provision = % of reported
• Regional analysis
• Pool business analysis
• Recent runoff history very favorable

11
Recent Runoff History(in $ millions)
YearOriginal
Loss Reserve
Developed Reserves Thru ’02
Developed to Original
1997 1,152 621 (46%)
1998 1,260 504 (60%)
1999 1,307 530 (60%)
2000 1,337 642 (52%)
2001 1,477 1,098 (26%)

12
Problems with Traditional Loss Development Methods
• Leverage effect of economic cycle on number of defaults, cure rates and amounts paid can produce significant volatility
• Economic cycle operates on a calendar year, not an accident year
13
Loss Reserving ApproachProjection of Ultimate Reported Delinquencies
• Delinquencies are reported quickly – 85% at 12 months, more that 99% at 24 months
• Eliminates need for separate IBNR provision

14
Loss Reserving ApproachDelinquency Rate
2.0%
2.5%
3.0%
3.5%
4.0%
1999 2000 2001 2002 2003 2004

15
Loss Reserving ApproachProjections of Ultimate Claims Paid - Approaches
• Project directly – very volatile
• Project Closed Without Payment (Cured) claims and subtract from ultimate reported
• Bornhuetter – Ferguson method using a priori ratio of closed with payment (CWP) to loan balances
16
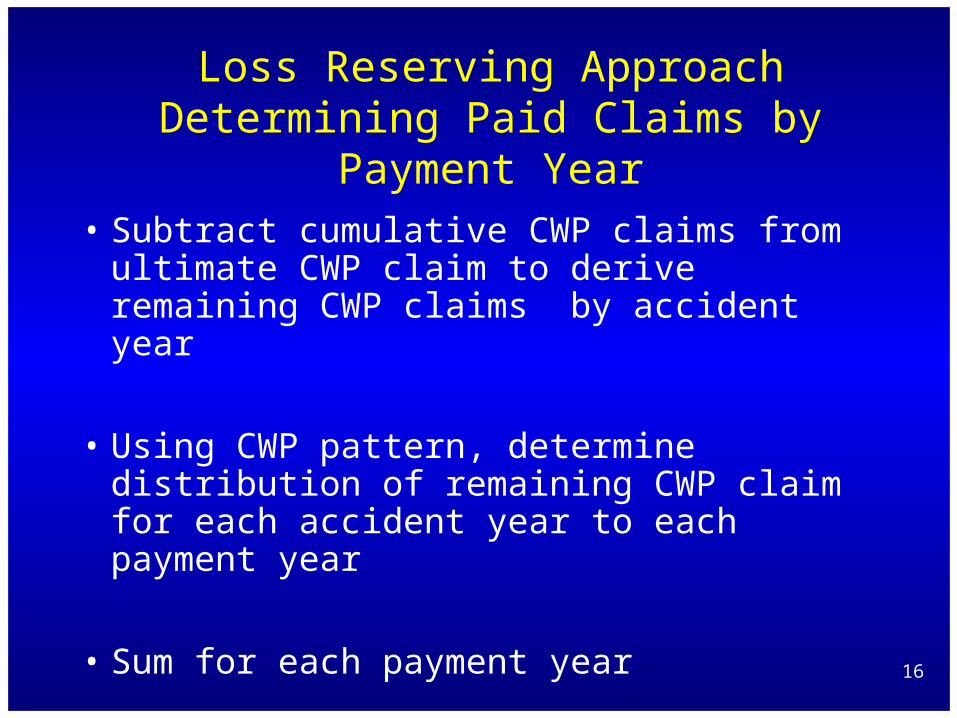
Loss Reserving ApproachDetermining Paid Claims by Payment Year
• Subtract cumulative CWP claims from ultimate CWP claim to derive remaining CWP claims by accident year
• Using CWP pattern, determine distribution of remaining CWP claim for each accident year to each payment year
• Sum for each payment year

17
Loss Reserving ApproachCure Rate
65%
70%
75%
80%
85%
90%
95%

18
Distribution of Outstanding Closed Claims with Payments to Closure Year
As of 12/31/02 Outstanding Closed Claims with Closure Year Accident Payments
Year at 12/31/02 2003 2004 2005 2006 2007 2008 2009 2010 2011 2012 2013 (1) (2) (3) (4) (5) (6) (7) (8) (9) (10) (11) (12)
1991 0 0 0 0 0 0 0 0 0 0 0 0 1992 0 0 0 0 0 0 0 0 0 0 0 0 1993 1 1 0 0 0 0 0 0 0 0 0 0 1994 6 3 3 0 0 0 0 0 0 0 0 0 1995 13 4 4 4 0 0 0 0 0 0 0 0 1996 25 13 4 4 4 0 0 0 0 0 0 0 1997 31 14 8 3 3 3 0 0 0 0 0 0 1998 57 31 12 7 2 2 2 0 0 0 0 0 1999 67 30 20 8 5 2 2 2 0 0 0 0 2000 192 113 36 23 9 5 2 2 2 0 0 0 2001 1,258 916 201 64 42 16 10 3 3 3 0 0 2002 3,831 2,215 1,177 258 82 53 21 12 4 4 4 0
Total 5,481 3,341 1,466 372 146 81 36 19 9 7 4 0
Closed Claim With Months Developed Payment Pattern 12 24 36 48 60 72 84 96 108 120 132
(13) Cumulative 6.6% 60.6% 89.3% 95.6% 97.6% 98.9% 99.4% 99.7% 99.8% 99.9% 100.0% (14) Incremental 6.6% 54.0% 28.7% 6.3% 2.0% 1.3% 0.5% 0.3% 0.1% 0.1% 0.1%
19
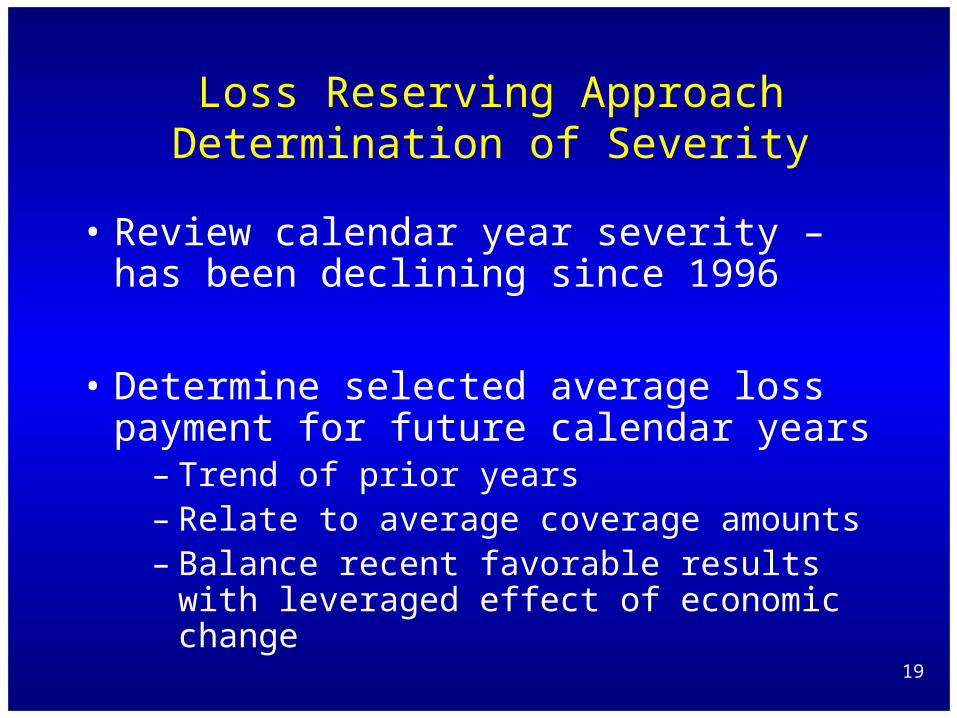
Loss Reserving ApproachDetermination of Severity
• Review calendar year severity – has been declining since 1996
• Determine selected average loss payment for future calendar years
– Trend of prior years– Relate to average coverage amounts – Balance recent favorable results with
leveraged effect of economic change

20
0
5,000
10,000
15,000
20,000
25,000
Loss Reserving ApproachAverage Paid Severity by Calendar Year

21
Loss Reserving ApproachReserve Estimates
• Loss reserve by payment year is projected claims to be closed by payment year times projected loss payment by payment year
• Supplement with traditional loss development methods

22
Loss Reserving ApproachDetermination of Reserve Range
• Based on conservative and optimistic assumptions for defaults, cure rates and severity
• Reserve range is much wider than most P&C lines of business

23
Current & Future Trends
• Impact of the Economic Cycle
• Refinance Cycle
• House Price Appreciation
• Deterioration of Credit Quality


![mortgage guaranty insurance - Model #630 - Clean...reverse mortgage loans made pursuant to [insert citation of state law that authorizes reverse mortgages] of the real property law,](https://static.fdocuments.in/doc/165x107/600c6d0f1b02c843972106ff/mortgage-guaranty-insurance-model-630-clean-reverse-mortgage-loans-made.jpg)

![mortgage guaranty insurance - naic.org · reverse mortgage loans made pursuant to [insert citation of state law that authorizes reverse mortgages] of the real property law, evidencing](https://static.fdocuments.in/doc/165x107/601ac3be2d8f6f36f30b0358/mortgage-guaranty-insurance-naicorg-reverse-mortgage-loans-made-pursuant-to-insert.jpg)