


Languages
Pages
Legal

Load Analysis and Predictionfor
Responsive Interactive Applications
Peter A. Dinda
David R. O’Hallaron
Carnegie Mellon University
2
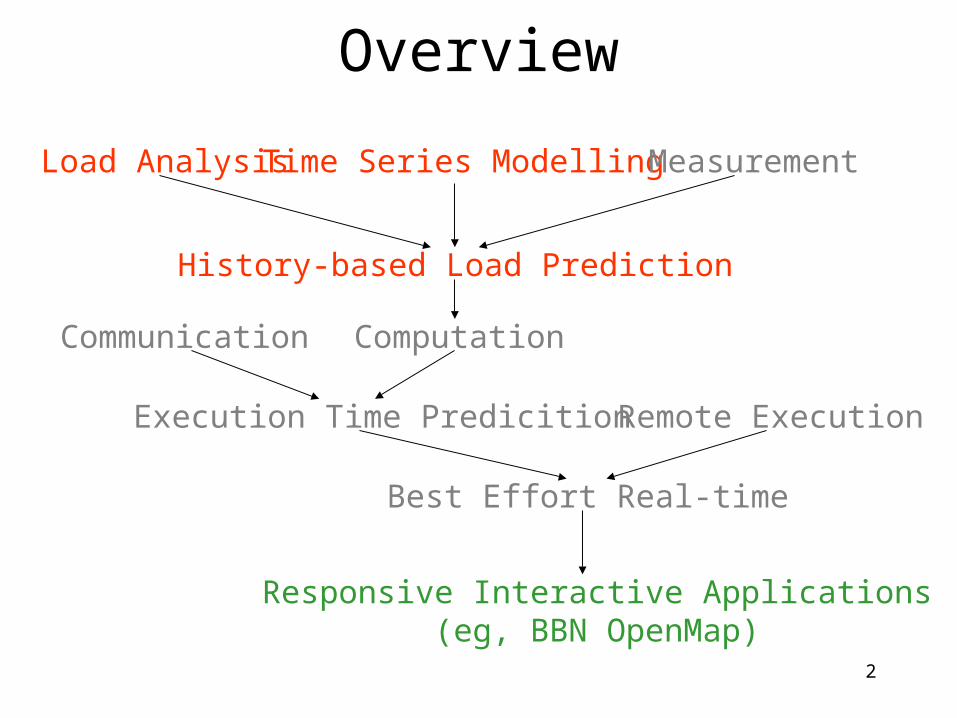
Overview
Responsive Interactive Applications(eg, BBN OpenMap)
Best Effort Real-time
Communication
Execution Time Predicition
Computation
History-based Load Prediction
Load Analysis Time Series Modelling
Remote Execution
Measurement
3
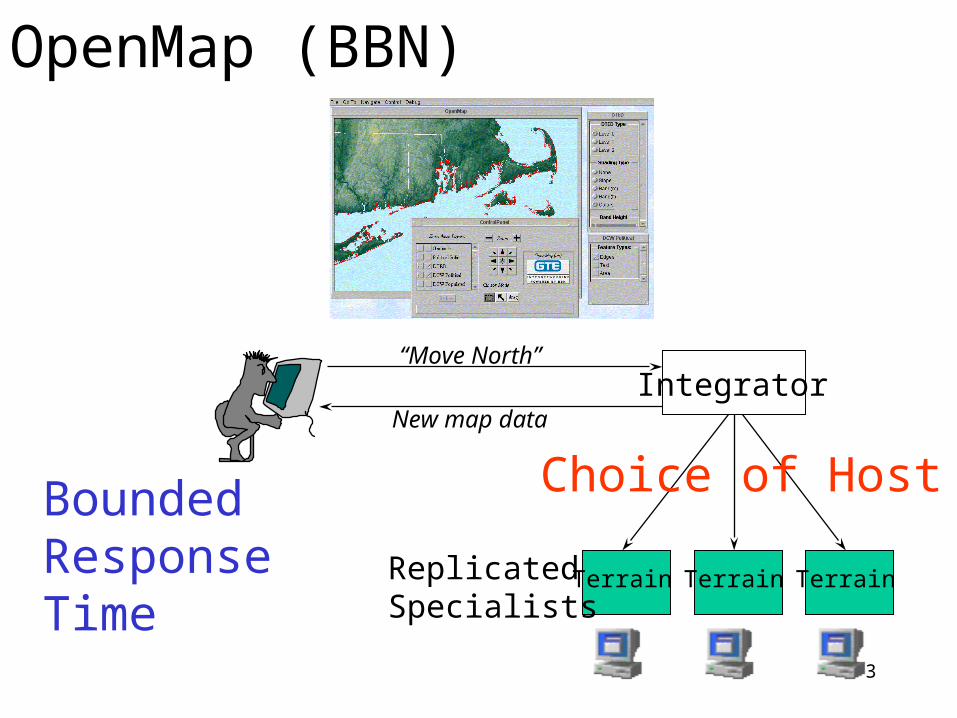
OpenMap (BBN)
“Move North”
New map dataIntegrator
Choice of Host
Terrain TerrainTerrain
BoundedResponseTime
ReplicatedSpecialists
4
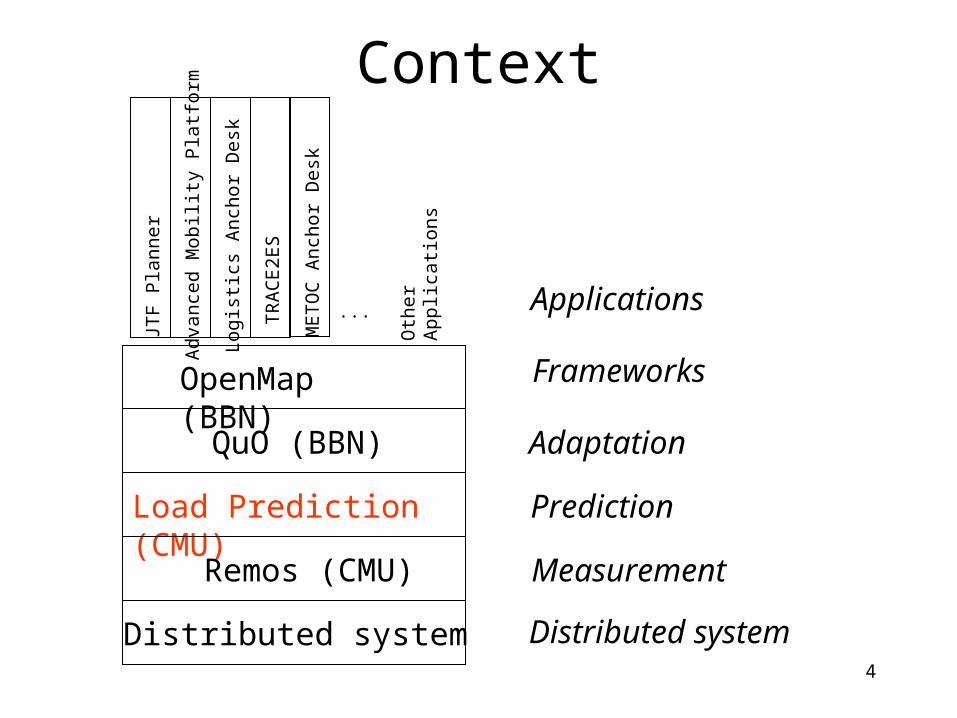
Context
OpenMap (BBN)
Load Prediction (CMU)
QuO (BBN)
Remos (CMU)
JTF
Pla
nne
r
Adv
ance
d M
obili
ty P
latf
orm
Log
istic
s A
nch
or D
esk
ME
TO
C A
ncho
r D
esk
TR
AC
E2E
S
... Oth
erA
pplic
atio
ns
Frameworks
Adaptation
Measurement
Prediction
Applications
Distributed system Distributed system
5
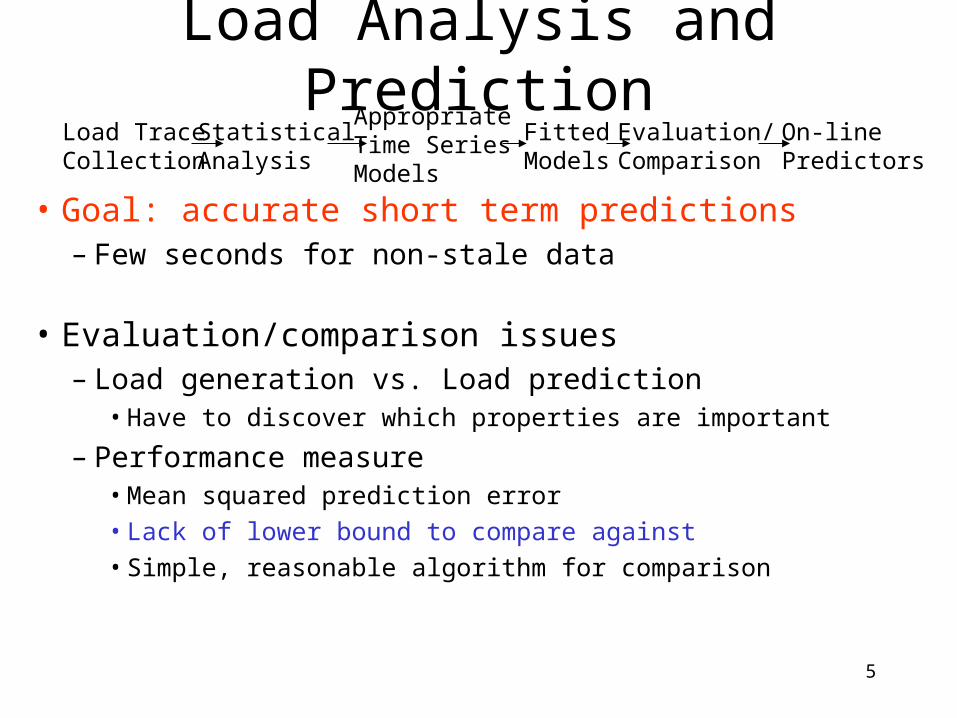
StatisticalAnalysis
AppropriateTime SeriesModels
FittedModels
Evaluation/Comparison
On-linePredictors
Load TraceCollection
Load Analysis and Prediction
• Goal: accurate short term predictions– Few seconds for non-stale data
• Evaluation/comparison issues– Load generation vs. Load prediction
• Have to discover which properties are important
– Performance measure• Mean squared prediction error• Lack of lower bound to compare against• Simple, reasonable algorithm for comparison
6
Load Trace Analysis• Digital Unix one minute load average• Four classes of hosts (38 machines)• 1 Hz sample rate, >one week traces, two sets at
different times of the year• Analysis results to appear in LCR98
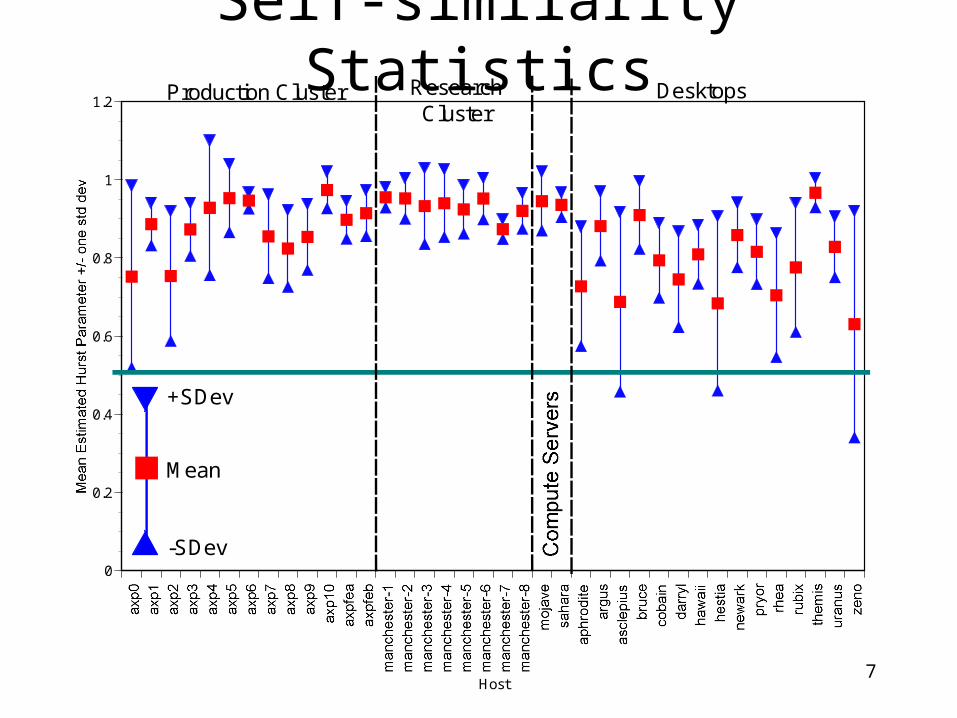
• Load is self-similar• Load exhibits epochal behavior
7
Self-similarity Statistics
0
0.2
0.4
0.6
0.8
1
1.2
Host
Production Cluster ResearchCluster
Desktops
+SDev
-SDev
Mean
8
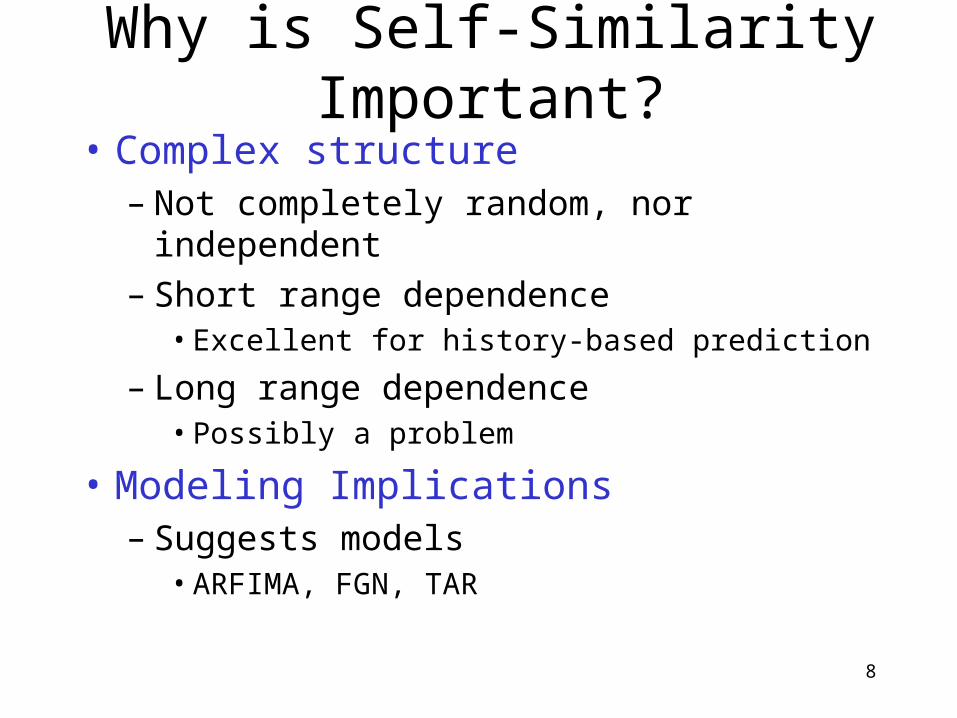
Why is Self-Similarity Important?
• Complex structure– Not completely random, nor independent– Short range dependence
• Excellent for history-based prediction
– Long range dependence• Possibly a problem
• Modeling Implications– Suggests models
• ARFIMA, FGN, TAR
9
Load Exhibits Epochal Behavior
Title:axp7_tue_19.epsCreator:MATLAB, The Mathworks, Inc.Preview:This EPS picture was not savedwith a preview included in it.Comment:This EPS picture will print to aPostScript printer, but not toother types of printers.
Title:axp7_19_day_time.epsCreator:MATLAB, The Mathworks, Inc.Preview:This EPS picture was not savedwith a preview included in it.Comment:This EPS picture will print to aPostScript printer, but not toother types of printers.
10
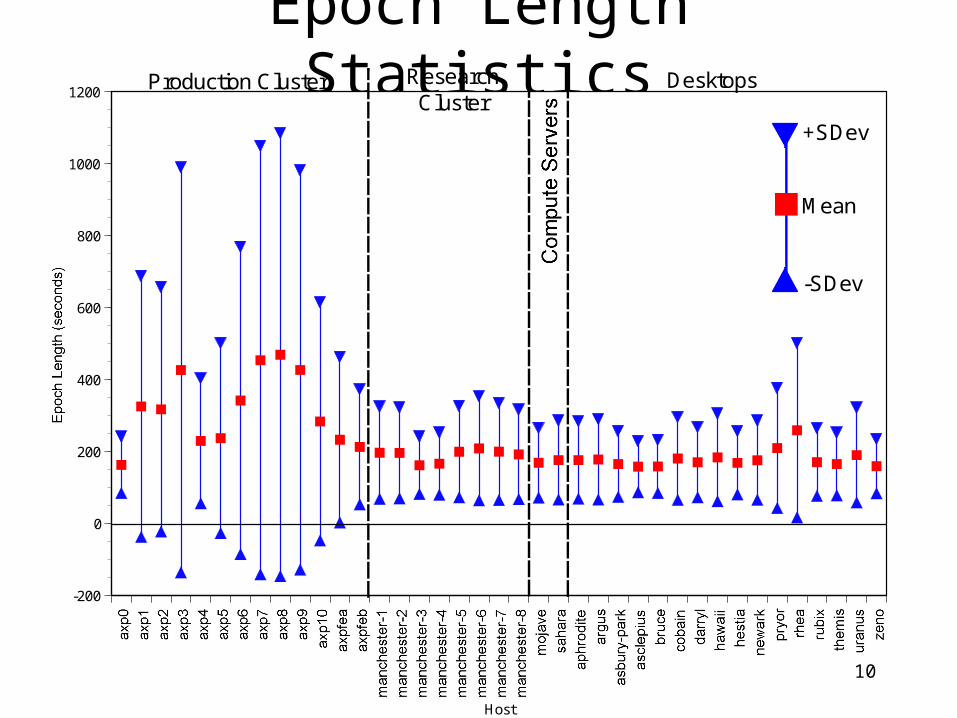
Epoch Length Statistics
-200
0
200
400
600
800
1000
1200
Host
+SDev
-SDev
Mean
Production Cluster ResearchCluster
Desktops

11
Why is Epochal Behavior Important?
• Complex structure – Non-stationary
• Modeling Implications– Suggests models
• ARIMA, ARFIMA, etc.• Non-parametric spectral methods
– Suggests problem decomposition
12
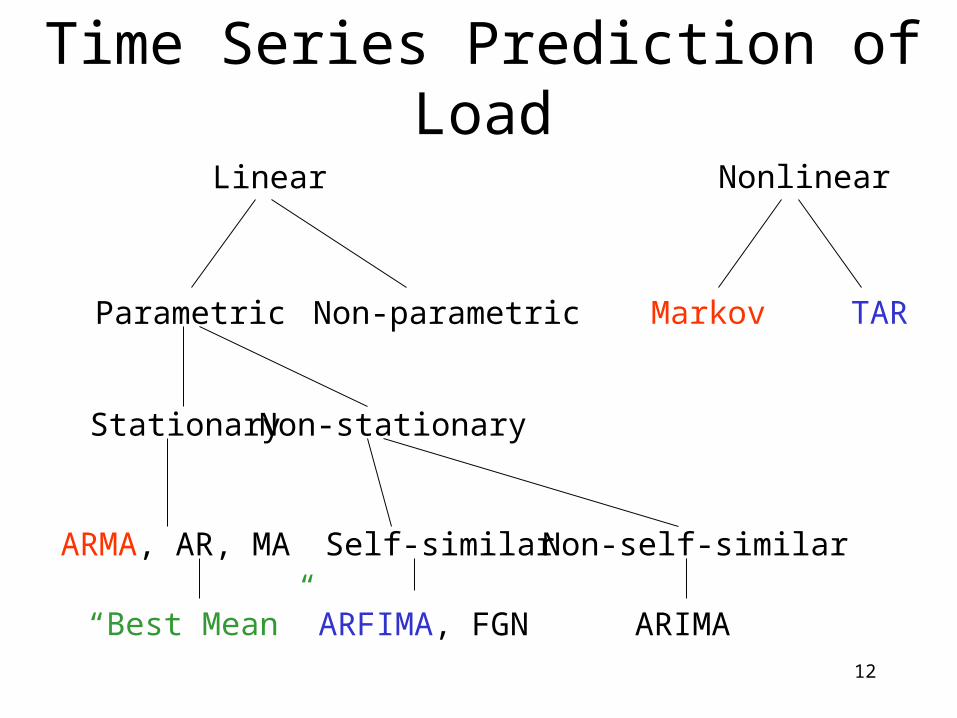
Time Series Prediction of Load
Linear Nonlinear
Stationary Non-stationary
ARMA, AR, MA
ARIMAARFIMA, FGN
TARMarkov
Self-similar Non-self-similar
“Best Mean”
Non-parametricParametric
13
-20
0
20
40
60
80
100
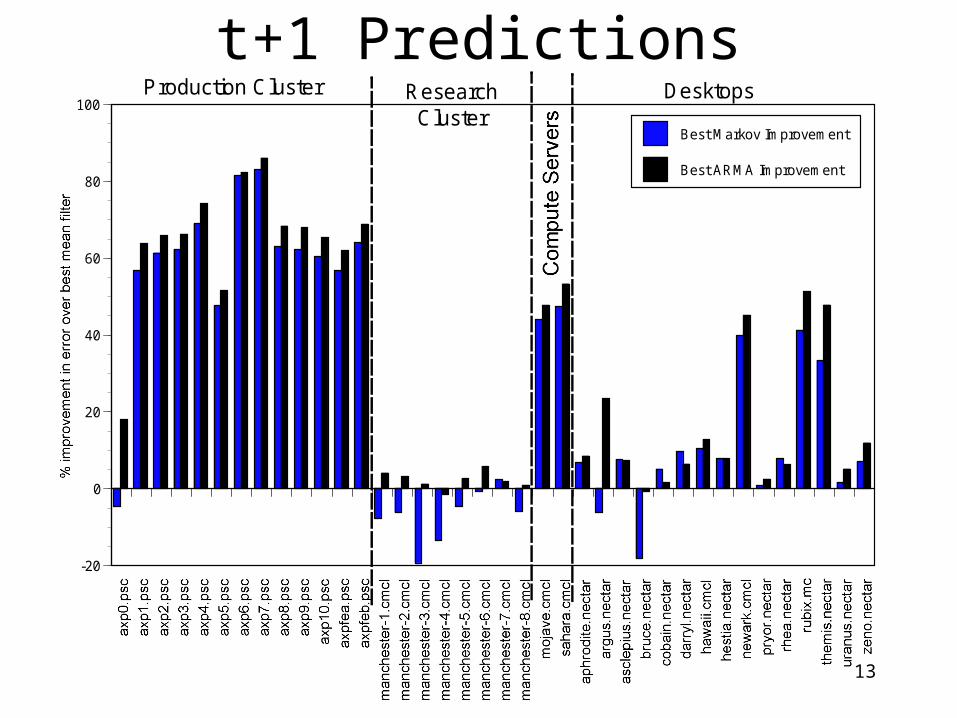
Best Markov Improvement
Best ARMA Improvement
Production Cluster ResearchCluster
Desktops
t+1 Predictions
14
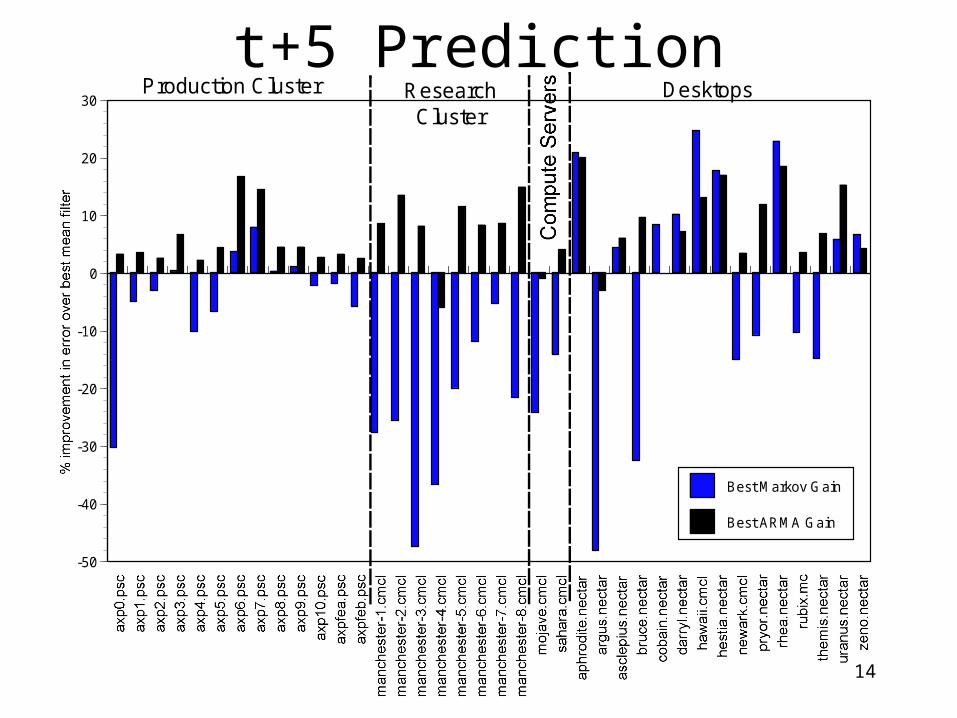
-50
-40
-30
-20
-10
0
10
20
30
Best Markov Gain
Best ARMA Gain
Production Cluster ResearchCluster
Desktops
t+5 Prediction
15
Conclusions
• Load has structure to exploit for prediction• Structure is complex (self-similarity, epochs)
• Simple time series models are promising• Benefits of more sophisticated models are unclear
• Current research questions• What are the benefits of more sophisticated models?• How to characterize prediction error to user?• Is there a measure of inherent predictability?• How to incorporate load prediction into systems?
16
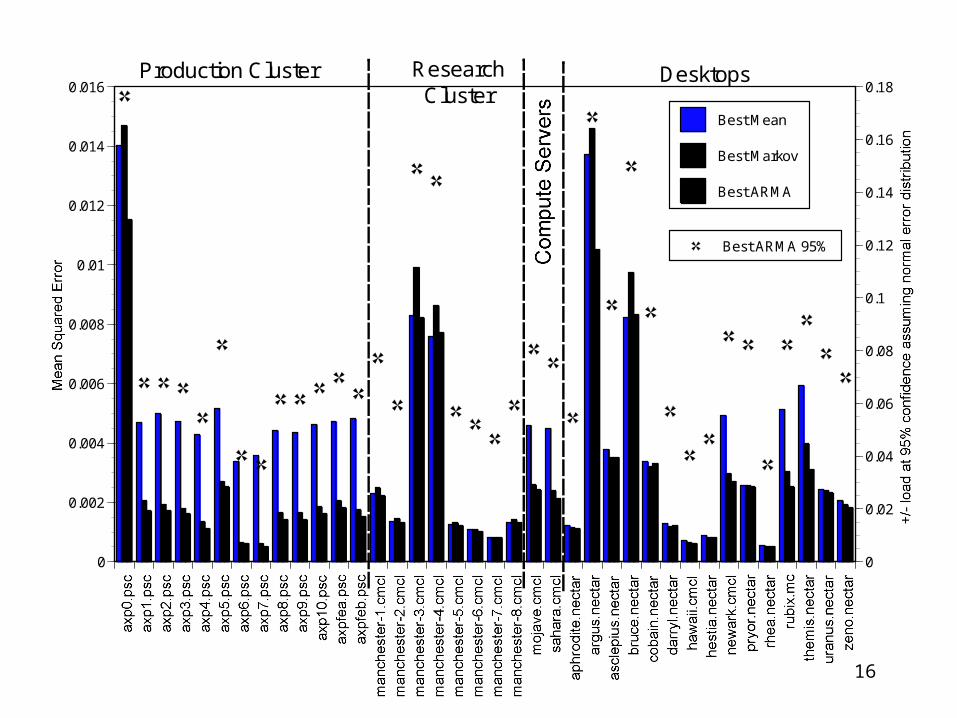
0
0.002
0.004
0.006
0.008
0.01
0.012
0.014
0.016
0
0.02
0.04
0.06
0.08
0.1
0.12
0.14
0.16
0.18
Best Mean
Best Markov
Best ARMA
Best ARMA 95%
Production Cluster ResearchCluster
Desktops
Top Related