Load Analysis and Prediction for Responsive Interactive Applications Peter A. Dinda David R....
16
Load Analysis and Prediction for Responsive Interactive Applications Peter A. Dinda David R. O’Hallaron Carnegie Mellon University
-
date post
22-Dec-2015 -
Category
Documents
-
view
239 -
download
2
Transcript of Load Analysis and Prediction for Responsive Interactive Applications Peter A. Dinda David R....
Load Analysis and Predictionfor
Responsive Interactive Applications
Peter A. Dinda
David R. O’Hallaron
Carnegie Mellon University
2
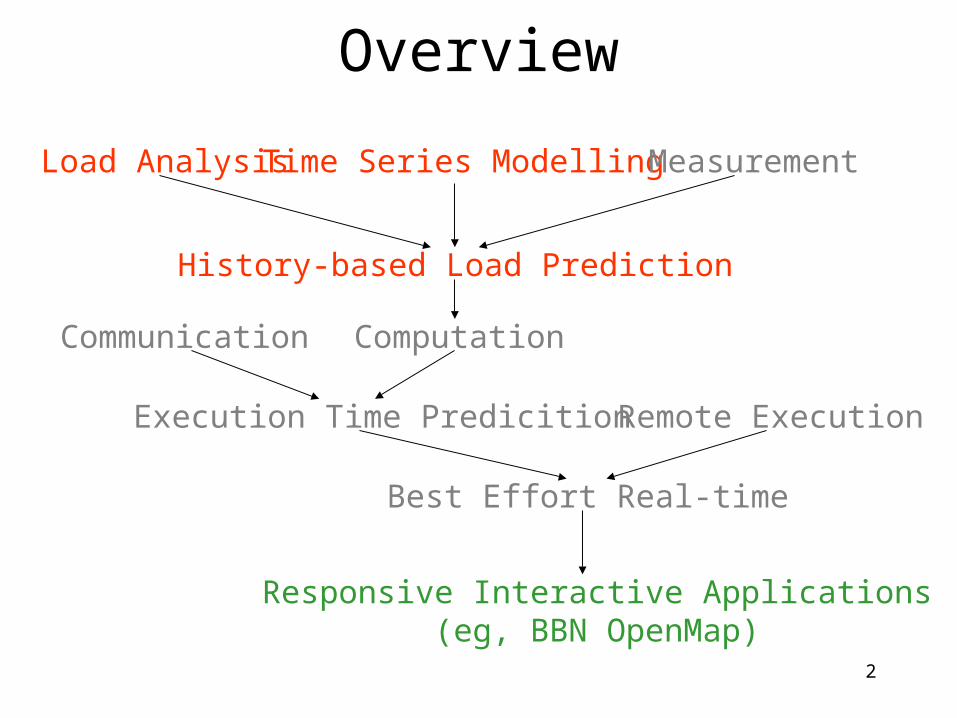
Overview
Responsive Interactive Applications(eg, BBN OpenMap)
Best Effort Real-time
Communication
Execution Time Predicition
Computation
History-based Load Prediction
Load Analysis Time Series Modelling
Remote Execution
Measurement
3
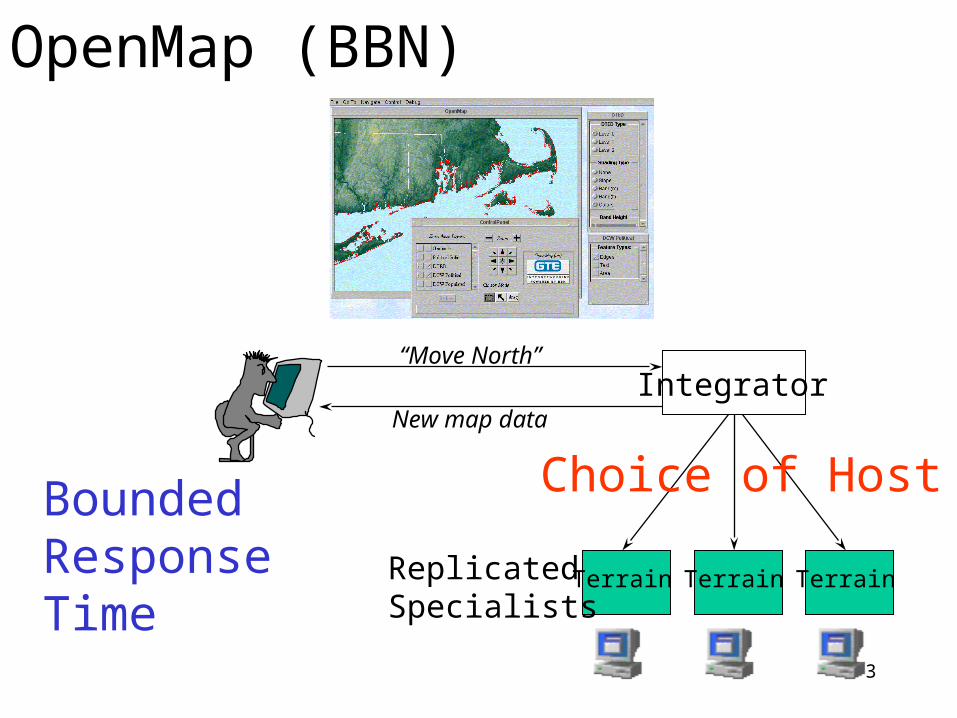
OpenMap (BBN)
“Move North”
New map dataIntegrator
Choice of Host
Terrain TerrainTerrain
BoundedResponseTime
ReplicatedSpecialists
4
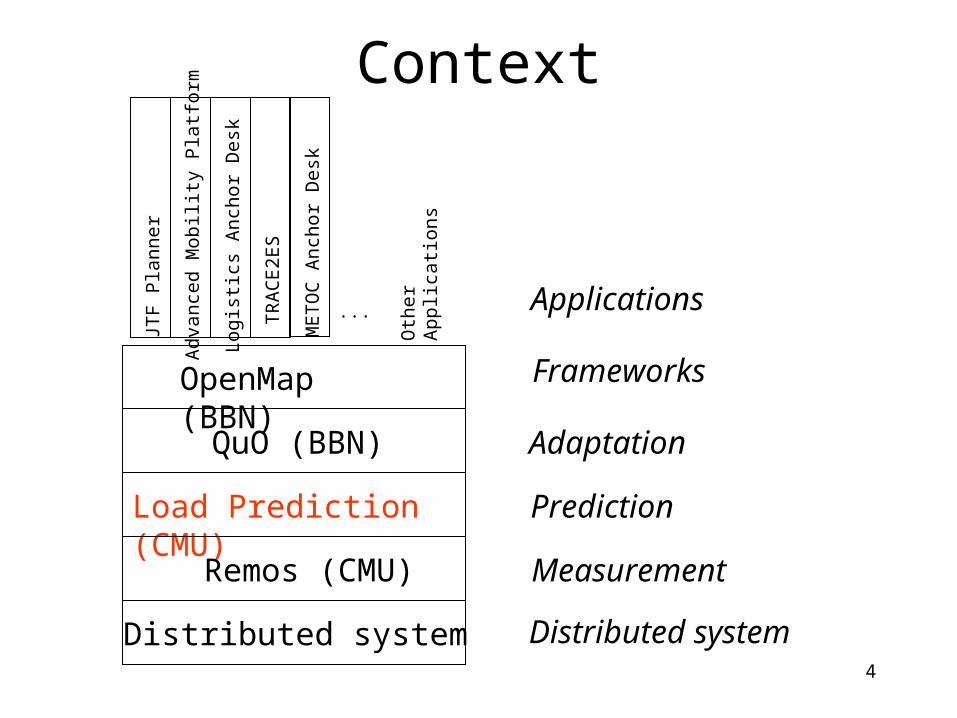
Context
OpenMap (BBN)
Load Prediction (CMU)
QuO (BBN)
Remos (CMU)
JTF
Pla
nne
r
Adv
ance
d M
obili
ty P
latf
orm
Log
istic
s A
nch
or D
esk
ME
TO
C A
ncho
r D
esk
TR
AC
E2E
S
... Oth
erA
pplic
atio
ns
Frameworks
Adaptation
Measurement
Prediction
Applications
Distributed system Distributed system
5
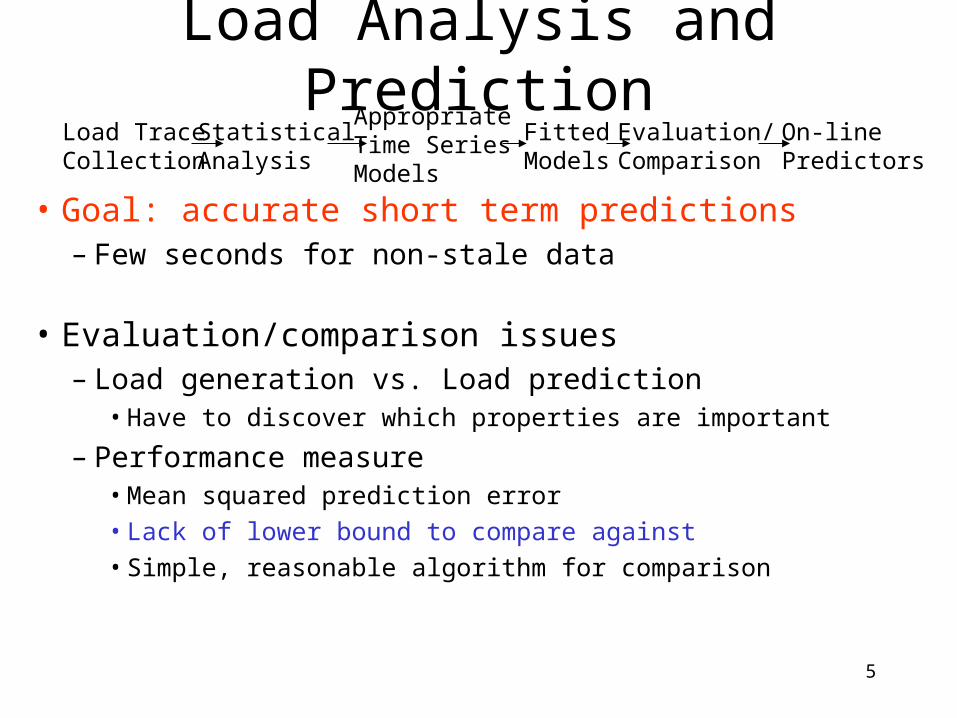
StatisticalAnalysis
AppropriateTime SeriesModels
FittedModels
Evaluation/Comparison
On-linePredictors
Load TraceCollection
Load Analysis and Prediction
• Goal: accurate short term predictions– Few seconds for non-stale data
• Evaluation/comparison issues– Load generation vs. Load prediction
• Have to discover which properties are important
– Performance measure• Mean squared prediction error• Lack of lower bound to compare against• Simple, reasonable algorithm for comparison
6
Load Trace Analysis• Digital Unix one minute load average• Four classes of hosts (38 machines)• 1 Hz sample rate, >one week traces, two sets at
different times of the year• Analysis results to appear in LCR98
• Load is self-similar• Load exhibits epochal behavior
7
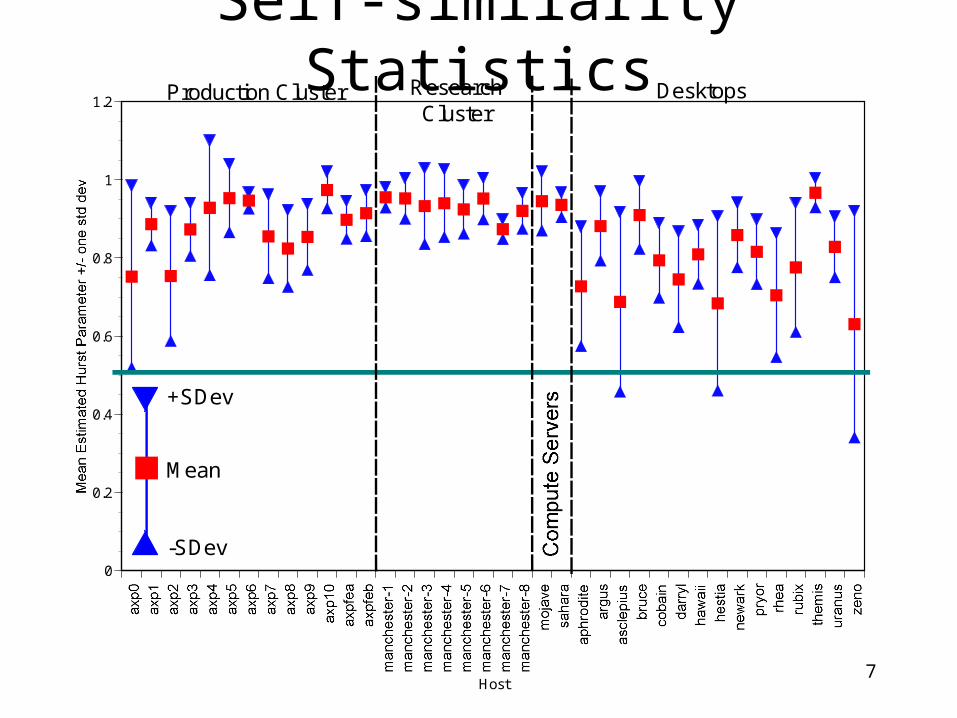
Self-similarity Statistics
0
0.2
0.4
0.6
0.8
1
1.2
Host
Production Cluster ResearchCluster
Desktops
+SDev
-SDev
Mean
8
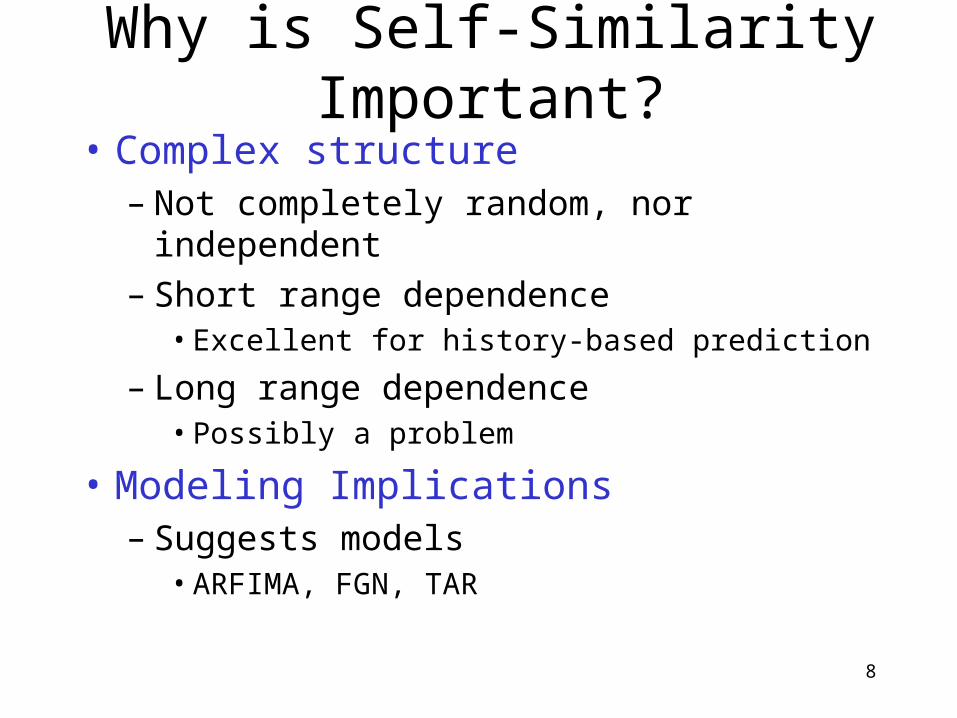
Why is Self-Similarity Important?
• Complex structure– Not completely random, nor independent– Short range dependence
• Excellent for history-based prediction
– Long range dependence• Possibly a problem
• Modeling Implications– Suggests models
• ARFIMA, FGN, TAR
9
Load Exhibits Epochal Behavior
Title:axp7_tue_19.epsCreator:MATLAB, The Mathworks, Inc.Preview:This EPS picture was not savedwith a preview included in it.Comment:This EPS picture will print to aPostScript printer, but not toother types of printers.
Title:axp7_19_day_time.epsCreator:MATLAB, The Mathworks, Inc.Preview:This EPS picture was not savedwith a preview included in it.Comment:This EPS picture will print to aPostScript printer, but not toother types of printers.
10
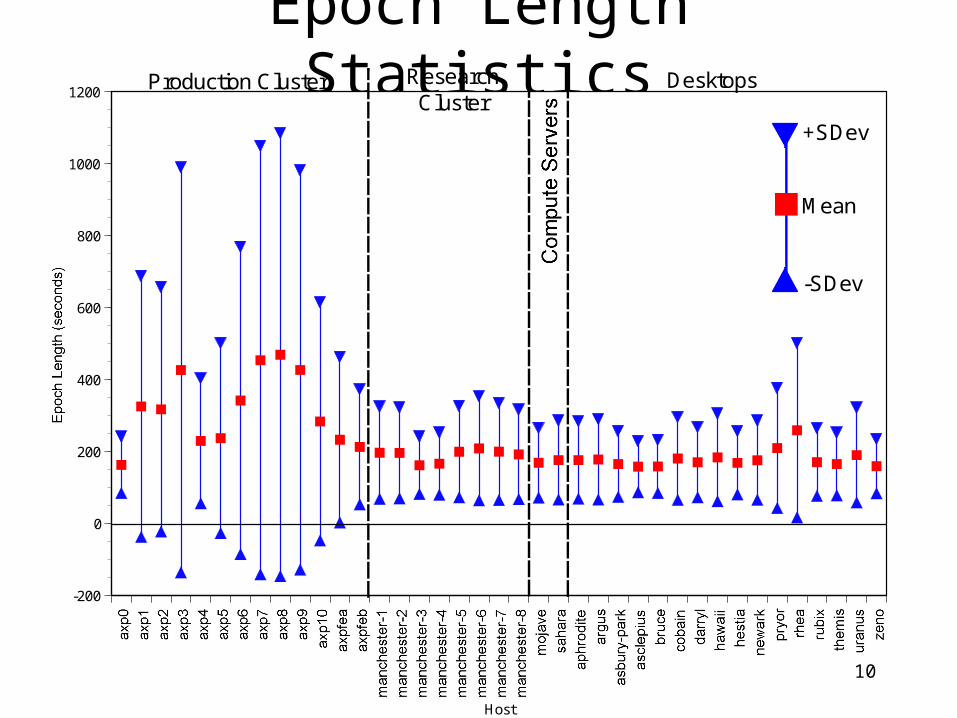
Epoch Length Statistics
-200
0
200
400
600
800
1000
1200
Host
+SDev
-SDev
Mean
Production Cluster ResearchCluster
Desktops
11
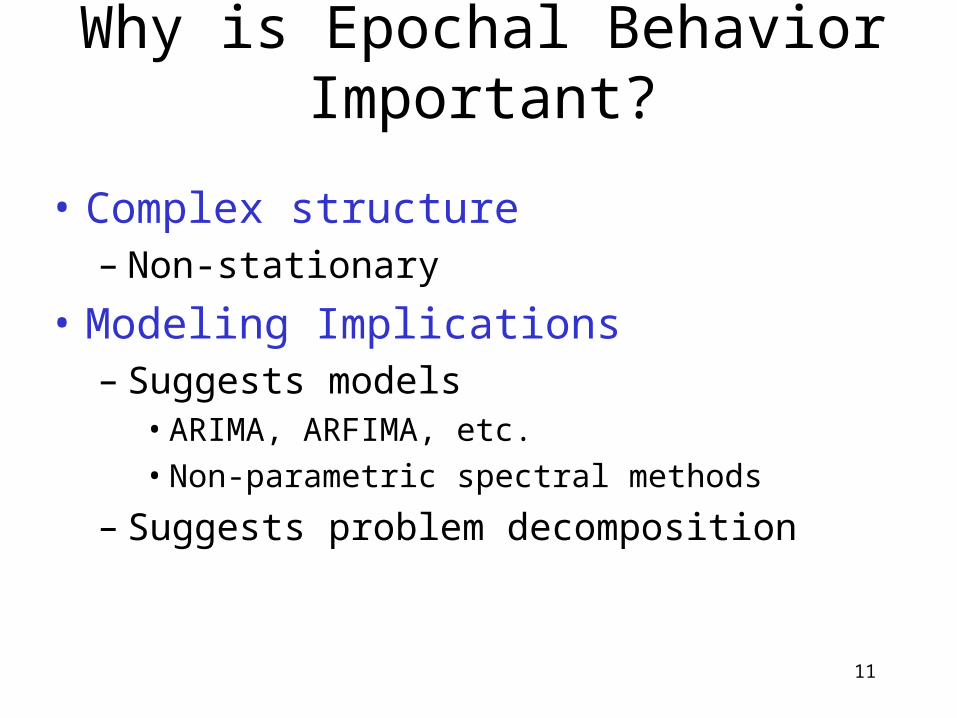
Why is Epochal Behavior Important?
• Complex structure – Non-stationary
• Modeling Implications– Suggests models
• ARIMA, ARFIMA, etc.• Non-parametric spectral methods
– Suggests problem decomposition
12
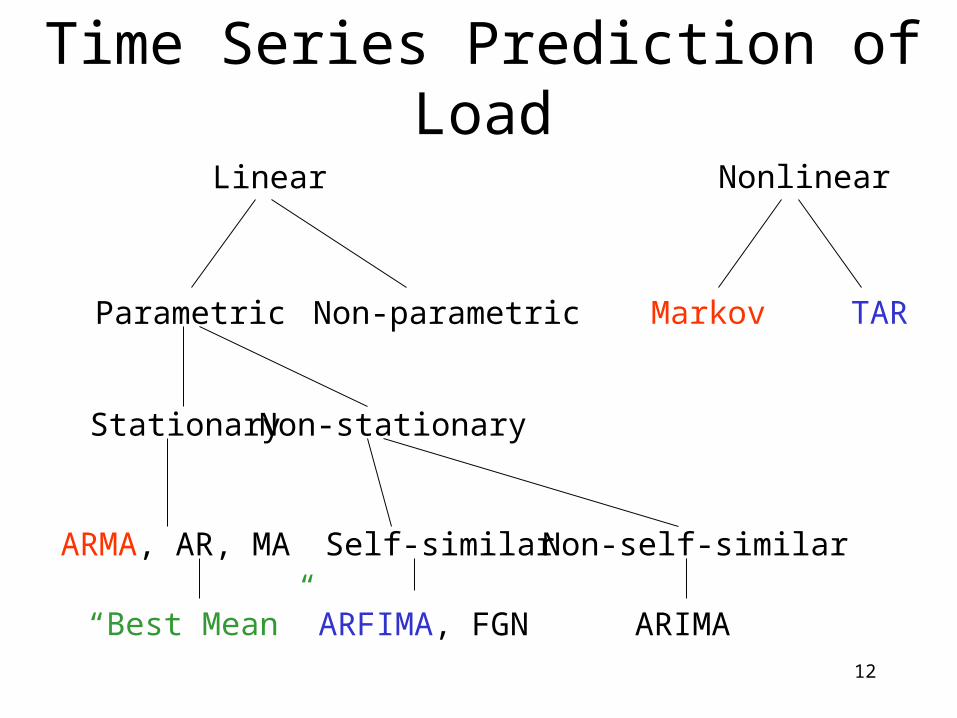
Time Series Prediction of Load
Linear Nonlinear
Stationary Non-stationary
ARMA, AR, MA
ARIMAARFIMA, FGN
TARMarkov
Self-similar Non-self-similar
“Best Mean”
Non-parametricParametric
13
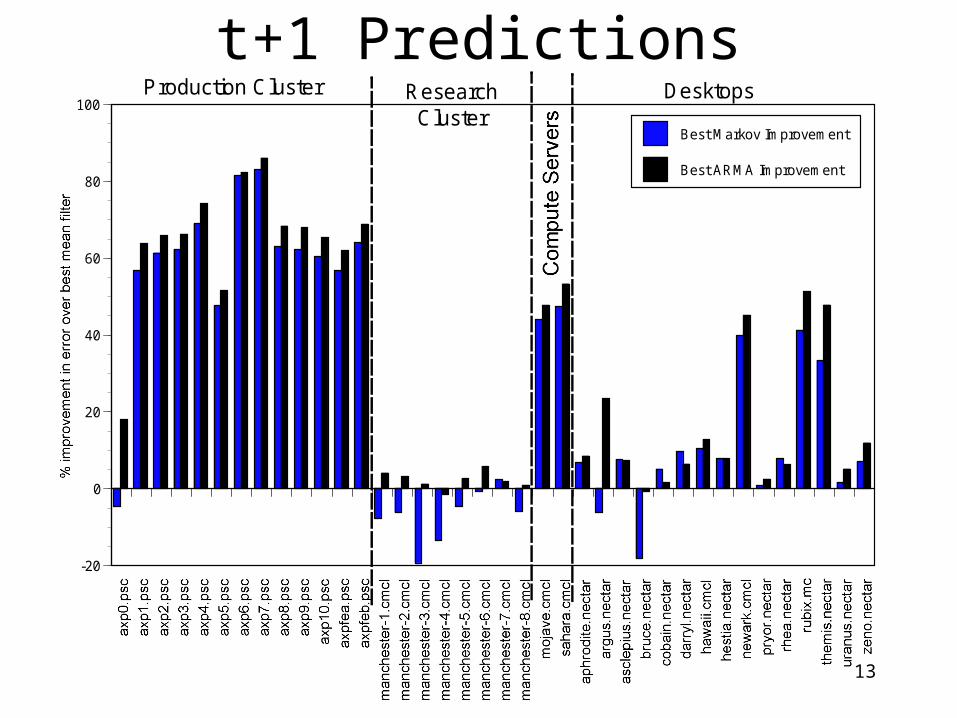
-20
0
20
40
60
80
100
Best Markov Improvement
Best ARMA Improvement
Production Cluster ResearchCluster
Desktops
t+1 Predictions
14
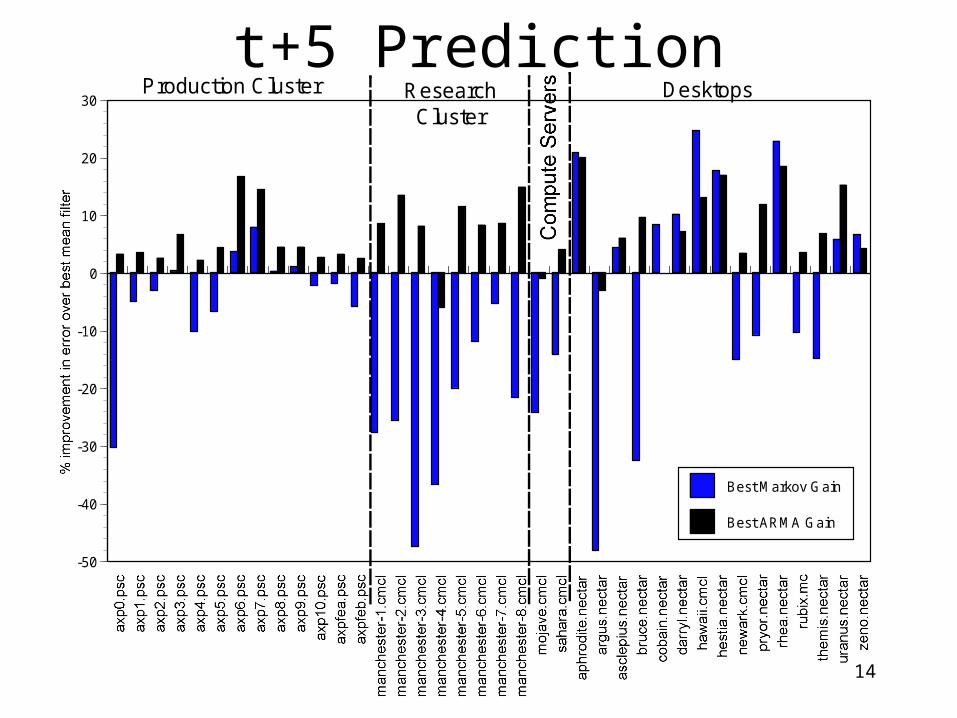
-50
-40
-30
-20
-10
0
10
20
30
Best Markov Gain
Best ARMA Gain
Production Cluster ResearchCluster
Desktops
t+5 Prediction
15
Conclusions
• Load has structure to exploit for prediction• Structure is complex (self-similarity, epochs)
• Simple time series models are promising• Benefits of more sophisticated models are unclear
• Current research questions• What are the benefits of more sophisticated models?• How to characterize prediction error to user?• Is there a measure of inherent predictability?• How to incorporate load prediction into systems?
16
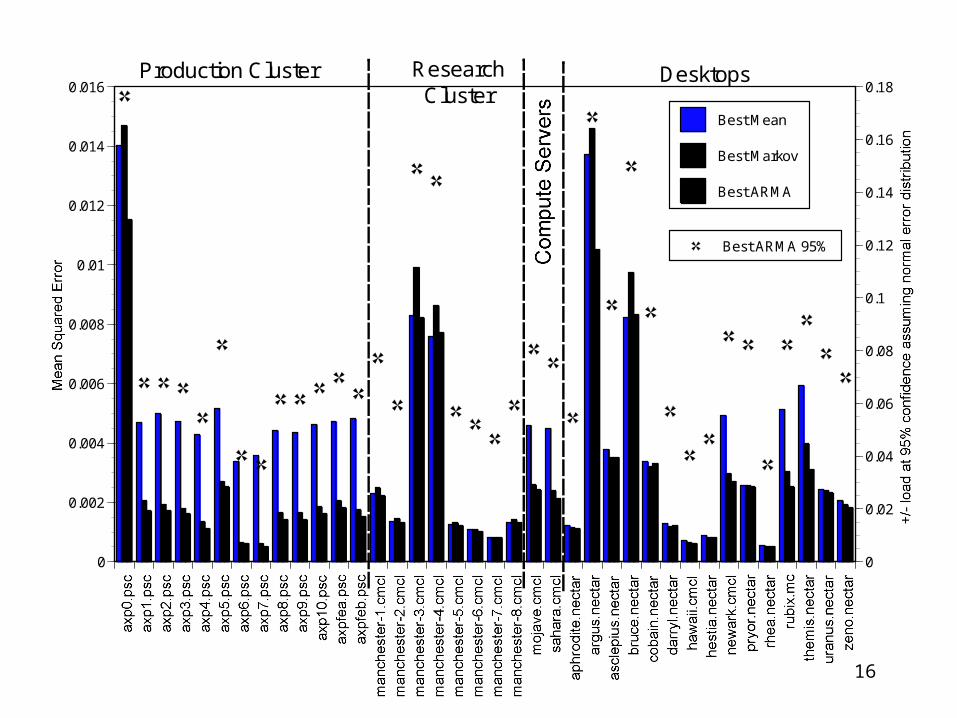
0
0.002
0.004
0.006
0.008
0.01
0.012
0.014
0.016
0
0.02
0.04
0.06
0.08
0.1
0.12
0.14
0.16
0.18
Best Mean
Best Markov
Best ARMA
Best ARMA 95%
Production Cluster ResearchCluster
Desktops