


Languages
Pages
Legal


LITTLE TURKEY LAKE
Steuben County
2008 Fish Management Report
Larry A. Koza
Assistant Fisheries Biologist
Fisheries Section
Indiana Department of Natural Resources
Division of Fish and Wildlife
I.G.C.-South, Room W273
402 W. Washington Street
Indianapolis, IN 46204
2008

i
EXECUTIVE SUMMARY
• A general fisheries survey was conducted on Little Turkey Lake on June 16 through 20,
2008. Water chemistry and aquatic vegetation data were also collected.
• The Secchi disk reading at Little Turkey Lake during the general survey was 4 ft and
dissolved oxygen concentrations were not adequate for fish survival below 11 ft. The Secchi
disk reading during the plant survey was also 4 ft. Submersed vegetation was found to a
maximum depth of 9 ft. Coontail was the most common submersed plant followed by curly-
leaf pondweed and sago pondweed. Only seven species of submersed plants were collected
during the survey. Curly-leaf pondweed is classified as an aquatic invasive species in
Indiana.
• A total of 412 fish representing 13 species was collected during this survey. Bluegill ranked
first by number, followed by largemouth bass and white sucker. Common carp was the
dominant species collected by weight followed by white sucker and largemouth bass.
• Bluegill and largemouth bass dominated the sport fishery at Little Turkey Lake while black
crappie and yellow perch contribute although they are present in small numbers.
• Bluegill of all ages grew at an average rate for northern Indiana natural lakes while
largemouth bass grew at an above average rate.
• No fish management is recommended at Little Turkey Lake at this time.
ii
TABLE OF CONTENTS
Page LIST OF TABLES………………………………………………………….……………………iii
LIST OF FIGURES………………………………………………………………………………iii
INTRODUCTION…………………………………………….…………………………………..1
METHODS………………………………………………………………………………………..1
RESULTS…………………………………………………………………………………………2
DISCUSSION……………………………………………………………………………………..3
RECOMMENDATIONS………………………………………………………………………….5
LITERATURE CITED……………………………………………………………………………5
APPENDIX 1- Survey Data Pages………………………………………………………………..9

iii
LIST OF TABLES
Table Page
1. Sampling effort, species composition and relative abundance of fish collected during
1974, 1979, 1989 and 2008 fisheries surveys of Little Turkey Lake ..................................6
2. Relative abundance by select size ranges for bluegill and largemouth bass collected
during 1974, 1979, 1989 and 2008 fisheries surveys of Little Turkey Lake .......................7
LIST OF FIGURES
Figure Page
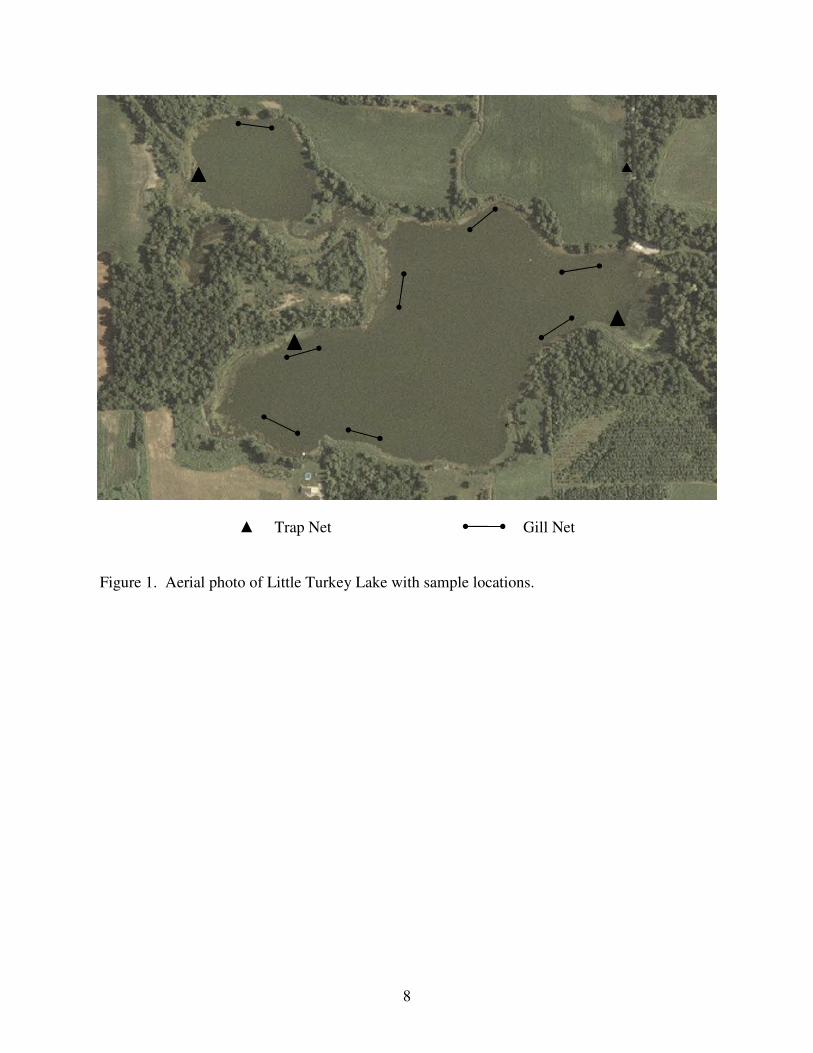
1. Aerial photo of Little Turkey Lake with sample locations ..................................................8

1
INTRODUCTION
Little Turkey Lake is a 58-acre natural lake located approximately one mile west of
Hudson, Indiana in Steuben County. It has a maximum depth of 30 feet and an average depth of
13.7 feet. The lake has three inlets, Smathers Ditch, Conrad Ditch and an unnamed ditch. Both
Smathers Ditch, which is the main inlet, and Conrad Ditch enter Little Turkey Lake on the east
shore while the unnamed ditch enters on the south shore. Turkey Creek is the outlet for Little
Turkey Lake. It is located in the northwest corner of the lake and flows northwest into Lime
Kiln Lake. There is a state owned access site with a concrete boat ramp located on the northeast
corner of the lake which is accessible off of County Road 700 South.
The majority of the shoreline of Little Turkey Lake consists of woods. There are two
homes on the lake but the property owners have done little to alter the natural shoreline. Pasture
and croplands are present but are buffered from the lake by wooded strips.
The initial fisheries survey of Little Turkey Lake was conducted in 1974 by Division of
Fish and Wildlife (DFW) biologists. The purpose of this survey was to evaluate the quality of
the sport fishery. The major sport species collected included bluegill, black crappie, yellow
perch and largemouth bass (Table 1). The Little Turkey Lake fishery was considered
satisfactory and no management was recommended. Additional fisheries surveys were
conducted in 1979 and 1989. No significant changes were noted in the fishery. The current
survey was conducted to evaluate the present condition of the fish population.
METHODS
This survey was conducted from June 16 through 20, 2008 as part of DFW Work Plan
300FW1F10D40621 that covers management of fish populations in natural lakes. Several
physical and chemical characteristics of the water were measured in the deepest area of the lake
according to the Manual of Fisheries Survey Methods (2001) standard lake survey guidelines.
Submersed aquatic vegetation was sampled on July 16, 2008 using methods outlined in the Tier
II Aquatic Vegetation Survey Protocol developed by the DFW Lake and River Enhancement
Program and used in their aquatic vegetation control grant program. A global positioning system
(GPS) device was used to record the location of the limnological data collection site, aquatic
vegetation sample sites, and fish collection sites.

2
Fish were collected by pulsed D.C. electrofishing the shoreline at night with two dippers
for one hour. Two experimental-mesh gill nets were also fished overnight for four nights while
one trap net was fished overnight for three nights. All fish collected were measured to the
nearest 0.1 in TL. Length-frequency tables were constructed for species of concern with whole
inch groups consisting of individuals measuring from X.0 to X.4 in TL and half inch groups
consisting of individuals measuring from X.5 to X.9 in TL. Length-weight regression equations
for Fish Management District 2 were used to estimate the weight of all fish within the sample.
Five scale samples per half-inch group were collected from game species for age and growth
analysis. Length-at-age for these species was estimated using scale analysis (DeVries and Frie
1996). Age length keys were also constructed to determine mean length at age at the time of
collection.
RESULTS
The Secchi disk reading at Little Turkey Lake was 4 ft and dissolved oxygen
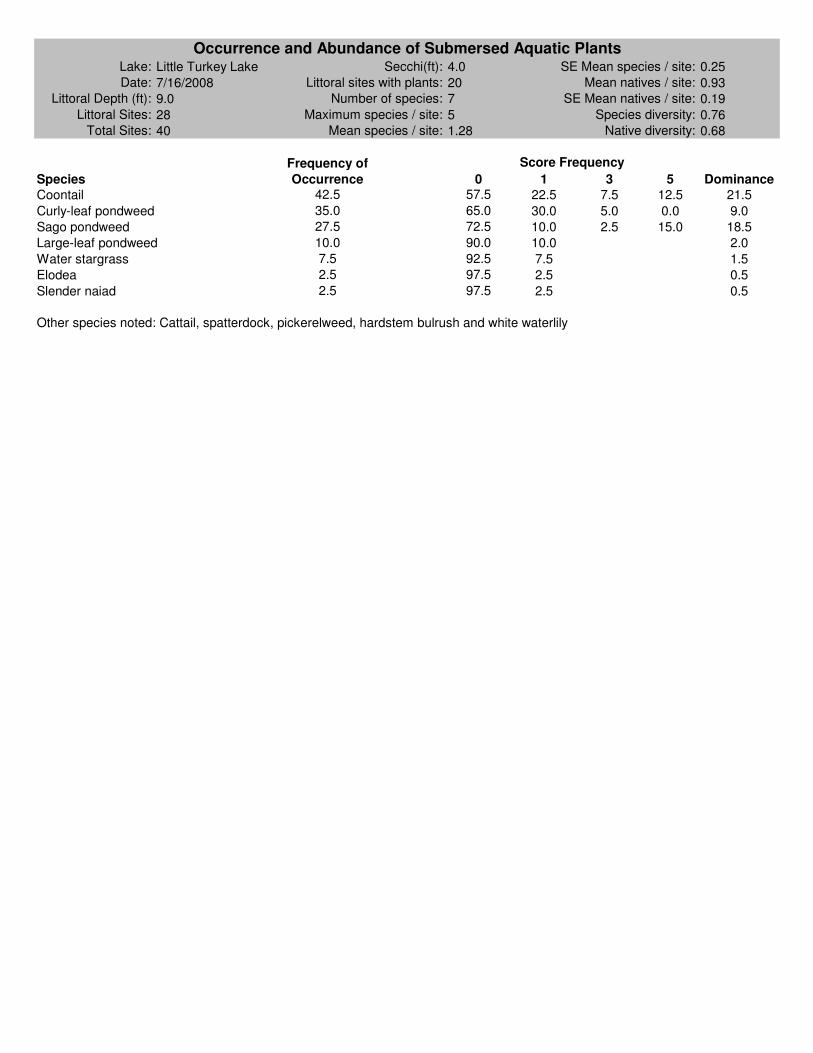
concentrations were not adequate for fish survival below 11 ft. Forty sites were randomly
sampled during the plant survey, 28 of which fell within the littoral zone in water 9 ft in depth or
less. The Secchi disk reading at the time of plant sampling was also 4 ft. A total of six native
and one exotic species were identified. Aquatic plants were observed at 20 of the 28 littoral sites
sampled. The maximum number of plant species found at one site was five and the mean was
one. Coontail was the dominant plant collected followed by curly-leaf pondweed and sago
pondweed. Five emergent, floating or floating leaf plants associated with wetlands, cattail,
hardstem bulrush, pickerelweed, spatterdock and white water lily, were also observed. Curly-
leaf pondweed is considered an invasive species and was not found in any of the prior surveys of
Little Turkey Lake. Although it was present at 35% of the littoral sites, the overall abundance
was low. With the exception of two small areas on the east and west end of the lake, the littoral
zone in Little Turkey Lake is relatively narrow. This serves to restrict plant distribution and
abundance.
A total of 412 fish representing 13 species was collected from Little Turkey Lake in
2008. Numerically, bluegill was the top species collected (39%) followed by largemouth bass
(19%), white sucker (14%) and golden shiner (12%). Common carp was the dominant species
collected by weight (26%) followed by white sucker (23%), largemouth bass (19%) and spotted

3
gar (17%).
Bluegill ranked first by number (39%) and fifth by weight (9%) among all species
collected during this survey. The 161 bluegills collected ranged in length from 2.0 (age 1) to 8.1
(age 6) in TL and averaged 5.6 in TL. They weighed approximately 26.3 pounds. During
electrofishing bluegills were collected at a rate of 128 fish per hour. Three bluegills per lift were
collected during gill netting, while trap netting yielded two bluegills per lift. Bluegills 6.0-in TL
or larger, considered harvestable size, comprised 44% of the sample, reaching this size during
their third or fourth year of life. All age groups of bluegills grew at an average rate for northern
Indiana natural lakes. Bluegill was also the top species collected numerically in all of the
preceding surveys. The percentage of harvestable size bluegills collected ranged from 50% to
61% in these surveys.
A total of 77 largemouth bass weighing approximately 58 pounds was collected.
Largemouth bass ranked second by number (19%) and third by weight (19%) among all species
collected. They ranged in length from 5.5 (age 2) to 18.5 (age 6) in TL and averaged 10.8 in TL.
Harvestable size largemouth bass (14 in TL or larger) comprised 17% of the sample. Bass
reached this size during their fourth year of life. Largemouth bass grew at an above average rate
for northern Indiana natural lakes. Electrofishing yielded a catch of 60 bass per hour. Gill
netting yielded two per lift while only one bass was caught during trap netting. In previous
surveys, largemouth bass ranged from 5% to 7% of the total fish sample and 12% to 17% of
these have been harvestable size. Only five bass measuring 18 in TL or larger have been
collected during fisheries surveys of Little Turkey Lake beginning with the first survey in 1974.
Two other sport species were collected during the current survey, black crappie and
yellow perch, the largest of which measured 9.1 and 10.0 in TL respectively. Neither was
collected in large numbers as only 13 crappies and 4 perch were sampled. Larger numbers of
these two species have been collected in prior years as 178 crappies were collected in 1979 and
95 perch were collected in both the 1979 and 1989 surveys.
DISCUSSION
Little Turkey Lake’s sport fish population is dominated by bluegills and largemouth bass.
Approximately 57% of the fish sample was comprised of these two species numerically and they
represented 28% of the sample by weight. While no extremely large bluegills or bass were

4
collected during this survey, good numbers of these were present in sizes that would be attractive
to anglers. Additional sport species collected included black crappie and yellow perch.
Although they were not captured in large numbers, their presence in the fishery offers anglers
other opportunities.
All ages of bluegill grew at an average rate for northern Indiana natural lakes, similar to
the growth observed in the previous fisheries surveys.
Harvestable size bluegills still comprise an acceptable percentage of the population and
are at a level close to what was observed in 1979 and 1989. The highest abundance of
harvestable size bluegills in the sample occurred in 1974; however the decline since then has
been marginal. While fish over 8 in TL were not abundant, bluegill fishing at Little Turkey Lake
is still considered good.
Largemouth bass are present in good numbers in Little Turkey Lake and a sufficient
number of legal size bass are present to attract anglers. The percentage of harvestable size bass
has fluctuated between 12% and 17% in alternating surveys. One change in the bass population
to be noted is the fact that bass are now growing at an above average rate for natural lakes in
Indiana. It is anticipated that this increase in growth should result in the presence of more
harvestable size bass in the lake in the future.
Aquatic vegetation in Little Turkey Lake is restricted to a relatively narrow band circling
the lake, with the exception of shallow bays on the east and west ends of the lake. This results in
minimal interference with angling activities over a vast majority of the lake. One aquatic
invasive species, curly-leaf pondweed, was collected at Little Turkey Lake. Although it
currently is not a nuisance, its abundance should be monitored. If this exotic pondweed does
become a problem, funding or even cost sharing a lake wide control program through the Lake
and River Enhancement program would be challenging for the relative few lakefront residents.
The water quality at Little Turkey Lake is considered fair. Nutrients are most likely
carried into the lake via the drainage ditches that serve as inlets to the lake. These ditches flow
through agricultural areas and are susceptible to collecting runoff from these fields. These
nutrient loads are in all probability contributing to the level of planktonic algae in the lake which
lowers water clarity and gives the water its green appearance. Good conservation practices in the
watershed could help lower the nutrient runoff into the ditches.

5
Black spot disease was noticed in several of the yellow perch collected during the
survey. This is caused by a parasitic fluke which burrows under the fishes skin. A black
pigment then forms in the tissue surrounding the fluke. This parasite, while unsightly, is not
harmful to humans if consumed. Shoreline erosion was minimal.
RECOMMENDATIONS
• The DFW should encourage and support the Steuben County Soil and Water Conservation
District and the Steuben County Surveyors Office in their efforts to implement erosion
control projects in the Little Turkey Lake watershed which should result in improved water
quality in the lake.
• No fish management is recommended for Little Turkey Lake at this time.
LITERATURE CITED
DeVries, D. R. and R.V. Frie. 1996. Determination of Age and Growth. Pages 483-512 in B. R.
Murphy and D. W. Willis, editors. Fisheries techniques, 2nd edition. American Fisheries
Society, Bethesda, Maryland.
Submitted by: Larry A. Koza, Assistant Fisheries Biologist
Date: 12/19/08
Approved by: Stuart Shipman
North Region Fisheries Supervisor
Date: 1/22/09

6
Table 1. Sampling effort, species composition and relative abundance of fish collected during
the 1974, 1979, 1989 and 2008 fisheries surveys of Little Turkey Lake.
Species 1974 1979 1989 2008
Black bullhead 1 4
Black crappie 17 178 48 13
Bluegill 346 345 261 161
Bowfin 11 3 4
Brown bullhead 3 8 1
Common carp 3 7 4 10
Common shiner 1
Golden shiner 224 67 55 50
Green sunfish 1 2 1
Hybrid sunfish 3
Lake chubsucker 5 58 9
Largemouth bass 40 58 48 77
Northern hogsucker 1
Northern pike 2 3
Pumpkinseed 17 129 19 2
Redfin pickerel 1 1
Redear 1 1
Spotted gar 16 6 16 27
Warmouth 15 42 11 1
White crappie 10 34
White sucker 20 59 28 57
Yellow bullhead 8 4 9 8
Yellow perch 9 95 95 4
Total 738 1,075 653 412
Sampling Effort
Electrofishing Effort 1.0 h AC 1.0 h DC 1.0 h DC 1.0 h DC
Gill Net Effort 9 lifts 12 lifts 9 lifts 8 lifts
Trap Net Effort 0 lifts 12 lifts 6 lifts 3 lifts

7
Table 2. Relative abundance by select size ranges for bluegill and largemouth bass collected
during the 1974, 1979, 1989 and 2008 fisheries surveys of Little Turkey Lake.
Species Length Range (TL) 1974 1997 1989 2008
Bluegill 3.0-5.5 in 133 185 130 78
6.0-6.5 in 111 35 81 35
7.0-7.5 in 89 80 49 33
≥ 8.0 in 11 45 3
Largemouth bass 8.0-9.5 in 20 7 12 29
10.0-11.5 in 5 7 8 19
12.0-13.5 in 1 13 3 11
14.0-17.5 in 5 8 4 12
≥ 18.0 in 2 2 1
8
▲ Trap Net Gill Net
Figure 1. Aerial photo of Little Turkey Lake with sample locations.

9
APPENDIX 1. Survey data pages

X
Surface acres Maximum depth Average depth
58 30 13.7
X
X
LAKE SURVEY REPORT Initial Survey
June 16-20, 2008
Re-Survey
Lake Name Date of survey (Month, day, year)County
Date of approval (Month, day, year)
January 22, 2009
LOCATION
Little Turkey LakeBiologist's name
Neil D. Ledet and Larry A. Koza
Steuben
Quadrangle Name
AshleyTownship Name
36N
Range
12ENearest Town
1/5 miles west of Hudson, Indiana
Section
35
ACCESSIBILITYState owned public access site Privately owned public access site Other access site
Located off of County Road 700SAcre feet
799
Water level
939.04 MSL
Extreme fluctuations
Location of benchmark
INLETSName Location Origin
South
Drainage
Drainage
Smathers Ditch East Drainage
Conrad Ditch
OUTLETSName
Turkey Creek
Location
Northwest into Limekiln LakeWater level control
None
POOL
TOP OF DAM
TOP OF FLOOD CONTROL POOL
TOP OF CONSERVATION POOL
TOP OF MINIMUM POOL
STREAMBED
Watershed use
Development of shoreline
General farming
Approximately 3% of the shoreline is developed residentially.
Previous surveys and investigations
USGS Hydrographic Survey, 1962. IDNR Fisheries Surveys: Peterson, 1974, 1979; Ledet, 1989.
Bottom type
Boulder
Gravel
Sand
Muck
Clay
Marl
ELEVATION (Feet MSL) ACRES
Type of Survey
Unnamed
East

Gallons ppm
4 Feet 0 Inches (SECCHI DISK)
pH
Surface: 171.6 Bottom: 223.1 Surface: Bottom: 8.7
N W
DEPTH (FEET) Degrees (°F) D.O. (ppm) DEGREES (°F) D.O. (ppm) DEGREES (°F) D.O. (ppm)
SURFACE 76.2 11.9
2 76.1 11.8
4 76.1 11.8
6 76.1 11.7
8 76.0 11.6
10 70.1 9.0
12 63.8 2.4
14 59.4 0.6
16 55.4 0.6
18 53.2 0.5
20 52.0 0.5
22 50.8 0.5
24 50.3 0.5
26 49.5 0.5
28 49.4 0.4
30 49.4 0.4
32
34
60
62
64
88
90
92
66
68
70
94
96
98
100
52
54
56
58
50
72
74
76
78
80
82
84
86
*ppm-parts per million
DEPTH (FEET) DEPTH (FEET)
36
38
40
42
44
46
48
Water chemistry GPS coordinates:41.53496 85.10748
9.3
Air temperature: °F
SAMPLING EFFORT
PHYSICAL AND CHEMICAL CHARACTERISTICS
TEMPERATURE AND DISSOLVED OXYGEN (D.O.)
COMMENTS
ELECTROFISHING
TRAP NETS
GILL NETS
ROTENONE
Day hours
Number of traps
1Number of nets
2
Number of Lifts Total effort
3 3
Night hours Total hours
1 1
Number of Lifts Total effort
4 8Number of 100 Foot Seine Hauls
Color Turbidity
Acre Feet Treated SHORELINE
SEINING
GreenAlkalinity (ppm)*
Conductivity: micromhos590

LENGTH RANGE WEIGHT
*COMMON NAME OF FISH NUMBER PERCENT (inches) (pounds) PERCENT
Bluegill 161 39.1 2.0 - 8.1 26.63 8.7
Largemouth bass 77 18.7 5.5 - 18.5 58.30 19.1
White sucker 57 13.8 8.9 - 19.8 70.43 23.0
Golden shiner 50 12.1 6.4 - 9.5 8.11 2.7
Spotted gar 27 6.6 18.4 - 30.4 50.86 16.6
Black crappie 13 3.2 7.0 - 9.1 3.62 1.2
Common carp 10 2.4 20.6 - 29.5 79.78 26.1
Yellow bullhead 8 1.9 9.6 - 12.5 5.21 1.7
Yellow perch 4 1.0 6.7 - 10.1 1.25 0.4
Pumpkinseed 2 0.5 5.8 - 6.6 0.36 0.1
Brown bullhead 1 0.2 13.7 1.06 0.3
Common shiner 1 0.2 6.3 0.08 **
Warmouth 1 0.2 4.3 0.06 **
Total (13 Species) 412 305.75
*Common names of fishes recognized by the American Fisheries Society.
**Less than 0.1 percent
SPECIES AND RELATIVE ABUNDANCE OF FISHES COLLECTED BY NUMBER AND WEIGHT

TOTAL PERCENT AVERAGE TOTAL PERCENT
LENGTH NUMBER OF FISH WEIGHT AGE OF LENGTH NUMBER OF FISH AGE OF
(inches) COLLECTED COLLECTED (pounds) FISH (inches) COLLECTED COLLECTED FISH
1.0 19.0
1.5 19.5
2.0 7 4.3 0.01 1 20.0
2.5 5 3.1 0.01 1 20.5
3.0 21.0
3.5 1 0.6 0.04 2 21.5
4.0 5 3.1 0.06 2, 3 22.0
4.5 10 6.2 0.08 3 22.5
5.0 34 21.1 0.11 3, 4 23.0
5.5 28 17.4 0.14 3 23.5
6.0 18 11.2 0.17 3, 4 24.0
6.5 17 10.6 0.22 4, 5 24.5
7.0 24 14.9 0.29 5, 6 25.0
7.5 9 5.6 0.33 5, 6 25.5
8.0 3 1.9 0.40 6 26.0
8.5 TOTAL 161
9.0
9.5
10.0
10.5
11.0
11.5
12.0
12.5
13.0
13.5
14.0
14.5
15.0
15.5
16.0
16.5
17.0
17.5
18.0
18.5
GILL NET
CATCH 3.3 /lift
NUMBER, PERCENTAGE, WEIGHT, AND AGE OF BLUEGILLAVERAGE
WEIGHT
(pounds)
TRAP NET CATCH 2.3 /liftELECTROFISHING
CATCH 128 /hr

LENGTH
GROUP NUMBER NUMBER
(inches) COLLECTED AGED
1.0
1.5
2.0 7 3 7
2.5 5 4 5
3.0
3.5 1 1 1
4.0 5 4 3 2
4.5 10 5 10
5.0 34 5 20 14
5.5 28 5 28
6.0 18 5 14 4
6.5 17 4 8 9
7.0 24 7 14 10
7.5 9 4 4 5
8.0 3 2 3
Total 161 49 12 4 74 26 27 18
Mean TL 2.5 4.1 5.5 5.9 7.2 7.5
SE 0.07 0.14 0.06 0.14 0.07 0.09
AGE-LENGTH KEY FOR BLUEGILLAGE
9 107 11 121 2 3 4 5 6 8

TOTAL PERCENT AVERAGE TOTAL PERCENT
LENGTH NUMBER OF FISH WEIGHT AGE OF LENGTH NUMBER OF FISH AGE OF
(inches) COLLECTED COLLECTED (pounds) FISH (inches) COLLECTED COLLECTED FISH
1.0 19.0
1.5 19.5
2.0 20.0
2.5 20.5
3.0 21.0
3.5 21.5
4.0 22.0
4.5 22.5
5.0 23.0
5.5 1 1.3 0.08 2 23.5
6.0 1 1.3 0.12 2 24.0
6.5 1 1.3 0.16 2 24.5
7.0 1 1.3 0.18 2 25.0
7.5 1 1.3 0.22 2 25.5
8.0 2 2.6 0.27 2 26.0
8.5 4 5.2 0.32 2 TOTAL 77
9.0 13 16.9 0.38 2
9.5 10 13.0 0.45 2
10.0 9 11.7 0.53 2, 3
10.5 4 5.2 0.60 2, 3
11.0 3 3.9 0.66 2, 3
11.5 3 3.9 0.81 4
12.0 5 6.5 0.90 3
12.5 4 5.2 0.25 2, 3, 4
13.0 1 1.3 1.12 3
13.5 1 1.3 1.31 3
14.0 1 1.3 1.46 4
14.5 4 5.2 1.63 3, 4
15.0 1 1.3 1.83 4
15.5 1 1.3 1.94 5
16.0
16.5 3 3.9 2.29 5
17.0 2 2.6 2.52 5, 6
17.5
18.0
18.5 1 1.3 3.21 6
ELECTROFISHING
CATCH 60 /hr
GILL NET
CATCH 2 /lift TRAP NET CATCH 0.3 /lift
NUMBER, PERCENTAGE, WEIGHT, AND AGE OF LARGEMOUTH BASSAVERAGE
WEIGHT
(pounds)

LENGTH
GROUP NUMBER NUMBER
(inches) COLLECTED AGED
5.5 1 1 1
6.0 1 1 1
6.5 1 1 1
7.0 1 1 1
7.5 1 1 1
8.0 2 2 2
8.5 4 4 4
9.0 13 12 13
9.5 10 10 10
10.0 9 9 8 1
10.5 4 4 2 2
11.0 3 3 2 1
11.5 3 2 3
12.0 5 4 5
12.5 4 3 1 2 1
13.0 1 1 1
13.5 1 1 1
14.0 1 1 1
14.5 4 4 2 2
15.0 1 1 1
15.5 1 1 1
16.0
16.5 3 3 3
17.0 2 2 1 1
17.5
18.0
18.5 1 1 1
Total 77 73 47 15 8 5 2
Mean TL 9.4 12.4 13.4 16.7 18.0
SE 0.18 0.36 0.52 0.24 0.75
AGE-LENGTH KEY FOR LARGEMOUTH BASS
9 108 11
AGE
1 2 3 4 5 6 7 12

1 N 41.53698 W 85.10762 1 N 41.53524 W 85.11123 1 N W
N W 2 N 41.53740 W 85.11348 N W
2 N 41.53358 W 85.11025 3 N 41.53510 W 85.10471 2 N W
N W 4 N W N W
3 N 41.53600 W 85.10949 5 N W 3 N W
N W 6 N W N W
4 N 41.53378 W 85.11213 7 N W 4 N W
N W 8 N W N W
5 N 41.53521 W 85.10593 9 N W 5 N W
N W 10 N W N W
6 N 41.53826 W 85.11198 11 N W 6 N W
N W 12 N W N W
7 N 41.53611 W 85.10589 13 N W 7 N W
N W 14 N W N W
8 N 41.53495 W 85.11133 15 N W 8 N W
N W 16 N W N W
9 N W 17 N W 9 N W
N W 18 N W N W
10 N W 19 N W 10 N W
N W 20 N W N W
11 N W 11 N W
N W N W
12 N W 12 N W
N W N W
13 N W 13 N W
N W N W
14 N W 14 N W
N W N W
15 N W 15 N W
N W N W
16 N W 16 N W
N W N W
17 N W 17 N W
N W N W
18 N W 18 N W
N W N W
19 N W 19 N W
N W N W
20 N W 20 N W
N W N W
GPS SAMPLING COORDINATES
GILL NETS TRAP NETS ELECTROFISHING
Lake: Secchi(ft): 4.0 0.25
Date: 7/16/2008 20 0.93
Littoral Depth (ft): 9.0 7 0.19
Littoral Sites: 28 5 0.76
Total Sites: 40 1.28 0.68
Frequency of
Species Occurrence 0 1 3 5 Dominance
Coontail 42.5 57.5 22.5 7.5 12.5 21.5
Curly-leaf pondweed 35.0 65.0 30.0 5.0 0.0 9.0
Sago pondweed 27.5 72.5 10.0 2.5 15.0 18.5
Large-leaf pondweed 10.0 90.0 10.0 2.0
Water stargrass 7.5 92.5 7.5 1.5
Elodea 2.5 97.5 2.5 0.5
Slender naiad 2.5 97.5 2.5 0.5
Other species noted: Cattail, spatterdock, pickerelweed, hardstem bulrush and white waterlily
Score Frequency
SE Mean species / site:
Mean natives / site:
Species diversity:Maximum species / site:
Mean species / site:
Occurrence and Abundance of Submersed Aquatic Plants
Native diversity:
SE Mean natives / site:
Little Turkey Lake
Littoral sites with plants:
Number of species:
Top Related