


Languages
Pages
Legal

KENYA PORTS AUTHORITY- OVER VIEW & PORT REFORMS PLANS
OCTOBER 2007
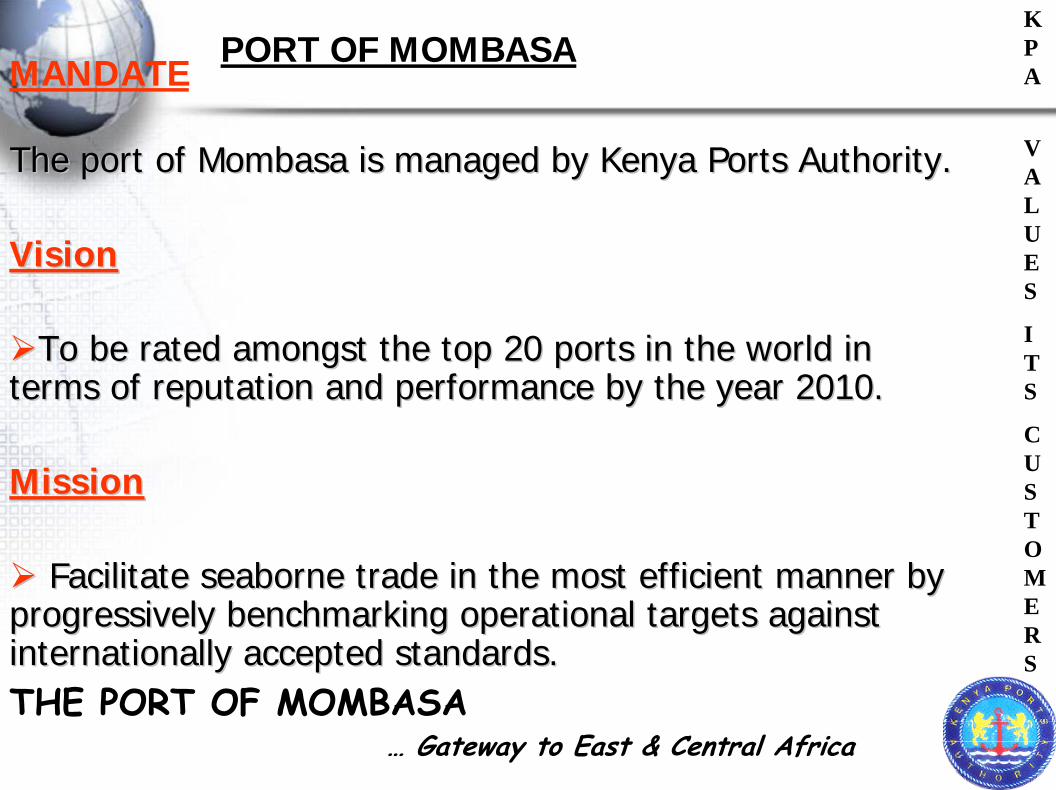
THE PORT OF MOMBASA… Gateway to East & Central Africa
KPA
VALUE S
ITS
CUSTOMERS
MANDATE
The port of Mombasa is managed by Kenya Ports Authority.The port of Mombasa is managed by Kenya Ports Authority.
Vision Vision
To be rated amongst the top 20 ports in the world in To be rated amongst the top 20 ports in the world in terms of reputation and performance by the year 2010.terms of reputation and performance by the year 2010.
Mission Mission
Facilitate seaborne trade in the most efficient manner by Facilitate seaborne trade in the most efficient manner by progressively benchmarking operational targets against progressively benchmarking operational targets against internationally accepted standards.internationally accepted standards.
PORT OF MOMBASA
PORT OF MOMBASA
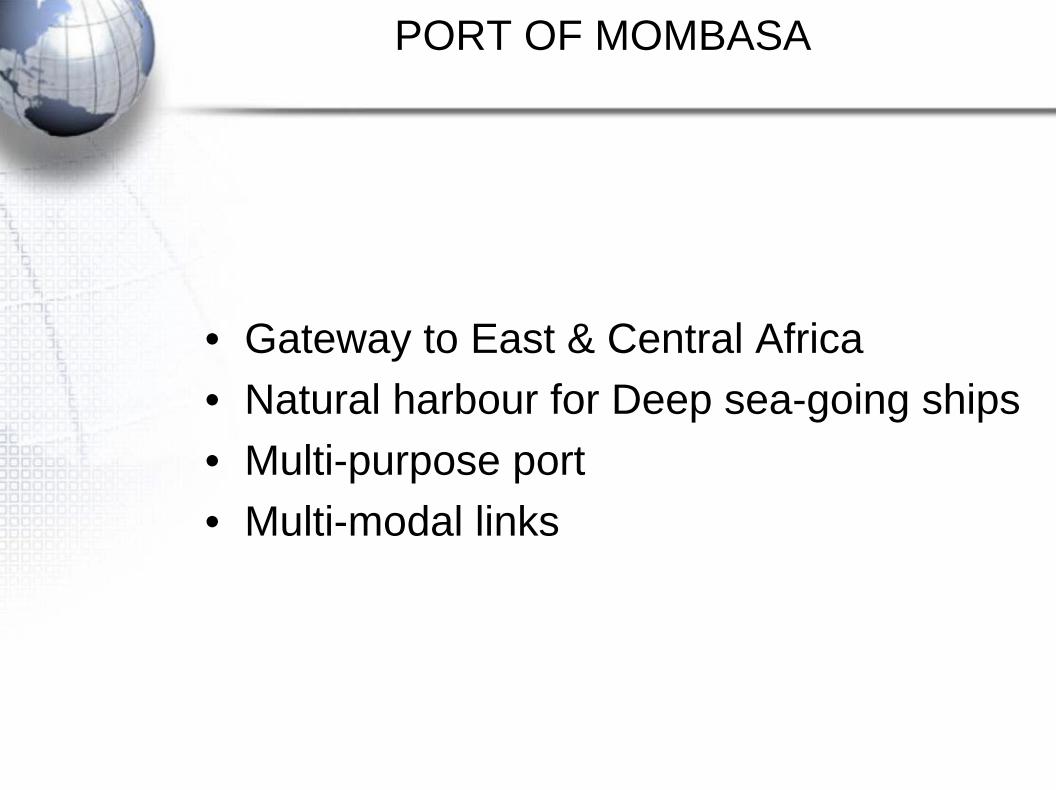
• Gateway to East & Central Africa• Natural harbour for Deep sea-going ships• Multi-purpose port• Multi-modal links
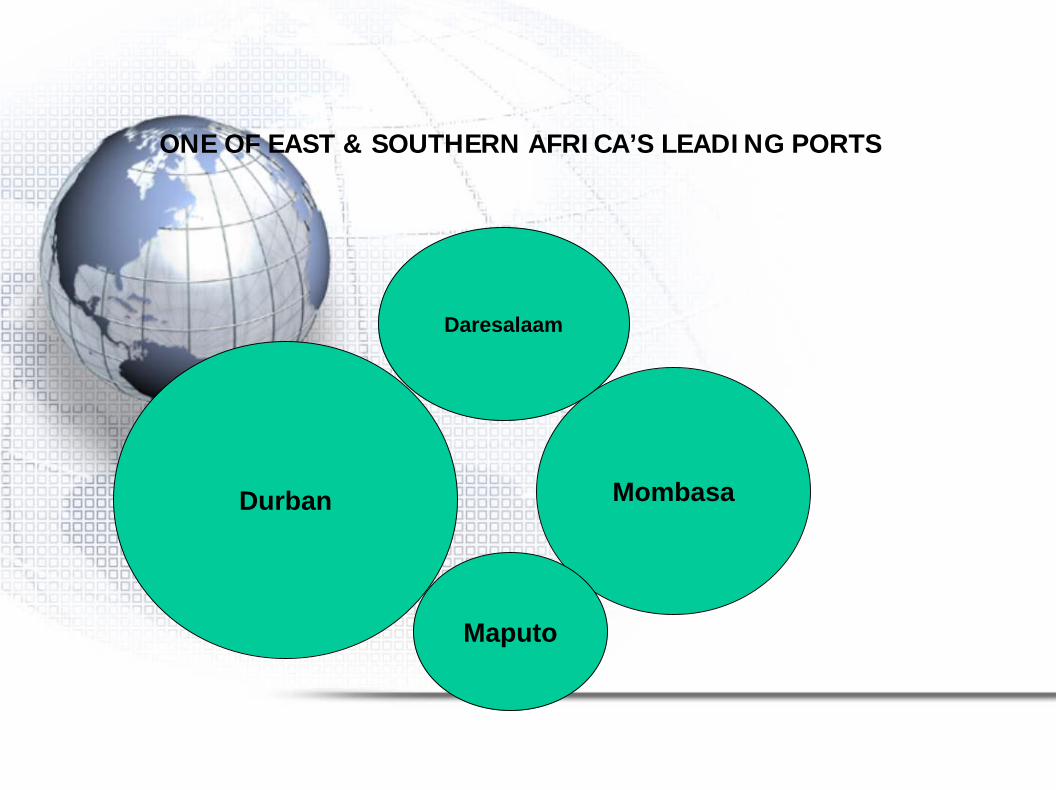
ONE OF EAST & SOUTHERN AFRICA’S LEADING PORTS
Durban Mombasa
Daresalaam
Maputo
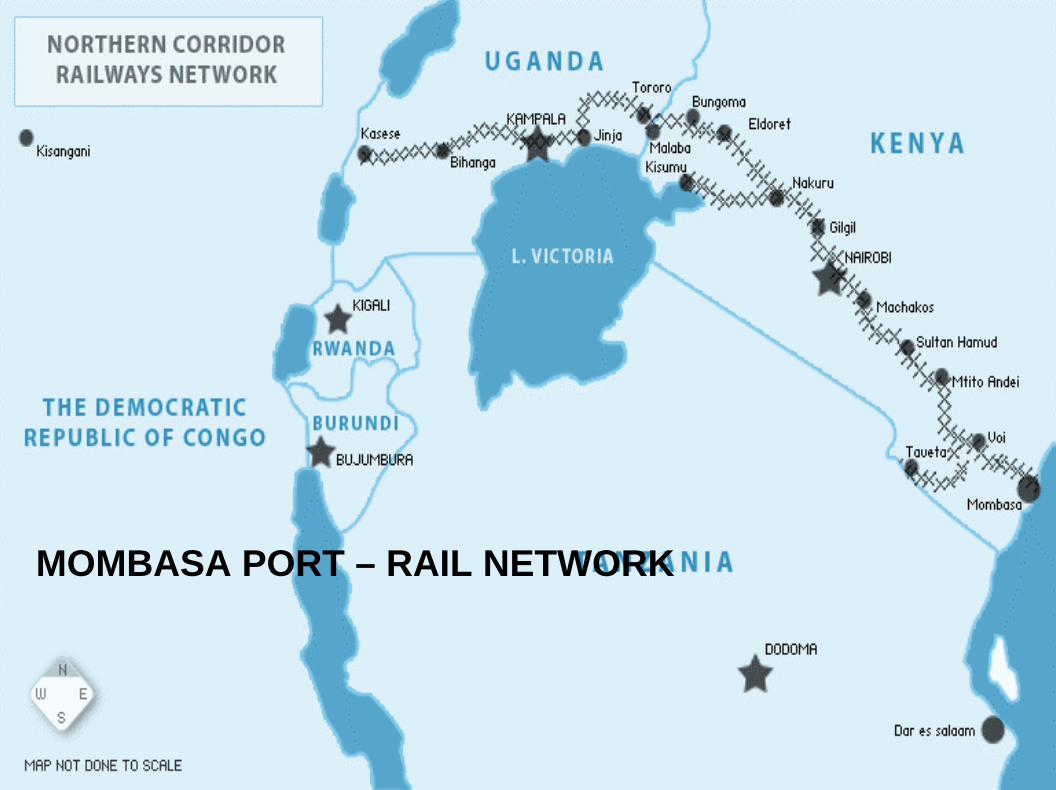
MOMBASA PORT – RAIL NETWORK
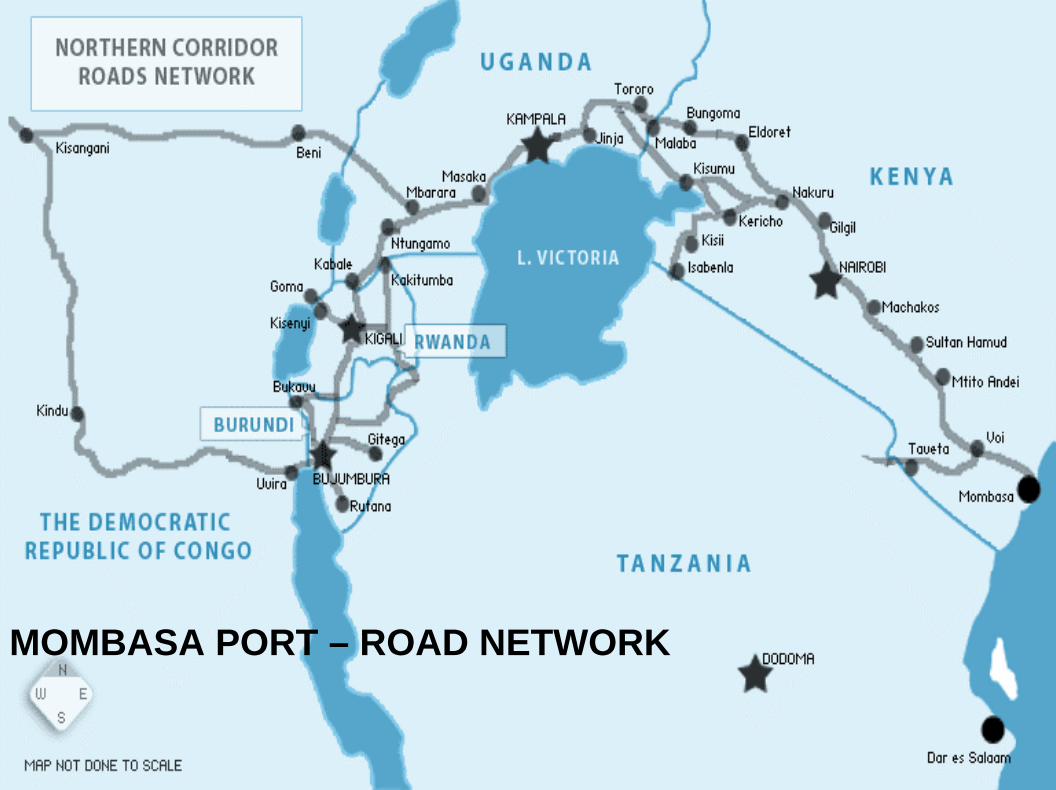
MOMBASA PORT – ROAD NETWORK
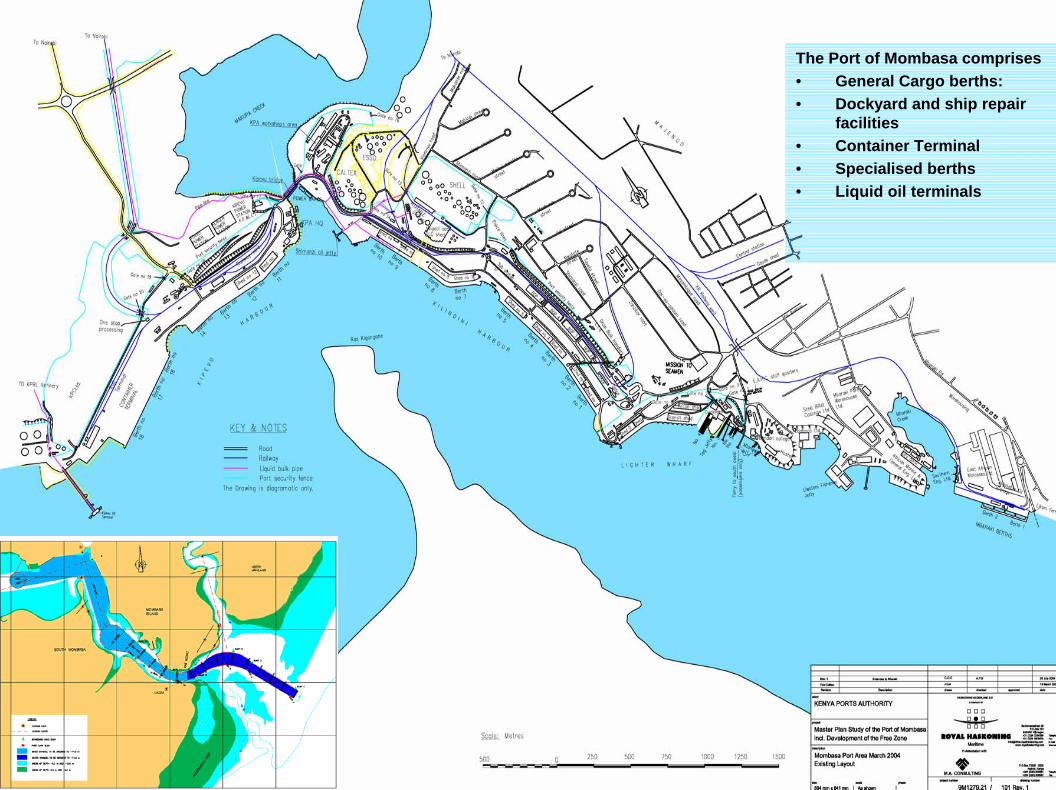
The Port of Mombasa comprises• General Cargo berths:• Dockyard and ship repair
facilities• Container Terminal• Specialised berths• Liquid oil terminals
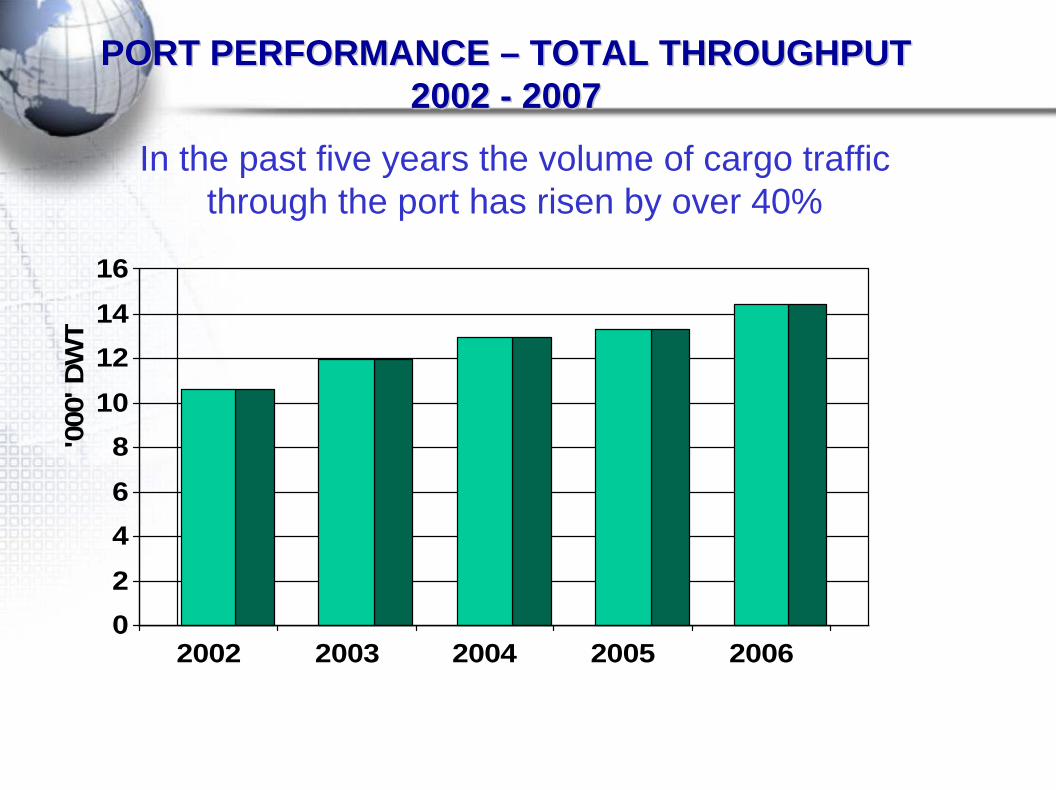
PORT PERFORMANCE PORT PERFORMANCE –– TOTAL THROUGHPUT TOTAL THROUGHPUT 2002 2002 -- 20072007
02468
10121416
2002 2003 2004 2005 2006
'000
' DW
T
In the past five years the volume of cargo traffic through the port has risen by over 40%
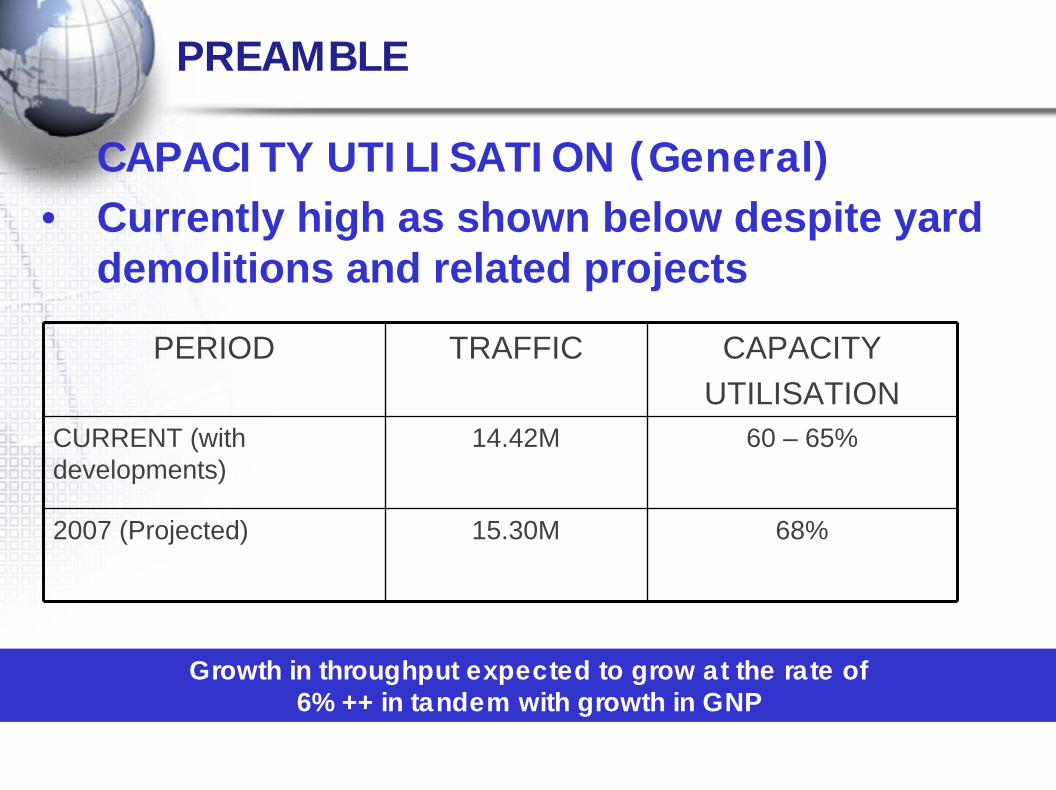
PREAMBLE
CAPACITY UTILISATION (General)• Currently high as shown below despite yard
demolitions and related projects
PERIOD TRAFFIC CAPACITYUTILISATION
CURRENT (with developments)
14.42M 60 – 65%
2007 (Projected) 15.30M 68%
Growth in throughput expected to grow at the rate of 6% ++ in tandem with growth in GNP
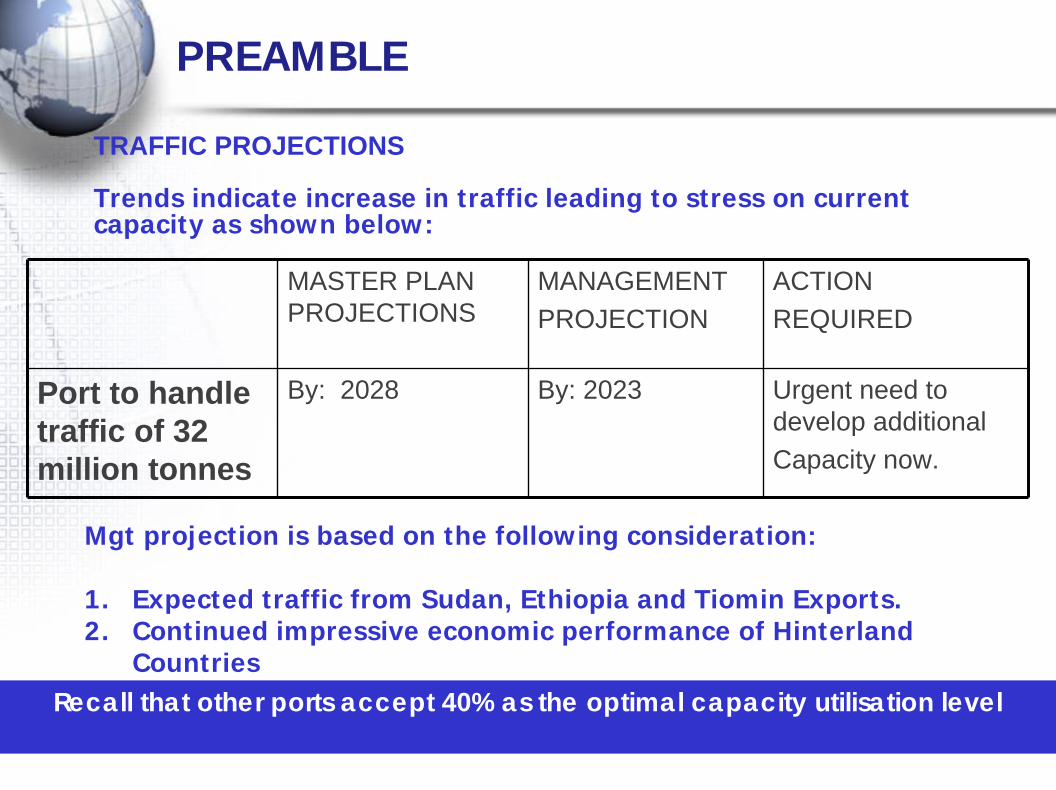
PREAMBLE
TRAFFIC PROJECTIONS
Trends indicate increase in traffic leading to stress on currentcapacity as shown below:
MASTER PLAN PROJECTIONS
MANAGEMENTPROJECTION
ACTIONREQUIRED
Port to handle traffic of 32 million tonnes
By: 2028 By: 2023 Urgent need to develop additionalCapacity now.
Recall that other ports accept 40% as the optimal capacity utilisation level
Mgt projection is based on the following consideration:
1. Expected traffic from Sudan, Ethiopia and Tiomin Exports. 2. Continued impressive economic performance of Hinterland
Countries
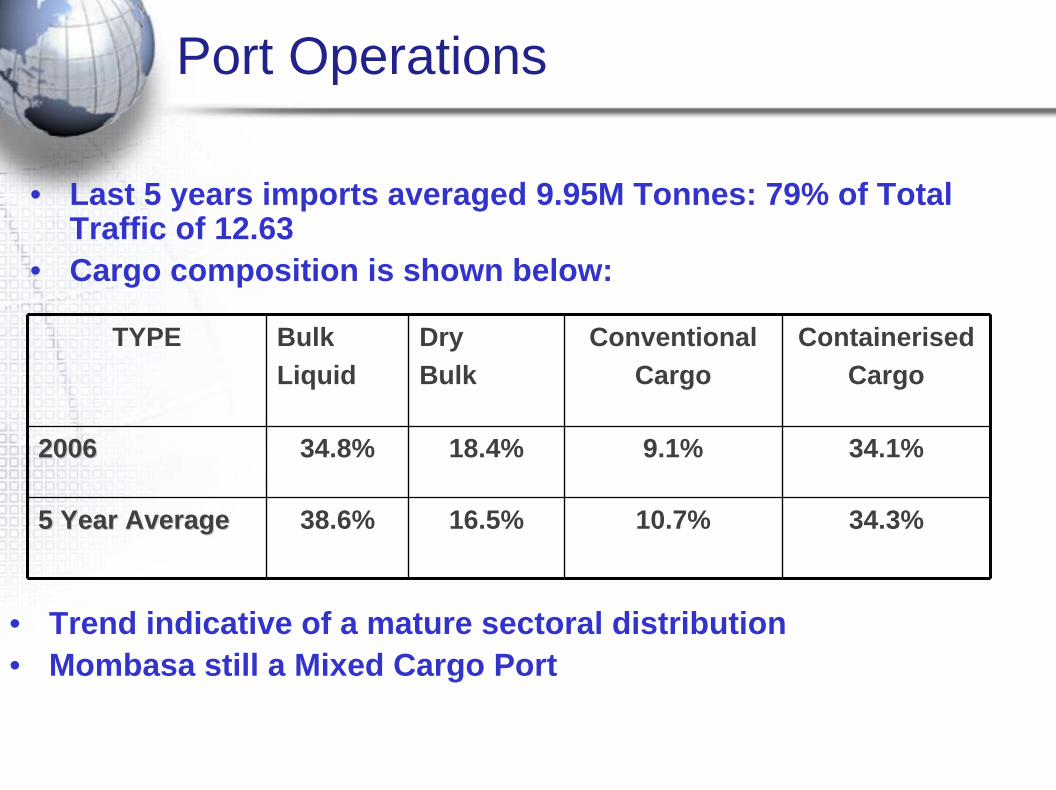
Port Operations
• Trend indicative of a mature sectoral distribution• Mombasa still a Mixed Cargo Port
TYPE BulkLiquid
DryBulk
ConventionalCargo
ContainerisedCargo
20062006 34.8% 18.4% 9.1% 34.1%
5 Year Average5 Year Average 38.6% 16.5% 10.7% 34.3%
• Last 5 years imports averaged 9.95M Tonnes: 79% of Total Traffic of 12.63
• Cargo composition is shown below:
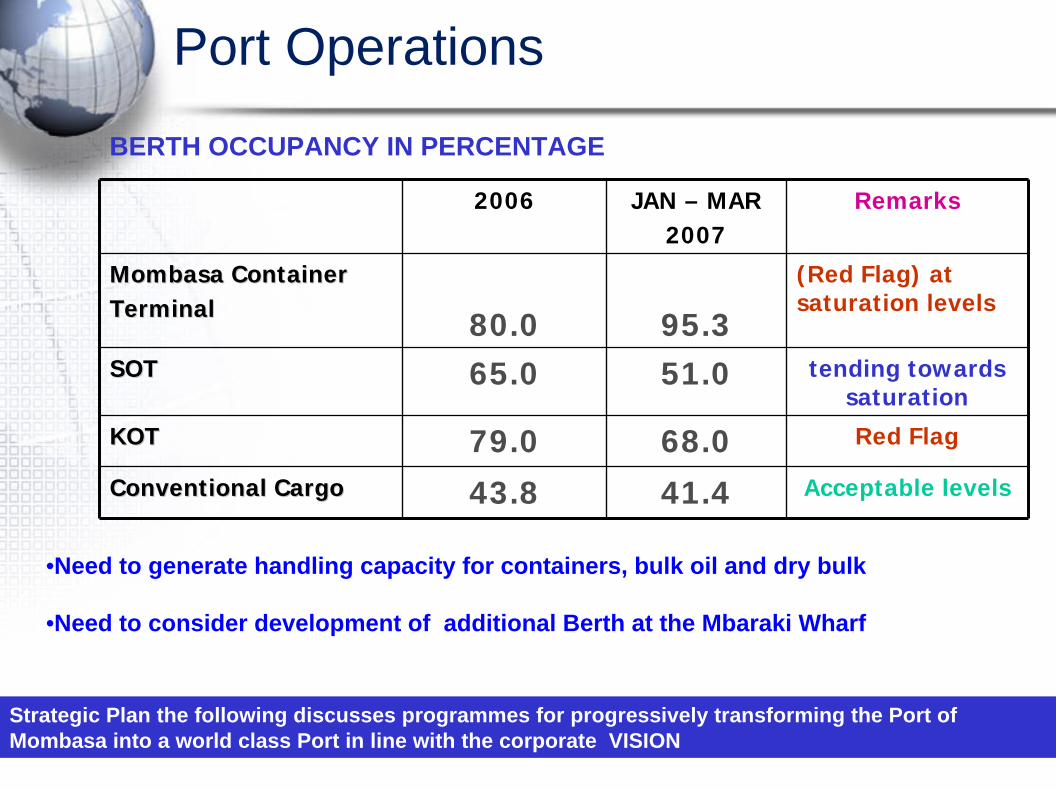
Port Operations
2006 JAN – MAR2007
Remarks
Mombasa ContainerMombasa ContainerTerminalTerminal 80.0 95.3
(Red Flag) at saturation levels
SOTSOT 65.0 51.0 tending towards saturation
KOTKOT 79.0 68.0 Red Flag
Conventional CargoConventional Cargo 43.8 41.4 Acceptable levels
BERTH OCCUPANCY IN PERCENTAGE
•Need to generate handling capacity for containers, bulk oil and dry bulk
•Need to consider development of additional Berth at the Mbaraki Wharf
Strategic Plan the following discusses programmes for progressively transforming the Port of Mombasa into a world class Port in line with the corporate VISION
• MEASURES PUT IN PLACE TO IMPROVE PERFORMANCE
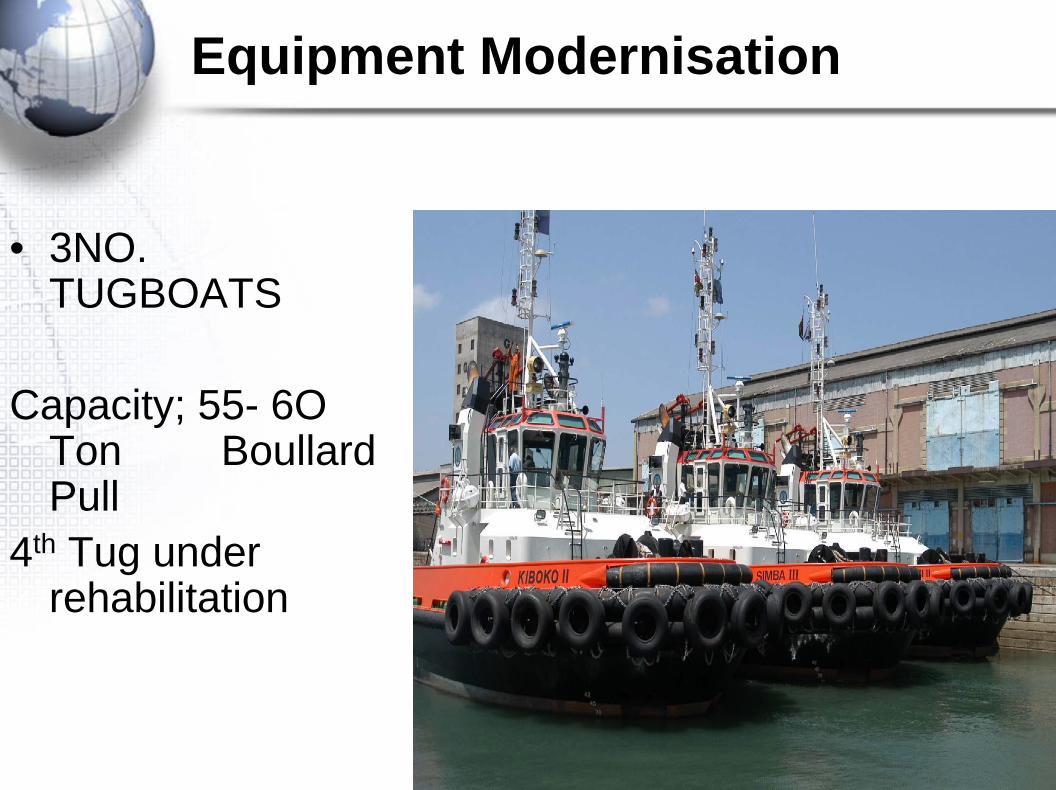
Equipment Modernisation
• 3NO. TUGBOATS
Capacity; 55- 6O Ton BoullardPull
4th Tug under rehabilitation
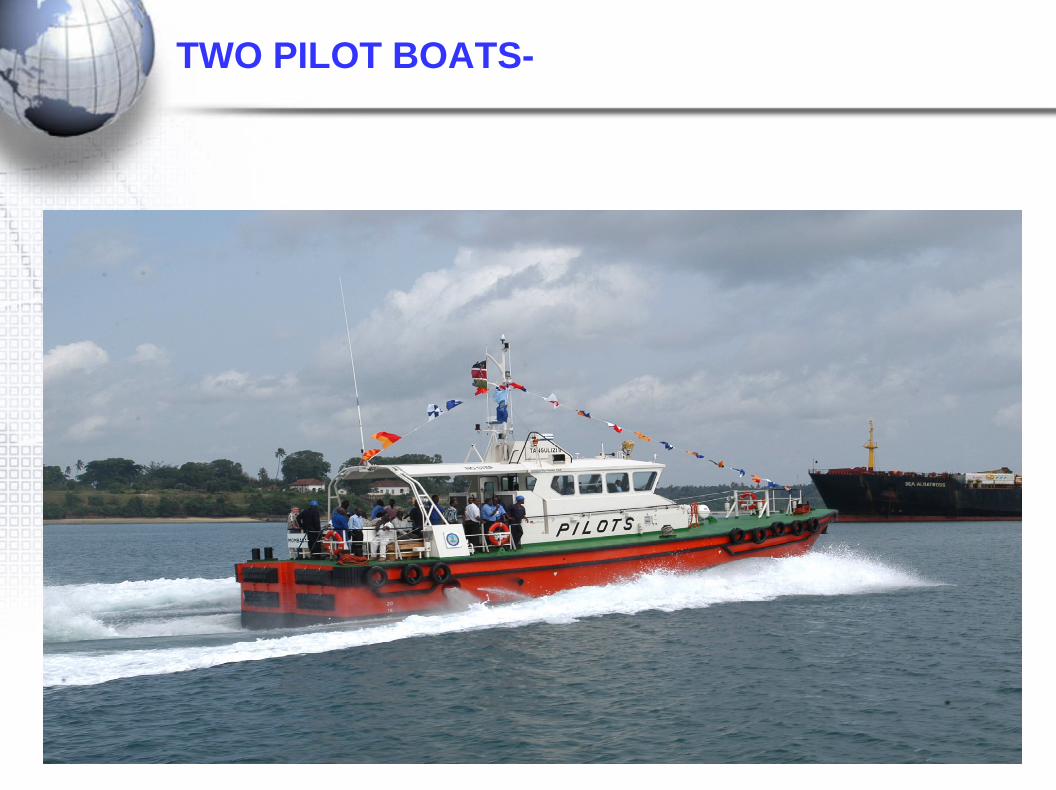
TWO PILOT BOATS-
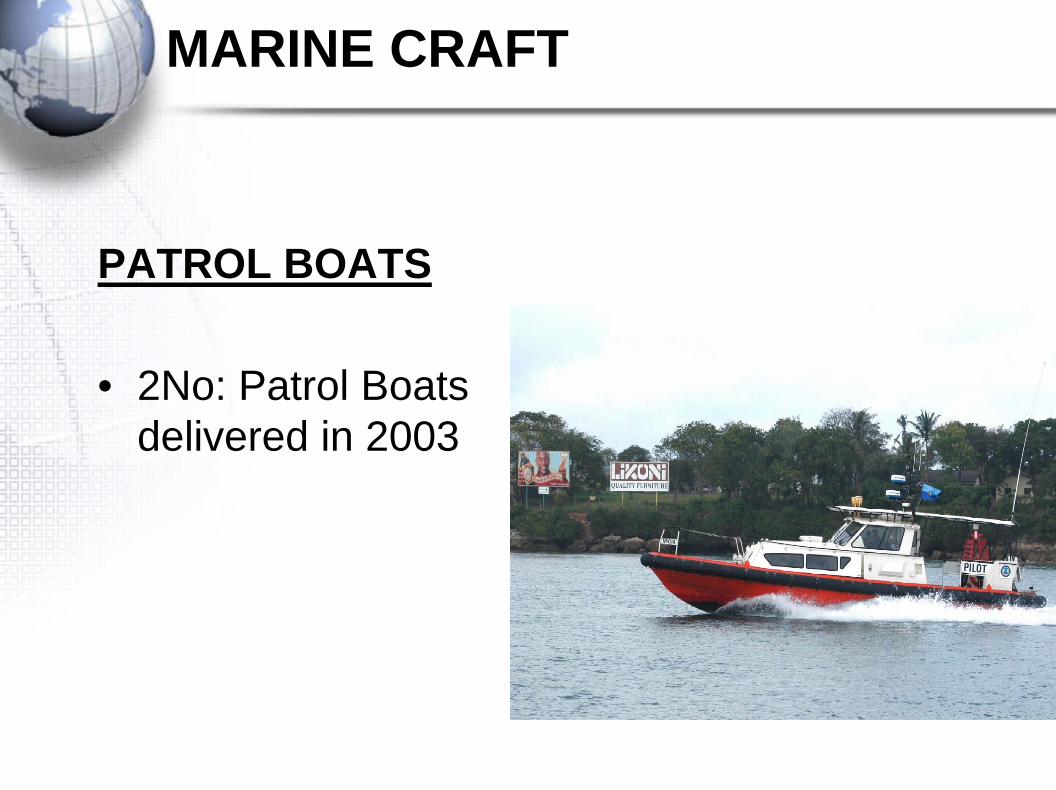
MARINE CRAFT
PATROL BOATS
• 2No: Patrol Boats delivered in 2003
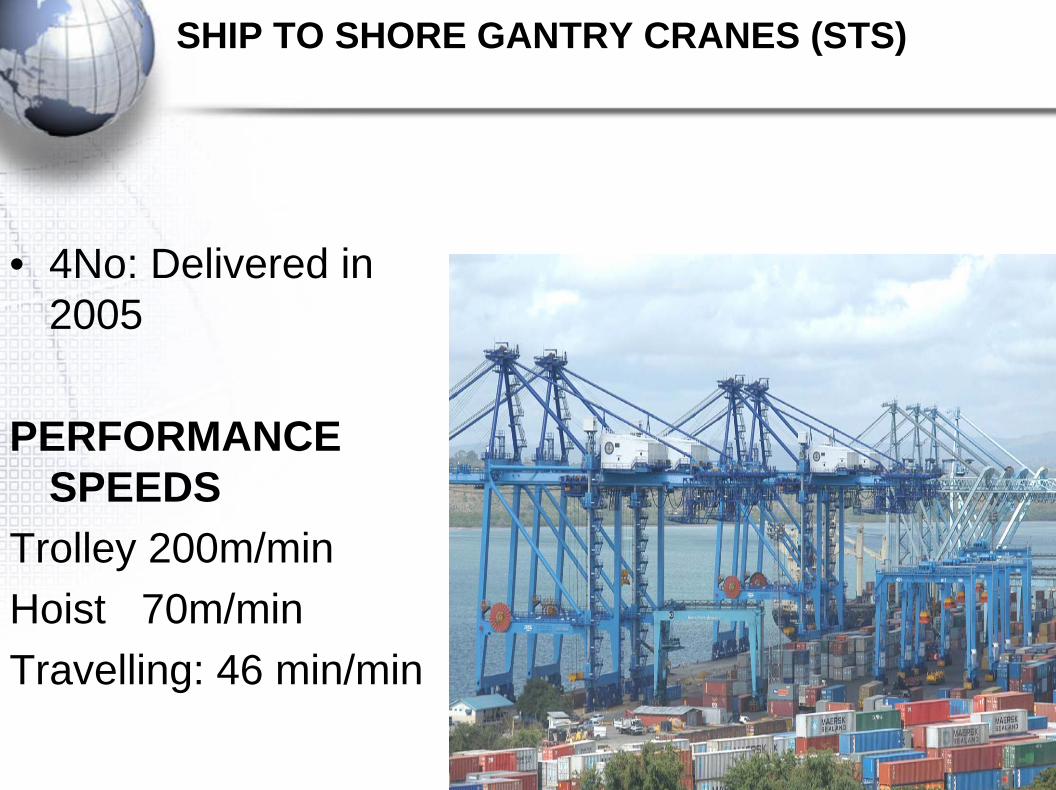
SHIP TO SHORE GANTRY CRANES (STS)
• 4No: Delivered in 2005
PERFORMANCE SPEEDS
Trolley 200m/minHoist 70m/minTravelling: 46 min/min
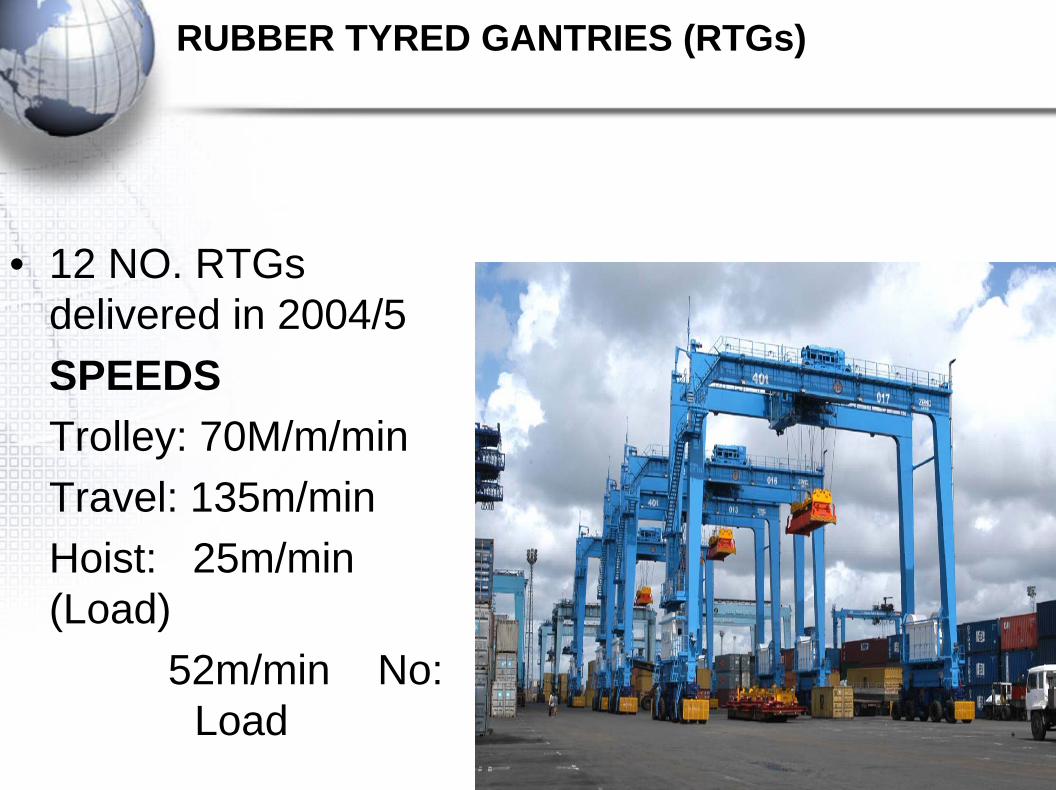
RUBBER TYRED GANTRIES (RTGs)
• 12 NO. RTGs delivered in 2004/5SPEEDSTrolley: 70M/m/minTravel: 135m/minHoist: 25m/min (Load)
52m/min No: Load
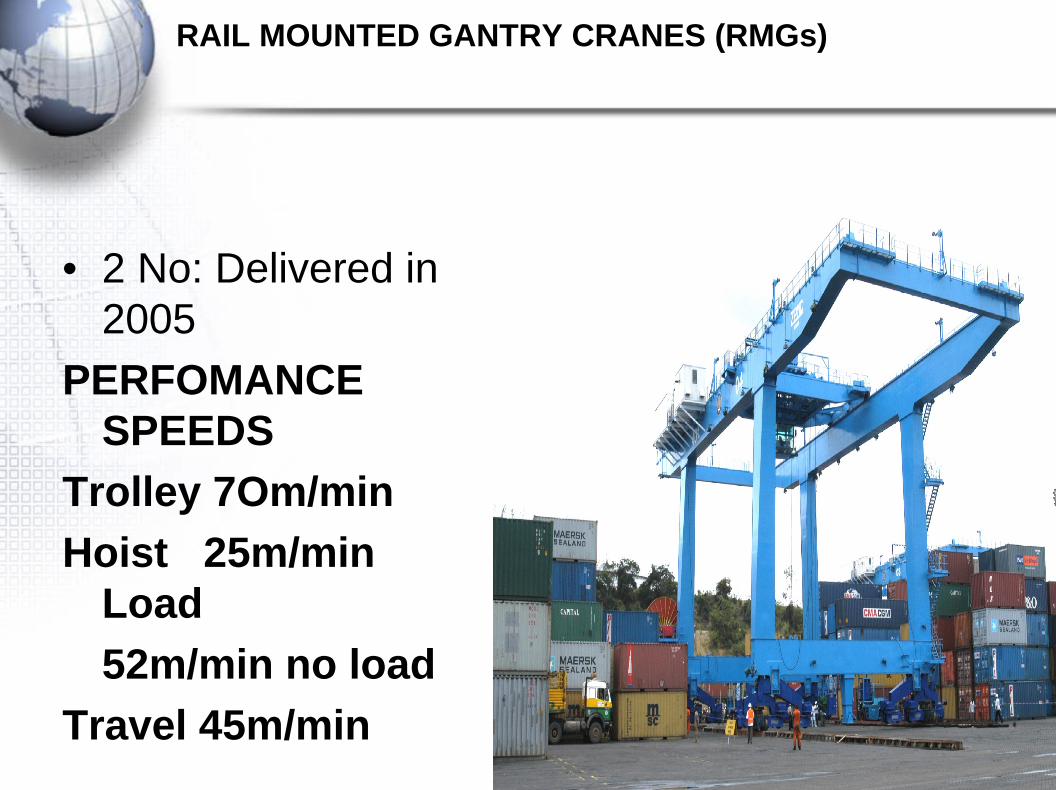
RAIL MOUNTED GANTRY CRANES (RMGs)
• 2 No: Delivered in 2005
PERFOMANCE SPEEDS
Trolley 7Om/minHoist 25m/min
Load52m/min no load
Travel 45m/min
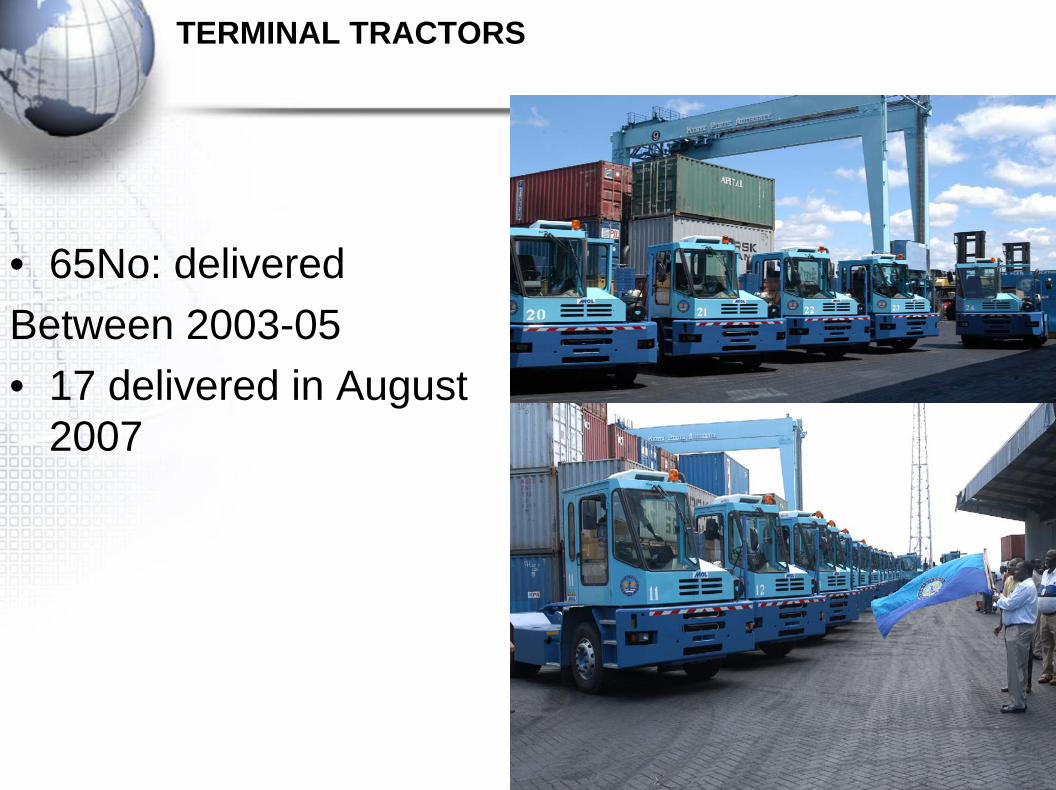
TERMINAL TRACTORS
• 65No: deliveredBetween 2003-05• 17 delivered in August
2007
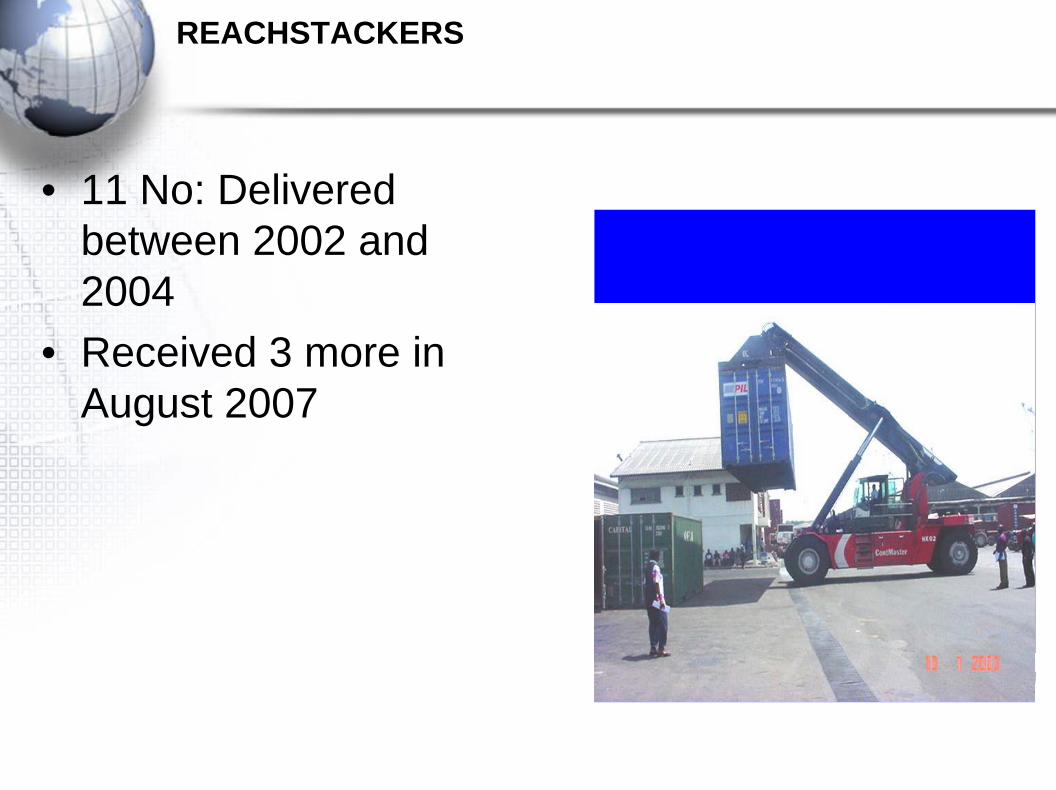
REACHSTACKERS
• 11 No: Delivered between 2002 and 2004
• Received 3 more in August 2007
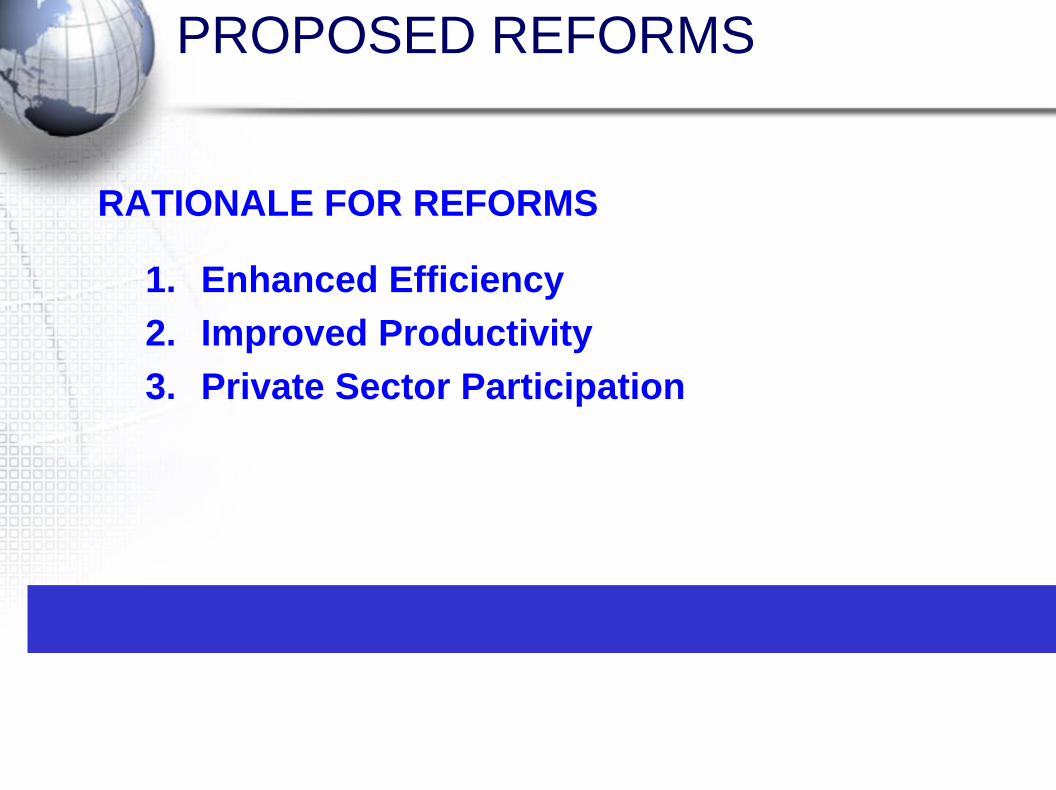
PROPOSED REFORMS
RATIONALE FOR REFORMS
1. Enhanced Efficiency2. Improved Productivity3. Private Sector Participation
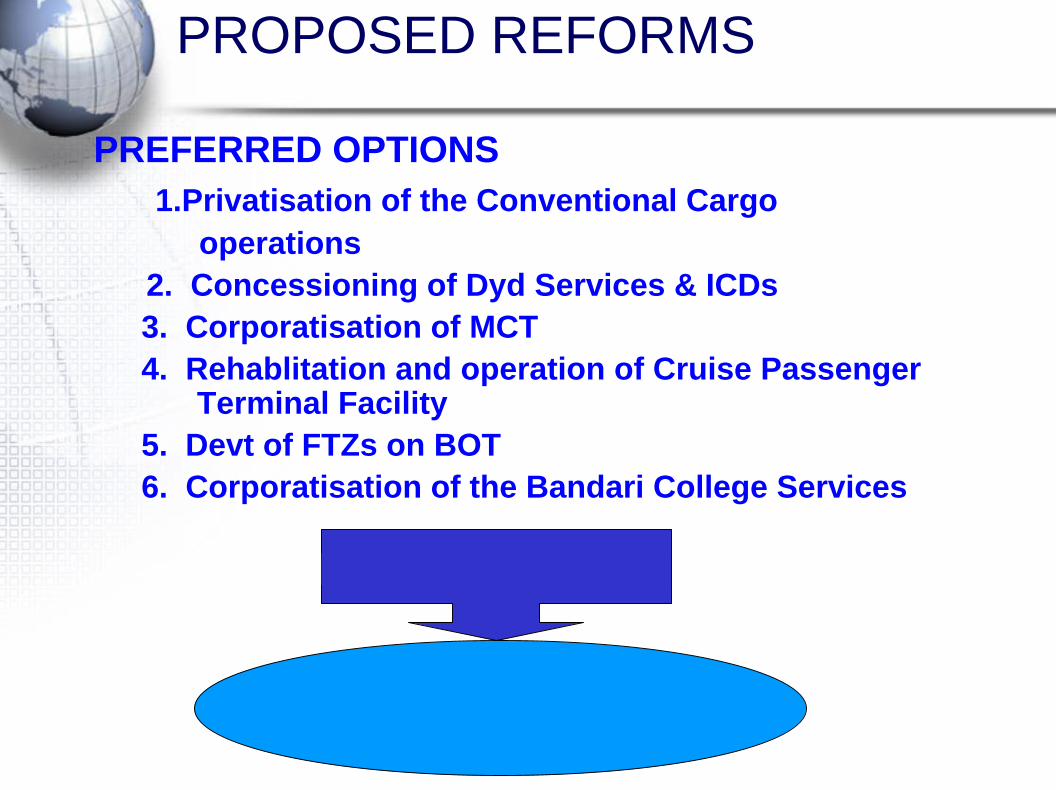
PROPOSED REFORMS
PREFERRED OPTIONS1.Privatisation of the Conventional Cargo
operations2. Concessioning of Dyd Services & ICDs3. Corporatisation of MCT 4. Rehablitation and operation of Cruise Passenger
Terminal Facility5. Devt of FTZs on BOT6. Corporatisation of the Bandari College Services
Approved Actions by the Board were to be implemented. A review on Progress follows
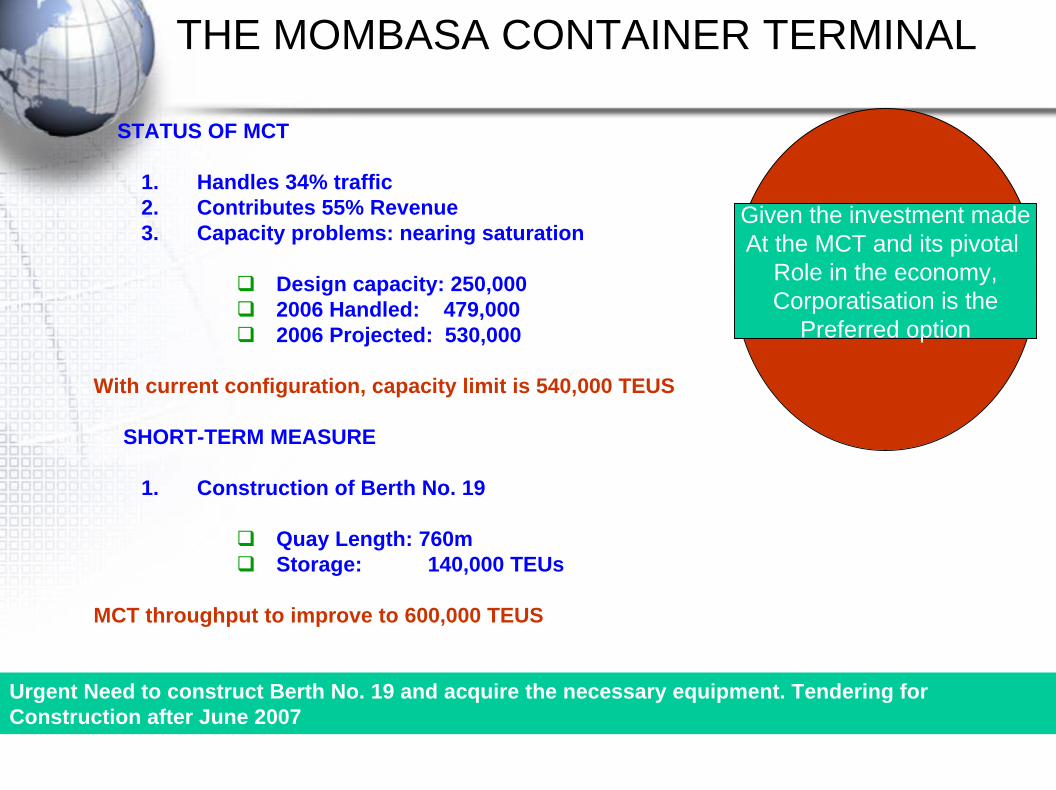
THE MOMBASA CONTAINER TERMINAL
STATUS OF MCT
1. Handles 34% traffic2. Contributes 55% Revenue3. Capacity problems: nearing saturation
Design capacity: 250,000 2006 Handled: 479,000 2006 Projected: 530,000
With current configuration, capacity limit is 540,000 TEUS
SHORT-TERM MEASURE
1. Construction of Berth No. 19
Quay Length: 760mStorage: 140,000 TEUs
MCT throughput to improve to 600,000 TEUS
Urgent Need to construct Berth No. 19 and acquire the necessary equipment. Tendering for Construction after June 2007
Given the investment madeAt the MCT and its pivotal
Role in the economy,Corporatisation is the
Preferred option
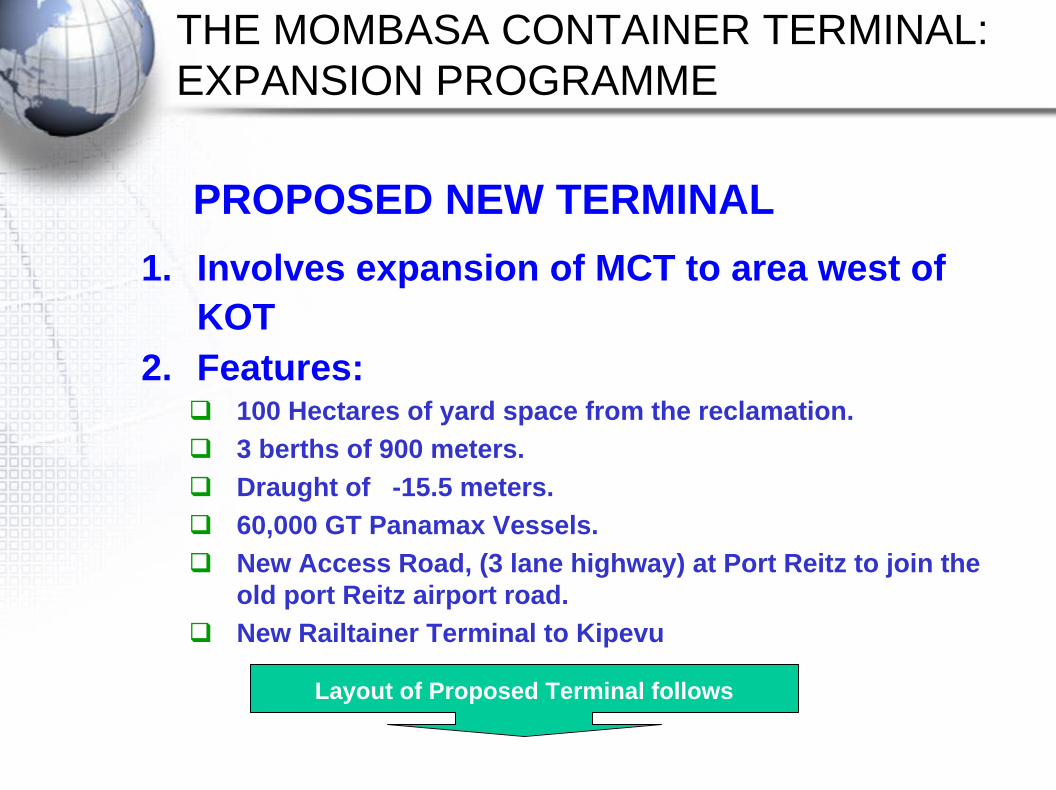
THE MOMBASA CONTAINER TERMINAL:EXPANSION PROGRAMME
PROPOSED NEW TERMINAL1. Involves expansion of MCT to area west of
KOT2. Features:
100 Hectares of yard space from the reclamation.3 berths of 900 meters.Draught of -15.5 meters.60,000 GT Panamax Vessels.New Access Road, (3 lane highway) at Port Reitz to join the old port Reitz airport road. New Railtainer Terminal to Kipevu
Layout of Proposed Terminal follows
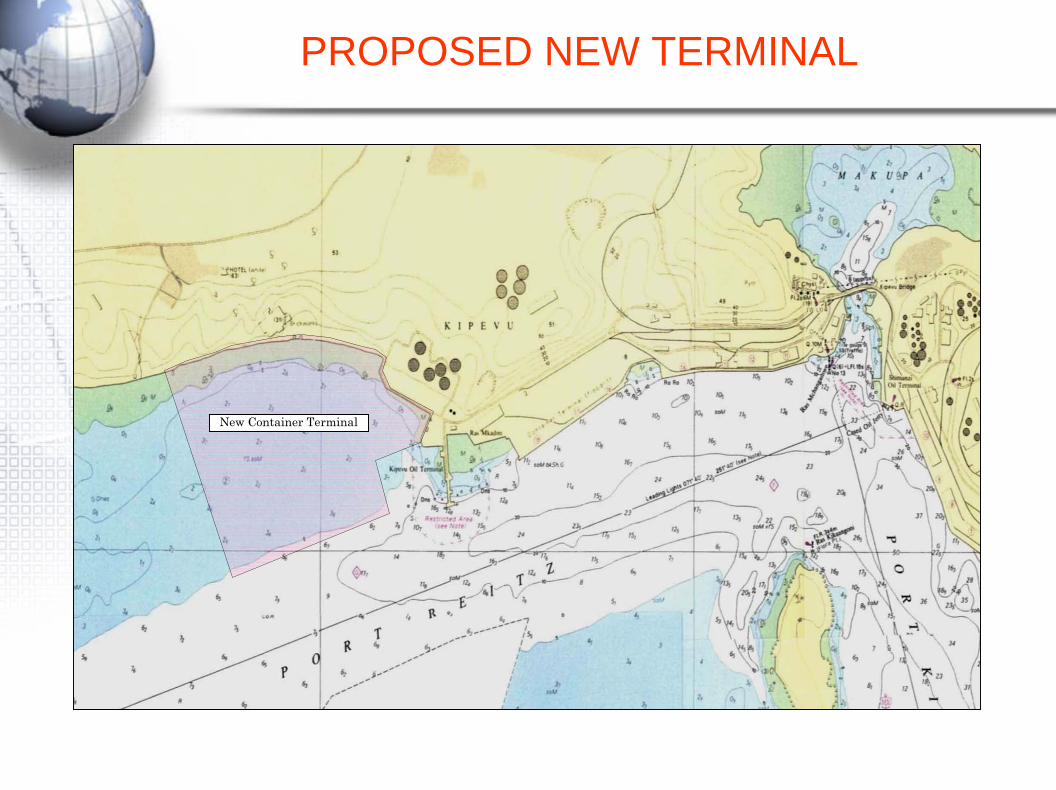
New Container Terminal
PROPOSED NEW TERMINAL
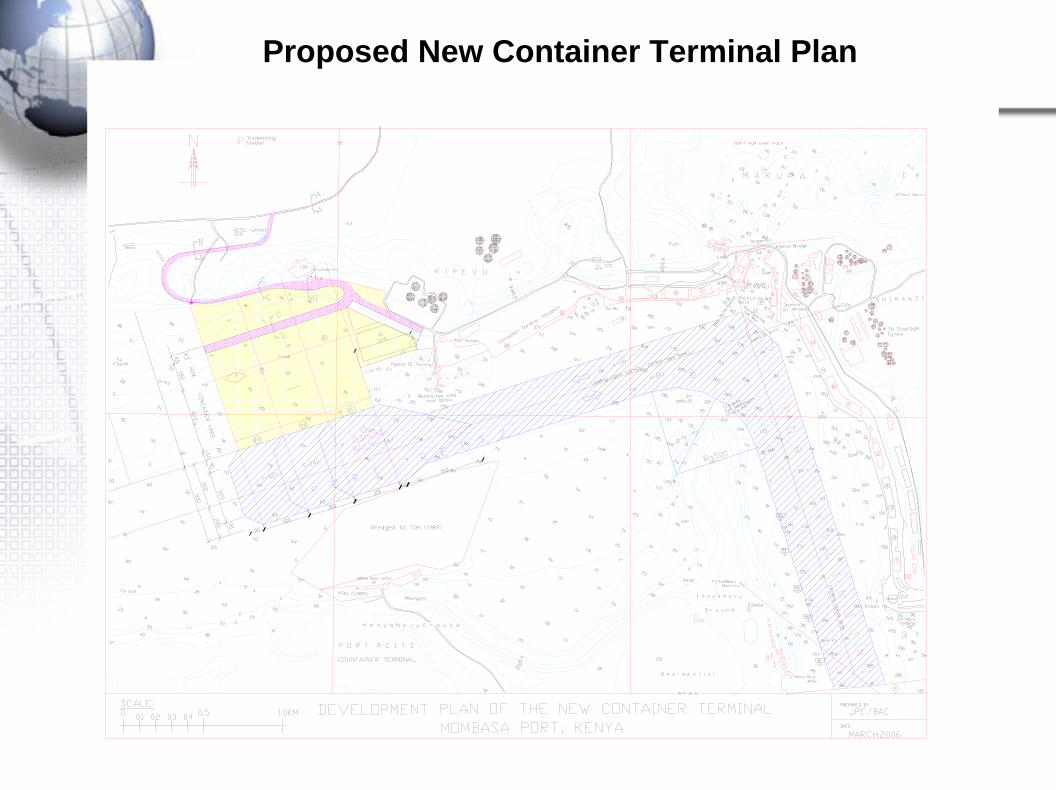
Proposed New Container Terminal Plan
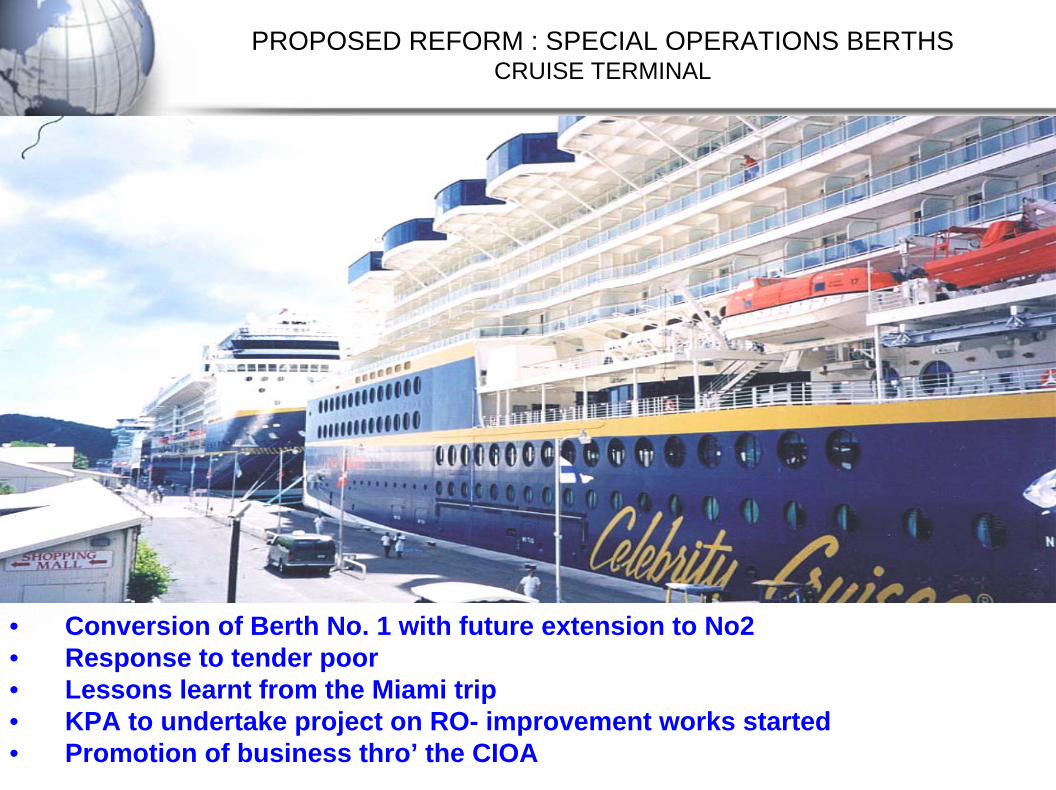
PROPOSED REFORM : SPECIAL OPERATIONS BERTHSCRUISE TERMINAL
• Conversion of Berth No. 1 with future extension to No2• Response to tender poor • Lessons learnt from the Miami trip• KPA to undertake project on RO- improvement works started• Promotion of business thro’ the CIOA
CONTAINER FREIGHT STATIONS
• UNPRECEDENTED BERTH THROUGHPUT• 15,000 TEUs Daily• Licensed two CFSs to handle containers• Operations started on 1st October, 2007• Plans for transit countries to have own CFSs
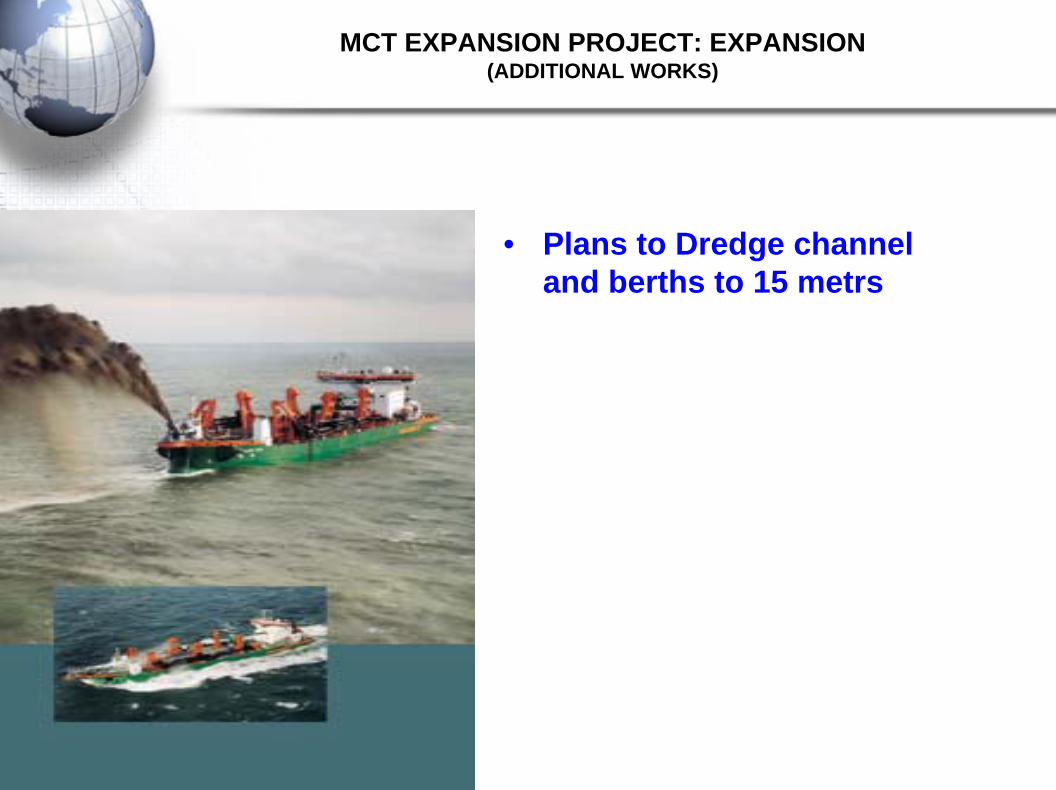
MCT EXPANSION PROJECT: EXPANSION (ADDITIONAL WORKS)
• Plans to Dredge channel and berths to 15 metrs
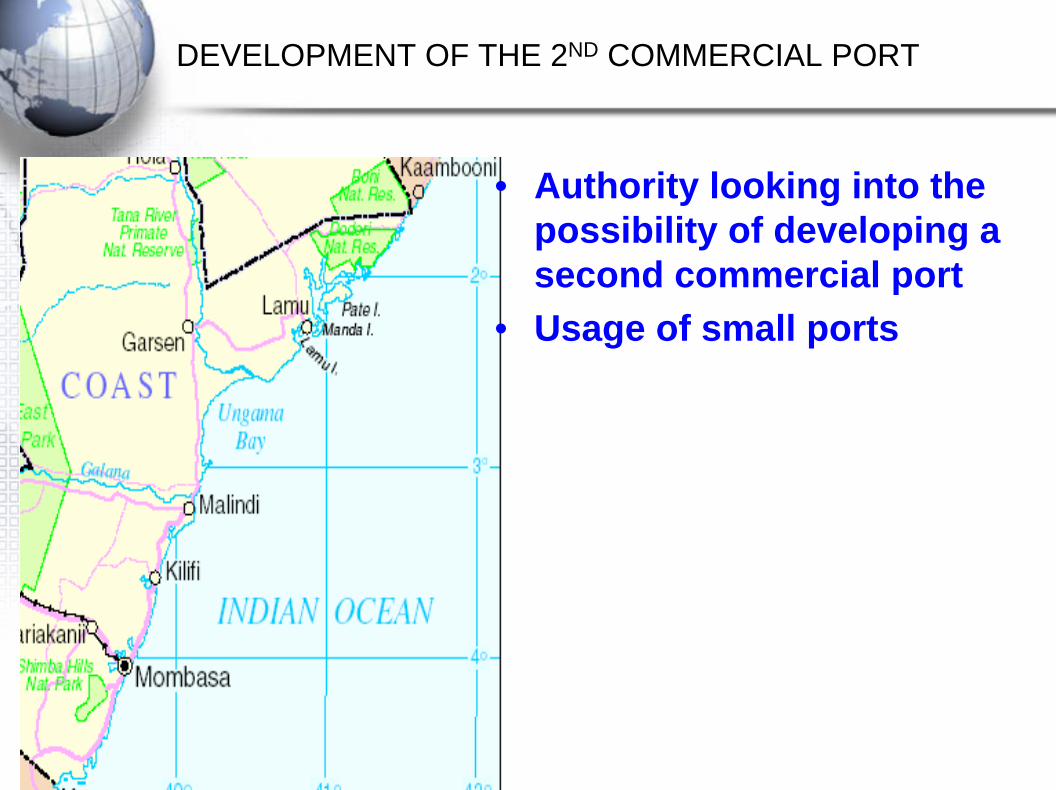
DEVELOPMENT OF THE 2ND COMMERCIAL PORT
• Authority looking into the possibility of developing a second commercial port
• Usage of small ports
•CURRENT CHALLENGES
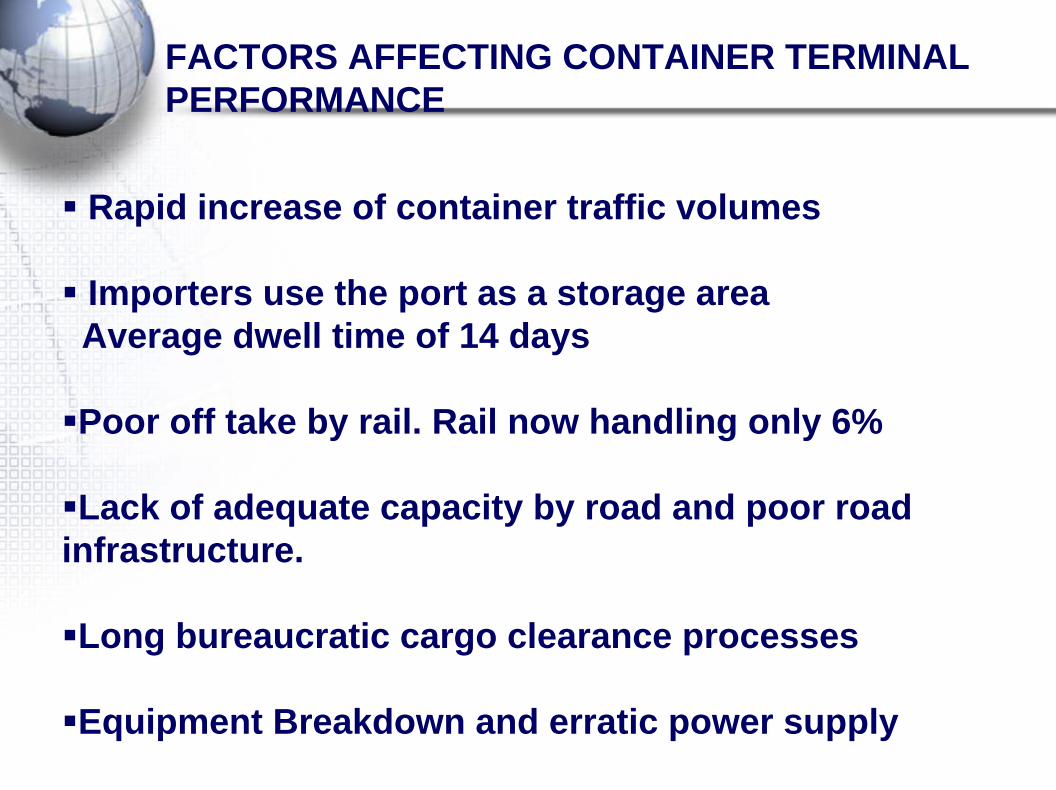
FACTORS AFFECTING CONTAINER TERMINAL PERFORMANCE
Rapid increase of container traffic volumes
Importers use the port as a storage area Average dwell time of 14 days
Poor off take by rail. Rail now handling only 6%
Lack of adequate capacity by road and poor road infrastructure.
Long bureaucratic cargo clearance processes
Equipment Breakdown and erratic power supply
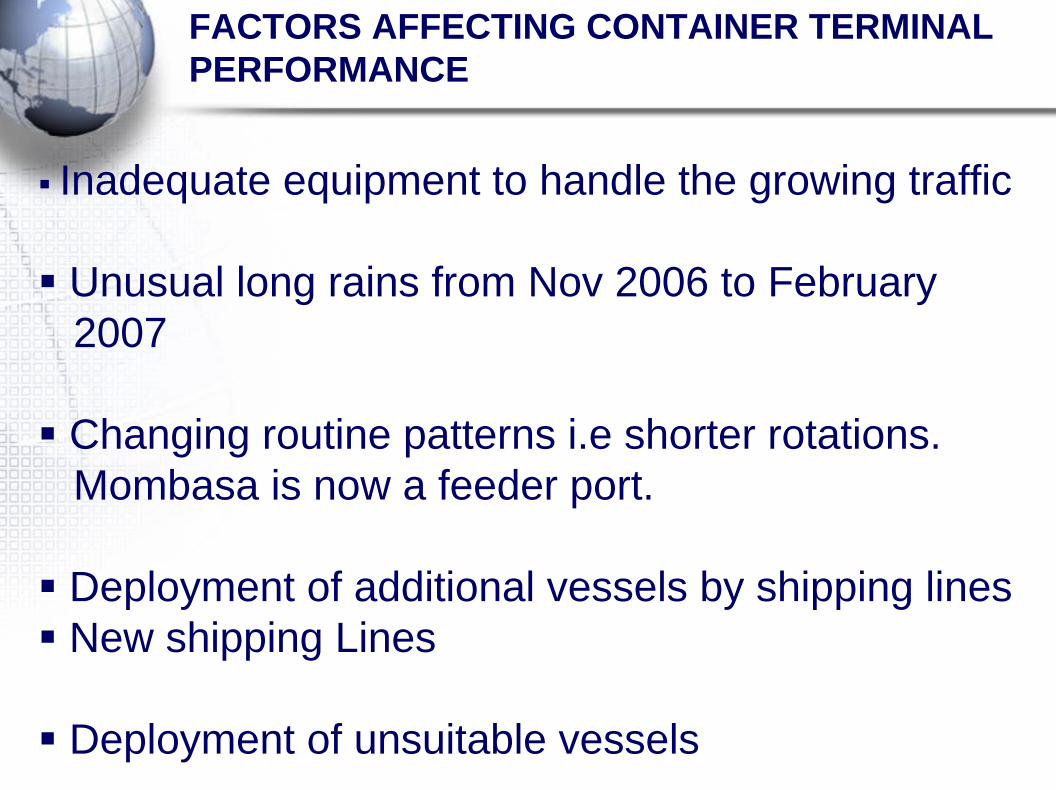
FACTORS AFFECTING CONTAINER TERMINAL PERFORMANCE
Inadequate equipment to handle the growing traffic
Unusual long rains from Nov 2006 to February 2007
Changing routine patterns i.e shorter rotations. Mombasa is now a feeder port.
Deployment of additional vessels by shipping linesNew shipping Lines
Deployment of unsuitable vessels
FACTORS AFFECTING CONTAINER TERMINAL PERFORMANCE
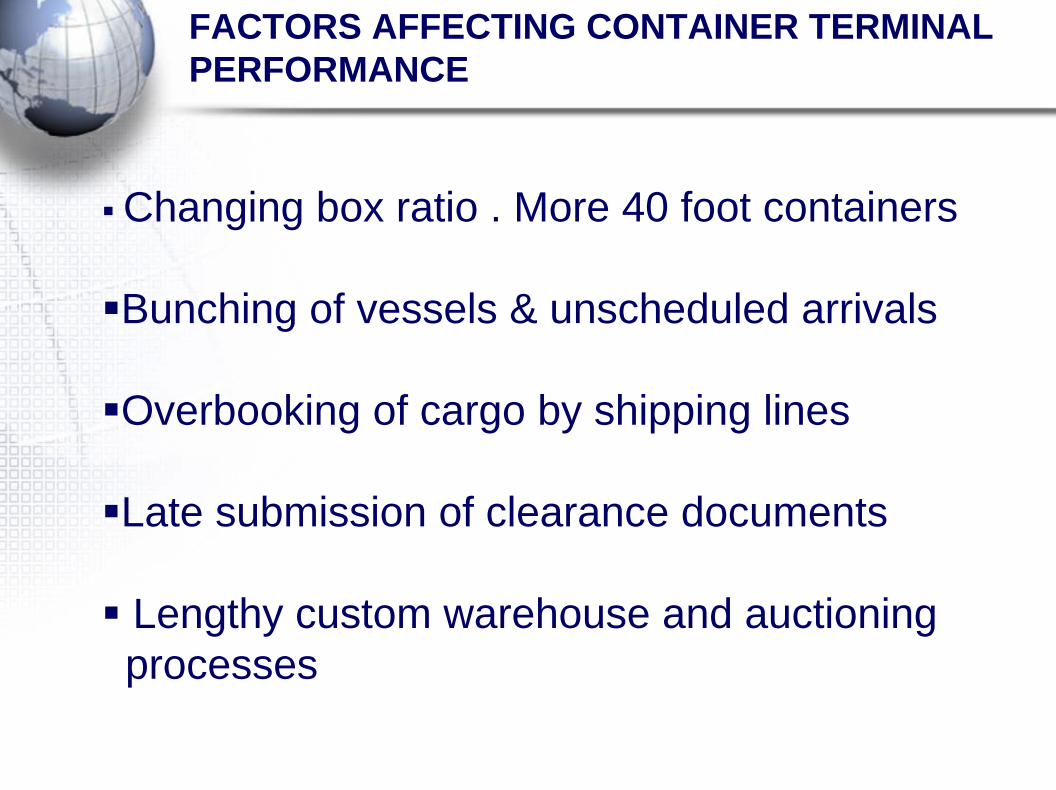
Changing box ratio . More 40 foot containers
Bunching of vessels & unscheduled arrivals
Overbooking of cargo by shipping lines
Late submission of clearance documents
Lengthy custom warehouse and auctioning processes
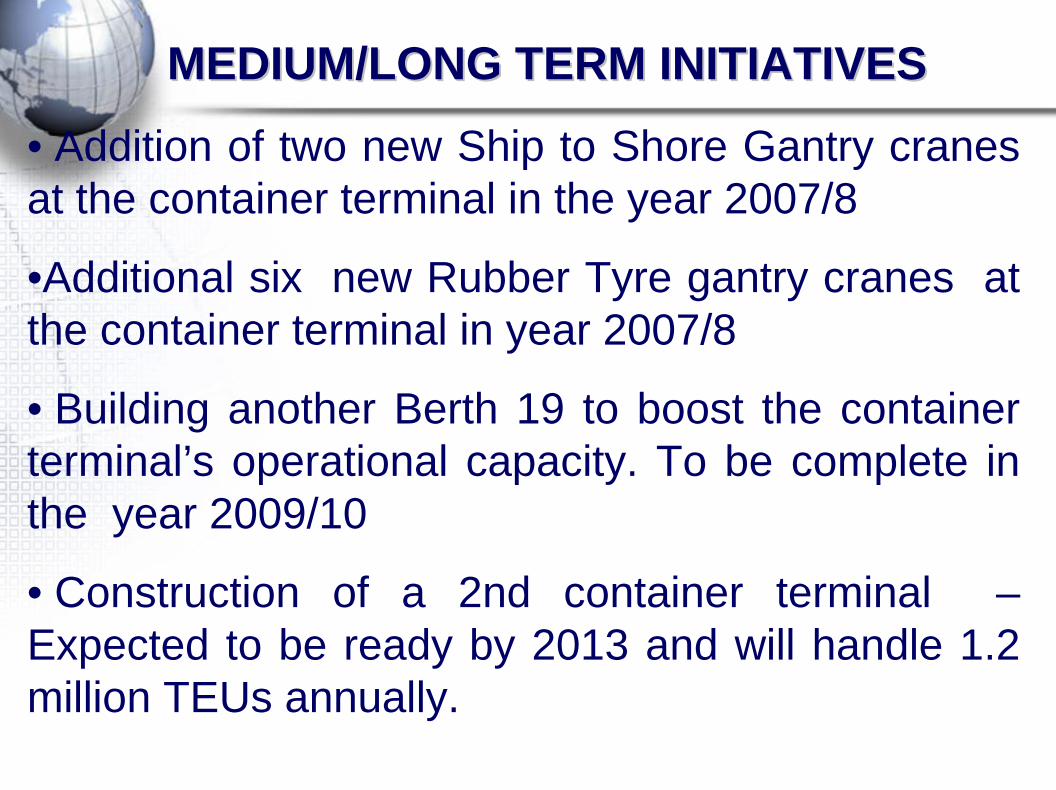
• Addition of two new Ship to Shore Gantry cranes at the container terminal in the year 2007/8
•Additional six new Rubber Tyre gantry cranes at the container terminal in year 2007/8
• Building another Berth 19 to boost the container terminal’s operational capacity. To be complete in the year 2009/10
• Construction of a 2nd container terminal –Expected to be ready by 2013 and will handle 1.2 million TEUs annually.
MEDIUM/LONG TERM INITIATIVESMEDIUM/LONG TERM INITIATIVES
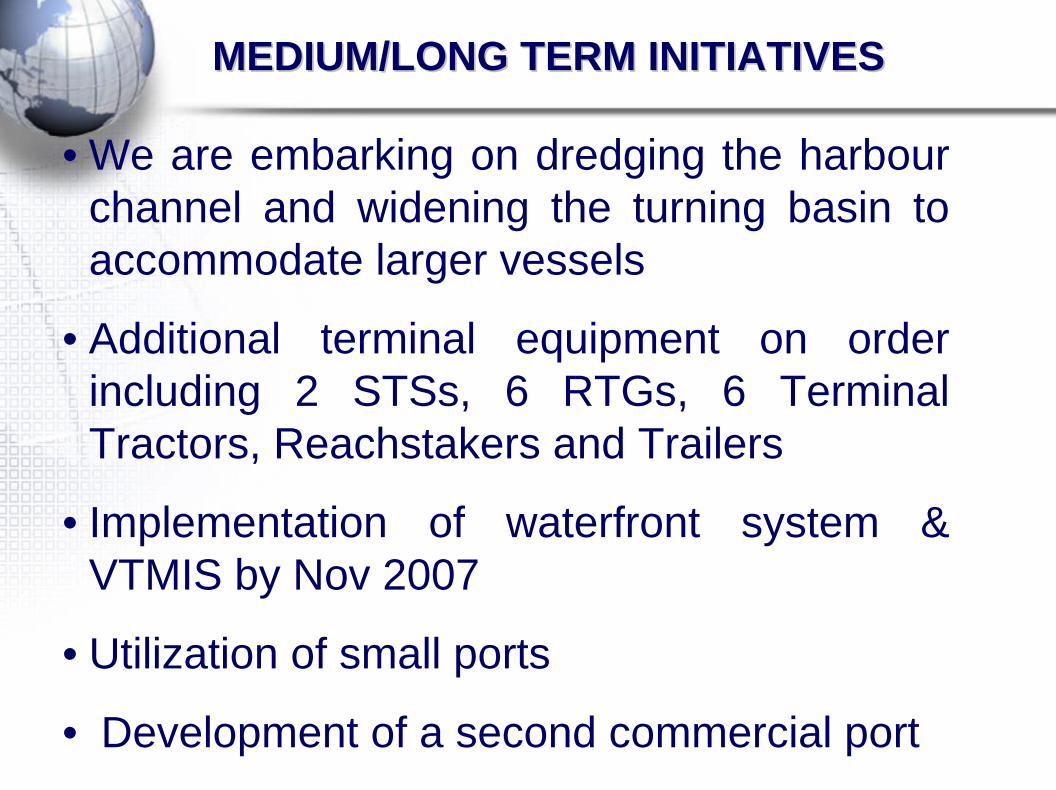
• We are embarking on dredging the harbourchannel and widening the turning basin to accommodate larger vessels
• Additional terminal equipment on order including 2 STSs, 6 RTGs, 6 Terminal Tractors, Reachstakers and Trailers
• Implementation of waterfront system & VTMIS by Nov 2007
• Utilization of small ports
• Development of a second commercial port
MEDIUM/LONG TERM INITIATIVESMEDIUM/LONG TERM INITIATIVES

END
THANK YOU
Top Related