


Languages
Pages
Legal


1
Building ProductManufacturers
2
Building Product ManufacturersOur Building Product Manufacturers clients have been able to identify their top customers, gauge housing market conditions and better align their supply chain due to our research and consulting services.
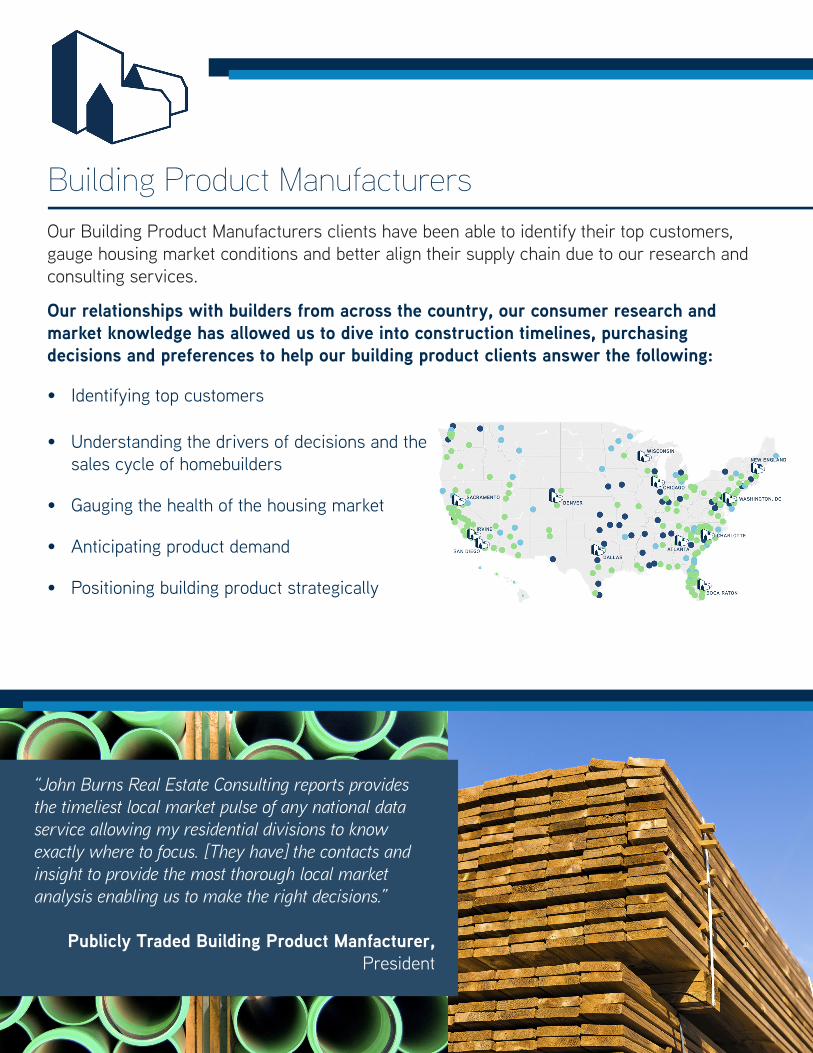
Our relationships with builders from across the country, our consumer research and market knowledge has allowed us to dive into construction timelines, purchasing decisions and preferences to help our building product clients answer the following:
• Identifying top customers
• Understanding the drivers of decisions and the sales cycle of homebuilders
• Gauging the health of the housing market
• Anticipating product demand
• Positioning building product strategically
“John Burns Real Estate Consulting reports provides the timeliest local market pulse of any national data service allowing my residential divisions to know exactly where to focus. [They have] the contacts and insight to provide the most thorough local market analysis enabling us to make the right decisions.”
Publicly Traded Building Product Manfacturer,President
3
To keep a pulse on the housing market, our US Housing Analysis and Forecast provides the following metrics on a monthly basis with 4-year forecasts:
• Single-Family and Multifamily Construction• New Home Sales• Existing Home Sales• Distressed Home Sales• Existing Home Price• Residential Repairs and Remodeling Metrics
Our Regional Analysis and Forecast will break down construction and sales forecast on a regional level along with providing insight on key MSAs across the country.
Our Consumer Insights survey helps Building Product Manufacturers understand buyers’ home preferences from exterior home elevations to interior home specifications.Thesurveyallowmanufacturerstobetterpositiontheirproductfortoday’s trends.
“For several years now I have relied on John and his team to provide timely and accurate research on the housing market. JBREC analysis has proven to be invaluable as we plan our business”
Publicly Traded Building Product Manfacturer,President
4
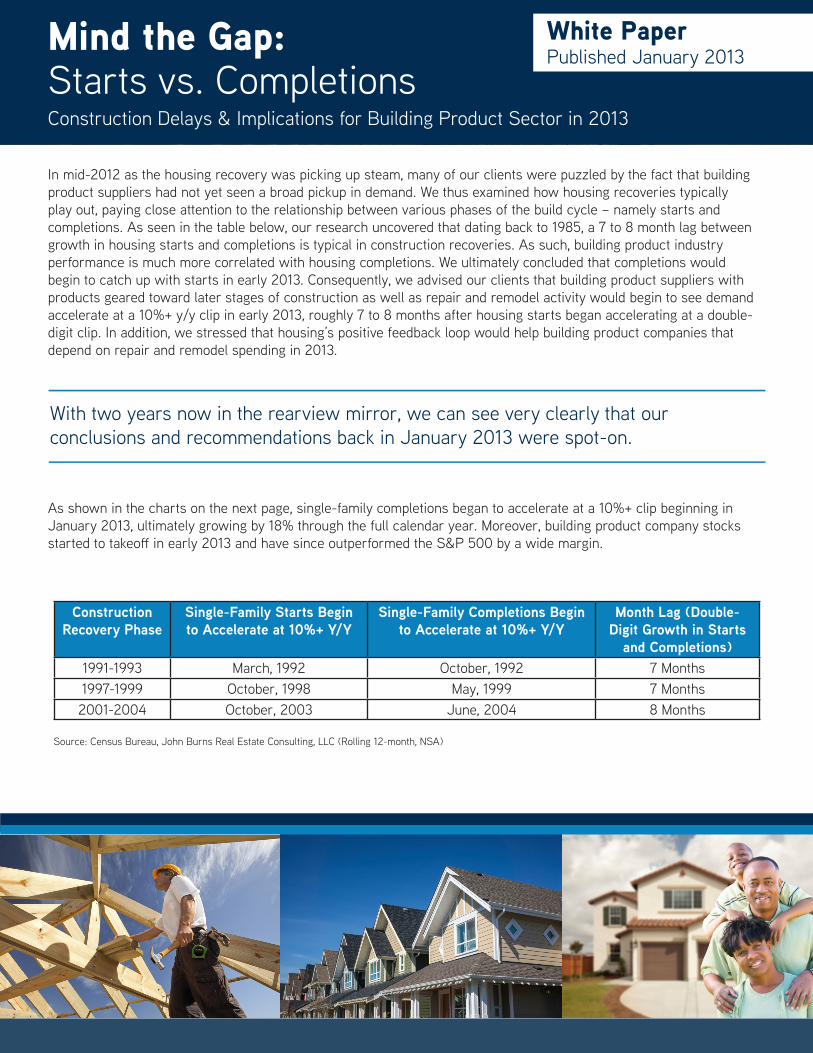
Mind the Gap:Starts vs. CompletionsConstruction Delays & Implications for Building Product Sector in 2013
White PaperPublished January 2013
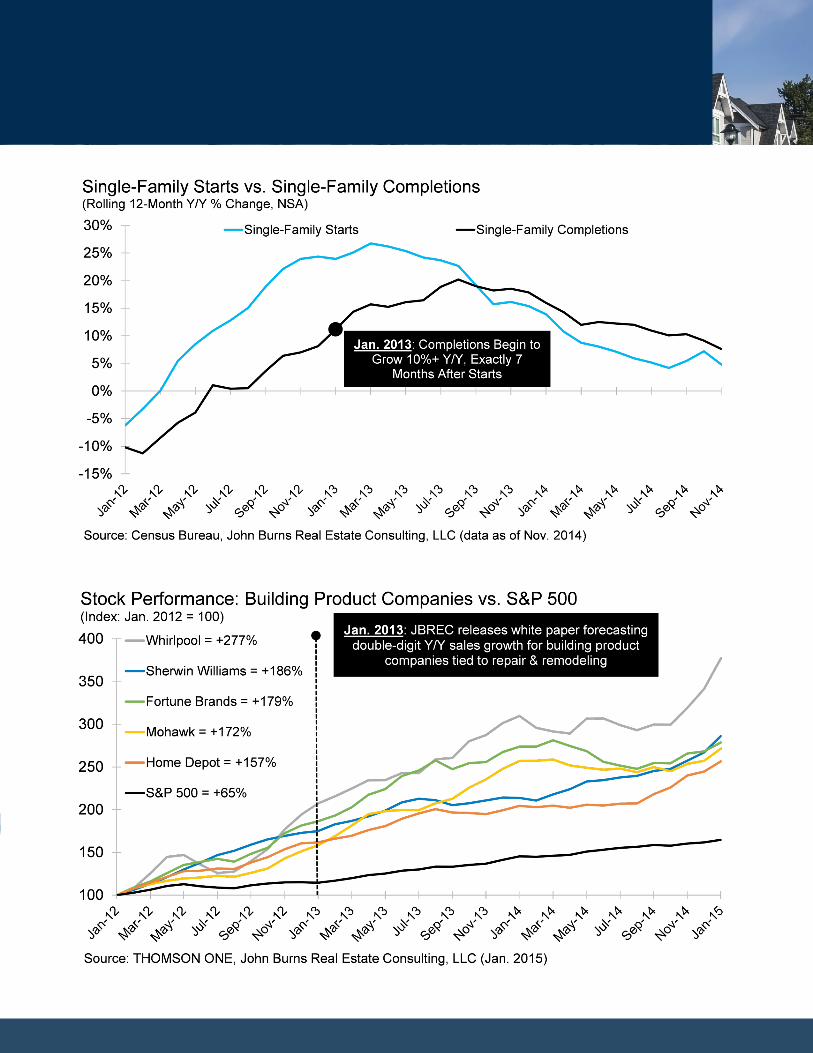
In mid-2012 as the housing recovery was picking up steam, many of our clients were puzzled by the fact that building product suppliers had not yet seen a broad pickup in demand. We thus examined how housing recoveries typically play out, paying close attention to the relationship between various phases of the build cycle – namely starts and completions. As seen in the table below, our research uncovered that dating back to 1985, a 7 to 8 month lag between growth in housing starts and completions is typical in construction recoveries. As such, building product industry performance is much more correlated with housing completions. We ultimately concluded that completions would begin to catch up with starts in early 2013. Consequently, we advised our clients that building product suppliers with products geared toward later stages of construction as well as repair and remodel activity would begin to see demand accelerate at a 10%+ y/y clip in early 2013, roughly 7 to 8 months after housing starts began accelerating at a double-digit clip. In addition, we stressed that housing’s positive feedback loop would help building product companies that depend on repair and remodel spending in 2013.
As shown in the charts on the next page, single-family completions began to accelerate at a 10%+ clip beginning in January 2013, ultimately growing by 18% through the full calendar year. Moreover, building product company stocks startedtotakeoffinearly2013andhavesinceoutperformedtheS&P500byawidemargin.
ConstructionRecovery Phase
Single-Family Starts Beginto Accelerate at 10%+ Y/Y
Single-Family Completions Begin to Accelerate at 10%+ Y/Y
Month Lag (Double-Digit Growth in Starts
and Completions)1991-1993 March, 1992 October, 1992 7 Months1997-1999 October, 1998 May, 1999 7 Months2001-2004 October, 2003 June, 2004 8 Months
Source: Census Bureau, John Burns Real Estate Consulting, LLC (Rolling 12-month, NSA)
With two years now in the rearview mirror, we can see very clearly that our conclusions and recommendations back in January 2013 were spot-on.
5
White PaperPublished January 2013

6
SAM
PLE
US H
OUSI
NG A
NALY
SIS
AND
FORE
CAST
SAMPLE REPORT

7
SAMPLE REGIONAL ANALYSIS AND FORECAST
SAM
PLE
REPO
RT
8
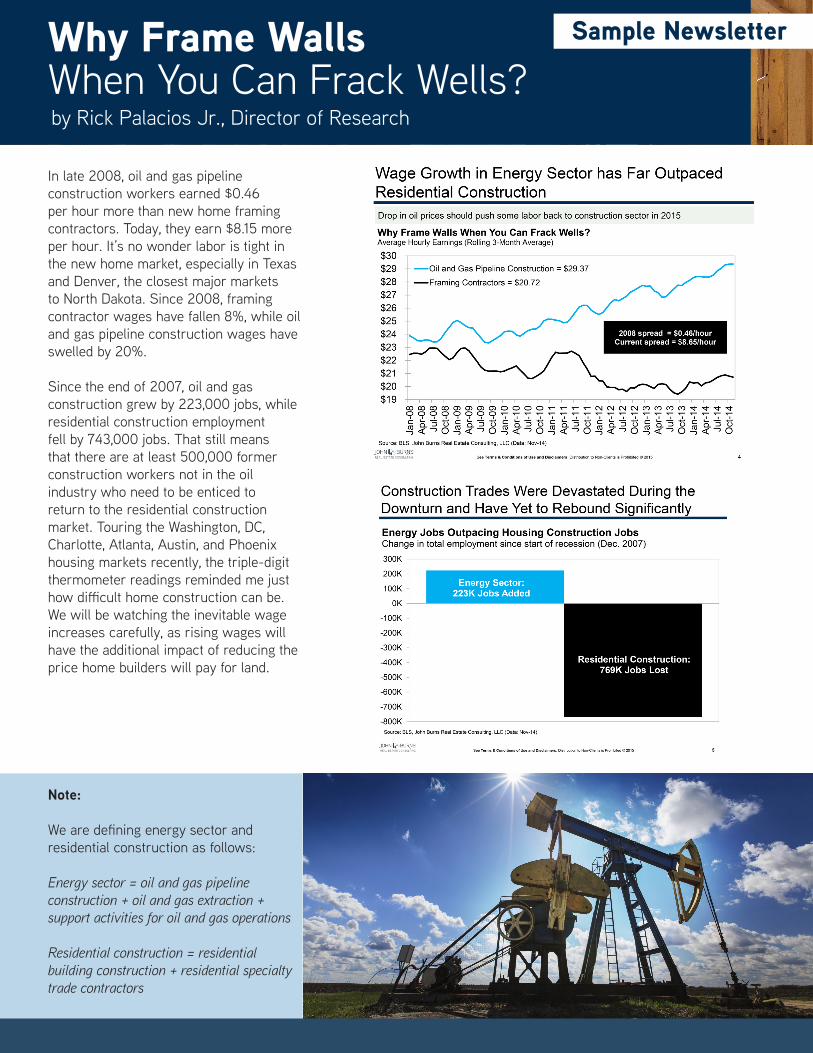
Why Frame Walls When You Can Frack Wells?by Rick Palacios Jr., Director of Research
In late 2008, oil and gas pipeline construction workers earned $0.46 per hour more than new home framing contractors. Today, they earn $8.15 more per hour. It’s no wonder labor is tight in the new home market, especially in Texas and Denver, the closest major markets to North Dakota. Since 2008, framing contractor wages have fallen 8%, while oil and gas pipeline construction wages have swelled by 20%.
Since the end of 2007, oil and gas construction grew by 223,000 jobs, while residential construction employment fell by 743,000 jobs. That still means that there are at least 500,000 former construction workers not in the oil industry who need to be enticed to return to the residential construction market. Touring the Washington, DC, Charlotte, Atlanta, Austin, and Phoenix housing markets recently, the triple-digit thermometer readings reminded me just howdifficulthomeconstructioncanbe.We will be watching the inevitable wage increases carefully, as rising wages will have the additional impact of reducing the price home builders will pay for land.
Sample Newsletter
Note:
Wearedefiningenergysectorandresidential construction as follows:
Energy sector = oil and gas pipeline construction + oil and gas extraction + support activities for oil and gas operations
Residential construction = residential building construction + residential specialty trade contractors
9
Sample Newsletter Delayed Marriage EqualsDelayed Homeownershipby Mollie Carmichael, Principal
Sample Newsletter
• Cohabitation has certainly been on the rise in recent decades, but homeownership rates for cohabitating couples are much lower than rates for married couples.
• The addition of children makes owning a home almost a necessity, given the need for yards, toys, education, and social circles.
• Children moving out often results in lifestyle changes,includingdifferentsocialcircles,homesize,andfloorplanneeds.Locationalpreferences also begin to shift.
Our Consumer Insights survey of 22,000+ new home shoppers, coupled with our Housing Demand Model by Lifestage and Price Point, shows just how much housing preferences have changed. These preferences can vary widely by geography and price point, and our team can help you make sense of how thesechangingdynamicsareaffectingyourmarket.
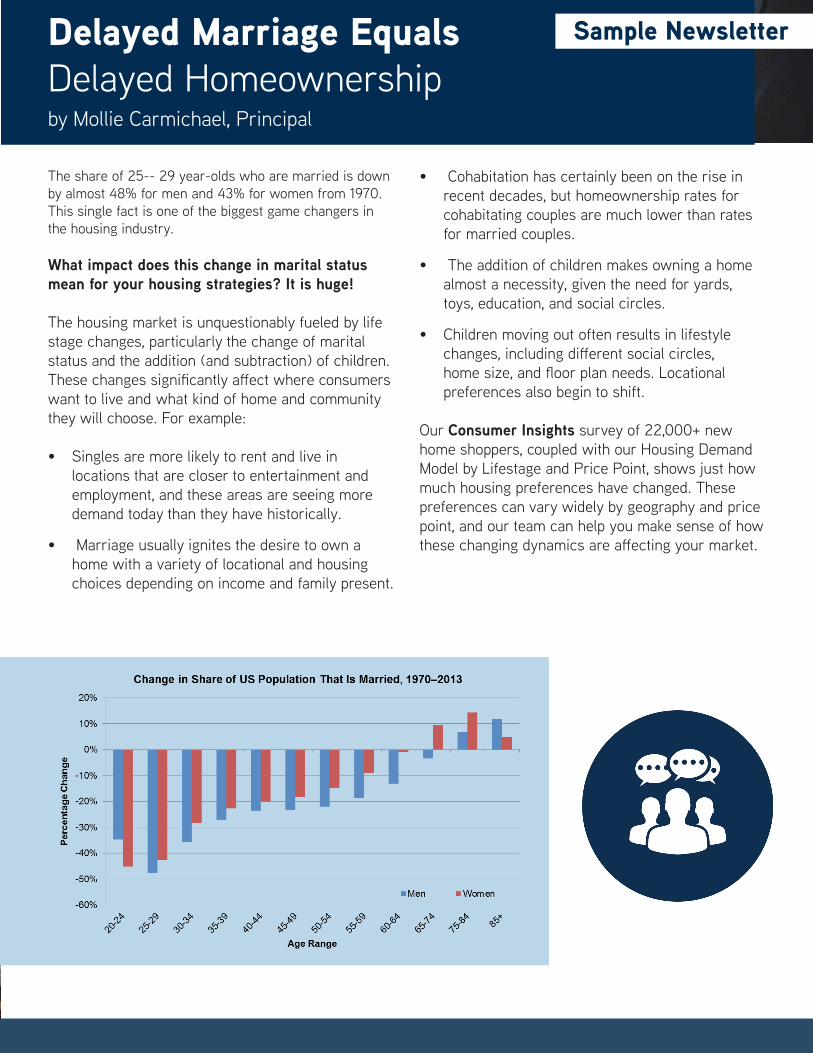
The share of 25-- 29 year-olds who are married is down by almost 48% for men and 43% for women from 1970. This single fact is one of the biggest game changers in the housing industry.
What impact does this change in marital status mean for your housing strategies? It is huge! The housing market is unquestionably fueled by life stage changes, particularly the change of marital status and the addition (and subtraction) of children. Thesechangessignificantlyaffectwhereconsumerswant to live and what kind of home and community they will choose. For example:
• Singles are more likely to rent and live in locations that are closer to entertainment and employment, and these areas are seeing more demand today than they have historically.
• Marriage usually ignites the desire to own a home with a variety of locational and housing choices depending on income and family present.
10
John Burns Real Estate Consulting (JBREC) helps executives make informed housing industry decisions. Our passionate team of analysts and consultants from around the country helps our clients identify the best risk-adjusted investment opportunities. We are known for:
About Us
• Client focus. Our clients have personal access to our team of market and industry experts. We also connect clients to opportunities for new business. We seek to continually innovate and improve our practices to make our clients’ lives easier.
• Speed. We focus exclusively on housing and strive to havethemostcurrentdataatourfingertips.Wearediligent,regularlyoutinthefield,andtappedintoindustryleaders—resulting in great research and advice.
• Proprietary tools. We have created many tools to provide unique and timely insight. They include a monthly survey of builder executives, several indices and forecasts, and a demand model by price range and household composition.
• Data quality. We create, collect and buy the best industry data available, enabling our analysts to evaluate market conditions clients apply that insight to their business planning.
• Local knowledge. Our executives live in 11 of the major housing markets across the country.
• Management expertise. Our team leaders have learned from multiple housing cycles.
• Trusted integrity. We do not recommend stock investments or take contingency fees so it is clear we have no conflictingagendas.
Quick StatsRegularly Quoted in:
Weekly Newsletter
27,000+subscribers
200K+followers
3,000+followers
Bloomberg Ticker JBRE
Top 50
11
John BurnsCEO
Pete Reeb
Dean Wehrli
Lesley Deutch
Lance Ramella
Mollie CarmichaelJody Kahn
Lisa Marquis JacksonBusiness Development
Don Walker
Paige Shipp
David Kalosis
Dan Fulton
Ken Perlman
Steve DutraData Management
Team
Client Resources
Our
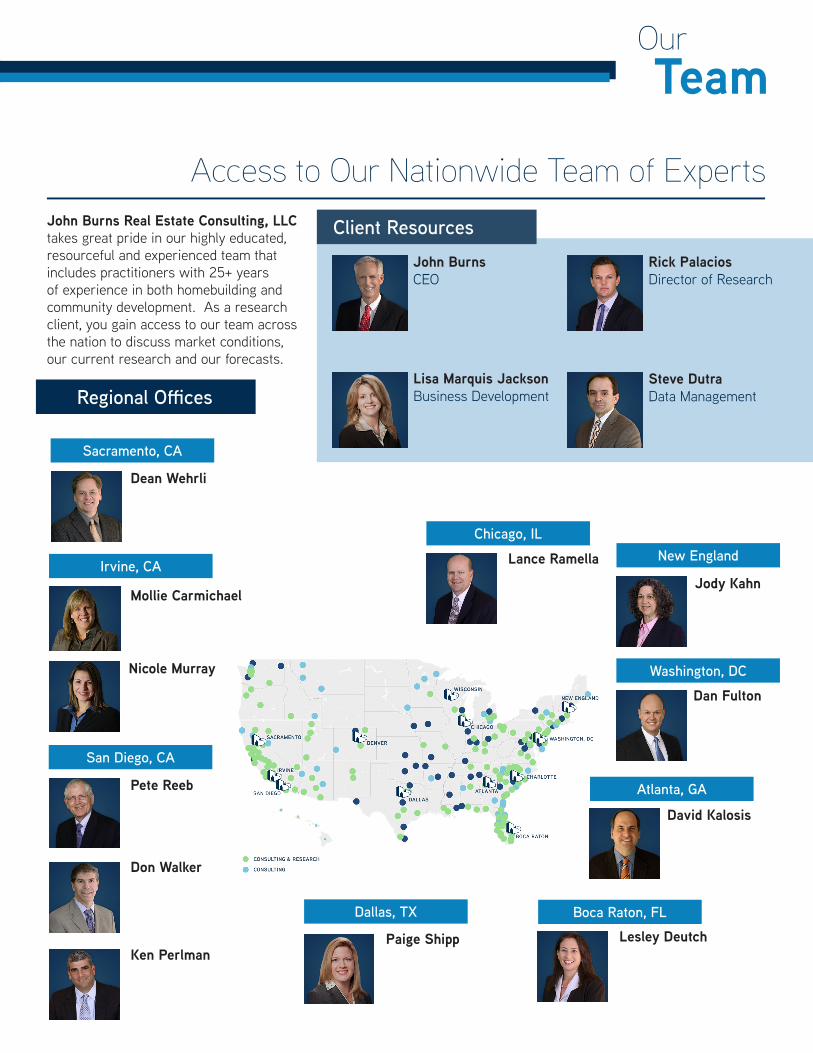
John Burns Real Estate Consulting, LLC takes great pride in our highly educated, resourceful and experienced team that includes practitioners with 25+ years of experience in both homebuilding and community development. As a research client, you gain access to our team across the nation to discuss market conditions, our current research and our forecasts.
Access to Our Nationwide Team of Experts
Rick PalaciosDirector of Research
Regional Offices
Sacramento, CA
Irvine, CA
San Diego, CA
Dallas, TX
Chicago, ILNew England
Washington, DC
Atlanta, GA
Boca Raton, FL
Nicole Murray
12
Research Services
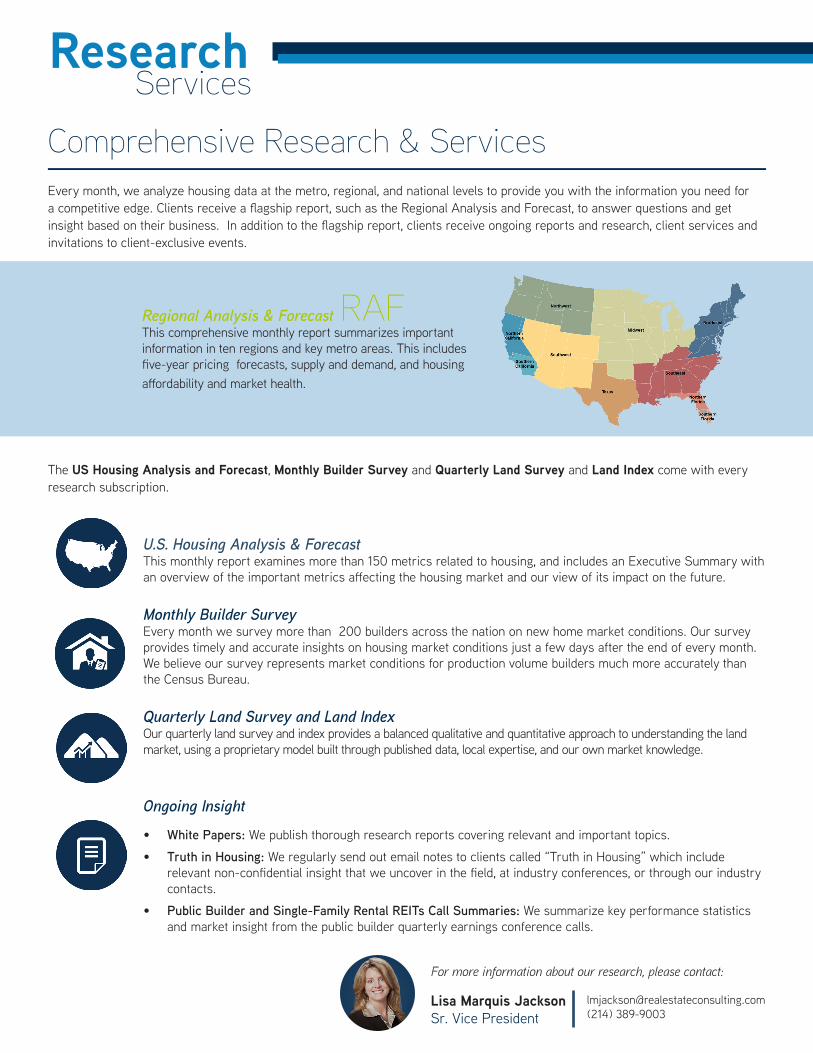
Regional Analysis & ForecastThis comprehensive monthly report summarizes important information in ten regions and key metro areas. This includes five-yearpricingforecasts,supplyanddemand,andhousingaffordabilityandmarkethealth.
RAF
Comprehensive Research & ServicesEvery month, we analyze housing data at the metro, regional, and national levels to provide you with the information you need for acompetitiveedge.Clientsreceiveaflagshipreport,suchastheRegionalAnalysisandForecast,toanswerquestionsandgetinsightbasedontheirbusiness.Inadditiontotheflagshipreport,clientsreceiveongoingreportsandresearch,clientservicesandinvitations to client-exclusive events.
U.S. Housing Analysis & ForecastThis monthly report examines more than 150 metrics related to housing, and includes an Executive Summary with anoverviewoftheimportantmetricsaffectingthehousingmarketandourviewofitsimpactonthefuture.
Monthly Builder Survey Every month we survey more than 200 builders across the nation on new home market conditions. Our survey provides timely and accurate insights on housing market conditions just a few days after the end of every month. We believe our survey represents market conditions for production volume builders much more accurately than the Census Bureau.
Quarterly Land Survey and Land IndexOur quarterly land survey and index provides a balanced qualitative and quantitative approach to understanding the land market, using a proprietary model built through published data, local expertise, and our own market knowledge.
Ongoing Insight
• White Papers: We publish thorough research reports covering relevant and important topics.
• Truth in Housing: We regularly send out email notes to clients called “Truth in Housing” which include relevantnon-confidentialinsightthatweuncoverinthefield,atindustryconferences,orthroughourindustrycontacts.
• Public Builder and Single-Family Rental REITs Call Summaries: We summarize key performance statistics and market insight from the public builder quarterly earnings conference calls.
The US Housing Analysis and Forecast, Monthly Builder Survey and Quarterly Land Survey and Land Index come with every research subscription.
Lisa Marquis JacksonSr. Vice President
For more information about our research, please contact:
[email protected](214) 389-9003
13
Metro Analysis & ForecastThis monthly report provides an overview of major housing and economic metrics, as well as our forecasts, at an MSA level. This is combined with local insight, proprietary surveys, and extensive data analysis to provide a complete picture of the important housing dynamics and shifts at the market level.
MAF
Home Builder Analysis & ForecastThis report examines each of the publicly traded home builders based on their geographic footprint, ranked by their forecasted market growth in mid, small and micro-cap. It also includes location comparisons of builders based on the builders’ market fundamentals and submarket desirability.
HBAF
Client Events
• Client-exclusive webinars. We sponsor webinars with Q&A that informs our clients of timely market dynamicsandoffersinsightonspecialtyareaslikeconsumerresearch.
•
•
Apartment Analysis & ForecastThis wide-ranging quarterly report includes an economic outlook for the multifamily market and analysis of theinterplaybetweenhousingandapartmentmarketdynamicsanddemographics.Includedarefive-yearapartmentrentforecasts,andrankingsoftopapartmentREITsbasedontheirregionaldiversificationandeconomic factors.
AAF
The SummitOur annual client-only conference, The Summit, gathers leaders across the housing industry for one and a half days of thought-provoking discussion and networking.
The Housing Market Outlook, our other annual client-only conference, is designed to be the industry’s most informative day of the year. This new conference will highlight insight from 50 speakers from every region and discipline of the housing industry.
HOUSING MARKET OUTLOOK
Otherflagshipreportsthatourteamproducesonamonthlyorquarterlybasisincludethefollowing:
Single-Family Rental Analysis & ForecastThis wide-ranging quarterly report includes an economic outlook for the multifamily market and analysis of theinterplaybetweenhousingandapartmentmarketdynamicsanddemographics.Includedarefive-yearapartmentrentforecasts,andrankingsoftopapartmentREITsbasedontheirregionaldiversificationandeconomic factors.
Client Services
• Executive Access. Personal access to our team of market experts and research analysts.
• Presentations. As requested, we meet with our clients and provide formal or informal industry or market-specificupdates.
• Introductions. Wehavehelpedmanyofourclientsfindabuilder,developer,orcapitalpartnerandwehaveintroducedmanyofourclientstospecificindustryexperts.
• Data Access. We collect, scrub, and analyze more than 1,000 data points each cycle. Our clients have access to reasonable and appropriate data exports from our team’s SQL database.

14
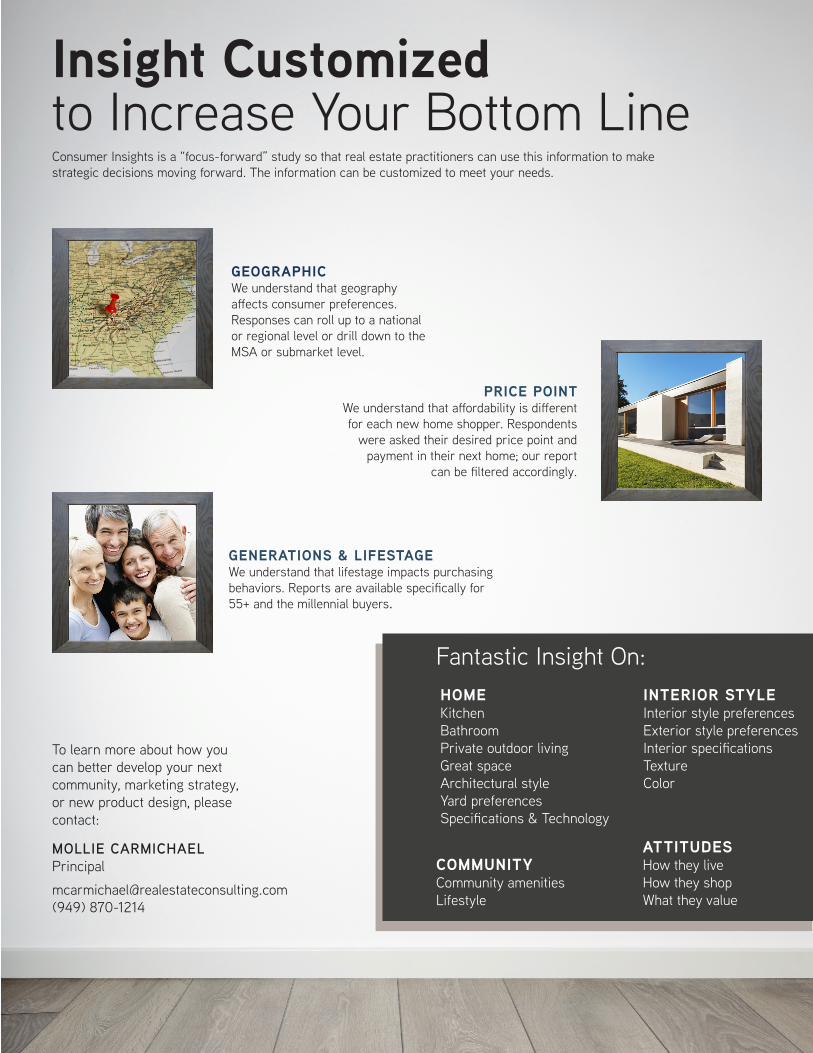
Consumer research in the real estate world is often overlooked because it is difficult and expensiveto conduct. However, understanding what home buyers value is critical, given the market climate and competitivefieldtoday.OurthirdannualConsumerInsights report couples our timely market research with qualitative findings from our proprietary“What Do You Call Home?” survey to provide better information on consumer marketing strategies for your communities.
What Do You Call Home?
E-MAIL SURVEYOur survey includes over 100 questions and several hundred variables regarding shoppers’ opinions on their next home and community.
PARTNERSBuilders, developers, and Zillow joined in the effortnationwidebysendingane-mailtotheir prospective shoppers.
NATIONWIDE SAMPLEOver 22,000 responses are collected across the nation annually. We have access to over 50,000 total responses in our past survey database.
ConsumerInsights
15
What Do You Call Home?
Insight Customized
GEOGRAPHICWe understand that geography affectsconsumerpreferences.Responses can roll up to a national or regional level or drill down to the MSA or submarket level.
PRICE POINTWeunderstandthataffordabilityisdifferentfor each new home shopper. Respondents
were asked their desired price point and payment in their next home; our report
canbefilteredaccordingly.
GENERATIONS & LIFESTAGEWe understand that lifestage impacts purchasing behaviors.Reportsareavailablespecificallyfor55+ and the millennial buyers.
Consumer Insights is a “focus-forward” study so that real estate practitioners can use this information to make strategic decisions moving forward. The information can be customized to meet your needs.
to Increase Your Bottom Line
HOMEKitchenBathroomPrivate outdoor livingGreat spaceArchitectural styleYard preferencesSpecifications&Technology
INTERIOR STYLEInterior style preferencesExterior style preferencesInteriorspecificationsTextureColor
COMMUNITYCommunity amenitiesLifestyle
ATTITUDESHow they liveHow they shopWhat they value
Fantastic Insight On:
To learn more about how you can better develop your next community, marketing strategy, or new product design, please contact:
MOLLIE CARMICHAELPrincipal
[email protected] (949) 870-1214
16
BoomersBorn 1946 to 1964
Gen XBorn 1965 to 1979
Gen YBorn 1980 to 2000
ConsumerInsights
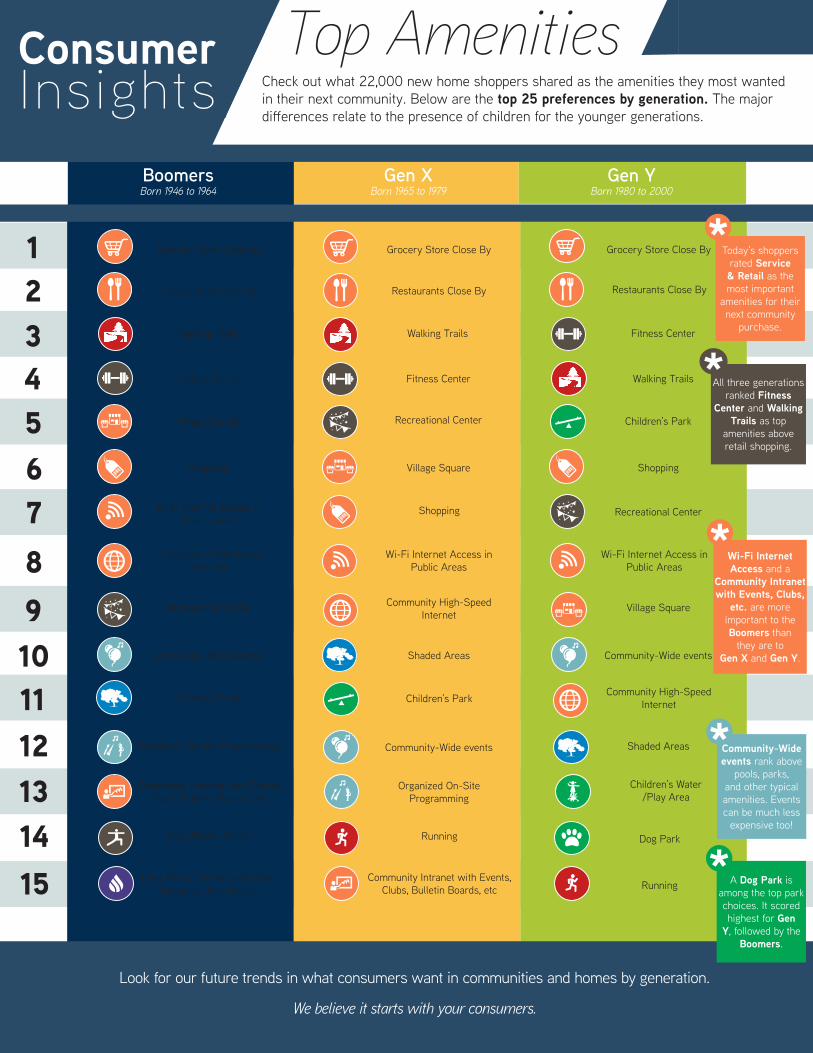
Top AmenitiesCheck out what 22,000 new home shoppers shared as the amenities they most wanted in their next community. Below are the top 25 preferences by generation. The major differencesrelatetothepresenceofchildrenfortheyoungergenerations.
23
Village Square Recreational Center Children’s Park
Grocery Store Close By Grocery Store Close ByGrocery Store Close By
Fitness CenterWalking Trails Walking Trails
Fitness Center Fitness Center Walking Trails
Restaurants Close By Restaurants Close ByRestaurants Close By
Organized On-Site Programming Shaded AreasCommunity-Wide events
Yoga/Pilates Studio Running Dog Park
RunningCommunity Intranet with Events,
Clubs, Bulletin Boards, etcLake, Pond, Stream, and Water
Elements, $50/Month
Organized On-Site Programming
Community Intranet with Events, Clubs, Bulletin Boards, etc
Children’s Water/Play Area
Community-Wide events Shaded Areas Community-Wide events
Shopping ShoppingVillage Square
Wi-Fi Internet Access in Public Areas
Shopping Recreational Center
Community High-Speed Internet
Recreational Center Village Square
Community High-Speed Internet
Wi-Fi Internet Access in Public Areas
Wi-Fi Internet Access in Public Areas
Shaded Areas Children’s Park Community High-Speed Internet
Look for our future trends in what consumers want in communities and homes by generation.
We believe it starts with your consumers.
Today’s shoppers rated Service & Retail as the most important
amenities for their next community
purchase.
*
All three generations ranked Fitness
Center and Walking Trails as top
amenities above retail shopping.
*
Community-Wide events rank above
pools, parks, and other typical amenities. Events can be much less
expensive too!
*
A Dog Park is among the top park choices. It scored highest for Gen
Y, followed by the Boomers.
*
Wi-Fi Internet Access and a
Community Intranet with Events, Clubs,
etc. are more important to the Boomers than
they are toGen X and Gen Y.
*
54
78
6
109
1112131415
1

17
BoomersBorn 1946 to 1964
Gen XBorn 1965 to 1979
Gen YBorn 1980 to 2000
Library Live Music in the Park Live Music in the Park
Cycling Movies in the ParkAdult-only Pool (18+)
Community Intranet with Events, Clubs, Bulletin Boards, etcAmphitheater Outdoors Dog Park
Art Shows in the Park Basketball Courts Lake, Pond, Stream, and Water Elements, $50/Month
Hiking Trails with Historical Markers of the Area
Lake, Pond, Stream, and Water Elements, $50/MonthOpen Space, $50/Month
WATER PARKSADVENTURE REC CENTERARTS &ENTERTAINMENTNATURE EVENTS SERVICE &
RETAILSPECIAL
AMENITIES
Let us help! Wecanhelpoptimizeyourcommunityandhomedesignforbetterhomes,betterplaces,andbetterprofit.
Please contact Mollie Carmichael at [email protected] or (949) 870-1214.
Events and experiences, as a whole, rank above “hard amenities”
like a pool.
*
Consumerresearchintherealestateworldisoftenoverlookedbecauseitisdifficultandexpensivetoconduct.However,understandingwhathomebuyersvalueiscritical,giventhemarketclimateandcompetitivefieldtoday.OurthirdannualConsumerInsightsreportcouplesourtimelymarketresearchwithqualitativefindingsfromourproprietary“What Do You Call Home?” survey to provide better information on consumer marketing strategies for your communities.
WWW.REALESTATECONSULTING.COM
Live Music in the Park Yoga/Pilates Studio Sport Fields
Hiking Trails with Historical Markers of the Area
Cycling Yoga/Pilates Studio
Dog Park Children’s Water/Play Area Tennis Courts
Organized On-Site ProgrammingTennis CourtsHiking Trails with Historical
Markers of the Area
Sport Fields Basketball CourtsRemote Guard Gate, $50/month
16171819202122232425

As a Senior Vice President, Nicole oversees our company’s research team, research products and marketing. In addition she manages custom consulting market research and special projects across the country. Her experience includes land acquisition, entitlement processing, product design, BRE processing, land development, onsite production, sales and marketing, escrow management, and business planning and projections.
Prior to her tenure as Vice President of Community Development for a privately held homebuilder, Nicole worked for the Burnham-Moores Center for Real Estate launching their Master of Science in Real Estate (MSRE). In 2011, Nicole wasselectedas“Top40Under40″byProfessional Builder Magazine for United States and Canada. She is a licensed Real Estate Broker and Contractor in the State of California.
She enjoys travel and is on quest to see 140 modern and ancient wonders of the world.
EDUCATIONM.B.A. from the University of San DiegoB.A. in Communications from the University of San Diego
NICOLE MURRAYSr. Vice President
(949) 870-1234 [email protected]
As a Vice President, Todd oversees our building product research and is an expert in building product market assessment and industry analytics.
Prior to joining John Burns Real Estate Consulting, Todd served as Manager of Economic & Industry Analytics at Kohler Co, responsible for all North American market modeling and quantitative market research measurement. Todd is the six-time winner of Most Accurate Category Forecaster from Chicago Federal Reserve, which peer group includes Wells Fargo, Caterpillar, Ford, GM, Macroeconomic Advisors, and more.
In his free time, Todd enjoys live music, good food, and is an avid chess player.
EducationB.A. in Mathematics from St. Norbert College
TODD TOMALAKVice President
(920) 373-6727 [email protected]

19
AsSeniorVicePresident,Lisaleadsthecompany’sstrategicresearchandbusinessdevelopmentefforts.Withover23 years of experience in housing research, she is a proven industry strategist with a demonstrated track record for driving growth and successfully creating solutions for complex business challenges and opportunities. Leveraging the strength of her network, experience and industry knowledge, Lisa is a driver of opportunity and has developed a reputation for being a dynamic and strategic business advisor.
Prior to joining John Burns Real Estate Consulting, Lisa was an award-winning business journalist providing in-depth newsandinterpretivecoverageofthehousingindustryfor18years—mostrecentlywithHanleyWoodpublications.Shealsogainedindustryexperienceasanaccountdirectorforaboutiquemarketingresearchfirm,creatingcustomresearch products for business-to-business clients.
Lisahasbeenwidelysourcedinmajormediaincludingthe Wall Street Journal, NPR, and CNBC.
In her free time, Lisa enjoys tending to her budding, urban farm.
EducationB.S. in Mass Communications from Illinois State University
LISA MARQUIS JACKSONSr. Vice President
(214) 389-9003 [email protected]
With more than 10 years of experience in residential real estate and economic research, Rick oversees all research pertaining to the single-family for sale/rent, multifamily and building product sectors.
Previously, Rick worked as an Equity Research Associate (homebuilders) at Morgan Stanley in New York. In addition, he spent several years as an Analyst at the Milken Institute, an economic think tank located in Santa Monica, California.
Rick is regularly quoted in local news publications as well as major outlets such as the Wall Street Journal, Bloomberg Businessweek, CNBC, CNN, MSNBC, and Professional Builder.In his free time Rick loves to travel.
EDUCATIONM.S. in Real Estate Economics and Finance from the London School of EconomicsB.A. from the University of California, Irvine
RICK PALACIOS JR.Director of Research
(949) 870-1244 [email protected]

2020 WWW.REALESTATECONSULTING.COM
IRVINE, CA9140 Irvine Center Drive | Suite 200Irvine, California 92618
DIR: (949) 870-1200
ATLANTA, GA12600 Deerfield Parkway | Suite 100Alpharetta, Georgia 30004
DIR: (770) 286-3493
CHICAGO, IL3108 State Route 59 | Suite 124-247Naperville, Illinois 60564
DIR: (630) 544-7826
BOCA RATON, FL1900 Glades Road | Suite 205Boca Raton, Florida 33431
DIR: (561) 998-5814
SAN DIEGO, CA4250 Executive Square | Suite 540La Jolla, California 92037
DIR: (858) 558-8384
WASHINGTON, DC11710 Plaza America Drive | Suite 2000Reston, Virginia 20190
DIR: (703) 447-7171
SACRAMENTO, CA7840 Madison Avenue | Suite 187Fair Oaks, California 95628
DIR: (949) 870-1200
NEW ENGLAND155 Fleet Street | Suite 11Portsmouth, New Hampshire 03801
DIR: (603) 235-5760
DALLAS, TX5220 Spring Valley Road | Suite 215Dallas, Texas 75254
DIR: (214) 389-9003
CHARLOTTE, NC9935-D Rea Road | Suite 273Charlotte, North Carolina 28277
DIR: (704) 989-1190
DENVER, CO1630-A 30th Street| Suite 475Boulder, Colorado 80301
DIR: (720) 328-1530
WISCONSINDIR: (920) 373-6727
REGIONAL OFFICE LOCATIONS
Top Related